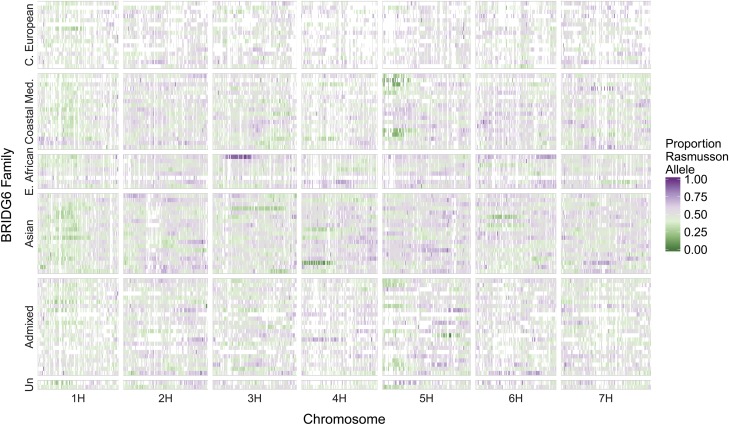
Figure 2.
Segregation distortion across 88 BRIDG6 families. Families (Y-axis) are sorted by donor parent subpopulation and then from earliest days to flowering (top) to latest days to flowering (bottom) of the donor parent within each subpopulation. The X-axis shows the seven barley chromosomes. Average frequency of the Rasmusson allele per family is calculated for each of 200 windows per chromosome. The estimation of the proportion of alleles from each parent was achieved by dividing the number of markers with a donor allele present in each RIL by the total number of SNPs in each window. Purple indicates the Rasmusson allele, green indicates the donor parent allele, and gray represents equilibrium, or allele frequency of 0.50. Markers not segregating within a family are represented in white. Analysis used an average of 2097 segregating SNPs per family.

