Figure 4.
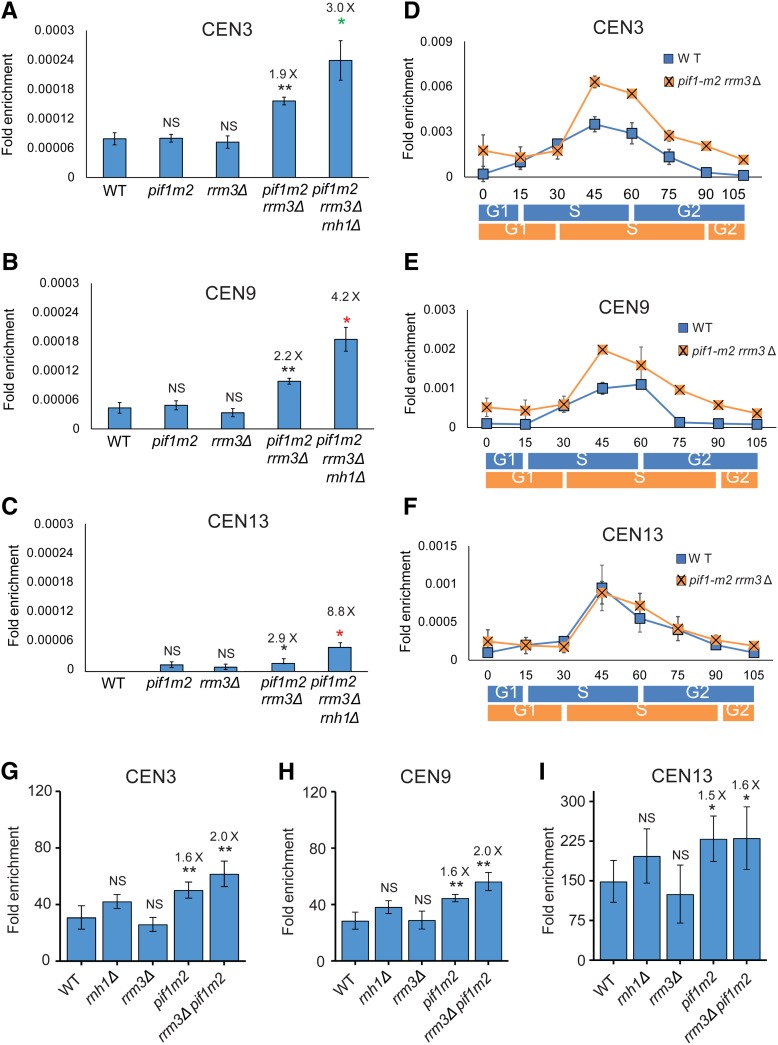
Cen-RNA abundance is increased in late S phase in cells lacking Pif1 and Rrm3. Cen-RNA levels were determined by RT-PCR in asynchronous cultures grown in YPD at 30° at (A) CEN3, (B) CEN9, and (C) CEN13 in WT and mutant strains (names of strains are under bars). The numbers above the bars indicate the fold differences in cen-RNA in mutants compared to WT cells. Black asterisks indicate P-values relative to WT. Red asterisks indicate P-values relative to pif1-m2 rrm3Δ. Green asterisks indicate P-values relative to rnh1Δ. (D–F) show cen-RNA levels in 24°-grown cells synchronized as described in Figure 1 legend at (D) CEN3, (E) CEN9, and (F) CEN13. The scales for the three panels are different. RNA levels in WT cells (blue square) and pif1-m2 rrm3Δ cells (orange square) are shown. The approximate timings of the cell cycle transitions for WT (blue rectangle) and pif1-m2 rrm3Δ (orange square) are indicated below the graphs as determined by FACs data (Figure S1A and Figure S2G). (G–I) show Cbf1-Myc binding in WT and mutant strains (names of strains are under bars). The numbers above the bars indicate the fold differences in Cbf1-Myc binding to mutant strains. cen-RNA, centromeric RNA; NS, not significant; WT, wild-type.

