

Abstract
Maternal infection during pregnancy may increase the risk of offspring neurodevelopmental disorders. The preclinical Polyinosinic-polycytidylic acid (PolyIC) model has become one of the most widely used approaches in maternal immune activation (MIA) research. However, variability in molecular weight may impact the immune activating potential of PolyIC. Nulliparous rats injected with high molecular weight PolyIC exhibit pronounced cytokine response and sickness behavior that was not observed in rats injected low molecular weight PolyIC. Although an essential next step is to extend these studies to pregnant animals, the preliminary results suggest that PolyIC molecular weight is an important experimental design consideration.
Keywords: Maternal immune activation, Polyinosinic-polycytidylic acid, PolyIC, Cytokine, Sickness behavior, Immune
1. Introduction
Exposure to a variety of viral and bacterial pathogens during pregnancy has been associated with an increased risk of neurodevelopmental or neuropsychiatric disorders in offspring, including schizophrenia (SZ) and autism spectrum disorder (ASD) (Patterson, 2009; Knuesel et al., 2014; Estes and McAllister, 2016). Maternal immune activation (MIA) studies in pregnant animals indicate that the maternal cytokine response plays a critical role in the subsequent changes in brain and behavioral development of offspring (Meyer, 2014; Boksa, 2010; Meyer et al., 2009; Piontkewitz et al., 2012). Although early MIA models used live viral or bacterial pathogens to stimulate the maternal immune system (Shi et al., 2003; Fatemi et al., 1998), more recent efforts have utilized specific immune-activating agents to induce maternal cytokine responses (Smith et al., 2007; Meyer et al., 2005). One of the most widely used agents in MIA model research is Polyinosinic-polycytidylic acid (PolyIC) (Meyer and Feldon, 2012; Reisinger et al., 2015). PolyIC is a synthetic analog of double stranded RNA, consisting of a chain of double stranded inosine (I) and cytidine (C), which is detected by toll-like receptor 3 (TLR-3) (Medzhitov, 2001). Stimulation of these receptors leads to a potent immune response characterized by the production of inflammatory cytokines such as IL-1β, IL-6, TNFα as well as interferons (Alexopoulou et al., 2001; Takeuchi and Akira, 2009). During pregnancy, many of these cytokines may cross the placenta and potentially alter neurodevelopment by acting directly on the developing fetus or by indirectly altering placental endocrine or immune function (Deverman and Patterson, 2009; Hsiao and Patterson, 2011; Dahlgren et al., 2006; Zaretsky et al., 2004). The MIA model thus provides an experimental system to explore mechanistic links between changes in the maternal-fetal immune environment, altered fetal brain development and emergence of atypical offspring behavior (Carpentier et al., 2013; Lombardo et al., 2018; Arrode-Bruses and Bruses, 2012; O'Loughlin et al., 2017).
The PolyIC MIA model is used extensively in both mice (Meyer et al., 2006a; Mandal et al., 2011; Hsiao et al., 2013; Malkova et al., 2012) and rats (Zhang et al., 2012; Dickerson et al., 2010; Zuckerman et al., 2003; Crum et al., 2017), and has recently been adapted for studies in nonhuman primates (Weir et al., 2015; Bauman et al., 2014; Machado et al., 2015; Rose et al., 2017). In spite of the strong interest in the PolyIC MIA model, methodological variability has yielded inconsistent results, making it increasingly challenging to replicate outcomes and translate results. Given that preclinical research is under increasing pressure to improve reproducibility (Collins and Tabak, 2014; Landis et al., 2012), the MIA model will undoubtedly benefit from a renewed interest in refining experimental design standards (Kilkenny et al., 2010). However, variability in PolyIC dose, route of administration, number of injections and gestational timing influences offspring outcomes and makes comparisons across studies challenging (Careaga et al., 2017). This, in turn, may have masked a major underlying issue with the MIA model. Specifically, despite the fact that PolyIC is a synthetic analog, variations in its manufacture can have significant effects on its ability to drive an immune response. These concerns stem from in vitro data demonstrating that PolyIC length varies among manufactures (Mian et al., 2013) and that this variability may affect the magnitude of immune responses (Zhou et al., 2013). This may explain the observation that three batches of PolyIC from the same vendor had significantly different abilities to induce an immune response (Harvey and Boksa, 2012). Collectively, these studies indicate that variability in PolyIC is emerging as a fundamental concern for the MIA model, which warrants further in vivo characterization.
As an initial step in addressing PolyIC variability, we carried out a comparison of cytokine and sickness responses to two different molecular weights of PolyIC using the laboratory rat as an experimental system. Unlike the more varied approaches utilized in PolyIC-induced mouse MIA models, the majority of rat MIA models have used a similar paradigm consisting of a 4 mg/kg single IV injection of PolyIC on gestational day (GD) 15 (Crum et al., 2017; Piontkewitz et al., 2011; Vernon et al., 2015; Wolff et al., 2011; Yee et al., 2012). Here we build upon previous rat PolyIC dosing studies (Fortier et al., 2007; Missault et al., 2014) and sickness behavior evaluations (Vorhees et al., 2012) by directly comparing 4 mg/kg IV injections of the high-molecular-weight (HMW) versus low-molecular-weight (LMW) PolyIC. Although previous rat MIA models have utilized these forms of PolyIC (Ballendine et al., 2015; Howland et al., 2012), we are unaware of any direct comparison between LMW-PolyIC and HMW-PolyIC. Thus, the goal of the present study was to evaluate the effects of different lengths of PolyIC on cytokine production and subsequent sickness behaviors and to determine if the results of previous in vitro cellular studies are reflected in vivo. Because these initial studies were carried out in nulliparous rats, an essential next step is to evaluate HMW- versus LMW-PolyIC in pregnant animals. While these experiments are underway, here we present the preliminary findings from nulliparous rats to highlight a methodological issue that has broad experimental design implications for the entire MIA model field.
2. Methods
All procedures were performed with approval by the University of California, Davis Institutional Animal Care and Use Committee and in accordance with the guidelines provided by the National Institutes of Health for the scientific treatment of animals. Data are available upon request.
2.1. Animals
Female Sprague-Dawley rats (Harlan Sprague-Dawley, Inc., Indianapolis, IN), 8 weeks old, were maintained by the Teaching and Research Animal Care Services (TRACS), at University of California, Davis. All rats were housed in pairs in a temperature and humidity controlled vivarium and maintained at ambient room temperature of 22.9 °C and 53% humidity on a 12-h light/dark cycle (light on at 06:00). Standard home cage housing consisted of polypropylene Individually Ventilated Cage (IVC) housing systems from Lab Products measuring 30.5 cm × 35.6 cm × 20.3 cm with a high top wire lids, cob bedding, and nesting. Sentinel animals that are maximally exposed to all other animals in the vivarium are part of a comprehensive health-monitoring program employed to detect infections that may be present within the colony. Food and water were provided ad libitum throughout the study. Rats were allowed to habituate to the vivarium after arriving from Harlan laboratories for a minimum of two weeks before any procedures were performed.
2.2. CLAMS
CLAMS (Comprehensive Lab Animal Monitoring System) is a system of metabolic cages that allows for simultaneous measurement of numerous metabolic parameters including oxygen consumption, carbon dioxide production, food consumption, locomotor activity levels etc. The room housing the CLAMS was maintained at 24 °C and 55% humidity. The cages are enclosed in a light- and temperature-controlled environment, enabling the user to collect data at varied ambient temperatures. The environment in the CLAMS was maintained at 24 °C on a 12-h light/dark cycle (light on at 06:00). Food and water were provided ad libitum. Water, food, O2 consumption and CO2 production and activity were monitored for 24 h before and for 24 h after Poly IC or vehicle injection. Data were recorded from the animals immediately after they were placed back into the CLAMS after injections.
2.3. Immune activation
Twenty-four hours before injections, rats were housed in the CLAMS chambers to allow them to habituate to the housing environment. After habituation, rats were removed one at a time from the CLAMS and randomized into three groups for tail vein injection (4 mg/kg, I.V.) with either low (0.2–1 kb) molecular weight Polyinosinic-polycytidylic acid (LMW-PolyIC), high (1.5–8 kb) molecular weight (HMW-PolyIC) Polyinosinic-polycytidylic acid (InvivoGen, San Diego, CA) or 0.9% saline vehicle (General Laboratory Products, Yorkville, IL). Although the majority of MIA models utilize PolyIC from Sigma, we selected InvivoGen which characterizes molecular weight and utilizes TLR2 and TLR4 cellular assays to confirm the absence of microbial contaminants (e.g. endotoxin or bacterial-membrane components). Injections for both HMW- and LMW-PolyIC were prepared using vials from the same respective lots following product sheet instructions: LMW-PolyIC was prepared by adding sterile endotoxin free 0.9% saline to the desired concentration and mixed gently for 10 min before being aliquoted and frozen at –80C. HMW-PolyIC was prepared by adding sterile endotoxin free 0.9% saline to the desired concentration and the heating the mixture for 10 min at 65–70 °C. The solution was then allowed to cool for 1 h at room temperature to ensure proper annealing before it was aliquoted and frozen at –80C until needed for injections. Rats were briefly restrained without anesthesia during the tail vein injections. Temperature at the time of injection was taken rectally and recorded. Immediately after injections, rats were returned to the CLAMS. The three treatment groups were: Saline (n = 12), PolyIC-LMW (n = 12), and PolyIC-HMW (n = 12). As described on the manufacurer's web site, “LMW-PolyIC comprises short strands of inosine poly(I) homopolymer annealed to strands of cytidine poly(C) homopolymer. The average size of LMW-PolyIC is from 0.2 kb to 1 kb. HMW-PolyIC comprises long strands of inosine poly(I) homopolymer annealed to strands of cytidine poly(C) homopolymer. The average size of HMW-PolyIC is from 1.5 kb to 8 kb.” Neither HMW- or LMW-PolyIC was further screened for endotoxins as both products are tested in TLR2 and TLR4 cellular assays to confirm the absence of microbial contaminants (e.g. endotoxin or bacterial-membrane components).
2.4. Blood collection
Blood was collected from rats at three time points; 3, 4.5, and 6 h post injection. Rats were individually removed from the CLAMS and restrained without anesthesia while 100 μL of blood was collected from the tail vein using a 26 g needle. Temperature was taken rectally and recorded immediately prior to blood collection. Blood collections were typically completed within 5 min. Blood was allowed to clot for at least one hour and then centrifuged at l000g for 10 min. Serum was collected and stored at −80 °C until analyzed for cytokine levels. The 4.5 h time point samples were archived for future comparisons with samples collected from pregnant rats following PolyIC injections, thus only the 3 h and 6 h time points are included in the present study.
2.5. Cytokine analysis
The levels of serum cytokines IL-1β, IL1-α, IL-2, IL-4, IL-5, IL-6, IL-10, IL-12, IL-13, IL-17, GM-CSF, IFN-γ, and TNFα were determined using rat multiplexing bead immunoassays (Bio-Rad Laboratories, Hercules, CA). Samples were run in duplicate per manufacturer specifications. All samples were diluted 1:4 in sample diluent provided by the manufacturer. 50 μL of diluted serum was incubated with antibody-coupled beads. After a series of washes, a biotinylated detection antibody was added to the beads, and the reaction mixture was detected by the addition of streptavidin-phycoerythrin. The bead sets were analyzed using a flow-based Luminex™ 100 suspension array system (Bio-Plex 200; Bio-Rad Laboratories). Unknown sample cytokine concentrations were calculated by Bio-Plex Manager software using a standard curve derived from the known reference cytokine concentrations supplied by the manufacturer. A five-parameter model was used to calculate final concentrations. Concentrations obtained below the sensitivity limit of detection (LOD) were calculated as LOD/2 for statistical comparisons. Supernatant aliquots were free of any previous freeze/ thaw cycles. Only 2% of the samples exceeded the 15% CV variance allowance and were subsequently re-analyzed.
2.6. Statistical analysis
For each cytokine, a linear mixed effect model was used to evaluate the effect of treatment group, time and the interaction between these two factors. A random mouse effect was included to account for correlation of measurements between the two points. Models were fit using Proc Glimmix in SAS Software version 9.4. The interaction term was dropped if it was not significant, and a main effects only model used. For the main effects only models, if treatment group was a significant factor, post-hoc comparisons were conducted to determine if mean cytokine levels in the LMW and HMW groups differed significantly from the Saline group. If there was a significant interaction between treatment group and time, the following post-hoc comparisons were conducted: HMW vs. Saline at hour 3; HMW vs. Saline and hour 6; LMW vs. Saline at hour 3; LMW vs Saline at hour 6; Change in the difference between HMW and Saline from hour 3 to hour 6; Change in the difference between LMW and Saline from hour 3 to hour 6. The first four comparisons evaluate whether mean cytokine levels in each of the treatment groups differ from the Saline group at each time point. The last two comparisons evaluate whether there was a change in the differences between the each treatment group and the saline group over time. Adjusted p-values and confidence intervals for the post-hoc comparisons to control the type I error rate for the analysis of each cytokine at 0.05 were computed through simulations as provided for in Proc Glimmix. Five cytokines (IFN-γ, IL-1a, IL-1b, IL-6, TNFα) were log transformed to meet model assumptions of normality and homogeneity of variances.
3. Results
3.1. Cytokine differences across groups
For all cytokines, mean levels differed significantly among treatment groups and between the two time points (Table 1). However, there was a significant interaction between treatment group and time for only four of the cytokines: IL-6 (Fig. 1), IFN-γ, IL-1B, and TNFα (Fig. 2). For IL-6, post-hoc comparisons showed that mean levels in the HMW group were significantly larger than the saline group at both hour 3 (t32 = 6.93, adj. p ≤ 0.0001) and hour 6 (t32 = 10.68, adj. p ≤ 0.0001), but were not statistically significantly different between the LMW and saline groups at either time point. Likewise for IFN-γ, post-hoc comparisons showed that mean levels in the HMW group were significantly larger than the saline group at both hour 3 (t32 = 4.37, adj. p = 0.0006) and hour 6 (t32 = 6.43, adj. p ≤ 0.0001), but were not statistically significantly different between the LMW and saline groups at either time point. For both cytokines, the difference between the HMW group and the saline group increased from hour 6 relative to hour 3 but this difference was only statistically significant for IL-6 (t32 = −4.57, adj. p = 0.003). Based on the post-hoc comparisons, TNFα differed significantly between HMW and saline groups at 3 h (t32 = 11.93, adj. p ≤ 0.0001) and 6 h time points (t32 = 6.93, adj. p ≤ 0.0001), as did IL-1B for 3 h (t32 = 12.09, adj. p ≤ 0.0001) and 6 h (t32 = 7.80, adj. p ≤ 0.0001) time points. LMW had significantly different mean levels of TNFα at 3 h (t32 = 6.93, adj. p ≤ 0.0001) and IL-1B at hour 3 (t32 = 7.60, adj. p ≤ 0.0001) compared to saline controls. These differences between LMW and saline groups were no longer significant at the 6 h time point. Both HMW and LMW treatment groups showed a significant change in the difference in mean TNFα (t32 = 5.75, adj. p < 0.0001, t32 = 7.37, adj. p < 0.0001, respectively) and IL-1B levels (t32 = 4.69, adj. p = 0.0005, t32 = 4.39, adj. p = 0.0011, respectively) between the treatment and saline groups over time. In both treatment groups, the difference declined significantly from hour 3 to hour 6. For the remaining cytokines, with the exception of GM-CSF, mean levels differed significantly between HMW and saline but not between LMW and saline (Supplemental Tables). For GM-CSF neither HMW nor LMW differed from saline. Means of cytokines are summarized at 3 h (Table 2) and 6 h (Table 3) post injection and post hoc comparisons presented in Supplemental Materials.
Table 1.
Results of evaluation of effect of treatment group, time and the interaction between group and time on cytokine levels.
| Cytokine | Group | Time | Interaction |
|---|---|---|---|
| GM-CSF | F2,33 = 3.75 | F1,34 = 17.75 | F2,32 = 1.82 |
| p = 0.034 | p = 0.0002 | p = 0.178 | |
| IFN-γ | F2,33 = 22.76 | F1,32 = 97.24 | F2,32 = 3.65 |
| p < 0.0001 | p < 0.0001 | p = 0.0374 | |
| IL-lα | F2,33 =11.84 | F1,32 = 9.89 | F2,33 = 1.28 |
| p = 0.0001 | p = 0.0034 | p = 0.291 | |
| IL-1β | F2,33 = 65.13 | F1,32 = 11.77 | F2,33 = 13.86 |
| p < 0.0001 | p = 0.0017 | p < 0.0001 | |
| IL-4 | F2,33 = 6.61 | F1,32 = 34.86 F | F2,33 = 0.75 |
| p = 0.0039 | p < 0.0001 | p = 0.48 | |
| IL-6 | F2,33 = 49.04 | F1,32 = 146.21 | F2,33 = 15.05 |
| p < 0.0001 | p < 0.0001 | p < 0.0001 | |
| IL-10 | F2,33 = 9.99 | F1,32 = 59.14 | F2,33 = 0.06 |
| p = 0.0004 | p < 0.0001 | p = 0.941 | |
| IL-17 | F2,33 = 8.62 | F1,32 = 13.75 | F2,33 = 1.62 |
| p = 0.001 | p = 0.0007 | p = 0.214 | |
| TNFα | F2,33 = 55.84 | F1,32 = 0.08 | F2,33 = 30.14 |
| p < 0.0001 | p = 0.781 | p < 0.0001 | |
| IL-2 | F2,33 = 8.84 | F1,32 = 28.16 | F2,33 = 2.50 |
| p = 0.001 | p < 0.0001 | p = 0.098 | |
| IL-5 | F2,33 = 4.34 | F1,32 = 30.87 | F2,33 = 1.22 |
| p = 0.021 | p < 0.0001 | p = 0.308 | |
| IL-12 | F2,33 = 4.94 | F1,32 = 13.95 | F2,33 = 1.08 |
| p = 0.0133 | p = 0.0007 | p = 0.352 | |
| IL-13 | F2,33 = 9.44 | F1,32 = 28.41 | F2,33 = 0.11 |
| p = 0.0006 | p < 0.0001 | p = 0.893 |
Fig. 1.
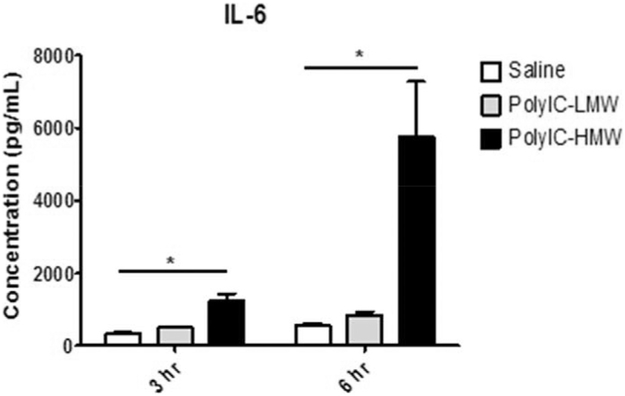
IL-6 Response following PolyIC Injection. Only animals that received HMW-PolyIC demonstrate elevated IL-6 levels compared to saline controls 3 h and 6 h after the injection. * P < 0.05.
Fig. 2.

Expanded cytokine profiles of TNFα, IFN-γ, IL-1β, at 3 h and 6 h post PolyIC injection. (A) At 3 h post injection animals that received either LMW- or HMW-PolyIC demonstrated elevated TNFα levels compared to saline controls. The HMW-PolyIC injected animals continue to demonstrate higher TNFα levels than controls 6 h post injection. (B) For IFN-γ, only the HMW-injected animals differed from controls at both 3 h and 6 h post injection. (C) At 3 h and 6 h post injection animals that received HMW-PolyIC demonstrated elevated IL-1β levels compared to saline controls. LMW-PolyIC injected animals differed from controls at 3 h, but not 6 h post injection.
Table 2.
Means ± SD of cytokines 3 h post injection by treatment group.
| Cytokine | Saline (pg/ml) | HMW (pg/ml) | LMW (pg/ml) |
|---|---|---|---|
| GM-CSF | 178.74 ± 59 | 260.49 ± 59 | 162.63 ± 59 |
| IFN-γ | 359.52 ± 115 | 714.58 ± 115 | 356.54 ± 115 |
| IL-lα | 230.63 ± 128 | 378.56 ± 128 | 201.25 ± 128 |
| IL-1β | 235.01 ± 82 | 1141.78 ± 82 | 471.95 ± 82 |
| IL-4 | 40.34 ± 13 | 62.84 ± 13 | 39.86 ± 13 |
| IL-6 | 331.35 ± 142 | 1348.14 ± 142 | 503.34 ± 142 |
| IL-10 | 1235.56 ± 279 | 1842.25 ± 279 | 1308.96 ± 279 |
| IL-17 | 56.21 ± 16 | 85.25 ± 16 | 53.95 ± 16 |
| TNFα | 146.8 ± 48 | 1055.95 ± 48 | 497.31 ± 48 |
| IL-2 | 271.56 ± 62 | 420.81 ± 62 | 259.93 ± 62 |
| IL-5 | 473.55 ± 67 | 567.7 ± 67 | 461.55 ± 67 |
| IL-12 | 127.75 ± 34 | 193.67 ± 34 | 126.9 ± 34 |
| IL-13 | 71.91 ± 27 | 119.92 ± 27 | 71.64 ± 27 |
Table 3.
Means ± SD of cytokines 6 h post injection by treatment group.
| Cytokine | Saline (pg/ml) | HMW (pg/ml) | LMW (pg/ml) |
|---|---|---|---|
| GM-CSF | 286.46 ± 78 | 290.99 ± 78 | 249.25 ± 78 |
| IFN-γ | 529.54 ± 155 | 1473.26 ± 155 | 543.26 ± 155 |
| IL-lα | 291.21 ± 51 | 388.99 ± 51 | 292.22 ± 51 |
| IL-1β | 387.09 ± 101 | 1049.5 ± 101 | 475.59 ± 101 |
| IL-4 | 63.99 ± 18 | 78.08 ± 18 | 64.59 ± 18 |
| IL-6 | 569.59 ± 212 | 5758.68 ± 212 | 857.12 ± 212 |
| IL-10 | 1988.2 ± 467 | 2635.18 ± 467 | 2007.58 ± 467 |
| IL-17 | 75.7 ± 17 | 89.96 ± 17 | 72.72 ± 17 |
| TNFα | 267.81 ± 84 | 837.56 ± 84 | 333.26 ± 84 |
| IL-2 | 402.11 ± 74 | 464.27 ± 74 | 383.96 ± 74 |
| IL-5 | 597.741 ± 60 | 629.38 ± 60 | 577.33 ± 60 |
| IL-12 | 187.41 ± 51 | 215.11 ± 51 | 186.5 ± 51 |
| IL-13 | 118.95 ± 36 | 158.25 ± 36 | 116.35 ± 36 |
3.2. Sickness behavior differences across groups
Sickness behavior is a coordinated set of adaptive behavioral changes that develop in individuals during the course of an infection (Dantzer, 2006). It is characterized by fever, lethargy, loss of appetite, as well as a myriad of other behavioral changes summarized in Table 4. Only animals that received HMW-PolyIC demonstrated weight loss, changes in O2 consumption/CO2 production and reduced feeding and drinking behaviors compared to saline injected animals (Fig. 3). Animals that received LMW-PolyIC did not differ from controls. Measures of core body temperature and activity did not differ among the three treatment groups.
Table 4.
Sickness behavior following HMW-Poly versus LMW-PolyIC.
| Sickness measure | Treatment effect | Post Hoc |
|---|---|---|
| Weight change | F(2,32)= 15.86; p < 0.001 | HMW > saline (p < 0.001) LMW = saline (p = 0.898) |
| Temp (3h) | F (2,32)= 2.60; p = 0.09 | - |
| Temp (4.5 h) | F (2,32)= 0.72; p = 0.50 | - |
| Temp (6h) | F (2,32)= 2.32; p = 0.13 | - |
| co2 | F(2,32)= 17.82; p < 0.001 | HMW < saline (p < 0.001) LMW = saline (p = 0.446) |
| O2 | F(2,32)= 18.37; p < 0.001 | HMW < saline (p < 0.001) LMW = saline (p = 0.945) |
| Feed | F(2,32)= 15.05; p < 0.001 | HMW < saline (p < 0.001) LMW = saline (p = 0.130) |
| Water | F(2,32)= 3.89; p = 0.03 | HMW < saline (p = 0.019) LMW = saline (p = 0.135) |
| Ambulation | F (2,32)= 1.47; p = 0.24 | - |
Fig. 3.

Rat receiving LMW-PolyIC showed no significant differences compared with rats receiving saline alone. However, rats receiving HMW-PolyIC showed significant differences in (A) weight loss (B) CO2 production, (C) O2 consumption, (D) Food intake and (D) Water intake compared with rats receiving saline. * P < 0.05.
4. Discussion
The maternal immune activation (MIA) model provides a powerful translational tool to explore the effects of prenatal immune challenge on the developing fetus. Mice, rat and nonhuman primate offspring born to MIA treated dams demonstrate significant alterations in brain and behavior development, which parallel features of human neurodevelopmental disorders (for reviews, (Patterson, 2009; Knuesel et al., 2014; Estes and McAllister, 2016; Meyer, 2014; Boksa, 2010; Meyer et al., 2009; Piontkewitz et al., 2012)). However, variability in the immune activating agents, such as PolyIC, commonly used to stimulate the maternal cytokine response, is emerging as a fundamental concern with the MIA model (Kentner et al., n.d.). Here we report that PolyIC of varying molecular weights can induce significantly different cytokine responses and sickness behaviors in vivo. Although this initial step in addressing PolyIC variability was carried out in nulliparous animals, these novel findings have implications for the MIA model methodology and suggest an immediate need to: (i) report molecular weight of PolyIC in methods, (ii) validate immune activating agents prior to producing MIA-exposed offspring and (iii) report cytokine or sickness behavior data as an index of the maternal immune response.
The need for a more consistent MIA model is paramount, and in order to obtain such a model, certain limitations within the current paradigm need to be recognized and addressed. The two most commonly used immune activating agents, lipopolysaccharide (LPS) and PolyIC, present unique challenges. For example, the methods used for LPS extraction and purification make it inherently difficult to produce in a consistent or specific fashion (Ray et al., 1991). Many investigators instead choose to use the PolyIC model because it is synthetic in nature and therefore theoretically would avoid or minimize many of the shortcomings of LPS. However, despite its synthetic nature, PolyIC also varies substantially in its ability to stimulate an immune response depending on molecular length (Mian et al., 2013; Zhou et al., 2013). As most vendors do not regulate the molecular length, PolyIC can differ substantially from vendor to vendor, as well as between batches from the same vendors, with different lots having dramatically different immunological properties (Harvey and Boksa, 2012). In the present study, we demonstrated that PolyIC from the same supplier, and at the same dose, but of two different molecule weights lead to strikingly different immune responses and sickness behaviors in female rats.
MIA models have focused on changes in maternal IL-6 as a key cytokine associated with brain and behavioral impairments in offspring (Smith et al., 2007), though emerging evidence highlights a potential role for other cytokines, including IL-17 (Choi et al., 2016; Murray et al., 2015). We therefore utilized an expanded cytokine panel to evaluate serum cytokine levels of IL-1β, IL1-α, IL-2, IL-4, IL-5, IL-6, IL-10, IL-12, IL-13, IL-17, GM-CSF, IFN-γ, and TNFα following injections of HMW- or LMW-PolyIC (Table 1). Significant interactions between treatment group and time were found for IL-6, TNFα, IL-1β and IFN-γ. For both IL-6 (Fig. 1) and IFN-γ (Fig. 2), HMW-PolyIC injected animals demonstrated significantly higher levels compared to saline controls at both 3 h and 6 h post injection. Although the IL-6 and IFN-γ levels for the LMW-PolyIC injected animals were also higher than controls, these differences were not significant at either time point. TNFα and IL-1β (Fig. 2) differed significantly between HMW-PolyIC injected animals and controls at both time points, though LMW-PolyIC injected animals only differed from controls at 3 h, but not 6 h post injection. For the remaining cytokines that did not demonstrate a significant interaction between treatment group and time, mean levels differed significantly between HMW-PolyIC injected animals and controls but not between LMW-PolyIC injected animals and controls for all cytokines except GM-CSF (Tables 2,3; Supplemental Material).
Here we focus specifically on the molecular weight of PolyIC as one factor contributing to variability in the MIA model, but readily acknowledge that there are many other factors to take into consideration. Although exposure to HMW- versus LMW-PolyIC resulted in dramatically different immune responses and subsequent sickness behaviors, at this point we do not know what impact this may have on the MIA model. Indeed, numerous MIA models that have used uncharacterized or LMW-PolyIC have yielded offspring with changes in brain and behavioral development (for reviews, (Meyer, 2014; Boksa, 2010; Meyer et al., 2009; Piontkewitz et al., 2012)). At present, it is not clear which maternal cytokines or what magnitude of cytokine change is causally associated with the cascade of altered brain and behavioral development described in previous MIA models (Konefal and Stellwagen, 2017). For example, a recent study found that vitamin D treatment during pregnancy eliminates behavior impairments in MIA-exposed mouse offspring, but surprisingly does not alter pro-inflammatory cytokine levels in dams or in fetal brains (Vuillermot et al., 2017). To further complicate comparisons across studies, doses of PolyIC in mouse MIA models typically range from 1 mg/kg to 20 mg/kg, which can result in a range of maternal immune response properties and subsequent brain and behavioral outcomes in the offspring. Although higher doses of PolyIC are associated with more pronounced behavioral deficits (as well as litter loss) (Shi et al., 2003; Meyer et al., 2005; 2006b), recent evidence indicates that even low doses of PolyIC can induce long-lasting changes in brain development (Goeden et al., 2016). Reinstating the use of dose response trials implemented by early PolyIC based MIA models (Shi et al., 2003; Meyer et al., 2005; Missault et al., 2014), reporting litter size/loss, and carrying out comprehensive evaluations of the maternal immune response will improve reproducibility efforts and provide insight into the mechanism by which prenatal immune challenge impacts fetal development.
Results from the present study support the need for greater standardization of MIA models and, in particular, the need to report maternal immunological measures in order to interpret offspring outcome measures. While many MIA model studies have reported intriguing alterations in offspring brain and behavioral development, the lack of maternal cytokine data hinders progress in understanding mechanistic links between specific cytokines profiles and patterns of aberrant behavior. Moreover, studies reporting negative offspring findings without maternal cytokine data are perhaps even more problematic because an insufficient or absent immunological response may be the reason for the negative effects in such studies. Although reporting cytokine data in future MIA models would help to address these issues, we recognize that repeated blood collection is not always compatible with experimental design. Quantification of sickness behavior may serve as an alternative read out of immune challenge (Dantzer, 2009) that can be used to improve the MIA model. Here we demonstrate that indices of sickness, such as weight loss, O2usage/CO2 production, food/water consumption were present in the animals receiving HMW-PolyIC. Although fever response to inflammatory cytokines is well characterized, we found it to be an inconsistent measure in our current study, perhaps due to methodological limitations associated with our approach. This could relate to a lack of sensitivity in our thermometer because measured changes in core temperature were relatively small. Change in weight, previously highlighted as a key measure of sickness response in the MIA model (Missault et al., 2014; Vorhees et al., 2012; Bronson et al., 2011), was found to be as dependable a measure as any we collected using a sophisticated metabolic apparatus. Although the LMW-injected rats did not demonstrate robust sickness behaviors, this is consistent with previous rat MIA models utilizing uncharacterized PolyIC from Sigma-Aldrich that reported increase serum IL-6 two hours post-injection, but no subsequent changes in weight (Meehan et al., 2017). As previously demonstrated (Fortier et al., 2004), food and water intake may also provide a useful index of sickness behavior and underlying cytokine response.
There are several limitations in this current study. First and foremost, the experiments were carried out in nulliparous animals. Although HMW-PolyIC was associated with a more pronounced immune response, it is plausible that the levels of cytokine changes in pregnant animals this could lead to litter loss. At present, we are unable to make recommendations regarding the use of HMW- versus LMW-PolyIC in pregnant animals, but would suggest that molecular weight should be factored into experimental design considerations that are essential to improving rigor and reproducibility in the MIA model. Moreover, we elected to utilize Sprague Dawley rats to initiate the MIA model as they exhibit robust social behavior and are amenable to genetic manipulations (Berg et al., 2018; Ku et al., 2016). It is, however, plausible that different strains of rats may respond differently to immune challenge (Schwartzer et al., 2013). Although the focus of our study was a comparison between HMW- and LMW-PolyIC responses, it is also important to consider the potential impact of stress associated with blood sample collection and handling. As noted in Tables 2 and 3, the majority of cytokine levels increased between the 3 h and 6 h time points, even for the saline treated controls. Animals in the present study received multiple bouts of restraint and blood sample collection within 6 h, potentially inducing stress that may exacerbate cytokine response (Johnson et al., 2002; Cavigelli et al., 2018). Moreover, metabolic chambers, such as the CLAMS, have been associated with stress responses in rodents and may have contributed to the relatively high baseline cytokine levels in the saline group (Kalliokoski et al., 2013). While this does not alter the interpretation of the HMW- versus LMW-PolyIC comparison, it does raise issues regarding the use of metabolic chambers to evaluate sickness behaviors in the MIA model. Less invasive approaches (i.e, weight monitoring at the time of post-injection blood collection and 24 h later) may be preferable, especially for future studies with pregnant dams.
Our results indicate that PolyIC of varying molecular weights can induce significantly different cytokine responses and sickness behaviors in vivo, which may contribute to ongoing reproducibility issues of the MIA model (Begley and Ioannidis, 2015). These results are consistent with previous cell stimulation studies (Mian et al., 2013; Zhou et al., 2013), and provide insight into possible mechanisms underlying reports of variability in PolyIC immune activating properties (Harvey and Boksa, 2012). Given that pregnancy alters maternal immune responses, an essential next step is to characterize HMW-PolyIC and LMW-PolyIC cytokine responses and sickness behaviors in pregnant animals. While experiments in gravid animals are underway, here we present our preliminary results that have implications for the growing field of MIA model research, and may provide methodological insight needed to improve rigor and reproducibility of this valuable translational model.
Supplementary Material
Acknowledgements
This research was supported by pilot awards to M.D.B from the MIND Institute Intellectual and Developmental Disabilities Research Center (U54 HD079125) and from the UC Davis Behavioral Health Center of Excellence. M.C. has been supported by the UC Davis Autism Research Training Program (T32MH073124) and the UC Davis Behavioral Health Center of Excellence. The authors would like to thank Peter Takeuchi, Josef Rivera, and the UC Davis Rat Behavior Phenotyping Laboratory for their extensive help with the CLAMS and general animal care. We would also like to thank the UC Davis Intellectual and Developmental Disabilities Research Center (IDDRC) Biological Analysis Core, and in particular, Lori Haapanen, for assistance with cytokine quantification, as well as the Biostatistics, Bioinformatics, and Research Design Core for assistance with statistical analyses.
Footnotes
Competing interests
The authors have declared that no competing interests exist.
Appendix A. Supplementary data
Supplementary data to this article can be found online at https://doi.org/10.1016/j.jneuroim.2018.06.014.
References
- Alexopoulou L, et al. , 2001. Recognition of double-stranded RNA and activation of NF-kappaB by toll-like receptor 3. Nature 413 (6857), 732–738. [DOI] [PubMed] [Google Scholar]
- Arrode-Bruses G, Bruses JL, 2012. Maternal immune activation by poly I:C induces expression of cytokines IL-1beta and IL-13, chemokine MCP-1 and colony stimulating factor VEGF in fetal mouse brain. J. Neuroinflammation 9, 83. [DOI] [PMC free article] [PubMed] [Google Scholar]
- Ballendine SA, et al. , 2015. Behavioral alterations in rat offspring following maternal immune activation and ELR-CXC chemokine receptor antagonism during pregnancy: implications for neurodevelopmental psychiatric disorders. Prog. Neuro-Psychopharmacol. Biol. Psychiatry 57, 155–165. [DOI] [PMC free article] [PubMed] [Google Scholar]
- Bauman MD, et al. , 2014. Activation of the maternal immune system during pregnancy alters behavioral development of rhesus monkey offspring. Biol. Psychiatry 75 (4), 332–341. [DOI] [PMC free article] [PubMed] [Google Scholar]
- Begley CG, Ioannidis JP, 2015. Reproducibility in science: improving the standard for basic and preclinical research. Circ. Res. 116 (1), 116–126. [DOI] [PubMed] [Google Scholar]
- Berg EL, et al. , 2018. Developmental social communication deficits in the Shank3 rat model of phelan-mcdermid syndrome and autism spectrum disorder. Autism Res. 11 (4), 587–601. 10.1002/aur.1925. (April 2018, Epub 2018 Jan 29). [DOI] [PMC free article] [PubMed] [Google Scholar]
- Boksa P, 2010. Effects of prenatal infection on brain development and behavior: a review of findings from animal models. Brain Behav. Immun. 24 (6), 881–897. [DOI] [PubMed] [Google Scholar]
- Bronson SL, et al. , 2011. Individual differences in maternal response to immune challenge predict offspring behavior: contribution of environmental factors. Behav. Brain Res. 220 (1), 55–64. [DOI] [PMC free article] [PubMed] [Google Scholar]
- Careaga M, Murai T, Bauman MD, 2017. Maternal immune activation and autism Spectrum disorder: from rodents to nonhuman and human Primates. Biol. Psychiatry 81 (5), 391–401. [DOI] [PMC free article] [PubMed] [Google Scholar]
- Carpentier PA, et al. , 2013. Stereotypical alterations in cortical patterning are associated with maternal illness-induced placental dysfunction. J. Neurosci. 33 (43), 16874–16888. [DOI] [PMC free article] [PubMed] [Google Scholar]
- Cavigelli SA, et al. , 2018. Timing matters: the interval between acute stressors within chronic mild stress modifies behavioral and physiologic stress responses in male rats. Stress 1–11. [DOI] [PMC free article] [PubMed] [Google Scholar]
- Choi GB, et al. , 2016. The maternal interleukin-17a pathway in mice promotes autism-like phenotypes in offspring. Science 351 (6276), 933–939. [DOI] [PMC free article] [PubMed] [Google Scholar]
- Collins FS, Tabak LA, 2014. Policy: NIH plans to enhance reproducibility. Nature 505 (7485), 612–613. [DOI] [PMC free article] [PubMed] [Google Scholar]
- Crum WR, et al. , 2017. Evolution of structural abnormalities in the rat brain following in utero exposure to maternal immune activation: a longitudinal in vivo MRI study. Brain Behav. Immun. 63, 50–59. [DOI] [PMC free article] [PubMed] [Google Scholar]
- Dahlgren J, et al. , 2006. Interleukin-6 in the maternal circulation reaches the rat fetus in mid-gestation. Pediatr. Res. 60 (2), 147–151. [DOI] [PubMed] [Google Scholar]
- Dantzer R, 2006. Cytokine, sickness behavior, and depression. Neurol. Clin. 24 (3), 441–460. [DOI] [PMC free article] [PubMed] [Google Scholar]
- Dantzer R, 2009. Cytokine, sickness behavior, and depression. Immunol. Allergy Clin. N. Am. 29 (2), 247–264. [DOI] [PMC free article] [PubMed] [Google Scholar]
- Deverman BE, Patterson PH, 2009. Cytokines and CNS development. Neuron 64 (1), 61–78. [DOI] [PubMed] [Google Scholar]
- Dickerson DD, Wolff AR, Bilkey DK, 2010. Abnormal long-range neural synchrony in a maternal immune activation animal model of schizophrenia. J. Neurosci. 30 (37), 12424–12431. [DOI] [PMC free article] [PubMed] [Google Scholar]
- Estes ML, McAllister AK, 2016. Maternal immune activation: implications for neuropsychiatric disorders. Science 353 (6301), 772–777. [DOI] [PMC free article] [PubMed] [Google Scholar]
- Fatemi SH, et al. , 1998. Human influenza viral infection in utero increases nNOS expression in hippocampi of neonatal mice. Synapse 29 (1), 84–88. [DOI] [PubMed] [Google Scholar]
- Fortier ME, et al. , 2004. The viral mimic, polyinosinic:polycytidylic acid, induces fever in rats via an interleukin-1-dependent mechanism. Am. J. Phys. Regul. Integr. Comp. Phys. 287 (4), R759–R766. [DOI] [PubMed] [Google Scholar]
- Fortier ME, Luheshi GN, Boksa P, 2007. Effects of prenatal infection on prepulse inhibition in the rat depend on the nature of the infectious agent and the stage of pregnancy. Behav. Brain Res. 181 (2), 270–277. [DOI] [PubMed] [Google Scholar]
- Goeden N, et al. , 2016. Maternal inflammation disrupts fetal neurodevelopment via increased placental output of serotonin to the fetal brain. J. Neurosci. 36 (22), 6041–6049. [DOI] [PMC free article] [PubMed] [Google Scholar]
- Harvey L, Boksa P, 2012. A stereological comparison of GAD67 and reelin expression in the hippocampal stratum oriens of offspring from two mouse models of maternal inflammation during pregnancy. Neuropharmacology 62 (4), 1767–1776. [DOI] [PubMed] [Google Scholar]
- Howland JG, Cazakoff BN, Zhang Y, 2012. Altered object-in-place recognition memory, prepulse inhibition, and locomotor activity in the offspring of rats exposed to a viral mimetic during pregnancy. Neuroscience 201, 184–198. [DOI] [PMC free article] [PubMed] [Google Scholar]
- Hsiao EY, Patterson PH, 2011. Activation of the maternal immune system induces endocrine changes in the placenta via IL-6. Brain Behav. Immun. 25 (4), 604–615. [DOI] [PMC free article] [PubMed] [Google Scholar]
- Hsiao EY, et al. , 2013. Microbiota modulate behavioral and physiological abnormalities associated with neurodevelopmental disorders. Cell 155 (7), 1451–1463. [DOI] [PMC free article] [PubMed] [Google Scholar]
- Johnson JD, et al. , 2002. Prior stressor exposure sensitizes LPS-induced cytokine production. Brain Behav. Immun. 16 (4), 461–476. [DOI] [PubMed] [Google Scholar]
- Kalliokoski O, et al. , 2013. Mice do not habituate to metabolism cage housing-a three week study of male BALB/c mice. PLoS ONE 8 (3), e58460. [DOI] [PMC free article] [PubMed] [Google Scholar]
- Kentner AC, Bilbo SD, Brown AS Hsiao, McAllister AK, Meyer U, Pearce BD, Pletnikov MV, Yolken RH Bauman MD Maternal Immune Activation: reporting guidelines to improve the rigor, reproducibility, and transparency of the model, (in press). Neuropsychopharmacology. [DOI] [PMC free article] [PubMed] [Google Scholar]
- Kilkenny C, et al. , 2010. Improving bioscience research reporting: the ARRIVE guidelines for reporting animal research. PLoS Biol. 8 (6), el000412. [DOI] [PMC free article] [PubMed] [Google Scholar]
- Knuesel I, et al. , 2014. Maternal immune activation and abnormal brain development across CNS disorders. Nat. Rev. Neurol. 10 (11), 643–660. [DOI] [PubMed] [Google Scholar]
- Konefal SC, Stellwagen D, 2017. Tumour necrosis factor-mediated homeostatic synaptic plasticity in behavioural models: testing a role in maternal immune activation. Philos. Trans. R. Soc. Lond. Ser. B Biol. Sci. 372 (1715). [DOI] [PMC free article] [PubMed] [Google Scholar]
- Ku KM, et al. , 2016. Behavioral phenotyping of juvenile long-Evans and Sprague-Dawley rats: implications for preclinical models of autism Spectrum disorders. PLoS ONE 11 (6), e0158150. [DOI] [PMC free article] [PubMed] [Google Scholar]
- Landis SC, et al. , 2012. A call for transparent reporting to optimize the predictive value of preclinical research. Nature 490 (7419), 187–191. [DOI] [PMC free article] [PubMed] [Google Scholar]
- Lombardo MV, et al. , 2018. Maternal immune activation dysregulation of the fetal brain transcriptome and relevance to the pathophysiology of autism spectrum disorder. Mol. Psychiatry 23 (4), 1001–1013. 10.1038/mp.2017.15. (2018 April, Epub 2017 Mar 21). [DOI] [PMC free article] [PubMed] [Google Scholar]
- Machado CJ, et al. , 2015. Maternal immune activation in nonhuman Primates alters social attention in juvenile offspring. Biol. Psychiatry 77 (9), 823–832. 10.1016/j.biopsych.2014.07.035. (2015 May 1, Epub 2014 Aug 30). [DOI] [PMC free article] [PubMed] [Google Scholar]
- Malkova NV, et al. , 2012. Maternal immune activation yields offspring displaying mouse versions of the three core symptoms of autism. Brain Behav. Immun. 26 (4), 607–616. [DOI] [PMC free article] [PubMed] [Google Scholar]
- Mandal M, et al. , 2011. Maternal immune stimulation during pregnancy affects adaptive immunity in offspring to promote development of TH17 cells. Brain Behav. Immun. 25 (5), 863–871. [DOI] [PubMed] [Google Scholar]
- Medzhitov R, 2001. Toll-like receptors and innate immunity. Nat. Rev. Immunol. 1 (2), 135–145. [DOI] [PubMed] [Google Scholar]
- Meehan C, et al. , 2017. Effects of immune activation during early or late gestation on schizophrenia-related behaviour in adult rat offspring. Brain Behav. Immun. 63, 8–20. [DOI] [PubMed] [Google Scholar]
- Meyer U, 2014. Prenatal poly(i:C) exposure and other developmental immune activation models in rodent systems. Biol. Psychiatry 75 (4), 307–315. [DOI] [PubMed] [Google Scholar]
- Meyer U, Feldon J, 2012. To poly(I:C) or not to poly(I:C): advancing preclinical schizophrenia research through the use of prenatal immune activation models. Neuropharmacology 62 (3), 1308–1321. [DOI] [PubMed] [Google Scholar]
- Meyer U, et al. , 2005. Towards an immuno-precipitated neurodevelopmental animal model of schizophrenia. Neurosci. Biobehav. Rev. 29 (6), 913–947. [DOI] [PubMed] [Google Scholar]
- Meyer U, et al. , 2006a. The time of prenatal immune challenge determines the specificity of inflammation-mediated brain and behavioral pathology. J. Neurosci. 26 (18), 4752–4762. [DOI] [PMC free article] [PubMed] [Google Scholar]
- Meyer U, et al. , 2006b. Immunological stress at the maternal-foetal interface: a link between neurodevelopment and adult psychopathology. Brain Behav. Immun. 20 (4), 378–388. [DOI] [PubMed] [Google Scholar]
- Meyer U, Feldon J, Fatemi SH, 2009. In-vivo rodent models for the experimental investigation of prenatal immune activation effects in neurodevelopmental brain disorders. Neurosci. Biobehav. Rev. 33 (7), 1061–1079. [DOI] [PubMed] [Google Scholar]
- Mian MF, et al. , 2013. Length of dsRNA (poly I:C) drives distinct innate immune responses, depending on the cell type. J. Leukoc. Biol. 94 (5), 1025–1036. [DOI] [PubMed] [Google Scholar]
- Missault S, et al. , 2014. The risk for behavioural deficits is determined by the maternal immune response to prenatal immune challenge in a neurodevelopmental model. Brain Behav. Immun. 42, 138–146. [DOI] [PubMed] [Google Scholar]
- Murray C, et al. , 2015. Interdependent and independent roles of type I interferons and IL-6 in innate immune, neuroinflammatory and sickness behaviour responses to systemic poly I:C. Brain Behav. Immun. 48, 274–286. [DOI] [PMC free article] [PubMed] [Google Scholar]
- O'Loughlin E, et al. , 2017. Acute in utero exposure to lipopolysaccharide induces inflammation in the pre- and postnatal brain and alters the glial cytoarchitecture in the developing amygdala. J. Neuroinflammation 14 (1), 212. [DOI] [PMC free article] [PubMed] [Google Scholar]
- Patterson PH, 2009. Immune involvement in schizophrenia and autism: etiology, pathology and animal models. Behav. Brain Res. 204 (2), 313–321. [DOI] [PubMed] [Google Scholar]
- Piontkewitz Y, Arad M, Weiner I, 2011. Abnormal trajectories of neurodevelopment and behavior following in utero insult in the rat. Biol. Psychiatry 70 (9), 842–851. [DOI] [PubMed] [Google Scholar]
- Piontkewitz Y, Arad M, Weiner I, 2012. Tracing the development of psychosis and its prevention: what can be learned from animal models. Neuropharmacology 62 (3), 1273–1289. [DOI] [PubMed] [Google Scholar]
- Ray A, et al. , 1991. Variability in LPS composition, antigenicity and reactogenicity of phase variants of Bordetella pertussis. FEMS Microbiol. Lett. 63 (2–3), 211–217. [DOI] [PubMed] [Google Scholar]
- Reisinger S, et al. , 2015. The poly(I:C)-induced maternal immune activation model in preclinical neuropsychiatric drug discovery. Pharmacol. Ther. 149, 213–226. [DOI] [PubMed] [Google Scholar]
- Rose DR, et al. , 2017. Long-term altered immune responses following fetal priming in a non-human primate model of maternal immune activation. Brain Behav. Immun. 63, 60–70. [DOI] [PMC free article] [PubMed] [Google Scholar]
- Schwartzer JJ, et al. , 2013. Maternal immune activation and strain specific interactions in the development of autism-like behaviors in mice. Transl. Psychiatry 3, e240. [DOI] [PMC free article] [PubMed] [Google Scholar]
- Shi L, et al. , 2003. Maternal influenza infection causes marked behavioral and pharmacological changes in the offspring. J. Neurosci. 23 (1), 297–302. [DOI] [PMC free article] [PubMed] [Google Scholar]
- Smith SE, et al. , 2007. Maternal immune activation alters fetal brain development through interleukin-6. J. Neurosci. 27 (40), 10695–10702. [DOI] [PMC free article] [PubMed] [Google Scholar]
- Takeuchi O, Akira S, 2009. Innate immunity to virus infection. Immunol. Rev. 227 (1), 75–86. [DOI] [PMC free article] [PubMed] [Google Scholar]
- Vernon AC, et al. , 2015. Longitudinal in vivo maturational changes of metabolites in the prefrontal cortex of rats exposed to polyinosinic-polycytidylic acid in utero. Eur. Neuropsychopharmacol. 25 (12), 2210–2220. [DOI] [PubMed] [Google Scholar]
- Vorhees CV, et al. , 2012. Prenatal immune challenge in rats: altered responses to dopaminergic and glutamatergic agents, prepulse inhibition of acoustic startle, and reduced route-based learning as a function of maternal body weight gain after prenatal exposure to poly IC. Synapse 66 (8), 725–737. [DOI] [PMC free article] [PubMed] [Google Scholar]
- Vuillermot S, et al. , 2017. Vitamin D treatment during pregnancy prevents autism-related phenotypes in a mouse model of maternal immune activation. Mol. Autism 8, 9. [DOI] [PMC free article] [PubMed] [Google Scholar]
- Weir RK, et al. , 2015. Preliminary evidence of neuropathology in nonhuman primates prenatally exposed to maternal immune activation. Brain Behav. Immun. 48, 139–146. 10.1016/j.bbi.2015.03.009. (August 2015, Epub 2015 Mar 24). [DOI] [PMC free article] [PubMed] [Google Scholar]
- Wolff AR, Cheyne KR, Bilkey DK, 2011. Behavioural deficits associated with maternal immune activation in the rat model of schizophrenia. Behav. Brain Res. 225 (1), 382–387. [DOI] [PubMed] [Google Scholar]
- Yee N, et al. , 2012. Increased affective ultrasonic communication during fear learning in adult male rats exposed to maternal immune activation. J. Psychiatr. Res. 46 (9), 1199–1205. [DOI] [PubMed] [Google Scholar]
- Zaretsky MV, et al. , 2004. Transfer of inflammatory cytokines across the placenta. Obstet. Gynecol. 103 (3), 546–550. [DOI] [PubMed] [Google Scholar]
- Zhang Y, et al. , 2012. Prenatal exposure to a viral mimetic alters behavioural flexibility in male, but not female, rats. Neuropharmacology 62 (3), 1299–1307. [DOI] [PMC free article] [PubMed] [Google Scholar]
- Zhou Y, et al. , 2013. TLR3 activation efficiency by high or low molecular mass poly I:C. Innate Immun. 19 (2), 184–192. [DOI] [PMC free article] [PubMed] [Google Scholar]
- Zuckerman L, et al. , 2003. Immune activation during pregnancy in rats leads to a postpubertal emergence of disrupted latent inhibition, dopaminergic hyperfunction, and altered limbic morphology in the offspring: a novel neurodevelopmental model of schizophrenia. Neuropsychopharmacology 28 (10), 1778–1789. [DOI] [PubMed] [Google Scholar]
Associated Data
This section collects any data citations, data availability statements, or supplementary materials included in this article.