Abstract
Defining the transcriptomic identity of malignant cells is challenging in the absence of surface markers that distinguish cancer clones from one another or from admixed non-neoplastic cells. To address this challenge, we developed Genotyping of Transcriptomes (GoT), integrating genotyping with high-throughput droplet-based single-cell RNA-seq. We applied GoT to study how somatic mutations corrupt the complex process of human hematopoiesis, profiling 38,290 CD34+ cells from patients with CALR-mutated myeloproliferative neoplasms (MPN). High-resolution mapping of malignant vs. normal hematopoietic progenitors revealed increasing CALR-mutation fitness advantage with myeloid differentiation. We identified the unfolded protein response as a predominant outcome of CALR mutations, with significant cell identity dependency, as well as NF-κB pathway upregulation specifically in uncommitted stem cells. We further extended the GoT toolkit to genotype multiple targets and loci distant from transcript ends. Collectively, these findings revealed that the transcriptional output of MPN somatic mutations is dependent on the native cell identity.
Keywords: Single-cell, RNA-seq, genotyping, hematopoiesis, myeloproliferative neoplasms, somatic evolution
Somatic mutations underlie the development of clonal outgrowth, malignant transformation1, and subclonal diversification2–5. Nonetheless, clonally-derived populations often lack cell surface markers that distinguish them from normal cells or that can help distinguish subclones, limiting the ability to link the clonal architecture of malignant populations with transcriptional read-outs. For example, while myeloproliferative neoplasms (MPN) result from recurrent somatic mutations in CALR, JAK2 and MPL6,7, the mutated clone often represents a subset of bone marrow progenitors without distinctive surface markers to distinguish them from non-neoplastic hematopoietic cells. Thus, we are unable to study the impact of MPN mutations in the context of their progenitor subtype identity.
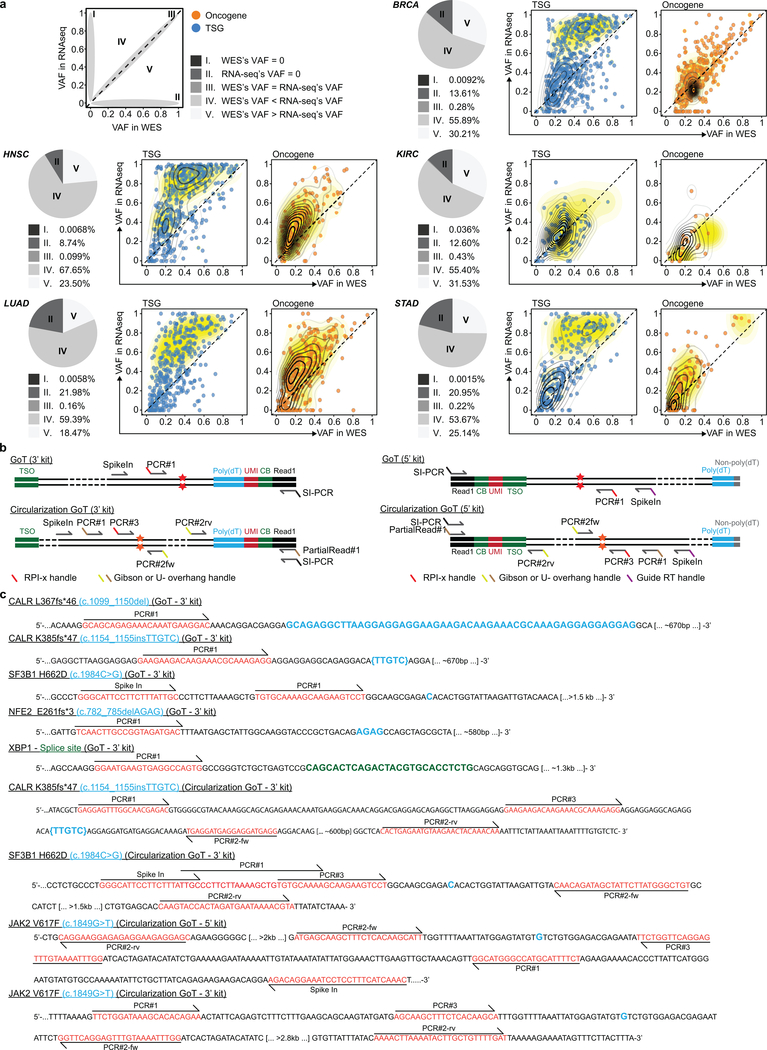
Although advanced methods have been developed to capture both transcriptional information and genotype at the single-cell level8,9, these methods are limited in throughput, and thus are challenged to study complex systems such as hematopoietic differentiation. Droplet-based sequencing enables the transcriptomic profiling of thousands of cells10,11, and can potentially also provide genotypic information of coding mutations (Extended Data Fig. 1a). However, current methods, by design, provide sequence information for only a short fragment at the transcript end, limiting the ability to jointly genotype somatic mutations. To overcome this challenge, we developed Genotyping of Transcriptomes (GoT) to link genotypes of expressed genes to transcriptional profiling of thousands of single-cells. We applied GoT to CD34+ cells from MPN patients, which revealed that MPN mutations in hematopoietic progenitor cells do not lead to uniform transcriptional outputs, but rather show strong dependence on progenitor subset identity.
RESULTS
Genotyping of Transcriptomes (GoT) couples targeted cDNA genotyping with single-cell whole transcriptomes to reveal that CALR mutant progenitor cells are comingled with wildtype cells throughout differentiation
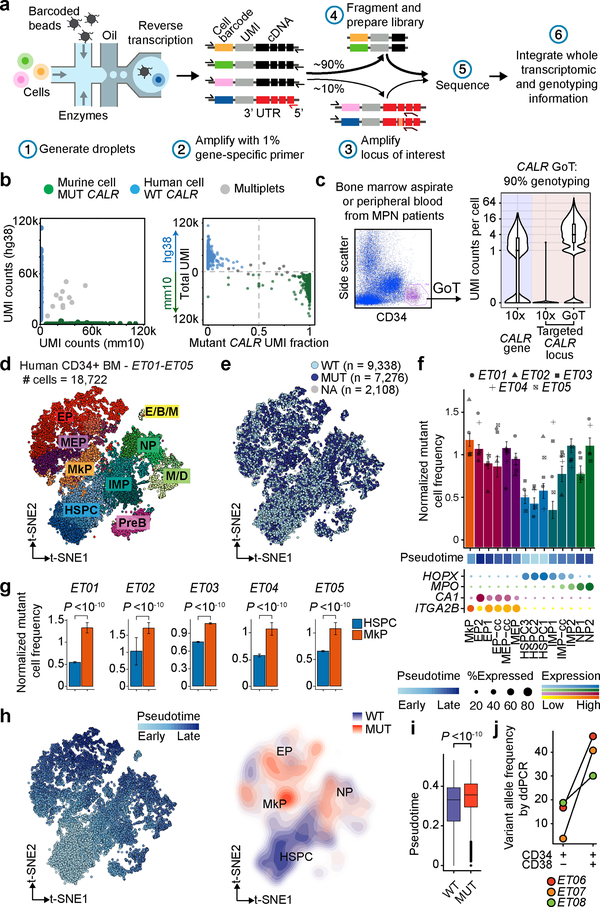
To link genotypes to single-cell RNA-seq (scRNA-seq) in high-throughput droplet-based platforms, we modified the 10x Genomics platform (Pleasanton, CA) to amplify the targeted transcript and locus of interest (Methods, Fig. 1a, Extended Data Fig. 1b,c). We then interrogated amplicon reads for mutational status, and linked the genotype to single-cell gene expression profiles via shared cell barcodes (Extended Data Fig. 2a,b). We tested the ability of GoT to co-map single-cell genotypes and transcriptomes with a species-mixing experiment, wherein mouse cells with a mutant CALR transgene were mixed with human cells with a wildtype CALR transgene (Fig. 1b)12. Consistent with precision genotyping, the vast majority of cells with mouse transcripts showed mutant CALR, whereas cells with human transcripts showed wildtype CALR (96.7% of cells matching the expected species; Fig. 1b, Extended Data Fig. 2c–g).
Figure 1. GoT provides somatic mutation genotyping for thousands of cancer cells and reveals differential fitness impact of CALR mutation in hematopoietic progenitor subsets.
a, Schematic of GoT workflow. b, Species-mixing study with mutant CALR murine cells and wildtype CALR human cells. 10x reads from singlet cells map to human or murine genome (left). Murine vs. human genome alignment of 10x data (y-axis) and GoT data (x-axis, right, n = 1,259 cells). c, FACS of CD34+ cells (left) and UMI per cell (right) for CALR transcript (blue shade) or targeted locus (pink shade) from representative ET01 (n = 6811 cells) of 10 independent experiments (Extended Data Fig. 3a,b for replicates). d, t-SNE projection of CD34+ cells from ET patients with cluster assignment and e, genotyping data. f, Normalized mutant cell frequency (Methods). Bars show aggregate analysis of ET01-ET05 with mean±SD of 100 downsampling iterations to 1 genotyping UMI; points represent mean of n = 100 downsampling iterations for each sample. g, Normalized mutant cell frequency; mean±SD of n = 100 downsampling iterations (Wilcoxon rank-sum test, two-sided). h, t-SNE projection of ET CD34+ cells with pseudotime (left) and density plot of wildtype and mutant cells (right). i, Pseudotime in wildtype vs. mutant cells. P-value from likelihood ratio test of LMM with/without mutation status (Methods). j, Bulk VAF of CALR mutation in FACS-sorted cells from ET patients by droplet digital (dd) PCR. HSPC, hematopoietic stem progenitor cells; IMP, immature myeloid progenitors; NP, neutrophil progenitors; M/D, monocyte-dendritic cell progenitors; E/B/M, eosinophil, basophil, mast cell progenitors; MEP, megakaryocytic-erythroid progenitors; MkP, megakaryocytic progenitors; EP, erythroid progenitors; PreB, precursor B-cells; cc, cell cycle; WT, wildtype. MUT, mutant; NA, not assignable. In all figures, box plots represent the median, bottom and upper quartiles, whiskers correspond to 1.5x the interquartile range; violin plots depict kernel density estimates to show the density distribution.
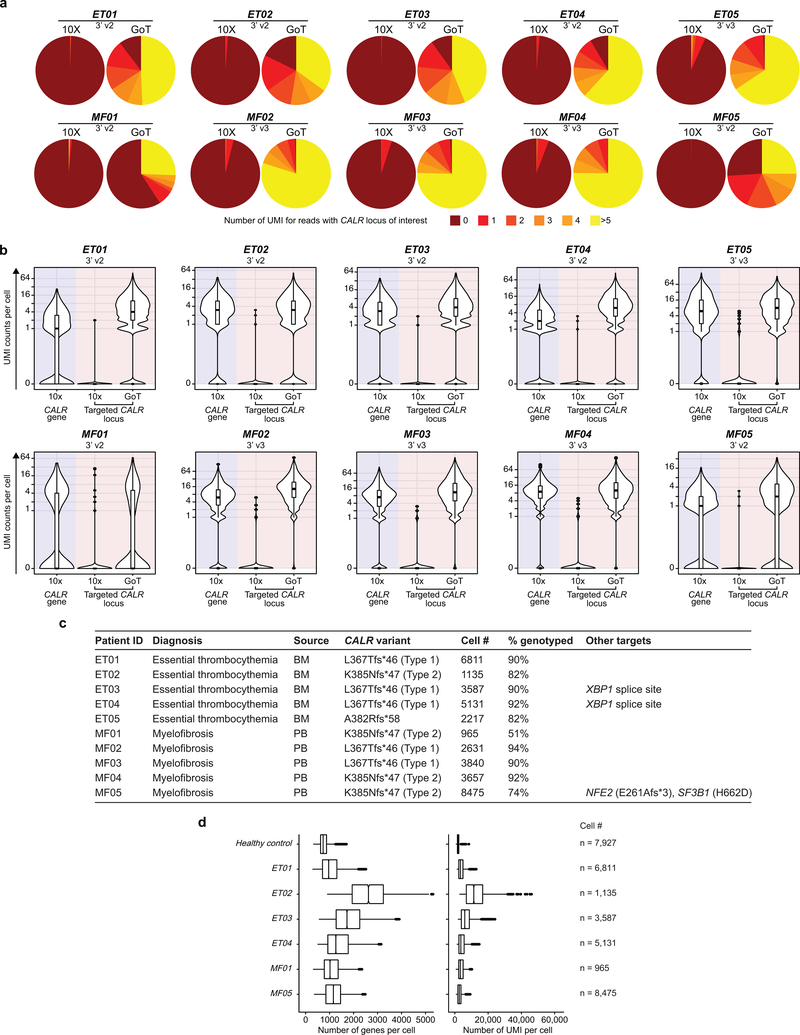
While CALR mutations have been demonstrated to activate MPL resulting in megakaryocytic proliferation7,12–16, how the mutations perturb early hematopoietic stem progenitor cell (HSPC) differentiation is largely unknown. We therefore applied GoT to CD34+ bone marrow cells from five patients with CALR-mutated essential thrombocythemia (ET), not treated with disease-modifying therapy at the time of biopsy (Supplementary Table 1). CALR genotyping data were available for 16,614 of 18,722 cells (88.7%), compared to only 1.4% by interrogation of CALR in the conventional 10x Genomics data (Fig. 1c, Extended Data Fig. 3a–d).
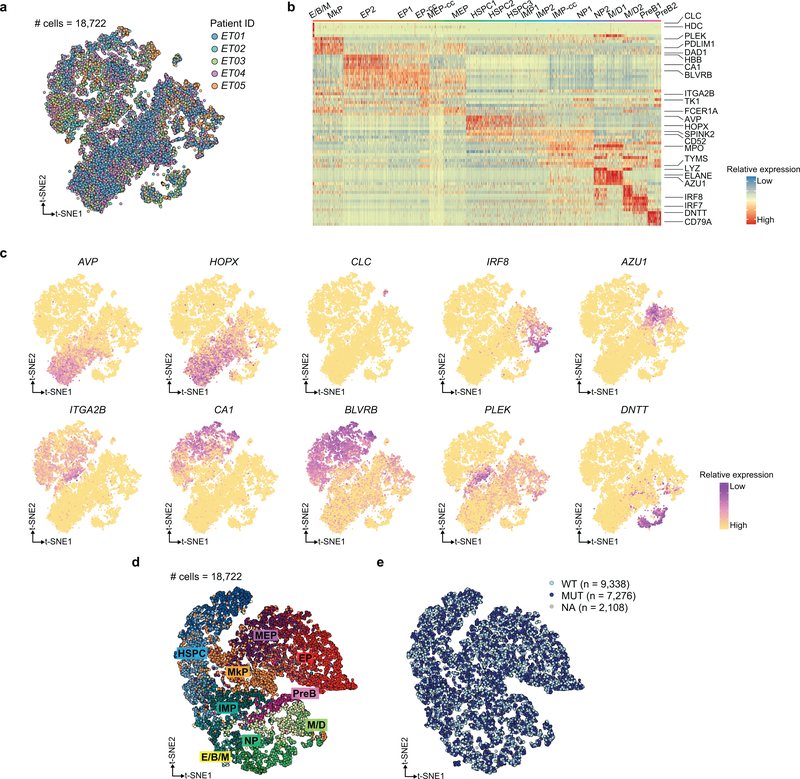
To interrogate the cellular identities of these progenitors, we performed clustering agnostic to the genotyping information, based on the transcriptome information alone (Fig. 1d, Extended Data Fig. 4a–c)17,18. Genotype projection onto progenitor maps demonstrated that mutated cells involved all CD34+ stem and progenitor clusters, consistent with previous bulk PCR analysis of CALR in FACS-sorted CD34+ subsets6 (Fig. 1e, see Extended Data Fig. 4d,e for validation with an alternative clustering framework19). Notably, mutated cells did not form novel independent clusters, confirming that scRNA-seq alone cannot distinguish mutant from wildtype cells, and demonstrating that CALR mutations in ET impact the entire hematopoietic differentiation hierarchy.
The fitness impact of CALR mutations increases with myeloid differentiation, associated with increased proliferation in mutant progenitors
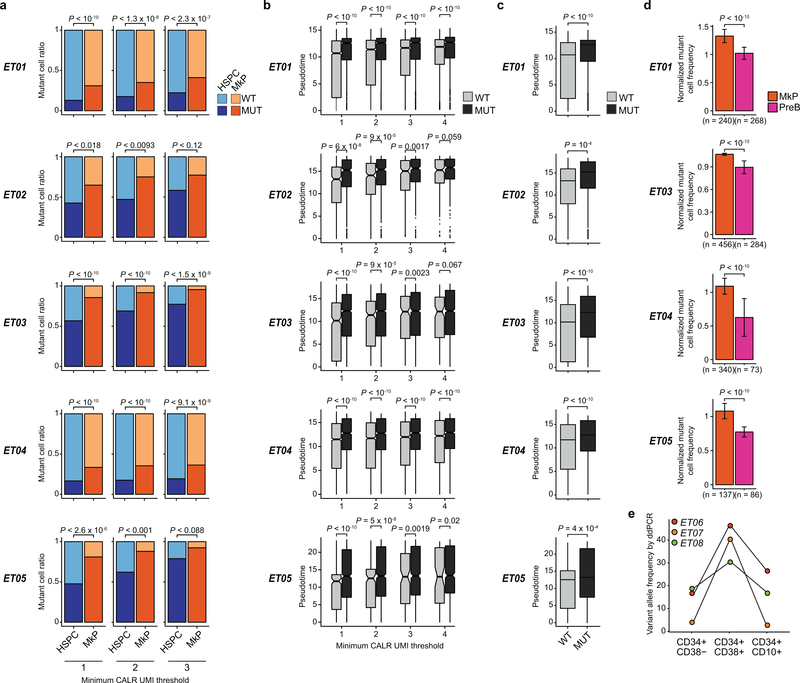
While mutant cells were observed across all progenitor clusters, their frequencies varied between clusters. CALR mutated cell frequency was higher in committed myeloid progenitors (Fig. 1f), especially MkPs which are closely associated with the disease phenotype of elevated platelets, compared to uncommitted HSPC clusters across samples (P-value <10−10, linear mixed model, Fig. 1g, Extended Data Fig. 5a). Consistently, pseudo-temporal ordering (pseudotime) analysis20,21 showed that CALR mutated cells were enriched in cells with later pseudotime points compared to wildtype cells (Fig. 1h,i, P-value <10−10, linear mixed model, Extended Data Fig. 5b,c). We orthogonally validated this finding via bulk gDNA droplet digital PCR, showing a lower CALR variant allele frequency (VAF) in CD34+CD38− HSPCs compared to CD34+CD38+ progenitors (P-value = 0.02, Wilcoxon rank-sum test, Fig. 1j). Thus, while CALR mutations arise in uncommitted HSCs and, therefore, propagate to populate the entire differentiation tree, the impact of CALR mutations on fitness increases with myeloid differentiation (Extended Data Fig. 5d,e).
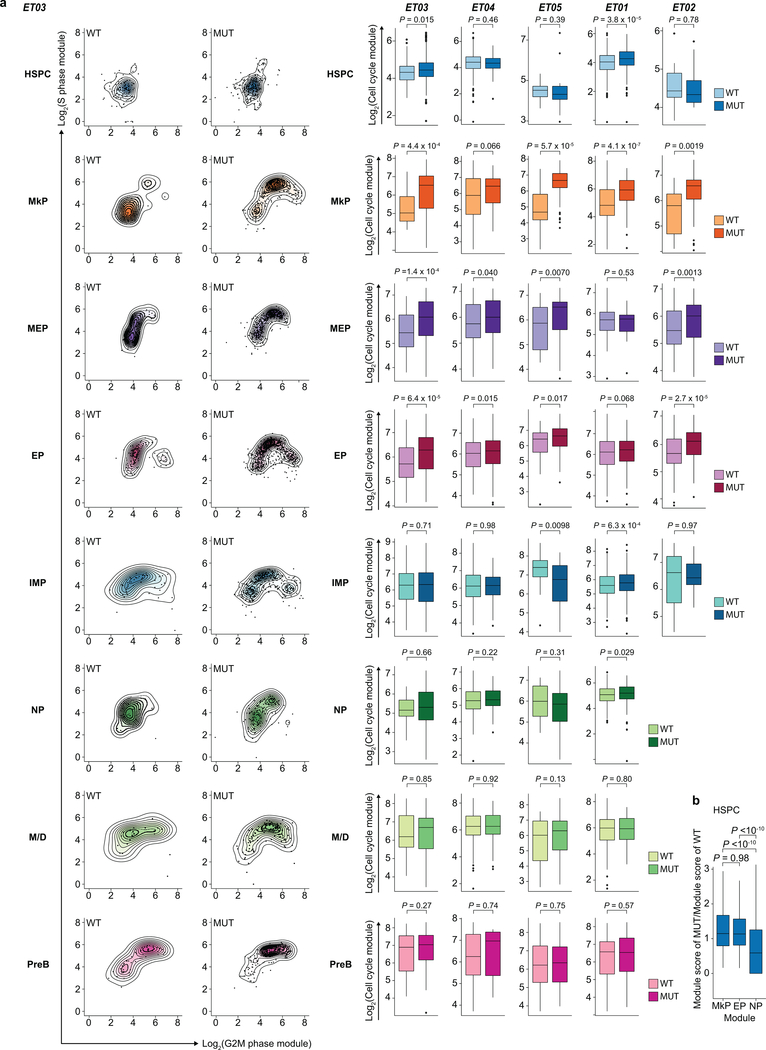
GoT uniquely enables direct transcriptional program comparison between mutant and wildtype cells, not only within the same sample, but also within the same progenitor cluster. For example, CALR-mutated progenitors displayed increased expression of genes upregulated in progenitors from JAK2-mutated ET22, most significantly in MkP clusters (combined P-value <10−10, Fisher’s method, Fig. 2a,b), as JAK2 and CALR mutations partially converge through activation of similar downstream pathways23. We therefore reasoned that progenitor subtype-specific comparison of cell-cycle gene expression (Supplementary Table 2)24 in mutant vs. wildtype cells may reveal whether the lower fitness impact of CALR mutations in HSPCs compared with MkPs stems from differences in cell proliferation. Indeed, while mutant HSPCs exhibited only a modest increase in cell cycle gene expression compared to wildtype (P-value = 0.015, Wilcoxon rank-sum test, mean fold change 1.2, 95% confidence interval, 1.1–1.4), mutant MkPs demonstrated a robust increase in cell cycle expression vs. their wildtype counterparts (P-value = 4.4 × 10⁻⁴, Wilcoxon rank-sum test, fold change 1.8 [1.4–2.8]; Fig. 2c, Extended Data Fig. 6a). Notably, the degree of cell cycle gene expression increase in mutant MkPs correlated with the patients’ platelet counts (Fig. 2d), suggesting that interrogation of the early progenitor cells may correlate with clinical phenotypes and inform our understanding of patient-to-patient variability despite shared mutated genotypes.
Figure 2. CALR mutations result in higher proliferative impact on MkPs compared to HSPCs.
a, Expression of representative genes upregulated in JAK2-mutated ET cells22 in CALR wildtype (n = 157) vs. mutant (n = 85) MkPs from representative ET01. b, Heatmap of -log10(P-value) from comparisons of expressions of JAK2-mutated ET genes between mutant and wildtype cells (Supplementary Table 6). c, Cell cycle module expression in HSPCs (n = 108 wildtype vs. n = 240 mutant) and MkPs (n = 25 wildtype vs. n = 276 mutant) from ET03 (Extended Data Fig. 6a). d, Platelet counts vs. difference of mean cell cycle score (± SE) between wildtype and mutant MkPs (n = 5 samples; F-test). e, Expression of MkP and HSC modules in MkPs from ET03. Pie charts of wildtype vs. mutant cell frequencies in HSCloMkPhi (n = 121 cells) and HSChiMkPlo (n = 28 cells; Fisher’s exact test, two-sided). f, Expression of TGFβ and MkP modules in HSPCs from ET01 and cell cycle score in HSPCs in MkPhiTGFβlo (n = 127 wildtype vs. n = 41 mutant) and MkPloTGFβhi populations (n = 105 wildtype vs. n = 15 mutant). P-values for a, b, c, f determined by Wilcoxon rank-sum test, two-sided.
Cell-to-cell variation exists even within progenitor clusters. For example, MkPs represent a heterogeneous population composed of less differentiated cells with higher expression of HSC genes25 (HSChiMkPlo), and more committed MkP cells displaying high expression of MkP-related genes26 (HSCloMkPhi; Fig. 2e, Supplementary Table 2). Even within the MkP cluster, HSCloMkPhi cells showed increased cell cycle gene expression, and a higher mutant cell frequency compared to HSChiMkPlo cells (P-value = 0.01, Fisher’s exact test). Similarly, mutant cells within the platelet-primed HSPCs (MkPhiTGFβlo) had higher cell cycle gene expression than wildtype MkPhiTGFβlo HSPCs, whereas mutant and wildtype HSPCs in a more quiescent state (MkPloTGFβhi) showed no cell cycle difference (Fig. 2f). These findings further emphasize that the impact of CALR mutation is dependent on cell state, and imparts a greater proliferative advantage in more differentiated cells. These data also reveal that CALR mutations skew differentiation toward myeloid progenitors, including megakaryocytic priming, early in hematopoiesis (Extended Data Fig. 6b).
De novo differential expression analysis reveals cell identity dependent upregulation of the unfolded protein response in CALR-mutant cells
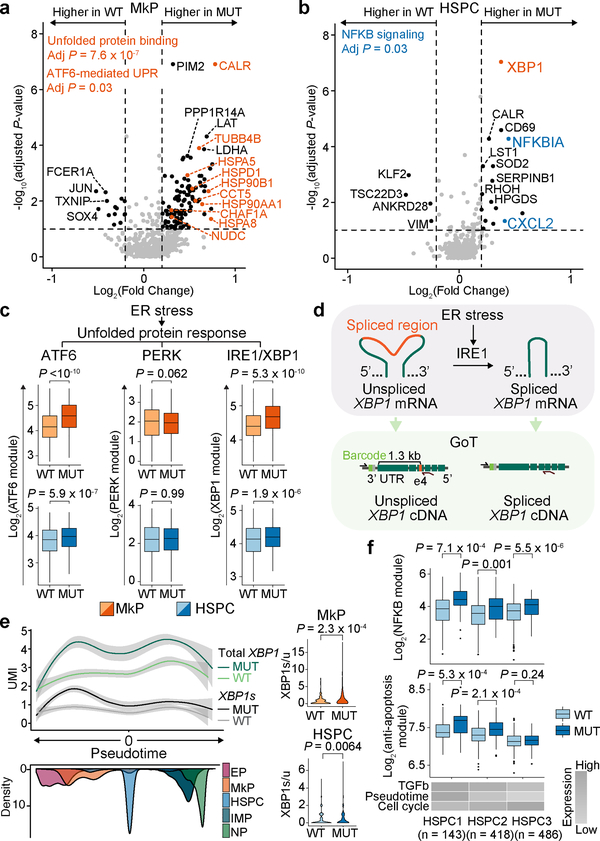
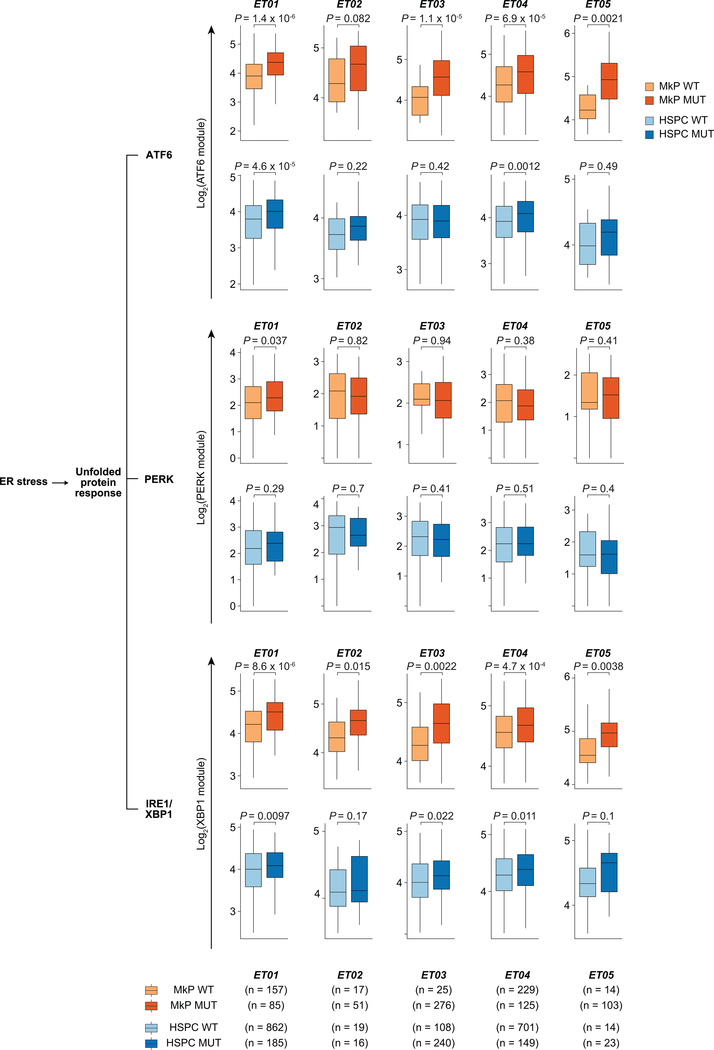
GoT data further offer a unique opportunity for de novo differential gene expression discovery, by examining wildtype vs. mutant cells within the same progenitor subset. Crucially, the wildtype cells serve as an ideal comparison set, as they share all potential environmental and patient-specific variables as the mutated cells. We identified 198 genes to be differentially expressed between mutant and wildtype MkPs (FDR adjusted P-value < 0.1; Fig. 3a, Supplementary Table 3). Mutated MkPs upregulated HSPA5 that encodes BiP, a key player in protein quality control that modulates the activities of the three transmembrane transducers of the unfolded protein response (UPR): PERK, IRE1, and ATF627. Consistently, CALR-mutant MkPs showed upregulation of UPR genes (adjusted P-value 1.7 × 10⁻⁸) and ATF6-mediated activation of chaperone genes (adjusted P-value = 0.03, Fig. 3a, Supplementary Table 4), providing direct in vivo validation of in vitro studies that have shown increased UPR in CALR mutated cells28,29. UPR in this context may signal ER stress in response to misfolded proteins, as the CALR chaperone activity may be compromised by the mutation30,31. Notably, among 20 differentially expressed genes in mutant HSPCs, XBP1, an important regulator of UPR, was upregulated in mutant cells suggesting that UPR activation by CALR mutations extends to uncommitted progenitors (Fig. 3b), further supported by upregulation of ATF6-target genes in mutant compared to wildtype HSPCs (Fig. 3c, Extended Data Fig. 7, Supplementary Table 2)32.
Figure 3. CALR mutation transcriptional effects are cell identity dependent.
a, Differentially expressed genes between mutant vs. wildtype MkPs and b, between mutant vs. wildtype HSPCs across ET01-ET05 samples (Supplementary Table 6). P-values combined using Fisher combine test with Benjamini-Hochberg adjustment. Key gene set enrichments (hypergeometic test, Methods). c, Expression of genes upregulated in UPR branches in MkPs (n = 442 wildtype vs. n = 640 mutant) and HSPCs (n = 1704 wildtype vs. n = 613 mutant) from ET01-ET05. P-values from likelihood ratio tests of LMM with and without mutation status (Methods). d, Schematic of GoT applied to XBP1 splice site. e, Local regression of total and spliced XBP1 (XBP1s) expression in progenitor cells from samples ET03 and ET04 (n = 1308 wildtype, and n = 1514 mutant; shade: 95% CI, left). XBP1s to unspliced XBP1 ratio in MkPs (n = 115 wildtype vs. n = 248 mutant) and HSPCs (n = 489 wildtype vs. n = 302 mutant; right panel). f, Expression of NF-κB pathway and anti-apoptosis genes in HSPC1 (n = 116 wildtype vs. n = 27 mutant), HSPC2 (n = 365 wildtype vs. n = 53 mutant), and HSPC3 (n = 381 wildtype vs. n = 105 mutant) from ET01. P-values for panels e, f from Wilcoxon rank-sum test, two-sided.
UPR was previously demonstrated to be preferentially mediated in HSPCs through PERK resulting in enhanced apoptosis upon ER stress33, helping to eliminate ER stressed cells from the HSC pool. In contrast, committed progenitors have a robust IRE1/XBP1 activity, promoting survival through ER stress challenge33. We observed that in the specific context of CALR mutation-induced ER stress, the PERK-branch of the UPR was not enhanced (Fig. 3c, Extended Data Fig. 7, Supplementary Table 2)33. In contrast, targets of XBP1 were upregulated in mutant MkPs (P-value = 5.3 × 10⁻¹⁰, linear mixed model), as well as in mutant HSPCs (P-value = 1.9 × 10⁻⁶, linear mixed model, Fig. 3c, Extended Data Fig. 7, Supplementary Table 2)34,35. As IRE1 catalyzes the unconventional splicing of XBP1 unspliced mRNA (XBP1u) into the active spliced form (XBP1s; Fig. 3d)36, we further validated that CALR mutations induce activation of the IRE1-branch of the UPR by repurposing GoT to probe for the spliced region of XBP1 in single cells. CALR mutations robustly augmented the amount of XBP1s in MkPs (Fig. 3e). Remarkably, CALR mutations also resulted in enhanced XBP1s/XBP1u ratio in HSPCs, indicating IRE1 activity (Fig. 3e). These data thus suggest that in CALR mutation-induced UPR, IRE1 is activated in both HSPCs and MkPs, skewing the ER stress-challenged stem and progenitor cells toward survival.
Differential gene expression analysis in HSPCs also revealed upregulation of the NF-κB pathway (adjusted P-value = 0.03), including upregulation of CXCL2 and NFKBIA (Fig. 3b, Supplementary Tables 3 and 4). Furthermore, NF-κB gene set upregulation in mutant vs. wildtype HSPCs was most notable in early uncommitted HSPCs (Fig. 3f, Supplementary Table 2). Mutant cells in this early HSPC subcluster also upregulated anti-apoptotic related genes (Fig. 3f, Supplementary Table 2). As NF-κB pathway activation has been previously associated with anti-apoptotic effects37 and HSC self-renewal38, our data thus points at another potential mechanism linking CALR mutation and HSC outgrowth.
IRE1-mediated UPR by mutant CALR is maintained through progression to myelofibrosis
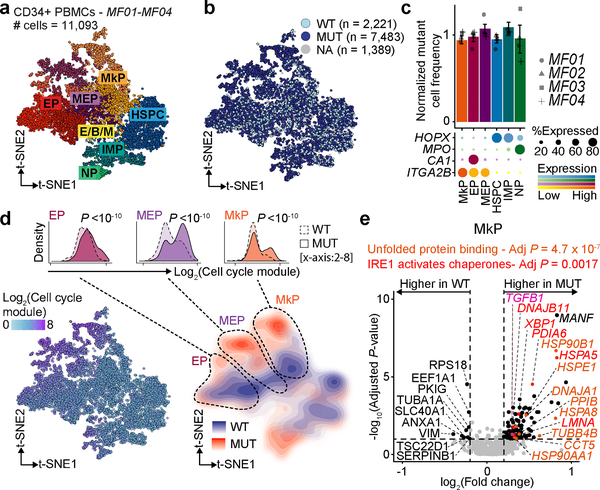
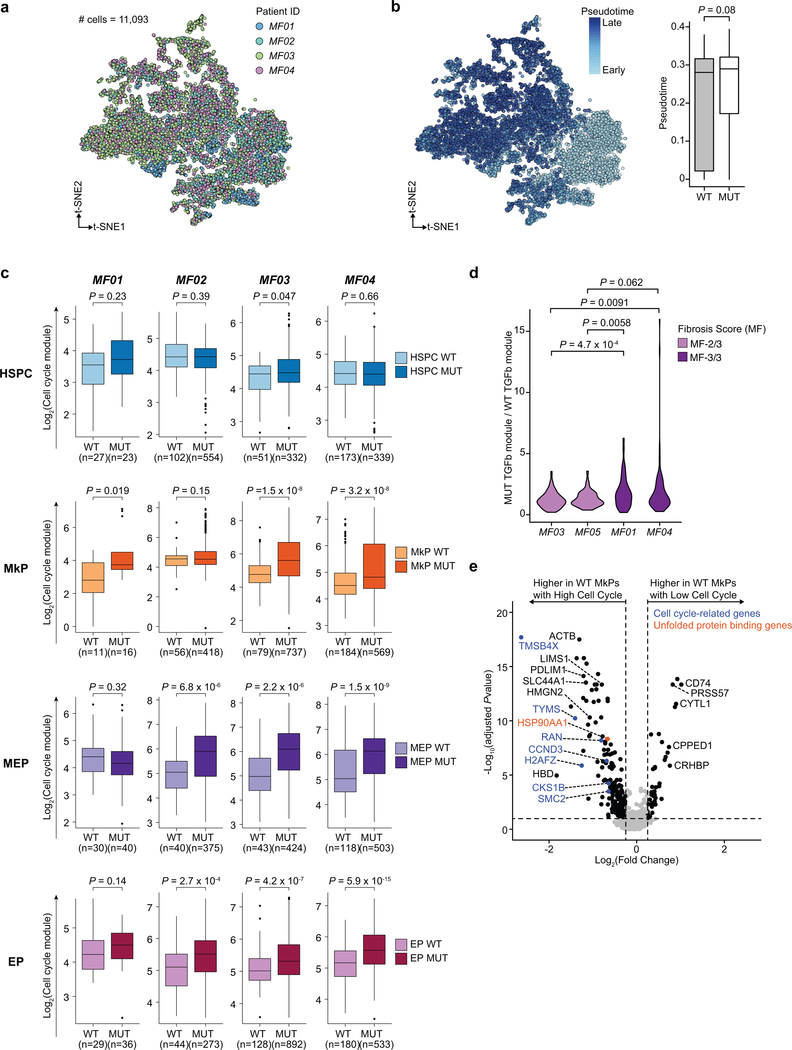
As a proportion of patients with CALR-mutated ET eventually progresses to post-ET myelofibrosis (MF) or present initially with MF, we examined whether CALR mutation imparted similar proliferative and survival advantage to progenitor cells from patients with CALR-mutated MF by examining 9,704 genotyped cells of total 11,093 cells (87.5% genotyping rate) across four MF samples (Fig. 4a,b, Extended Data Fig. 8a). In contrast to ET, we did not observe enrichment of mutated cells in differentiated progenitors compared to HSPCs (Fig. 4c, Extended Data Fig. 8b), consistent with previous reports39, suggesting that in the context of MF, CALR mutations impart a strong fitness advantage even to HSPCs. Indeed, mutant cells were highly enriched in cell cycle activity (Fig. 4d, Extended Data Fig. 8c).
Figure 4. CALR mutation effects on hematopoietic progenitor cells from MF patients.
a, t-SNE projection of CD34+ cells from MF patients showing cluster assignment and b, genotyping data from GoT. c, Normalized frequency of mutant cells (Methods). Bar graphs represent aggregate analysis of MF01-MF04 showing mean ± SD of 100 downsampling iterations to 1 genotyping UMI; gray points represent mean of 100 down-sampling iterations for each sample. d, t-SNE projection of the CD34+ cells showing cell cycle gene expression (left) and density plot of mutant and wildtype cells (right). Density plots of mutant vs. wildtype cells along cell cycle gene expression (inset, Wilcoxon rank-sum test, two-sided; Supplementary Table 6). e, Differentially expressed genes in mutant vs. wildtype MkPs across samples MF01-MF04 (Supplementary Table 6). P-values combined using Fisher combine test with Benjamini-Hochberg adjustment. Key gene set enrichments (hypergeometic test, Methods).
As megakaryocytes have been demonstrated to play a principle role in the development of marrow fibrosis40, we performed differential expression analysis between mutant and wildtype MkPs, showing 92 differentially expressed genes (FDR adjusted P-value < 0.1, Fig. 4e, Supplementary Table 3). We identified upregulation of TGFB1, previously implicated in fibroblast stimulation by megakaryocytes41,42, thereby demonstrating that TGFβ production is dysregulated even in early progenitors. Indeed, TGFβ signaling upregulation in mutant MkPs correlated with the degree of fibrosis in the patient’s bone marrow (Extended Data Fig. 8d). As in CALR-mutated ET, we observed a robust upregulation of UPR genes in mutated MkPs (adjusted P-value = 4.7 × 10⁻⁷) and, specifically, IRE1 activation (adjusted P-value = 0.0017; Fig. 4e, Supplementary Table 4). Notably, comparison of cycling to non-cycling wildtype cells did not show UPR upregulation, affirming that UPR activation is not simply a byproduct of increased proliferation (Extended Data Fig. 8e, Supplementary Tables 3 and 4). These findings suggest that the enhanced survival of CALR-mutant progenitors through upregulation of the IRE1-mediated UPR is maintained through disease progression to myelofibrosis.
Multiplexed GoT reveals subclonal transcriptomic identities
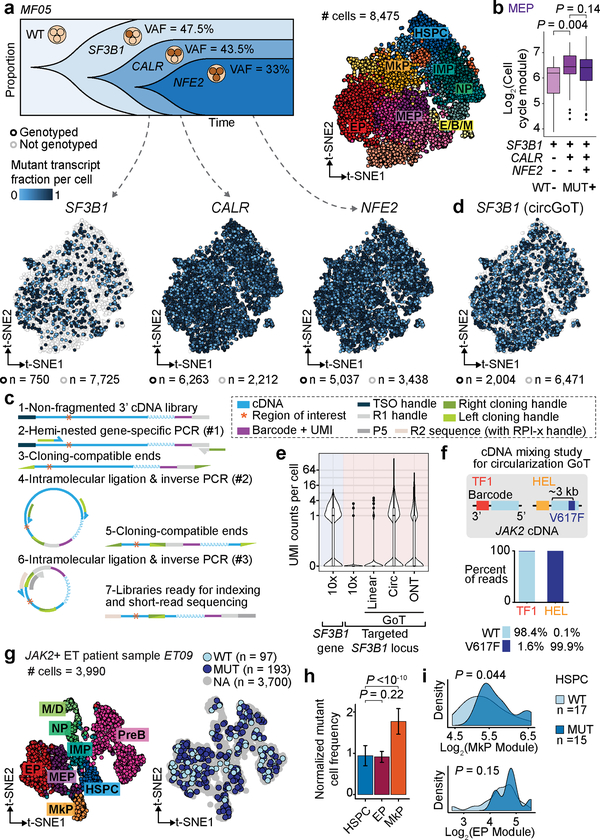
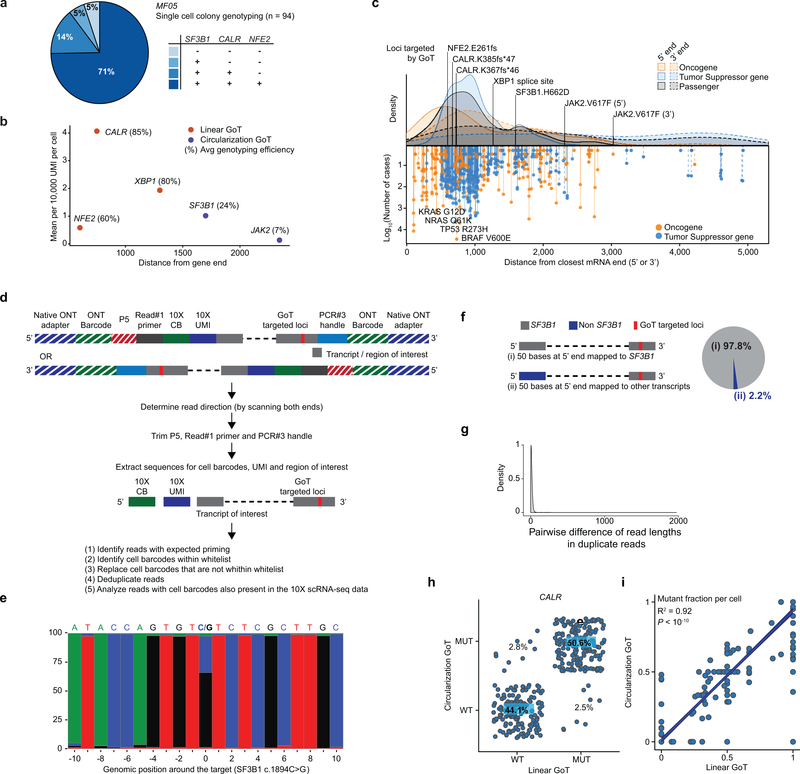
Ongoing clonal evolution results in multi-clonal malignant populations, requiring genotyping of multiple mutations in parallel. To test the ability of GoT to target multiple mutations, we targeted three mutations affecting CALR (VAF 43.5% by bulk exon sequencing), NFE2 (VAF 33%) and SF3B1 (VAF 47.5%) in 8,475 CD34+ cells from a patient with MF (Fig. 5a). The relative VAFs of these mutations suggest that this malignancy follows a nested (linear evolution) clonal structure, with a clonal SF3B1 mutation, a progeny subclone harboring a CALR mutation, which has an additional NFE2-mutated progeny (single-cell cloning validation in Extended Data Fig. 9a). GoT provided genotyping for CALR and NFE2 in 74% and 60% of cells, respectively, and showed mutant frequencies (64% and 56%, respectively) comparable to those of single cell cloning (85% and 71%, respectively, performed with unsorted peripheral blood cells).
Figure 5. GoT dissects subclonal identity through multiplexing and targets loci distant from transcript ends via circularization.
a, Schematic of clonal evolution of neoplastic cells from MF05 (top-left). t-SNE projections of CD34+ cells with cluster assignments (top-right) and with with GoT data for each variant (bottom). b, Cell cycle score in subclonal MEP populations (n = 28 single mutant, 109 double mutant, 293 triple mutant cells). c, Schematic of circularization GoT. d, t-SNE projection of MF05 CD34+ cells GoT data for SF3B1 from circularization and linear GoT. e, UMI per cell of SF3B1 gene (blue shade) or targeted SF3B1 locus (pink shade) from 10x, linear GoT sequenced on Illumina, circularization GoT, and linear GoT sequenced with ONT (n = 8475 cells). f, Mixing study with human JAK2 wildtype cDNA from TF-1 and homozygous JAK2 V617F cDNA from HEL. Frequency of reads (wildtype, V617F or not assignable [NA]) assigned to TF-1 or HEL cell barcodes (CB). g, t-SNE projection of CD34+ cells from patient with JAK2 V617F ET showing cluster assignment (left) and genotyping information (right) based on GoT data. h, Normalized frequency of mutant cells within the progenitor clusters (Methods). Mean ± SD of n = 100 down-sampling iterations. i, Density plots of HSPCs along lineage priming modules (n = 17 wildtype vs. 15 mutant cells). P-values for b, h, i from Wilcoxon rank-sum test, two-sided.
In this context, GoT allows to compare the transcriptional outputs of the different mutations alone or in combination. For example, since SF3B1 mutations have been shown to block erythroid maturation43, we examined whether the addition of a CALR mutation would still confer increased proliferative status in megakaryocytic-erythroid progenitors. We found that SF3B1/CALR-double mutants exhibited increased proliferative advantage over SF3B1-single mutants (Fig. 5b), while the addition of NFE2 mutation (triple-mutant) did not further increase cell cycle activation. Thus, multiplexed GoT demonstrated the ability to interrogate complex clonal structures, as well as the need to assess the combinatorial transcriptional output of mutations in the context of high-resolution cell identity mapping.
Circularization GoT enables genotyping of mutations distant from transcript ends
GoT amplicon recovery is not only dependent on the expression level of the gene but also on the distance of the mutation locus from transcript ends (Extended Data Fig. 9b). Capture efficiency of a mutation distant from the 3’ end (>1.5 kb, e.g. SF3B1 genotyping of 9% of cells, Fig. 5a) was lower than for targets closer to the 3’ end. While driver mutations are often found within 1.5 kb of either transcript ends (Extended Data Fig. 9c), loci of interest may reside at larger distances, and thus the dependency on relative proximity to transcript end is limiting. We reasoned that lower genotyping efficiency resulted, at least partially, from the inability of larger amplicon fragments to cluster efficiently on Illumina flow cells during sequencing. We further integrated our protocol with long-read sequencing with nanopore GridION X5 (Oxford Nanopore Technology), which demonstrated that SF3B1 transcripts were captured accurately with our procedure (Extended Data Fig. 9d,e), and further confirmed low intra- and inter-transcript PCR recombination rate, even for these relatively large fragments (Extended Data Fig. 9f,g).
To overcome this limitation, we applied sequential rounds of circularization and inverse PCR to remove the intervening sequence between the region of interest and the cell barcode (Fig. 5c). Circularization GoT showed high concordance with un-circularized (linear) GoT for CALR genotyping (Extended Data Fig. 9h,i). When applied to SF3B1 mutation capture, circularization GoT significantly increased the yield of genotyped cells from 750 to 2004 cells (9% to 24% of cells, Fig. 5d,e). These results demonstrate the ability of circularization GoT to extend our reach even to targets distant from gene ends.
To further demonstrate the ability of circularization GoT to genotype despite significant distance from the transcript end, we targeted JAK2V617F (~3 kb). We first validated circularization GoT for JAK2 via a mixing experiment with barcoded cDNA from TF1 cell line (wildtype JAK2) and from HEL cells (homozygous JAK2V617F), showing accurate genotype assignment (Fig. 5f). Next, we genotyped primary CD34+ cells from an individual with JAK2V617F ET, obtaining genotyping information for 7.3% of cells (Fig. 5g), even for this very lowly expressed gene. Mutant cell frequency was higher in MkPs compared to HSPCs, whereas the mutant cell frequency remained low in erythroid progenitors (Fig. 5h), concordant with the clinical phenotype of ET, rather than polycythemia vera (disease associated with the same JAK2 mutation, but with erythrocytosis as the leading abnormality). Consistent with this observation, we observed, albeit in a small number of genotyped HSPCs, a trend towards increased MkP-priming in mutant HSPCs (P-value = 0.04, Wilcoxon rank-sum; Fig. 5i, Supplementary Table 2). These data suggest skewing of differentiation toward megakaryopoiesis in HSPCs and may provide insights into the isolated megakaryocytic proliferation in JAK2-mutated ET.
Discussion
Here, we present GoT, which co-captures somatic genotypes and transcriptomic identities in thousands of single cells from primary cancer specimens. Building on previous experience for targeted amplification in droplet-based scRNA-seq44,45, GoT overcomes the unique set of challenges presented by somatic mutation genotyping, including lower expression levels and large distances from the end of the sequenced transcripts.
Collectively, GoT allowed us to directly interrogate the transcriptional impact of CALR mutation in primary MPN samples, where wildtype cells in the sample provide an ideal comparison set, controlling for patient-specific and technical confounders. We observed that mutant CALR provided a greater fitness advantage through differentiation in ET, associated with higher proliferation in committed myeloid progenitors compared with uncommitted HSPCs. GoT’s ability to fine-map mutant vs. wildtype transcriptional differences in HSPCs revealed upregulation of NF-κB pathway genes in the most undifferentiated mutant HSPCs, supporting a cell-intrinsic role for CALR mutation in NF-κB activation46. We further applied GoT to target the unconventional splice site of XBP1 to demonstrate that IRE1 activity was increased in the mutant cells, including HSPCs. Our data thus nominates the IRE1/XBP1 pathway as a potential therapeutic target for eradication of the mutant clone in the uncommitted HSPCs in patients with CALR-mutated MPNs.
In conclusion, high-throughput linking of single-cell genotypic and transcriptomic data underscored the cell identity-dependency of somatic mutations in human hematopoiesis, allowing us to superimpose the native differentiation tree with a tree corrupted by somatic mutations. GoT further provides the means to gain insight into the integration of clonal diversification with lineage plasticity47 or differentiation topologies48 across cancer. Thus, GoT may pave the way to resolve central questions related to the link between genetic mutations and cellular identities, and to unravel the underlying programs that enable clonal expansions and evolution in human neoplasms.
METHODS
Species mixing experiment
Previously published UT7 and Ba/F3 cell lines expressing human MPL and either human wildtype CALR or mutant CALR (type 1, 52 bp deletion), kindly provided by Dr. Mullally’s lab, were used for the species mixing study12. Briefly, human MPL expressing Ba/F3 and UT7 cell lines were generated by retroviral transduction, after which they were subjected to infection with CALR variant lentiviral supernatants. Wildtype UT7 cells and mutant Ba/F3 cells were mixed in equal proportions which underwent GoT, targeting ~1000 cells. While UT7 has been listed as a commonly misidentified cell line, it was used for the sole purpose of validating the CALR mutation status of the cells. All cell lines used in the study were tested for mycoplasma contamination.
Patient samples
The study was approved by the local ethics committee and by the Institutional Review Board (IRB) of Memorial Sloan-Kettering Cancer Center and Weill Cornell Medicine and conducted in accordance to the Declaration of Helsinki protocol. All patients provided informed consent. Cryopreserved bone marrow mononuclear (BMMCs) or peripheral blood mononuclear cells (PBMCs) from patients with documented CALR mutations were retrieved after a database search. See Supplementary Table 1 for clinical information. Cryopreserved BMMCs or PBMCs were thawed and stained using standard procedures (10 min, 4°C) with the surface antibody CD34-PE-Vio770 (clone AC136, lot# 5180718070, dilution 1:50, Miltenyi Biotec) and DAPI (Sigma-Aldrich). Cells were then sorted for DAPI-negative, CD34+ and CD34-negative cells using BD Influx at the Weill Cornell Medicine flow cytometry core.
Targeted myeloid panel
To determine the presence and location of recurrent somatic mutations and their VAF, targeted next-generation sequencing was performed on DNA samples extracted from unfractionated PBMCs (patients ET09, MF01, MF02, MF03, MF04), CD34-negative sorted BMMCs (patients ET02, ET03, ET04, ET05), CD34+ sorted BMMC (patient ET01) and CD34+ sorted PBMC (patient MF05), as previously described49. Briefly, targeted enrichment of 45 genes (ABL1, ASXL1, BCOR, BRAF, CALR, CBL, CEBPA, DNMT3A, ETV6, EZH2, FAM5C, FLT3, GATA1, GATA2, HNRNPK, IDH1, IDH2, IKZF1, JAK1, JAK2, KDM6A, KIT, KRAS, MPL, NFE2, NOTCH1, NPM1, NRAS, PHF6, PTPN11, RAD21, RUNX1, SETBP1, SF3B1, SH2B3, SMC1A, SMC3, SRSF2, STAG2, SUZ12, TET2, TP53, U2AF1, ZRSR2) recurrently mutated in myeloid malignancies was performed using the Thunderstorm system (Raindance Technologies, Billerica, MA) with a custom primer panel followed by sequencing using the Illumina MiSeq (v3 chemistry).
Genotyping of Transcriptomes (GoT)
Extending recent experience with targeted amplicon sequencing in scRNA-seq44,45, we developed GoT in order to simultaneously capture genotyping data and whole transcriptomic data in single cells by adapting the 10x Genomics platform (Pleasanton, CA). The standard 10x Genomics Chromium 3’ (v.2 or v.3 chemistry) and 5’ libraries were carried out according to manufacturer’s recommendations until after emulsion breakage and recovery of first strand cDNA (Fig. 1a, step 1). For 3’ libraries, if the targeted gene of interest, e.g. SF3B1, was not robustly detected by the standard 10x procedure (i.e. if <60% of the expected cells showed expression) based on a priori knowledge in a similar dataset, a gene-specific primer was spiked into 10x primer mix at 1% of the concentration of the cDNA amplification primers for the initial cDNA PCR step (Fig. 1a, see Supplementary Table 5 for list of primers and Extended Data Fig. 1b,c for primer positions). For 5’ libraries, presence of 10X cell barcodes (CB) and UMI on 3’ side of the transcript enabled a gene-specific primer spike-in during the RT step (Guide RT primer: 0.12 μM final concentration, Supplementary Table 5) to increase capture and detection of the transcript of interest (e.g. JAK2). At cDNA amplification step, another spike-in primer (Additive primer) is added to increase yield of the same transcript. During the amplification step, for 3’ libraries v.2 chemistry only, the 10x cDNA library underwent an extra cycle of PCR beyond the manufacturer’s recommended number of cycles. (3’ v3 chemistry and 5’ libraries do not require extra cycles of PCR at amplification step.) After cDNA amplification and cleanup with SPRIselect, a small portion of the cDNA library (3 μL for 3’ v.2 and 10 μl for 3’ v.3 chemistry and 5’ libraries) were aliquoted for targeted genotyping, and the remaining cDNA underwent the standard 10x protocol. In the case of 3’ v.2 chemistry, the cDNA set aside for GoT was amplified for 3 to 4 additional cycles using KAPA HiFi HotStart ReadyMix (KAPABiosystems) and 10x primer mix to provide sufficient material for the enrichment step. After clean-up, locus-specific reverse primers and the generic forward SI-PCR were used to amplify the site of interest of the cDNA template (Extended Data Fig. 1b,c, Supplementary Table 5). Number of PCR cycles was determined experimentally and was dependent on the level of expression of targeted gene (for instance 10 cycles were used for CALR). The locus-specific reverse primers contain a partial Illumina read 2 handle, a stagger to increase the complexity of the library for optimal sequencing and a gene specific region to allow specific priming. The SI-PCR oligo (10x Genomics) anneals to the partial Illumina read 1 sequence at either 3’ or 5’ end of the molecule when using 3’ or 5’ libraries, respectively, preserving the CB and UMI (Extended Data Fig. 1b,c). After the initial amplification and SPRI purification to remove unincorporated primers, a second PCR was performed with a generic forward PCR primer (P5_generic) to retain the CB and UMI together with an RPI-x primer (Illumina) to complete the P7 end of the library and add a sample index. The targeted amplicon library was subsequently spiked into the remainder of the 10x library to be sequenced together on a HiSeq 2500 or sequenced separately on MiSeq (Illumina). The cycle settings were as follows: 26 cycles for read 1, 98 or 130 cycles for read 2, and 8 cycles for sample index for 3’ v.2 chemistry and 5’ libraries, or 28 cycles for read 1, 98 or 130 cycles for read 2, and 8 cycles for sample index for 3’ v.3 chemistry.
Circularization GoT
For patient samples, we used the same starting material as for GoT (i.e. non-fragmented 10x cDNA fraction); for the JAK2 cDNA mixing study, we mixed barcoded cDNA from two cells lines (TF-1: JAK2 wildtype (ATCC CRL-2003), HEL: Homozygote JAK2 V617F (ATCC TIB-180). With these cDNA libraries, we first performed a PCR to enrich for the amplicon, amplifying from ~50 bp upstream our region of interest to the 3’ end of the 10x library fragment, therefore retaining cell barcode (CB) and unique molecule identifier (UMI), using KAPA HiFi Uracil+ master mix (Kapa Biosystems) and the following PCR conditions: 98°C for 3’; 10 to 20 cycles of: 98°C for 20”, 65°C for 30”, 72°C for 2’, 72°C for 5’. Complementary U-overhang are added to the forward (Fw) and reverse (Rv) primers to allow circularization: Fw-primer#1: AGGUCAGTCU-[50bp-upstream-locus-specific], Rv-primer#1: AGACUGACCUCTACACGACGCTCTTCCGATCT (Extended Data Fig. 1b,c, Supplementary Table 5). For genes lowly represented in the cDNA library (such as SF3B1), we specifically pre-enriched the gene of interest by doing a PCR targeting ~100bp upstream our region of interest to the 3’ end of the 10x library fragment, using KAPA HiFi Ready mix (Kapa Biosystems) and the following PCR conditions: 95°C for 3’; 20 cycles of: 98°C for 20”, 65°C for 30”, 72°C for 2’, 72°C for 5’. PCR product resulting from the first single or double PCR was then cleaned-up and concentrated using 1.3X SPRI beads. Next, amplicon cohesive ends were created using 40U/mL USERII enzyme (M5508-NEB) digestion for 1 hour at 37°C in 1X CutSmart buffer. Reaction was stopped by incubating for 10’ at 65°C. Relying on complementary overhang at both end of the amplicon, circularization was performed in a large volume (>1 mL) to favor intra-molecule ligation. The following reaction was set-up and incubated overnight at 16°C: USERII-digested amplicon, 2000 U/mL T4 ligase (NEB), 1X CutSmart Buffer (NEB), 1 mM ATP (Roche). Next, T4 DNA ligase was inactivated by incubating for 15’ at 70°C. Then, unwanted un-ligated products were removed by adding 6U of lambda exonuclease (NEB, M0262S) in the ligation mix and incubating for 30’ at 37°C. Exonuclease was inactivated for 20’ at 65°C. Ligated product was cleaned-up and concentrated using 1.3X SPRI beads. A second PCR was set-up to retain the locus of interest and barcodes on the same molecule while removing the unwanted 3’ downstream region of the targeted region. PCR reaction was set-up and performed as previously described using the following primers: Fw-primer#2: AGGUCAGTCU[3’end-locus-specific], Rv-primer#2: AGACUGACCU[10bp-downstream-locus-specific].
After PCR#2, SPRI clean-up, USERII digestion, overnight T4 ligation, lambda exonuclease digestion were performed as previously described. After the second ligation, the ligated product was again cleaned-up and concentrated using 1.3X SPRI beads. To increase ligation efficiency during the circularization step and also reduce protocol duration (3 days vs 1 day), we further improve ligation by using Gibson assembly molecular cloning approach. Instead of U-overhang handles, complementary Gibson handles are added to the forward (Fw) and reverse (Rv) primers to allow circularization post PCR#1 and PCR#2 (Supplementary Table 5, Extended Data Fig. 1b,c). PCR#1 and PCR#2 are performed as previously described for the U-overhang version of this protocol but using KAPA HiFi Ready mix. Ligation is now perform during 1 hour at 50°C in a large volume (>1 mL, 1X CutSmart Buffer) and using 10 μl of Gibson master mix (NEB, E2611). Finally, to linearize the product of ligation, we performed a third PCR: Fw-primer#3: CCTTGGCACCCGAGAATTCCA[10bp-upstream-specific-locus], Rv-primer#3: SI-PCR (10x Genomics). We used KAPA HiFi master mix (Kapa Biosystems) and the following PCR conditions: 95°C for 3’; 10 cycles of: 98°C for 20”, 65°C for 30”, 72°C for 30”; 72°C for 5’. After SPRI purification, a last PCR was performed with a generic forward PCR primer (P5_generic) and an RPI-x primer (Illumina) to complete the P7 end of the library and add a sample index (95°C for 3’; 5 cycles of: 98°C for 20”, 67°C for 30”, 72°C for 30”; 72°C for 5’). Thus, this method generates amplicons that retain contiguity of the original molecules but are short enough to cluster effectively to be sequenced with standard parameters. The targeted amplicon library was subsequently sequenced using PE150 on MiSeq (Illumina).
Single-cell RNA-seq data processing, alignment, cell type classification and clustering
10x data was processed using Cell Ranger 2.1.0 with default parameters. Reads were aligned to the human reference sequence GRCh38 or hg19 or to mouse reference mm10 (species mixing experiment). The genomic region of interest for genotyping was examined to determine how many UMIs with targeted sequence were present in the conventional 10x data (Fig. 1c, Extended Data Fig. 3a,b).
The Seurat package (v. 3.0) was used to perform unbiased clustering of the CD34+ sorted cells from patient samples18,50. Briefly, for individual datasets, cells with UMI <200 or UMI >3 standard deviation from the mean UMI and mitochondrial gene percentage >10% were filtered. The data was log normalized using a scale factor of 10,000. Prior to clustering, the ET and MF datasets were integrated and underwent batch-correction which implements canonical correlation analysis (CCA) and principles of mutual nearest neighbor. Recommended settings were used for the integration (i.e., 30 canonical correlation vectors for CCA in the FindIntegrationAnchors function and 30 principle components for the anchor weighting procedure in IntegrateData function). For the datasets, potential confounders (e.g., number of UMI per cell and the proportion of mitochondrial genes) were regressed out of the data before principle component analysis (PCA) was performed using variable genes. JackStraw method was used to determine the statistically significant PCs to be used for graph-based clustering. t-SNE was used to visualize the clusters. Clusters were manually assigned based on differentially expressed genes using the FindAllMarkers function using default settings (i.e. using all genes that are detected in a minimum of 25% of cells in either of the two comparison sets as input, and log(fold change) of 0.25 as the threshold). Wilcoxon rank-sum test is applied to rank genes, with the top ten differentially expressed genes per cluster presented in Extended Data Fig. 4b. We identified 19 distinct clusters in the integrated data for ET01-ET05, which were annotated according to marker genes identified by Velten et al.26 (t-distributed stochastic neighbor embedding (t-SNE) in Fig. 1d, and clustering heatmap and t-SNE with representative marker genes in Extended Data Fig. 4b,c). Pseudotime analysis was performed using the Monocle R package (v.3.8) for individual datasets20 and the URD package (v.1.0.2) for the integrated datasets21. Linear mixed effects analysis was performed using the lme4 package (v. 1.2–1). For mutant frequency analysis between HSPCs and MkPs (Fig. 1g), genotype status was defined as the fixed effect and, as random effects, we had intercepts for individual patients (i.e. subjects) and iterative downsampling. For integrated analysis of pseudotime comparison (Fig. 1i) and gene module expression (e.g. Fig. 3c), genotype status was entered as the fixed effect and subjects as random effects. P-values were obtained by likelihood ratio tests of the full model with the fixed effect against the model without the fixed effect51.
Deep Generative Model for Single Cell Analysis
We applied the deep generative modeling approach of Lopez et al. (2018) for the single cell analysis of ET01-ET0519 (Extended Data Fig. 4d,e). Using the scVI package, we trained a variational autoencoder (VAE) that takes as input a feature vector for each cell consisting of transcript counts for the 256 genes with the highest standard deviation across all samples as well as an indicator for batch ID. Using 90% of cells for training and holding out 10% for validation, these features are provided to the VAE with 64-unit hidden layers in both the encoder and decoder modules and a four-dimensional internal latent vector of gaussian-distributed values that provide a more concise representation of biological variability between cells. t-SNE is applied to these vectors for visualization.
IronThrone GoT: Targeted genotype amplicon sequence processing and mutation calling
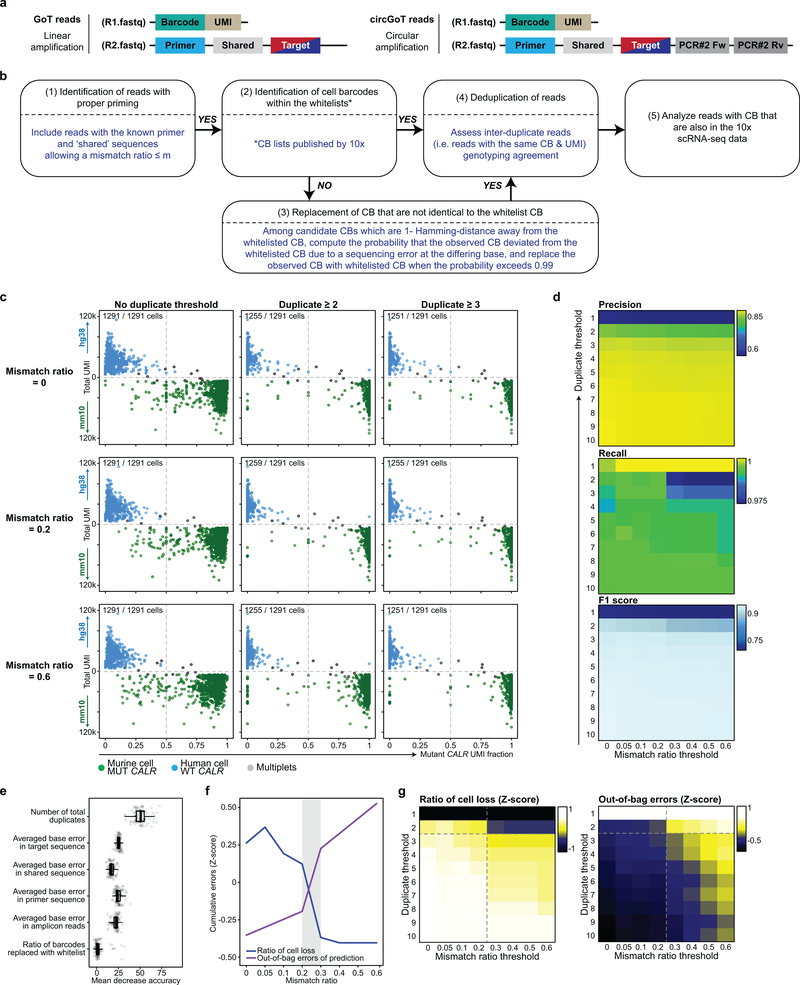
To ensure correct priming, targeted amplicon reads (read 2) were screened for the presence of the primer sequence and the expected intervening sequence between the primer and the start of the mutation site (‘shared sequence’, for circularization GoT, PCR #2Fw and PCR #2Rv primer sequences; Extended Data Fig. 2a,b). 90.0% of the reads from the mixing study showed the expected primer and shared sequences. Subsequently, for reads that passed the priming step, the corresponding read 1 was screened for the presence of the 16 bp or 18 bp long CB that matched the CB in the whitelist provided by 10x Genomics (Extended Data Fig. 10). For CB reads that were 1-Hamming-distance away from the whitelisted CB, the probability that the observed barcode originated from the whitelisted CB was calculated taking into account the base quality (BQ) score at the differing base. The whitelisted CB with the highest probability was used to replace the observed CB, only if the probability exceeded 0.99. For the duplicate reads with the same CB and UMI, the genotype (wildtype vs. mutant) of the UMI was assigned based on majority rule in supporting reads or according to the read with the highest BQ score in the rare case when only two supporting but discordant reads were available.
The species-mixing study for CALR (type 1) mutation was used to further optimize to optimize the analytical assignment of genotypes to cells, to overcome technical sources of noise such as PCR errors, ambient mRNA and PCR recombination, which may accompany targeted amplification in scRNA-seq. A mean (± standard deviation) of 83.6 (± 95.3) CALR UMIs were detected per cell in the amplicon data, with 52 (± 16.3) reads per UMI. We integrated targeted amplicon measures including BQ, number of base pair mismatches, and number of duplicate reads per UMI, and determined optimized parameters that maximize the number of genotyped cells while minimizing genotype mis-assignment (Extended Data Fig. 2c–g). Setting thresholds for the minimum number of duplicate reads and maximum frequency of mismatches contributed significantly to filtering out mis-assigned reads likely due to technical errors (e.g. PCR recombinations). A combination of threshold of two or more duplicate reads for a given UMI and a threshold of allowing less than or equal to 0.2 mismatch ratio significantly improved correct assignment of cells, while maximizing the number of included cells for analysis, and was adopted in the analysis here (Extended Data Fig. 2c). Results of the precision and recall analyses also affirmed this combination of thresholds for minimum duplicate reads and maximum mismatch ratio (Extended Data Fig. 2d). Moreover, given the high number of CALR transcripts in the cell lines and thus higher potential impact of PCR recombination, cells were assigned as wildtype or mutant if >90% of CALR amplicon UMIs were wildtype or mutant, respectively.
To further assess the impact of various parameters of the amplicon reads on the precision of mutation calling, we tested these parameters in a random forest classification using the mixing study, as implemented in the R randomForest package (v. 4.6–14)52 (Extended Data Fig. 2e–g). Mean decrease accuracy was determined as a measure of importance of each variable used for the calculation of splits in trees (Extended Data Fig. 2e). For each combination of mismatch ratio and duplicate thresholds, random forest was run 100 times to find the optimal number of random variables used in each tree and the minimum out-of-bag error was selected (Extended Data Fig. 2f,g). This random forest analysis also showed a minimum duplicate read threshold of 2 and maximum mismatch ratio threshold of 0.2 to be optimal for minimizing mis-assignments, and the relatively low contribution of additional quality metrics.
Moreover, the genotyping information is derived from transcribed molecules and may be affected by the capture of transcripts from wildtype vs. mutant alleles of heterozygous mutations in primary patient samples (in which median targeted amplicon UMI per cell was 5 [± 4.45, median absolute deviation]). This may be due to incomplete sampling of the transcript pool or due to transcriptional bursts53, which leads to skewed transcript pools. Consequently, as the number of UMIs per cell increases, the likelihood of capturing a mutant transcript increases, resulting in an apparently higher frequency of mutated cells. Thus, the number of mutant reads may be underestimated in cells with lower amplicon UMI counts. Nonetheless, the frequency of mutant cells (e.g., 26% in patient sample ET01) as determined by GoT using all cells that harbor at least one UMI yielded values that were similar to that determined by bulk DNA exon sequencing of CALR from CD34+ cells (mutant cell fraction of 30% based on VAF of 0.15 in a diploid heterozygous mutation). While the bulk of the downstream analyses between CALR mutant and wildtype cells used a threshold of two or greater genotyping amplicon UMIs, we systematically applied three approaches to exclude the impact of this confounder (i.e., expression level of target gene) on the conclusions. First, to exclude the possibility that higher CALR expression in committed progenitors can result in greater ability to detect mutant alleles and thereby result in higher mutated cell frequency, we down-sampled all cells to a single amplicon UMI prior to mutation calling and found that the increase in mutation frequencies in MkP compared with HSPC remained unchanged (Fig. 1f). Second, we explored the sensitivity of the difference between mutant and wildtype cells (e.g. pseudotime, mutant cell frequency) by increasing the minimal amplicon UMI threshold allowed for mutation calling and demonstrated that this did not impact the central findings of this study (Extended Data Fig. 5a,b). Third, we explicitly modeled the impact of CALR amplicon UMI in multivariable models (generalized linear model using R Stats package v3.5.1, e.g., pseudotime analysis), in which the number of amplicon UMI was included in the model alongside the mutation status (Extended Data Fig. 5c). We further note that the GoT procedure did not result in significant loss of genes or UMIs per cell in comparison to published data of CD34+ selected cells from the standard 10x library (Extended Data Fig. 3d)54. For XBP1 splicing analyses, we required a cell to have at least one unspliced XBP1 for inclusion in the analyses.
Mutant cell frequency analysis
For integrated analysis of ET01-ET05 or MF01-MF04, an equal number of cells from each sample (n = 900 for ET and n = 400 for MF) were subsampled randomly. Genotyping amplicon UMIs were downsampled (x100 iterations) to one per cell and mutant cell frequency was determined for each cluster for either the integrated dataset or individual samples. This frequency was then divided by the total mutant cell frequency across all progenitor subsets for each of the iterations (Figs. 1f,g, 4c, 5h, Extended Data Fig. 5d).
Differential expression and gene set enrichment analysis
For gene module analysis, the aggregate gene expression levels of modules of genes involved in biological processes of interest (see complete list of genes for each module in Supplementary Table 2) were calculated as log2 of the ratio of UMI in gene module per 10,000 UMIs per cell. The gene modules have been previously published (see references in main text and in Supplementary Table 2). Differential gene expression analysis between mutant and wildtype cells for each of the progenitor cluster for each patient was performed via the ‘FindMarkers’ function within the Seurat Package using the logistic regression for differential gene expression55 with variable genes as input and requiring expression in at least 10% of cells in either group. UMI was included as a latent variable. The differentially expressed genes were examined individually for each patient; they were also examined in combination for each cluster across the patients by combining the P-values for the differentially expressed genes via Fisher’s method and performing a weighted average of the log2(fold change) (Supplementary Table 3). Genes that were differentially expressed with FDR < 0.1 and log2(fold change) >= 0.2 were included for gene set enrichment analysis. Hypergeometric test for gene set enrichment analysis was performed using the gProfileR package (v. 0.6.7)56. Multiple hypothesis testing correction was performed using the g:SCS algorithm developed by the authors of the gProfileR package. KEGG, Reactome, GO:MF, and GO:BP data sources were included in the analyses (Supplementary Table 4).
Comparison of mutant allelic fraction in whole exome sequencing (WES) and RNA-seq
We compared the mutant allelic fractions between gDNA and RNA, estimated from WES and RNA-seq data, respectively, in five cancer cohorts (BRCA, breast invasive carcinoma; HNSC, head and neck squamous cell carcinoma; KIRC, kidney renal clear cell carcinoma; LUAD, lung adenocarcinoma; STAD, stomach adenocarcinoma). For this analysis, we thank Dr. Tae-Min Kim (Cancer Research Institute, College of Medicine, The Catholic University of Korea) for sharing the curated datasets based on his previous study57. In brief, the datasets of each cancer cohorts were initially prepared with somatic mutation sets that are reported from The Cancer Genome Atlas (TCGA) portal (https://portal.gdc.cancer.gov/). Then, reference and alternative alleles for these mutations were counted in bam files of WES and RNA-seq using SAMtools mpileup58, and filtered for >10 coverage of reads. We then converted genomic coordinates of the datasets from hg19 to hg38 assembly. To identify the frequencies of somatic mutations in cancers, we used the CNT values from CosmicCodingMuts.vcf (v86) in the Catalogue of Somatic Mutations in Cancer (COSMIC) database59. Then, we further annotated the variants as oncogene or tumor suppressor gene (TSG) (Vogelstein et al. 201360), and as driver or passenger mutations (Bailey et al. 201861).
Determination of targeted loci distance from 3’ or 5’ ends of transcripts
To identify Ensembl transcript ID (ENST) corresponding to each mutation in the datasets of five cancer cohorts described above, we matched them with COSMIC ID and annotated from the file of CosmicMutantExport.tsv (v86). We used the biomaRt R package62 with the GRCh38 version to annotate the transcript including the length of transcript and the position of cDNA start codon in the transcript. The positions of the 5’ untranslated region (UTR) ends were determined to calculate the distance from 5’ end to target site.
Oxford Nanpore Technology (ONT)
The cDNA amplicon samples were barcoded by ONT 1D native barcoding kit EXP-NBD104. The barcoded samples were fed into ONT SQK-LSK109 library preparation and sequencing workflow. FLO-MIN106 RevD flowcells and GridION X5 sequencer were used for sequencing. Data were basecalled by ONT Guppy 2.3.1. For analysis, the adaptor sequences were trimmed Porechop (https://github.com/rrwick/Porechop). Then, the reads were assessed for correct priming as shown in Extended Data Fig. 9d. The correctly primed reads were aligned to the reference genome (Grch38) with minimap263 (v. 2.16) for variant calling. The cell barcodes underwent the same processing described above for IronThrone GoT (Extended Data Fig. 9d, 10).
Droplet digital PCR
Peripheral blood from three ET patients with mutations in CALR underwent Ficoll density gradient separation, immunomagnetic selection for CD34+ cells (Miltenyi Biotech), and fluorescence-activated cell sorting (FACS) (Influx, Becton-Dickinson) using PeCy7-labeled CD34, clone 561 (lot# B257238, BioLegend), APC-labeled CD38, clone HIT2 (lot #B247250, BioLegend) and FITC-labeled CD10, clone HI10a (lot# B254556, BioLegend) antibodies were used to isolate CD34+CD38−, CD34+CD38+, and CD34+CD10+ cell compartments. DNA was extracted from sorted cells (Qiagen) and the VAF of CALR mutations was measured by droplet digital PCR (QX200 Droplet Digital PCR System, Bio-Rad) with primers that specifically detect CALR type 1 mutations (52-bp deletion (p.L367fs*46), CALR type 2 mutations (5-bp TTGTC insertion (p.K385fs*47) or wildtype alleles.
Single cell colony genotyping assay
Viably frozen mononuclear cells were thawed and plated in H4434 Methocultä media (StemCell Technologies, Cambridge, MA) containing recombinant human SCF, GM-CSF, IL-3 and EPO according to the manufacturer’s specifications. Individual colonies (n = 94) were picked from the methylcellulose media after 14 days of culture at 37°C and sequenced by Sanger sequencing for SF3B1, CALR and NFE2 mutations using primers listed in Supplementary Table 5.
Extended Data
Extended Data Figure 1. Comparison of variant allele frequency (VAF) between whole exome sequencing (WES) and RNA-seq and primer sequences and positions of linear and circularization GoT.
a, Pie charts show the fraction of variants that are categorized as described in the top-left-box. Distribution of mutant allele fraction is annotated as oncogene or tumor suppressor gene (definitions according to Vogelstein et al. 201360 and Bailey et al. 201861). Diagonal dashed lines indicate equal allelic fraction between WES and RNA-seq. Yellow density contours represent driver distributions. BRCA, breast invasive carcinoma; HNSC, head and neck squamous cell carcinoma; KIRC, kidney renal clear cell carcinoma; LUAD, lung adenocarcinoma; STAD, stomach adenocarcinoma. b, Schematic localization of primers for (linear) GoT and circularization GoT for 3’ and 5’ libraries. c, Primer positions and sequences of the regions targeted by GoT and circularization GoT.
Extended Data Figure 2. Optimization of parameters in targeted amplicon sequence processing pipeline in Genotyping of Transcriptomes (IronThrone GoT).
a, Representation of amplicon reads. b, Flow chart of the GoT analysis pipeline (see Methods). c, Murine (green) vs. human (blue) genome alignment of 10x data (y-axis) with genotyping data by GoT (x-axis) with various thresholds for minimum duplicate reads (across) and maximum mismatch ratio (down). d, Results of precision, recall and F1 score analysis for combinations of minimum duplicate reads and maximum mismatch ratios. e, Measure of importance of each variable used for the calculation of splits in trees in random forest classification test. f, Ratio of cell loss and genotyping errors (Z-score in y-axis) based on mismatch ratio thresholds (x-axis); area of intersection is highlighted with gray around the mismatch ratio 0.2. g, Heatmaps showing Z-scores of number of filtered cells (left) and predicted error rates (right) from random forest classification tests for combinations of minimum duplicate reads and maximum mismatch ratio thresholds.
Extended Data Figure 3. GoT captures genotyping information of single cells through cDNA.
a, Percentage of cells by number of UMIs with CALR mutation locus capture in standard 10x data (left) and GoT data (right) (see Extended Data Fig. 3c for cell number in each sample). b, Number of UMIs per cell of CALR transcript from standard 10x data (left, blue shade) or targeted CALR locus from standard 10x or GoT (pink shade, see Extended Data Fig. 3c for cell number in each sample). c, Summary of clinical, pathologic, and GoT data from patients with CALR-mutated myeloproliferative neoplasms. BM, bone marrow; PB, peripheral blood. d, Number of genes per cell (left) and number of UMIs per cell (right) from published standard 10x data of healthy control CD34+ cells and 10x data from 3’ v2 chemistry of CD34+ cells from patient samples that underwent concurrent GoT, after random down-sampling of the reads from each sample to 50 million reads x3 iterations, showing that extra cycle of PCR and portioning a small aliquot from the 10x cDNA library for GoT using 3’ v2 chemistry does not compromise scRNA-seq data.
Extended Data Figure 4. Integration of ET patient samples and progenitor subset assignment.
a, t-SNE projection of CD34+ progenitor cells from samples ET01-ET05, after integration and batch-correction using the Seurat package (see Methods). b, Heatmap of top ten differentially expressed genes for clusters; lineage-specific genes from Velten et al. (2018)26 are highlighted (see Methods). c, Representative lineage-specific genes projected on t-SNE representation of CD34+ cells from ET patient samples. d, t-SNE projection of CD34+ cells from patient samples ET01-ET05 after applying deep generative modeling approach for the single cell analysis using the scVI package (see Methods)19 showing progenitor subset assignments as determined after clustering the cells using the Seurat package. e, Genotyping data from GoT are projected onto the t-SNE generated after the scVI analysis of progenitor cells from ET01-ET05. Cells without any GoT data are labeled NA (not assignable). WT, wildtype; MUT, mutant; HSPC, hematopoietic stem progenitor cells; IMP, immature myeloid progenitors; NP, neutrophil progenitors; M/D, monocyte-dendritic cell progenitors; E/B/M, eosinophil, basophil, mast cell progenitors; MEP, megakaryocytic-erythroid progenitors; MkP, megakaryocytic progenitors; EP, erythroid progenitors; PreB, precursor B-cells.
Extended Data Figure 5. Results of GoT analysis is robust to various amplicon UMI thresholds and linear modeling.
a, Wildtype and mutant cell frequency in HSPCs vs. MkPs with variable minimum genotyping UMI thresholds (Fisher’s exact test, two-sided, see Supplementary Table 6 for sample size). b, Pseudotime comparison between wildtype and mutant cells with increasing number of thresholds for targeted genotyping UMI (t-test, two-sided, Supplementary Table 6). c, Pseudotime comparison between mutant and wildtype cells with UMI threshold of 1 (Extended Data Figure 5b) with statistical test using a generalized linear model including mutation status and total number of amplicon UMIs per cell. d, Across 100 iterations, the genotyping amplicon UMIs were downsampled to one per cell and mutant cell frequency was determined for MkPs or precursor B-cells (PreB). This frequency was then divided by the total mutant cell frequency across all progenitor subsets for each of the 100 iterations. Mean ± standard deviation (SD) after n = 100 down-sampling iterations (Wilcoxon rank-sum test, two sided). ET samples with at least 20 cells in each cluster were analyzed. e, Variant allele fraction of CALR mutation in CD34+, CD38− (left), CD34+, CD38+ (middle) and CD34+, CD10+ (right) FACS-sorted peripheral blood cells from patients with ET determined by droplet digital (dd) PCR.
Extended Data Figure 6. Cell cycle module expression in mutant and wildtype progenitor cells.
a, S phase and G2M phase gene module expression in wildtype (wildtype) vs. mutant (mutant) cells in HSPC and MkP clusters from ET patient samples. Cell cycle module score represents sum of S phase and G2M phase gene module expression (Wilcoxon rank-sum test, two-sided, see Methods and Supplementary Table 6 for sample size). Analysis performed for clusters with at least 20 cells. b, Ratio of committed progenitor priming module expression of mutant and wildtype hematopoietic stem progenitor cells (HSPCs). One mutant and one wildtype HSPCs were randomly sampled from ET01-ET05 for each round of analysis (n = 1000 iterations, Wilcoxon-rank sum test, two-sided).
Extended Data Figure 7. ATF6 and IRE1 branches of the unfolded protein response are activated in CALR-mutated progenitor cells.
By samples, expression of ATF6-, PERK- and XBP1-target genes in the unfolded protein response in CALR wildtype and mutant MkPs and HSPCs (Wilcoxon rank-sum test, two-sided).
Extended Data Figure 8. CALR-mutated hematopoietic progenitor cells from myelofibrosis show upregulation of the IRE1-unfolded protein response.
a, t-SNE projection of CD34+ progenitor cells from samples MF01-MF04, after integration and batch-correction using the Seurat package (see Methods, n = 11,093). b, t-SNE projection of CD34+ progenitor cells from samples MF01-MF04 labeled with pseuodotime21 (left, n = 11,093). Pseudotime comparison between wildtype (n = 2221) and mutant (n = 7483) cells. P-values from likelihood ratio tests of linear mixed model (LMM) with genotype as fixed effect and individual patient samples as random effect, against the model without the genotype effect (see Methods). c, Cell cycle module score comparison between wildtype and mutant cells in MF patients (Wilcoxon rank-sum test, two-sided). d, Ratio of TGFβ signaling pathway gene expression of mutant and wildtype MkPs. One mutant and one wildtype MkPs were randomly sampled for each round of analysis (n = 100 iterations; Wilcoxon-rank sum test, two-sided). e, Differentially expressed genes between wildtype MkPs with high cell cycle expression (n = 220) vs. wildtype MkPs with low cell cycle expression (n = 110) common across patient samples MF02-MF04. P-values were combined using Fisher combine test with Benjamini-Hochberg adjustments. Weighted average of log2(fold change) based on cell number across samples is shown (see Methods).
Extended Data Figure 9. Deciphering subclonal progenitor identities using multiplex GoT and targeting loci distant from transcript ends using circularization GoT.
a, Single-cell cloning assay of peripheral blood cells from MF05 patient (see Methods). b, Rate of targeted locus capture (%) as a function of gene expression and distance of targeted locus from the transcript ends. c, Distance of mutation locus from transcript ends for pan-cancer drivers and their frequencies based on the number of times reported in the Catalogue of Somatic Mutations in Cancer (COSMIC) database. Mutations are annotated as oncogenes, tumor suppressor genes, or passengers (as defined in Vogelstein et al. 201360 and Bailey et al. 201861). Relative density of each subclass of mutations from the closer end (i.e. 3’ or 5’) is shown in the upper panel. d, Schematic of analysis of Oxford Nanopore Technology (ONT) sequencing reads. e, Frequency of SF3B1 mutant and wildtype reads of linear GoT amplicon library sequenced with ONT. f, Analysis of SF3B1 amplicon reads sequenced by Oxford Nanopore Technology (ONT) for inter-transcript PCR recombination by mapping 50 bps at the opposite end of the targeted locus showing only 2.2% of fragments that reflect inter-transcript recombination. g, Pairwise difference of read lengths for duplicate reads (i.e. reads with the same CB+UMI barcodes) of SF3B1 amplicon library sequenced with ONT, showing consistent read length of duplicates supporting a low rate of intra-transcript PCR recombination. h, Comparison of genotype assignment for CALR in patient sample MF01 between linear GoT and circularization GoT after downsampling reads to 300K with 10 iterations (n = 320 cells). i, Comparison of CALR-mutant UMI fraction per cell in patient sample MF01 between linear GoT and circularization GoT after downsampling reads to 300K with 10 iterations (n = 320 cells, Pearson’s correlation, F-test).
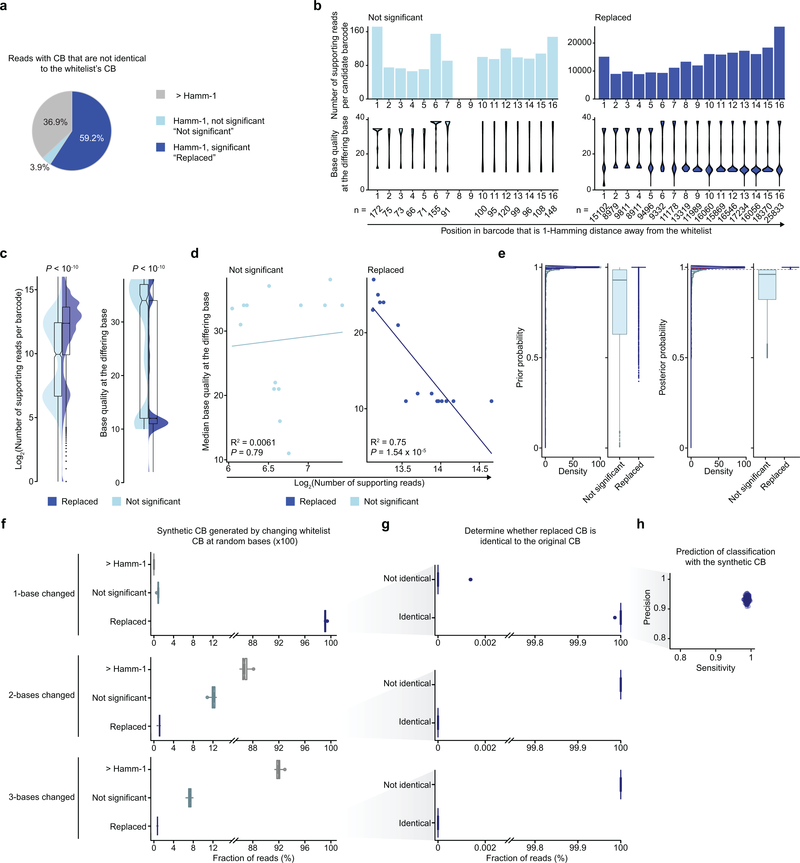
Extended Data Figure 10. Evaluation of barcode replacement in IronThrone GoT processing.
a, Fraction of reads with cell barcodes (CB) that are not perfectly matched to the whitelist CB from the species-mixing experiment. >Hamm-1, filtered reads with barcodes that are greater than 1-Hamming distance away from whitelisted barcodes (n = 139,422 reads); Not significant, filtered reads with barcodes that are 1-Hamming distance away from the whitelisted barcodes but no statistical significance (posterior probability < 0.99, n = 14830 reads); replaced, rescued reads with barcodes that have candidates of 1-Hamming distance away from the whitelisted barcodes with statistical significance (posterior probability ≥ 0.99, n = 224085 reads). b, Number of supporting reads per candidate barcode and base quality at the differing base positions and c, across base positions. Wilcoxon rank-sum tests (two-sided) were applied to compare not replaced (n = 14,830) and replaced (n = 224,085) barcodes. d, Correlation between the number of supporting reads per candidate barcode and median base quality at the differing base (two-tailed Pearson’s correlation, F-test). e, Distribution of prior and posterior probabilities from not significant (n = 14,830) and replaced (n = 224,085) barcodes. The dashed red line represents the posterior probability cutoff (0.99). f-h, To further evaluate the efficiency of barcode replacement, we generated synthetic CB by randomly changing one base in whitelist CBs (n = 100 iterations). f, Fraction of reads with CB that are not identical to the whitelist CB (n = 100 iterations). Percentage of replaced reads were 99.1% ± 0.001% (median ± absolute deviation) in 1-base changed, 1.1% ± 0.002% in 2-bases changed, and 0.7 ± 0.001% in 3-bases changed simulations. g, Determination of whether replaced CB are identical to the original CB. In 1-base change simulations, percentage of reads with replaced CB that were identical to the original CB was 100.0 ± 0.0% (median ± absolute deviation of 100 iterations). h, Estimation of prediction power for classifying CB from 1-base changed simulations (n = 100 iterations).
Supplementary Material
ACKNOWLEDGMENTS
The work was enabled by the Weill Cornell Epigenomics Core and Flow Cytometry Core. We thank Dr. Ann Mullally (Brigham and Women’s Hospital) for sharing the cell lines for the species-mixing study and Dr. Nicole Kuchine for helping us acquire a patient sample. R.C. is supported by Lymphoma Research Foundation and Marie Skłodowska-Curie fellowships. G.A.Z. and J.M.S are supported by Cancer Research & Treatment fund (CR&T). D.A.L. is supported by the Burroughs Wellcome Fund Career Award for Medical Scientists, the American Society of Hematology Scholar Award, Pershing Square Sohn Prize for Young Investigators in Cancer Research, and the National Institutes of Health Director’s New Innovator Award (DP2-CA239065). This work was also supported by the Leukemia Lymphoma Society Translational Research Program, Columbia University Physical Sciences in Oncology Center Pilot Grant (U54CA193313), National Heart Lung and Blood Institute (R01HL145283-01), and Stand Up To Cancer Innovative Research Grant (SU2C-AACR-IRG-0616). Stand Up To Cancer is a program of the Entertainment Industry Foundation. Research grants are administered by the American Association for Cancer Research, the scientific partner of SU2C.
Footnotes
COMPETING INTERESTS The authors declare no competing interests.
Data availability. All of the sequencing data is available via Gene Expression Omnibus (GEO) under the accession number GSE117826.
Code availability. IronThrone-GoT pipeline is available on GitHub at https://github.com/landau-lab/IronThrone-GoT.
REFERENCES
- 1.Sperling AS, Gibson CJ & Ebert BL The genetics of myelodysplastic syndrome: from clonal haematopoiesis to secondary leukaemia. Nat Rev Cancer 17, 5–19 (2017). [DOI] [PMC free article] [PubMed] [Google Scholar]
- 2.Landau DA, et al. The evolutionary landscape of chronic lymphocytic leukemia treated with ibrutinib targeted therapy. Nat Commun 8, 2185 (2017). [DOI] [PMC free article] [PubMed] [Google Scholar]
- 3.Burger JA, et al. Clonal evolution in patients with chronic lymphocytic leukaemia developing resistance to BTK inhibition. Nat Commun 7, 11589 (2016). [DOI] [PMC free article] [PubMed] [Google Scholar]
- 4.Landau DA, et al. Evolution and impact of subclonal mutations in chronic lymphocytic leukemia. Cell 152, 714–726 (2013). [DOI] [PMC free article] [PubMed] [Google Scholar]
- 5.Landau DA, et al. Mutations driving CLL and their evolution in progression and relapse. Nature 526, 525–530 (2015). [DOI] [PMC free article] [PubMed] [Google Scholar]
- 6.Nangalia J, et al. Somatic CALR mutations in myeloproliferative neoplasms with nonmutated JAK2. N Engl J Med 369, 2391–2405 (2013). [DOI] [PMC free article] [PubMed] [Google Scholar]
- 7.Klampfl T, et al. Somatic mutations of calreticulin in myeloproliferative neoplasms. N Engl J Med 369, 2379–2390 (2013). [DOI] [PubMed] [Google Scholar]
- 8.Giustacchini A, et al. Single-cell transcriptomics uncovers distinct molecular signatures of stem cells in chronic myeloid leukemia. Nat Med 23, 692–702 (2017). [DOI] [PubMed] [Google Scholar]
- 9.Cheow LF, et al. Single-cell multimodal profiling reveals cellular epigenetic heterogeneity. Nat Methods 13, 833–836 (2016). [DOI] [PubMed] [Google Scholar]
- 10.Macosko EZ, et al. Highly Parallel Genome-wide Expression Profiling of Individual Cells Using Nanoliter Droplets. Cell 161, 1202–1214 (2015). [DOI] [PMC free article] [PubMed] [Google Scholar]
- 11.Klein AM, et al. Droplet barcoding for single-cell transcriptomics applied to embryonic stem cells. Cell 161, 1187–1201 (2015). [DOI] [PMC free article] [PubMed] [Google Scholar]
- 12.Elf S, et al. Mutant Calreticulin Requires Both Its Mutant C-terminus and the Thrombopoietin Receptor for Oncogenic Transformation. Cancer Discov 6, 368–381 (2016). [DOI] [PMC free article] [PubMed] [Google Scholar]
- 13.Defour JP, Chachoua I, Pecquet C & Constantinescu SN Oncogenic activation of MPL/thrombopoietin receptor by 17 mutations at W515: implications for myeloproliferative neoplasms. Leukemia 30, 1214–1216 (2016). [DOI] [PubMed] [Google Scholar]
- 14.Kollmann K, et al. A novel signalling screen demonstrates that CALR mutations activate essential MAPK signalling and facilitate megakaryocyte differentiation. Leukemia 31, 934–944 (2017). [DOI] [PMC free article] [PubMed] [Google Scholar]
- 15.Marty C, et al. Calreticulin mutants in mice induce an MPL-dependent thrombocytosis with frequent progression to myelofibrosis. Blood 127, 1317–1324 (2016). [DOI] [PubMed] [Google Scholar]
- 16.Nivarthi H, et al. Thrombopoietin receptor is required for the oncogenic function of CALR mutants. Leukemia 30, 1759–1763 (2016). [DOI] [PMC free article] [PubMed] [Google Scholar]
- 17.Satija R, Farrell JA, Gennert D, Schier AF & Regev A Spatial reconstruction of single-cell gene expression data. Nat Biotechnol 33, 495–502 (2015). [DOI] [PMC free article] [PubMed] [Google Scholar]
- 18.Stuart T, et al. Comprehensive integration of single cell data. bioRxiv, 460147 (2018). [DOI] [PMC free article] [PubMed] [Google Scholar]
- 19.Lopez R, Regier J, Cole MB, Jordan MI & Yosef N Deep generative modeling for single-cell transcriptomics. Nat Methods 15, 1053–1058 (2018). [DOI] [PMC free article] [PubMed] [Google Scholar]
- 20.Trapnell C, et al. The dynamics and regulators of cell fate decisions are revealed by pseudotemporal ordering of single cells. Nat Biotechnol 32, 381–386 (2014). [DOI] [PMC free article] [PubMed] [Google Scholar]
- 21.Farrell JA, et al. Single-cell reconstruction of developmental trajectories during zebrafish embryogenesis. Science 360(2018). [DOI] [PMC free article] [PubMed] [Google Scholar]
- 22.Chen E, et al. Distinct clinical phenotypes associated with JAK2V617F reflect differential STAT1 signaling. Cancer Cell 18, 524–535 (2010). [DOI] [PMC free article] [PubMed] [Google Scholar]
- 23.Rampal R, et al. Integrated genomic analysis illustrates the central role of JAK-STAT pathway activation in myeloproliferative neoplasm pathogenesis. Blood 123, e123–133 (2014). [DOI] [PMC free article] [PubMed] [Google Scholar]
- 24.Tirosh I, et al. Dissecting the multicellular ecosystem of metastatic melanoma by single-cell RNA-seq. Science 352, 189–196 (2016). [DOI] [PMC free article] [PubMed] [Google Scholar]
- 25.Georgantas RW 3rd, et al. Microarray and serial analysis of gene expression analyses identify known and novel transcripts overexpressed in hematopoietic stem cells. Cancer Res 64, 4434–4441 (2004). [DOI] [PubMed] [Google Scholar]
- 26.Velten L, et al. Human haematopoietic stem cell lineage commitment is a continuous process. Nat Cell Biol 19, 271–281 (2017). [DOI] [PMC free article] [PubMed] [Google Scholar]
- 27.Hetz C & Papa FR The Unfolded Protein Response and Cell Fate Control. Mol Cell 69, 169–181 (2018). [DOI] [PubMed] [Google Scholar]
- 28.Pronier E, et al. Targeting the CALR interactome in myeloproliferative neoplasms. JCI Insight 3(2018). [DOI] [PMC free article] [PubMed] [Google Scholar]
- 29.Lau WW, Hannah R, Green AR & Gottgens B The JAK-STAT signaling pathway is differentially activated in CALR-positive compared with JAK2V617F-positive ET patients. Blood 125, 1679–1681 (2015). [DOI] [PMC free article] [PubMed] [Google Scholar]
- 30.Shivarov V, Ivanova M & Tiu RV Mutated calreticulin retains structurally disordered C terminus that cannot bind Ca(2+): some mechanistic and therapeutic implications. Blood Cancer J 4, e185 (2014). [DOI] [PMC free article] [PubMed] [Google Scholar]
- 31.Zini R, et al. CALR mutational status identifies different disease subtypes of essential thrombocythemia showing distinct expression profiles. Blood Cancer J 7, 638 (2017). [DOI] [PMC free article] [PubMed] [Google Scholar]
- 32.Wu J, et al. ATF6alpha optimizes long-term endoplasmic reticulum function to protect cells from chronic stress. Dev Cell 13, 351–364 (2007). [DOI] [PubMed] [Google Scholar]
- 33.van Galen P, et al. The unfolded protein response governs integrity of the haematopoietic stem-cell pool during stress. Nature 510, 268–272 (2014). [DOI] [PubMed] [Google Scholar]
- 34.Lee AH, Iwakoshi NN & Glimcher LH XBP-1 regulates a subset of endoplasmic reticulum resident chaperone genes in the unfolded protein response. Mol Cell Biol 23, 7448–7459 (2003). [DOI] [PMC free article] [PubMed] [Google Scholar]
- 35.Cubillos-Ruiz JR, et al. ER Stress Sensor XBP1 Controls Anti-tumor Immunity by Disrupting Dendritic Cell Homeostasis. Cell 161, 1527–1538 (2015). [DOI] [PMC free article] [PubMed] [Google Scholar]
- 36.Yoshida H, Matsui T, Yamamoto A, Okada T & Mori K XBP1 mRNA is induced by ATF6 and spliced by IRE1 in response to ER stress to produce a highly active transcription factor. Cell 107, 881–891 (2001). [DOI] [PubMed] [Google Scholar]
- 37.Luo JL, Kamata H & Karin M IKK/NF-kappaB signaling: balancing life and death--a new approach to cancer therapy. J Clin Invest 115, 2625–2632 (2005). [DOI] [PMC free article] [PubMed] [Google Scholar]
- 38.Stein SJ & Baldwin AS Deletion of the NF-kappaB subunit p65/RelA in the hematopoietic compartment leads to defects in hematopoietic stem cell function. Blood 121, 5015–5024 (2013). [DOI] [PMC free article] [PubMed] [Google Scholar]
- 39.Abu-Zeinah G, et al. Myeloproliferative Neoplasm (MPN) Driver Mutations Are Enriched during Hematopoietic Stem Cell Differentiation in Patterns That Correlate with Clinical Phenotype and Treatment Response. Blood 132, 4317 (2018). [Google Scholar]
- 40.Castro-Malaspina H, Rabellino EM, Yen A, Nachman RL & Moore MA Human megakaryocyte stimulation of proliferation of bone marrow fibroblasts. Blood 57, 781–787 (1981). [PubMed] [Google Scholar]
- 41.Ciurea SO, et al. Pivotal contributions of megakaryocytes to the biology of idiopathic myelofibrosis. Blood 110, 986–993 (2007). [DOI] [PMC free article] [PubMed] [Google Scholar]
- 42.Terui T, et al. The production of transforming growth factor-beta in acute megakaryoblastic leukemia and its possible implications in myelofibrosis. Blood 75, 1540–1548 (1990). [PubMed] [Google Scholar]
- 43.Obeng EA, et al. Physiologic Expression of Sf3b1(K700E) Causes Impaired Erythropoiesis, Aberrant Splicing, and Sensitivity to Therapeutic Spliceosome Modulation. Cancer Cell 30, 404–417 (2016). [DOI] [PMC free article] [PubMed] [Google Scholar]
- 44.Saikia M, et al. Simultaneous multiplexed amplicon sequencing and transcriptome profiling in single cells. Nat Methods 16, 59–62 (2019). [DOI] [PMC free article] [PubMed] [Google Scholar]
- 45.Hill AJ, et al. On the design of CRISPR-based single-cell molecular screens. Nat Methods 15, 271–274 (2018). [DOI] [PMC free article] [PubMed] [Google Scholar]
- 46.Kleppe M, et al. Dual Targeting of Oncogenic Activation and Inflammatory Signaling Increases Therapeutic Efficacy in Myeloproliferative Neoplasms. Cancer Cell 33, 785–787 (2018). [DOI] [PMC free article] [PubMed] [Google Scholar]
- 47.Mu P, et al. SOX2 promotes lineage plasticity and antiandrogen resistance in TP53- and RB1-deficient prostate cancer. Science 355, 84–88 (2017). [DOI] [PMC free article] [PubMed] [Google Scholar]
- 48.Suva ML, et al. Reconstructing and reprogramming the tumor-propagating potential of glioblastoma stem-like cells. Cell 157, 580–594 (2014). [DOI] [PMC free article] [PubMed] [Google Scholar]
- 49.Geyer JT, et al. Oligomonocytic chronic myelomonocytic leukemia (chronic myelomonocytic leukemia without absolute monocytosis) displays a similar clinicopathologic and mutational profile to classical chronic myelomonocytic leukemia. Mod Pathol 30, 1213–1222 (2017). [DOI] [PubMed] [Google Scholar]
- 50.Butler A, Hoffman P, Smibert P, Papalexi E & Satija R Integrating single-cell transcriptomic data across different conditions, technologies, and species. Nature Biotechnology 36, 411 (2018). [DOI] [PMC free article] [PubMed] [Google Scholar]
- 51.Bolker BM, et al. Generalized linear mixed models: a practical guide for ecology and evolution. Trends Ecol Evol 24, 127–135 (2009). [DOI] [PubMed] [Google Scholar]
- 52.Liaw A & Wiener M Classification and Regression by randomForest. R News 2, 18–22 (2002). [Google Scholar]
- 53.Reinius B & Sandberg R Random monoallelic expression of autosomal genes: stochastic transcription and allele-level regulation. Nature Reviews Genetics 16, 653 (2015). [DOI] [PubMed] [Google Scholar]
- 54.Zheng GXY, et al. Massively parallel digital transcriptional profiling of single cells. Nature Communications 8, 14049 (2017). [DOI] [PMC free article] [PubMed] [Google Scholar]
- 55.Ntranos V, Yi L, Melsted P & Pachter L A discriminative learning approach to differential expression analysis for single-cell RNA-seq. Nat Methods 16, 163–166 (2019). [DOI] [PubMed] [Google Scholar]
- 56.Reimand J, et al. g:Profiler-a web server for functional interpretation of gene lists (2016 update). Nucleic Acids Res 44, W83–89 (2016). [DOI] [PMC free article] [PubMed] [Google Scholar]
- 57.Rhee JK, Lee S, Park WY, Kim YH & Kim TM Allelic imbalance of somatic mutations in cancer genomes and transcriptomes. Sci Rep 7, 1653 (2017). [DOI] [PMC free article] [PubMed] [Google Scholar]
- 58.Li H, et al. The Sequence Alignment/Map format and SAMtools. Bioinformatics 25, 2078–2079 (2009). [DOI] [PMC free article] [PubMed] [Google Scholar]
- 59.Forbes SA, et al. COSMIC: somatic cancer genetics at high-resolution. Nucleic Acids Res 45, D777–D783 (2017). [DOI] [PMC free article] [PubMed] [Google Scholar]
- 60.Vogelstein B, et al. Cancer genome landscapes. Science 339, 1546–1558 (2013). [DOI] [PMC free article] [PubMed] [Google Scholar]
- 61.Bailey MH, et al. Comprehensive Characterization of Cancer Driver Genes and Mutations. Cell 174, 1034–1035 (2018). [DOI] [PMC free article] [PubMed] [Google Scholar]
- 62.Durinck S, Spellman PT, Birney E & Huber W Mapping identifiers for the integration of genomic datasets with the R/Bioconductor package biomaRt. Nat Protoc 4, 1184–1191 (2009). [DOI] [PMC free article] [PubMed] [Google Scholar]
- 63.Li H Minimap2: pairwise alignment for nucleotide sequences. Bioinformatics 34, 3094–3100 (2018). [DOI] [PMC free article] [PubMed] [Google Scholar]
Associated Data
This section collects any data citations, data availability statements, or supplementary materials included in this article.


