

Abstract
Pathophysiological, lesion, and electrophysiological studies suggest that the cerebellar cortex is important for controlling the direction and speed of movement. The relationship of cerebellar Purkinje cell discharge to the control of arm movement parameters, however, remains unclear. The goal of this study was to examine how movement direction and speed and their interaction—velocity—modulate Purkinje cell simple spike discharge in an arm movement task in which direction and speed were independently controlled. The simple spike discharge of 154 Purkinje cells was recorded in two monkeys during the performance of two visuomotor tasks that required the animals to track targets that moved in one of eight directions and at one of four speeds. Single-parameter regression analyses revealed that a large proportion of cells had discharge modulation related to movement direction and speed. Most cells with significant directional tuning, however, were modulated at one speed, and most cells with speed-related discharge were modulated along one direction; this suggested that the patterns of simple spike discharge were not adequately described by single-parameter models. Therefore, a regression surface was fitted to the data, which showed that the discharge could be tuned to specific direction–speed combinations (preferred velocities). The overall variability in simple spike discharge was well described by the surface model, and the velocities corresponding to maximal and minimal discharge rates were distributed uniformly throughout the workspace. Simple spike discharge therefore appears to integrate information about both the direction and speed of arm movements, thereby encoding movement velocity.
Keywords: cerebellum, simple spike, direction, speed, velocity, primate, arm, tracking
The cerebellum’s role in the control of visually guided movements has been the subject of much recent research (for review, see Stein and Glickstein, 1992; Ebner and Fu, 1997). Humans with cerebellar pathology demonstrate poor performance in measures of speed or velocity perception (Ivry and Diener, 1991; Grill et al., 1994), hand–target mismatch in oculomanual tracking (van Donkelaar and Lee, 1994), and inconsistent specification of movement direction (Becker et al., 1991). Lesion and inactivation experiments in animals support these observations, finding decreased coordination of ocular and manual motor systems (Vercher and Gauthier, 1988) and increased error during hand tracking (Miall et al., 1987). Cerebellar lesions produce deficits in the control of movement speed or velocity that include disruption of the normal bell-shaped velocity profile (Holmes, 1939; Beppu et al., 1984; Miall et al., 1987; Hore et al., 1991; Diener and Dichgans, 1992). These studies show that the cerebellum plays an important role in the execution of visually guided movements and suggest that cerebellar neurons may participate in the specification of movement parameters such as direction, speed, and velocity.
Although the relationship of kinematic parameters to the discharge of cerebellar neurons has been well characterized for eye tracking movements (Suzuki and Keller, 1988; Stone and Lisberger, 1990; Shidara et al., 1993; Krauzlis and Lisberger, 1994; Ohtsuka and Noda, 1995), less is known with regard to reaching or tracking movements with the arm (Ebner and Fu, 1997). Studies of Purkinje cell simple spike discharge during ballistic wrist or arm movements have found correlations with movement direction (Marple-Horvat and Stein, 1987;Fortier et al., 1989, 1993; Fu et al., 1997), distance (Fu et al., 1997), target position (Fu et al., 1997), and velocity (Mano and Yamamoto, 1980; Frysinger et al., 1984; Marple-Horvat and Stein, 1987). Input elements to the intermediate cerebellum discharge phasically in relation to arm movement direction and speed (van Kan et al., 1993b), and it has been hypothesized that the intermediate cerebellum generates a velocity command signal (van Kan et al., 1993a). Positron emission tomography has shown that the ipsilateral cerebellum is activated in relation to movement velocity during a visuomotor tracking task (Turner et al., 1998). In a recent study (Fu et al., 1997), simple spike discharge rate was correlated with movement direction, distance, and target position; these parameters, however, accounted for only one-third of the overall variability in simple spike rate. This finding suggests that simple spike discharge may be correlated more strongly with parameters other than those studied, such as speed or velocity.
The experiment described here correlated Purkinje cell simple spike discharge in primates to movement direction and speed using two visuomotor arm tracking tasks. Two main questions were addressed: (1) What is the effect of movement direction and speed on simple spike discharge before movement and during tracking? (2) To what extent are direction–speed interactions (i.e., velocities) encoded in simple spike discharge? It is shown that movement direction and speed are important determinants of Purkinje cell simple spike discharge rate. For a large number of cells, however, the simple spike discharge is most strongly modulated at specific direction–speed combinations. That is, when examined across the workspace, the discharge of these cells was tuned to both movement direction and speed and therefore had a preferred velocity.
MATERIALS AND METHODS
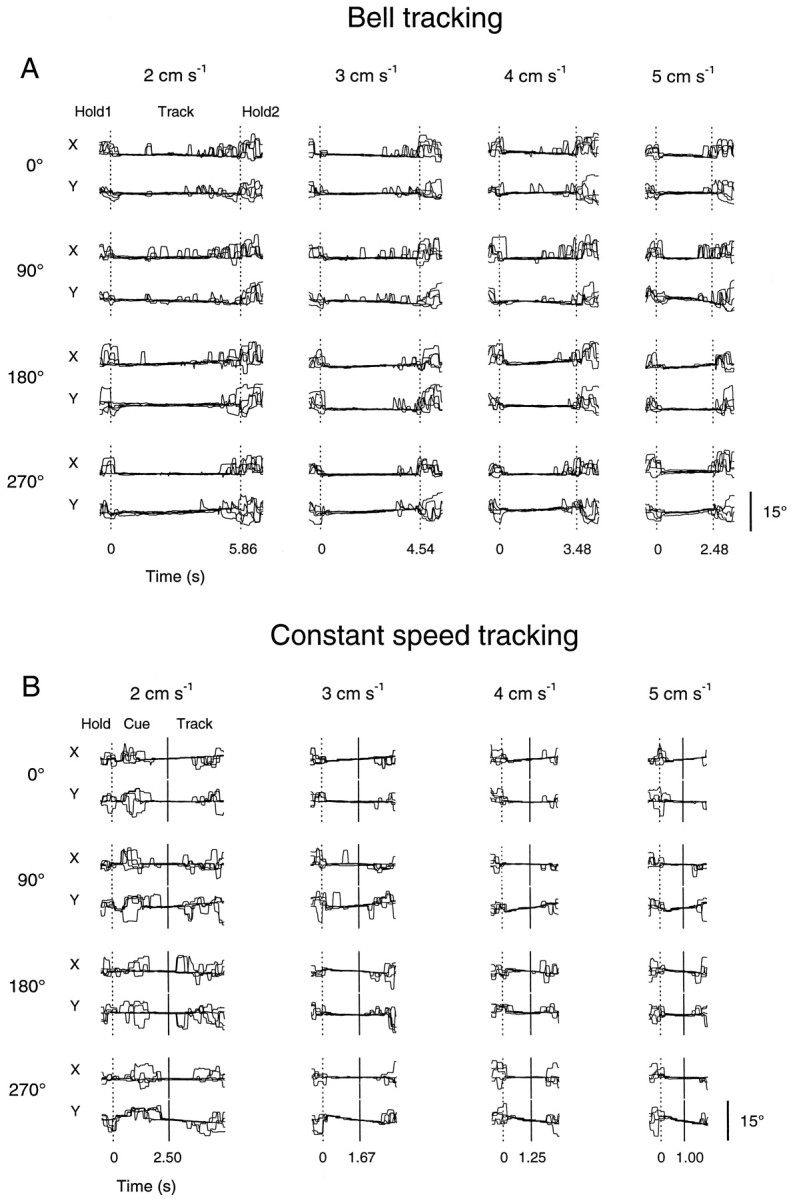
Tracking tasks. All experimental procedures were conducted in accord with the National Institutes of Health Guide for the Care and Use of Laboratory Animals. Two female rhesus monkeys (Macaca mulatta, 4–6 kg) served as subjects in this study. These were the same two animals (C and D) included in a study of premotor and motor cortical discharge (Johnson et al., 1999). Each animal used a two-joint manipulandum to make visually guided arm tracking movements in the horizontal plane. The manipulandum controlled the position of a cross-hair cursor (0.8 cm diameter) that was displayed on a vertically positioned color monitor, located ∼45 cm from the animal’s chest. Two tasks required the animal to track moving, square targets (1.44 cm2) that appeared on the monitor. In the “bell” tracking task, the animal tracked targets that moved with bell-shaped speed profiles (Fig.1A,C). The animal first superimposed and held the cursor [initial hold period (Hold1)] over a centrally positioned start target (1.44 cm2) for a randomized period (0.75–1.25 sec). The target then began to move in one of eight equally spaced directions (0–315° in 45° intervals) and at one of four speed profiles (peak speeds, 2, 3, 4, and 5 cm/sec). The animal was required to track the moving target, maintaining the center of the cursor within the target’s confines for a distance of 5 cm. The speeds of the targets in this task were generated using the equation for the normal curve:f(x) = (1/ς√2π)e−(1/2)[(x − μ)/ς]2. The parameters μ and ς were adjusted such that the movement period, or track period, had durations of 5.86, 4.54, 3.48, and 2.48 sec for the peak target speeds of 2, 3, 4, and 5 cm/sec, respectively. A second hold period (Hold2; 1–1.5 sec) followed the track period.
Fig. 1.

Tracking tasks. A, The bell tracking task required the animals to track targets that moved with bell-shaped speed profiles. The animal first superimposed a cross-hair cursor over the central start target (Hold1); the target then began to move in one of eight directions and at one of four speed profiles. The animal tracked the target (Track) for a distance of 5 cm to the end point (Hold2).B, The constant speed tracking task required the animals to track targets that moved at constant speeds. The animal first held the cursor in the start target (Hold); a cue target (Cue) then appeared 5 cm radial to the start target and moved toward it at a constant speed. When the cue target intersected the center hold target, the animal began to track the moving target (Track) in the same direction and at the same speed as the cue target for a distance of 5 cm. C, Schematic of the target movement in the bell tracking task as a function of time and period. First and second vertical dotted lines mark the Hold1 period–Track period and Track period–Hold2 period transitions, respectively. Height of dotted lines indicates peak target speed. D, Schematic of the target movement in the constant speed tracking task as a function of time and period. Vertical dotted andsolid lines mark the Hold period–Cue period and Cue period–Track period transitions, respectively. Height ofvertical lines indicates constant target speed.
In the “constant speed” tracking task, the animal tracked targets (1.44 cm2) that moved at constant speeds (Fig.1B,D). A trial began when the animal positioned the cursor in the central start target (1.44 cm2) for a randomized interval (hold period; 0.75–1.25 sec). Then, a premovement period (cue period) began during which the animal was required to maintain the cursor’s center in the start target. During the cue period, another target (cue target) appeared at one of eight randomly selected directions (0–315° in 45° intervals) and at a distance of 5 cm from the central start target. The cue target then moved toward the start target at one of four constant speeds (2, 3, 4, and 5 cm/sec). The movement period (track period) began when the cue target intersected and moved uninterrupted through the start target; the start target was then extinguished, and the animal tracked the moving target in the same direction and speed as the cue target for a distance of 5 cm. It should be emphasized that the movement of the cue target signaled the direction and speed of the upcoming tracking movement. This cue period has some similarities to the instructed delay periods used in studies of dorsal premotor and primary motor cortex (Boussaoud and Wise, 1993; Crammond and Kalaska, 1994; Shen and Alexander, 1997). For each target speed, the cue and track periods were equal in duration: 2.5, 1.67, 1.25, and 1 sec for speeds of 2, 3, 4, and 5 cm/sec, respectively. No final hold period was required. In both tasks, deviation of the center of the cursor from the start target or the tracked target aborted the trial and started a new trial that was randomized with respect to direction and speed. The dimensions and size of the screen workspace and targets were identical to those of the actual physical workspace. In addition, the animal could view its hand and the manipulandum, but the tracking requirement of the task demanded that the animal concentrate on the screen. Successful trials were followed by a juice reward, and after an interval of 4–8 sec, a new trial was initiated. Each of the 32 direction–speed combinations was repeated 5–10 times, for a total of 160–320 trials per cell.
Surgery, electrophysiology, and histology. After a 6–9 month task training period, the animals underwent stereotaxic placement of a chronic stainless steel recording chamber (19 mm inner diameter) and implantation of a head fixation halo. The chambers were placed ipsilateral to the working arm, over right parietal cortex in animal C and over left parietal cortex in D. Surgery was performed under aseptic conditions and with full surgical anesthesia (ketamine, 20 mg · kg−1 · hr−1; and xylazine, 1–2 mg · kg−1 · hr−1); postoperative analgesics (buprenorphine, 0.05 mg/kg) and antibiotics (ampicillin, 250 mg · kg−1 · d−1) were administered.
After recovery, the simple and complex spike discharge of cerebellar Purkinje cells was recorded extracellularly (Ojakangas and Ebner, 1992) using paralyene-coated tungsten microelectrodes (tip impedance, 6–10 MΩ). Signals were amplified, time–amplitude discriminated, and converted to pulses before digitization and storage to computer at 1 kHz. These data were then compressed into bin widths of 20 msec and averaged over the 5–10 movements for each direction–speed combination. Because 160–320 movement trials were required for a complete data set, the simple and complex spike discharge of each cell was recorded only during the performance of one of the two tasks. Cells were studied only if both simple and complex spikes were discriminable and if discharge was task-related during active reaching or passive manipulation of the shoulder, elbow, or wrist joints. The latter included cutaneous stimuli delivered to the hand and wrist, arm and elbow, and shoulder, as well as deeper somatosensory manipulation and passive movements in different directions.
After completion of all cell recordings, electromyographic (EMG) activity and eye position data were recorded in both animals during performance of both tasks. The tracking movements of each animal were determined by calculating the x and y positions of the manipulandum from the output of two potentiometers placed at the manipulandum’s joints. The position data were sampled at 1 kHz and drove the cursor in real time on the video monitor. Speed and velocity were calculated by numerical differentiation of the position signal. EMG activity was recorded from 10 different shoulder, elbow, and wrist muscles [acromiodeltoid, spinodeltoid, latissimus dorsi, biceps (long and short heads), triceps (long head), extensor carpi radialis and ulnaris, and flexor carpi radialis and ulnaris] over several sessions, using intramuscular, Teflon-coated wire electrodes. The EMG signals were amplified, filtered (10–1000 Hz), sampled at 2 kHz, and digitally rectified. Eye movements were recorded using an infrared oculometer (Bouis Instruments). The vertical and horizontal eye position data were sampled at 200 Hz and compressed into 20 msec bin widths. During both the EMG and eye movement recordings, the animals made 5–10 movements at each of the direction–speed combinations for a total of 160–320 movements.
After all cell, muscle, and eye movement recordings, electrolytic lesions were made, and pins were placed at selected recording sites and chamber coordinates for histological analysis. The animals were given an intraperitoneal injection of pentobarbital sodium (150 mg/kg), exsanguinated, and perfused with saline containing heparin, followed by Zamboni’s fixative (4.3 gm of NaOH, 20 gm of paraformaldehyde, 18.8 gm of NaH2PO4, and 150 ml of picric acid in 850 ml of H2O). After removal from the posterior fossa, the cerebellum was post-fixed; at a later date, the cerebellum was sectioned (50 μm) and stained with thionin to recover pin and electrode tracks.
Data analysis. The neuronal data were aligned to the onset of target movement in the bell tracking task and to the appearance of the cue target in the constant speed task. One-way ANOVA was used to compare the mean simple spike discharge rates across the initial hold, track, and final hold periods in the bell tracking task and across the hold, cue, and track periods in the constant speed task. Cells for which the simple spike discharge was modulated significantly (p < 0.05) were subject to further analysis. In addition, the latency of a significant change in simple spike discharge for each task-modulated cell was determined. For the bell and constant speed tasks, the latency was defined as the time at which the simple spike discharge changed by ±3 SD from the mean discharge rate during the hold period.
Two regression analyses were conducted (1) to determine the magnitude and extent of linear relationships between simple spike discharge rate and movement direction at each movement speed, and between discharge and speed at each movement direction, and (2) to determine, using a response surface approach, whether a model that allowed for linear as well as nonlinear variation in simple spike discharge provided a better description of this discharge in relation to movement direction, speed, and their interaction, velocity. Both of these analyses were also applied to the EMG data.
Before describing the regression analyses in detail, operational definitions for speed and velocity are needed. As commonly defined, speed is a scalar quantity that describes the rate of displacement irrespective of direction. A neuron exhibiting “pure” speed modulation would vary its discharge with speed regardless of the direction of the movement. Velocity is a vector quantity that describes the rate of displacement along a particular direction. A neuron exhibiting pure velocity modulation would vary its discharge with both speed and direction.
Regression analyses were performed on the mean cell discharge rate during the track period for the bell tracking task. For the constant speed tracking task the regression analyses were performed using the mean discharge during the cue and track periods separately. The first analysis evaluated the linear relationships of simple spike discharge rate to movement direction and speed by fitting the average simple spike discharge rate (fi) at each target movement direction (θ) to a cosine tuning model for each target speed (Georgopoulos et al., 1982; Schwartz et al., 1988; Fu et al., 1993):
| Equation 1 |
This is expressed alternatively as
| Equation 2 |
The peak of the cosine function corresponds to the direction in which cell discharge rate was highest and is referred to as the preferred direction (PD; θPD in Eq. 2) of the cell (Mardia, 1972; Georgopoulos et al., 1982; Fisher, 1993). The regression coefficients β0 and γ1 (Eq. 2) represent the mean discharge rate over all directions and the discharge modulation as a function of direction, respectively; ɛirepresents the statistical error. An index of the depth of cell discharge modulation with direction (Idir) was given asIdir = γ1/β0(Georgopoulos et al., 1982; Fu et al., 1993). The proportion of variability in mean cell discharge rate accounted for by changes in movement direction was given by the coefficient of determination (R2); a statistically significant relationship (p < 0.05) between discharge rate and movement direction required an R2value > 0.7 (Eq. 1).
The mean simple spike discharge rate (fi) for each peak target speed (bell tracking task) or constant target speed (constant speed tracking task) was analyzed over each of the eight movement directions using a simple linear regression model:
| Equation 3 |
Here, β1 represents the change in mean discharge rate (spikes/sec per cm/sec) with unit increases in speed (s) along a given direction. A statistically significant relationship between speed and cell discharge rate required anR2 value > 0.9 (p < 0.05). It needs to be stressed that the results of this regression analysis can be interpreted as a linear correlation with speed or velocity depending on whether the model yields a significant fit along most directions (speed) or in limited directions (velocity). A strict division between speed and velocity here is difficult to define. In addition, this model assumes alinear relationship between cell discharge and speed—an assumption that may or may not be correct (see Results).
As is shown in Results, the simple spike discharge of many Purkinje cells was modulated most commonly by changes in direction at one speed and by changes in speed along one direction. Furthermore, examination of the discharge rates across the direction–speed space suggested that reliance on a regression approach that did not allow for nonlinearity in the response may not have captured some features of the simple spike responses. The term “nonlinearity” is used here to describe nonmonotonic relations to speed or direction. For example, a cell’s discharge could be highly modulated by a specific combination of tracking direction and speed but not fit the single-parameter regression models for direction (Eqs. 1, 2) or speed (Eq. 3). A model was needed that accounted for variability in cell discharge over the entire direction–speed space. Therefore, the second analysis used a response surface methodology (Box and Draper, 1987) to assess the linear, quadratic, and interaction effects of direction and speed on simple spike discharge rate. The mean discharge rate at each level of direction and speed was fitted to a quadratic polynomial model:
| Equation 4 |
where [cos(θ − θPD)]i and [cos(θ − θPD)]i2represent the linear and quadratic predictors for movement direction,si and si2 are the linear and quadratic predictors representing movement speed, and [cos(θ − θPD) · s]idenotes the direction–speed cross-product. This cross-product term is related to velocity, that is, the linear interaction of direction and speed. A statistically significant fit of this model to the data required an R2 value > 0.33 (p < 0.05). Importantly, this response surface approach enabled determination of the direction–speed combinations (velocities) that resulted in both maximal and minimal discharge rates (also see Khuri and Cornell, 1996). This technique was therefore valuable in determining whether simple spike discharge was modulated linearly and/or nonlinearly with direction and speed and was ultimately used to show whether simple spike discharge could be tuned to movement velocity.
RESULTS
Task-related kinematics
The movement trajectories produced by the animals were tightly constrained by the tracking tasks and therefore highly stereotyped. The average hand paths and speed profiles recorded during the track periods of the bell and constant speed tasks are shown in Figure2 for all movement directions and speeds. It can be seen that the hand paths produced in both tasks are straight and similar for each movement speed (Fig. 2A,B). In addition, the speed profiles of the movements produced during the track period in both tasks (Fig. 2C,D) closely follow the speed profiles of the targets (Fig. 1C,D) and are similar for each movement direction. In the bell tracking task, there were few excursions in speed during the initial (Hold1) and final (Hold2) hold periods. During the track period of the constant speed task, there was often an early overshoot of the target, followed by an approximation to the constant speed of the target. Therefore, the animals were able to track the required speed profile within the accuracy constraints of the task.
Fig. 2.

Hand paths and speed profiles. A, B, Average hand paths from 10 movements at each direction–speed combination (8 directions, 4 speeds) in the bell (A) and constant speed (B) tracking tasks. C, D, Average speed profiles from movements at each direction–speed combination in the bell (C) and constant speed (D) tracking tasks. Hand paths and speed profiles were recorded from animals D (A, C) and C (B, D). Conventions are as in Figure 1.
Neuronal database
Cerebellar Purkinje cell simple and complex spike discharge was recorded in 154 cells in two monkeys (C and D) during the performance of one of two tracking tasks (bell and constant speed tracking). Because of the large number of trial repetitions required to study the 32 direction–speed movement combinations, a single Purkinje cell was studied in only one of the two tasks. In monkey C, 14 Purkinje cells were recorded during the bell tracking task, and 58 were recorded during the constant speed tracking task. In monkey D, 50 Purkinje cells were recorded during the bell tracking task, and 32 were recorded during the constant speed tracking task. This paper focuses on the relationship of the simple spike discharge to movement kinematics; analysis of the complex spike discharge is the subject of a future report. Of the 64 cells recorded in the bell tracking task, 53 (82.8%) had task-related simple spike discharge (ANOVA, p < 0.05) including 13 of 14 cells recorded in animal C and 40 of 50 in animal D. Of the 90 cells recorded in the constant speed task 79 (87.8%) had task-related discharge (50 of 58 cells in C and 29 of 32 cells in D). The remainder of the analysis focused on these 132 task-related cells (see Table 1 for a complete summary of task- and parameter-related discharge).
Table 1.
Summary of simple spike discharge modulation by task, task period, model, movement parameter encoded, and depth of modulation
| A. Grand Summary | |||
| Total | Bell task | Constant speed task | |
| Cells recorded | 154 | 64 | 90 |
| Task-modulated cells | 132 | 53 | 79 |
| B. Single-parameter regressions | |||
| Task | |||
| Bell (track) | Constant speed (cue) | Constant speed (track)* | |
| Directionally tuned | 31/53 | 39/79 | 54/79 |
| Speed-modulated | 30/53 | 34/79 | 47/79 |
| C. Depth of modulation in cue vs track periods of the constant speed task | |||
| Cue | Track | ||
| Idir (direction) | 0.11 | 0.14 | |
| β1 (speed) (spikes/sec) | 3.70 | 4.21 | |
| D. Depth of modulation of 20 cells with directional tuning in both cue and track periods of the constant speed task | |||
| Cue | Track | ||
| Higher Idir | 5/20 | 15/20 | |
| Mean Idir | 0.09 | 0.15 | |
| E. Depth of modulation of 6 cells with speed-related modulation in both cue and track periods of the constant speed task | |||
| Cue | Track | ||
| Higher ‖β1‖ | 1/6 | 5/6 | |
| Mean ‖β1‖ (spikes/sec) | 4.21 | 4.34 | |
| F. Response surface regressions | |||
| Task | |||
| Bell (track) | Constant speed (cue) | Constant speed (track) | |
| No. of cells | 25/53 | 39/79 | 67/79 |
| Mean R2 | 0.59 | 0.56 | 0.62 |
| G. Percentage of mean R2 accounted for by terms in surface model | |||
| Task | |||
| Bell (track) | Constant speed (cue) | Constant speed (track) | |
| Linear (%) | 39 | 46 | 38 |
| Quadratic (%) | 47 | 37 | 47 |
| Cross-product (%) | 14 | 17 | 15 |
The latencies at which a significant change in simple spike discharge occurred (exceeded ±3 SD of mean discharge rate during hold period) were calculated across all movement speeds for both the bell and constant speed tasks. In the constant speed task, significant increases occurred 52 ± 576 (mean ± SD) msec before the onset of the track period. In the bell task, the mean latencies occurred well after movement onset but before the peak of the bell-shaped speed profile by 104 ± 813 (mean ± SD) msec. The latencies of discharge modulation in the bell task would be expected to be delayed because of both the absence of a cue period and the very slow tracking speed at the onset of the track period. Therefore, significant changes in cell discharge are strongly coupled to arm tracking.
All cells were tested for responses to peripheral stimulation by somatosensory testing and palpation and by passive movement of the arm, as well as for discharge modulation in response to active reaching. Of the 132 task-related Purkinje cells, the discharge of 41 (31.1%) was related to passive manipulation of the shoulder only; 4 cells (3.0%) were related to the forearm–elbow area only, and 5 cells (3.8%) were modulated solely by palpation of the hand–wrist area. Thirty-two cells (24.2%) had discharge that was modulated in response to a combination of shoulder, wrist, and elbow manipulation. A large number of cells (64, 48.5%) had discharge that was modulated in response to both passive manipulation and active reaching; the discharge of 50 cells (37.9%) was related to active reaching only.
Direction- and speed-related simple spike discharge modulation
The simple spike discharge of the 53 task-related cells recorded during bell tracking and that of the 79 task-related cells recorded during constant speed tracking was evaluated for direction- and speed-related discharge modulation using linear regression analysis (Eqs. 1-3). Qualitatively, cells recorded during performance of the bell tracking task often had a temporal discharge profile that resembled the bell-shaped speed profile of the movement, particularly at the higher speeds. An example of a cell recorded during performance of the bell tracking task is shown in Figure3A. This cell’s discharge was modulated by passive manipulation of the shoulder. Overall, during the initial hold period, the tonic discharge rate was constant; at the beginning of the track period the discharge rate increased and reached a maximum value approximately midway through the track period. The discharge rate then decreased to baseline value during the final hold period. Mean simple spike discharge rates during the track period for each of the eight directions and four speeds are shown in Figure3B. This cell was significantly tuned to movement direction at speeds of 4 and 5 cm/sec. The PDs at each of these speeds were 242 and 236°; the depths of directional modulation (Idir) were 0.20 and 0.17, and the proportions of variability (R2) accounted for by direction were 0.94 and 0.95, respectively. The discharge rate of this cell was also significantly modulated with movement speed, such that increases in speed were accompanied by increases in discharge rate for movements to the target at 315° (R2 = 0.91; β1 = 2.66). Therefore, both direction and speed modulated this cell’s simple spike discharge.
Fig. 3.

Cell discharge during the track period in the bell tracking task. A, Each plot shows average Purkinje cell simple spike discharge (top) from 10 movements at the direction–speed combination indicated. Also shown are the corresponding x (solid lines) andy (dashed lines) position (middle) and speed (bottom, solid lines). Discharge ranges 0–100 spikes/sec. Position and speed span −5 to 5 cm and 0–6 cm/sec, respectively. Discharge was recorded from animal C.B, Scatterplots of average simple spike discharge during the track period as a function of movement direction (left) and speed (right). Significant directional tuning (R2 > 0.7) was found at speeds of 4 and 5 cm/sec; significant speed-related modulation was found for movements along 315°. Filled circlesdenote discharge rates with statistically significant relations to direction and speed.
An example of a Purkinje cell for which the simple spike discharge was significantly modulated during the track period of the constant speed task is shown in Figure4A. This cell’s discharge was modulated by passive manipulation of the shoulder and elbow. During the cue period, the discharge rate was constant and not significantly modulated with direction or speed (Fig. 4B, left). A substantial increase in discharge rate occurred during the track period. Qualitatively, the simple spike discharge profile strongly resembled the hand speed profiles: a rapid increase in discharge rate occurred and was followed by a period of maintained discharge. During the track period, the discharge of this cell was not significantly tuned to movement direction at any of the four speeds (Fig. 4B, right). The discharge was, however, significantly modulated with movement speed at six of the eight movement directions (0, 45, 90, 180, 270, and 315°). TheR2 values for speed at each of these directions were 0.97, 0.99, 0.96, 0.93, 0.90, and 0.97, and the values of β1 were 10.6, 11.0, 9.7, 6.1, 9.9, and 10.8, respectively. Therefore, this cell’s simple spike discharge can be characterized as being modulated predominantly by speed, irrespective of direction.
Fig. 4.

Cell discharge during the track period in the constant speed tracking task. A, Conventions are as in Figure 3. Speed spans 0–7 cm/sec. Discharge rate ranges 0–190 spikes/sec; recorded from animal D. B, Scatterplots of average simple spike discharge during the cue (left) and track (right) periods as a function of movement direction (top) and speed (bottom). No significant directional tuning was found in either the cue or track period; significant speed-related modulation was found only during the track period for movements along 0, 45, 90, 180, 270, and 315°.Filled circles denote discharge rates with statistically significant relations to speed. See Results for details.
Some cells recorded during performance of the constant speed task were modulated with direction and speed during the premovement cue period as well as during the track period; an example of the discharge of such a cell is shown in Figure 5A. The simple spike discharge of this cell was modulated by passive manipulation of the shoulder joint. For all movement speeds, simple spike discharge rate increased toward the end of the cue period, before the beginning of the track period. During the cue period (Fig.5B, left), significant discharge modulation with movement direction was limited to the speed of 4 cm/sec (PD = 278°;Idir = 0.17; R2 = 0.86). Significant modulation with speed occurred for movements to the target at 225° (R2 = 0.93; β1 = −1.01). During the track period (Fig. 5B, right), the simple spike discharge rate was tuned to direction for movements at speeds of 4 and 5 cm/sec (PD = 288 and 284°;Idir = 0.17 and 0.20;R2 = 0.77 and 0.84, respectively) and to speed for movements along 225, 270, and 315° (R2 = 0.94, 0.98, and 0.98; β1 = 5.58, 6.57, and 6.08, respectively). Therefore, although this cell exhibited some significant discharge modulation in the cue period, the extent and degree of this modulation was much more prominent in the track period. Furthermore, during both the cue and track periods, and for directions ranging from 225 to 315°, this cell’s simple spike discharge was modulated by a combination of direction and speed, that is, velocity.
Fig. 5.

Cell discharge during the cue and track periods in the constant speed tracking task. A, B, Conventions are as in Figures 3 and 4. Example of a cell with statistically significant directional tuning (4 cm/sec) and speed-related modulation (225°) during the cue period is shown. Discharge was also related to movement direction (4 and 5 cm/sec) and speed (225, 270, and 315°) during the track period. Simple spike discharge (A) spans 0–160 spikes/sec.
Thirty-one of the 53 cells (58.5%) with significant simple spike discharge modulation in the bell tracking task were modulated with changes in movement direction during the track period (Table1B). The distribution of directional tuning for the bell task at each movement speed is given in Figure6A. These spoke plots indicate the PDs of the discharge, as well asR2 and Idirvalues, for each cell. The number of cells with statistically significant directional tuning (R2 > 0.7) is given in the center of each plot. The extent of directional tuning was distributed almost equally across speeds. The length of the spokes projecting inward from the center reference line gives theR2 value from 0.7 to 1.0 (dotted line, R2 = 0.9); the length of each spoke projecting outward gives Idir for values >0 (dotted line, Idir = 0.3). The “total” plot shows PDs and R2 andIdir values from all four peak speeds, as well as an overlaid density plot, the magnitude of which indicates the concentration of PDs within a given region. The number given in the center of the total plot is not the sum of the PDs for each of the speeds but, rather, the total number of cells with significant directional tuning, because some cells had direction-related discharge at more than one speed. For the bell tracking task the distribution of PDs was uniform (Rayleigh test, p = 0.37).
Fig. 6.

Summary of movement direction-related cell discharge at each movement speed. A–C, Distribution of PDs and R2 andIdir values for all cells with significant direction-related discharge in the track period of the bell tracking task (A) and in the cue (B) and track (C) periods in the constant speed tracking task. Numbers of cells with statistically significant directional tuning (R2 > 0.7) at each speed are given in the center of each plot. Each radially directed spoke indicates PD,R2, andIdir. Length of spokesprojecting inward from center reference line givesR2 from 0.7 to 1.0 (dotted line at 0.9); length of spokes projecting outward gives Idir for values >0 (dotted line at 0.3). Total plots show PDs, and R2, andIdir values for all four peak and constant speeds, with superimposed density estimates. Numbers incenters of Total plots indicate the numbers of cells with statistically significant directional tuning for all speeds. D–F, Total numbers of cells with direction-related discharge at each movement speed.
In the constant speed task, the discharge of nearly one-half of the cells (39 of 79, 49.4%) with significant task-related modulation was tuned to movement direction during the cue period (Table1B, Fig. 6B). The distribution of cue period PDs taken from the total plot was uniform (Rayleigh test,p = 0.48). During the track period (Fig.6C), the discharge of more than two-thirds of the cells (54 of 79, 68.4%) with significant task-related modulation in the constant speed task was modulated with changes in movement direction. Simple spike discharge could be directionally tuned at any of the movement speeds. In addition, a large cluster of PDs at ∼270° (movements toward the animal’s body) can be seen for each of the four speeds; it is best seen in the total plot. A smaller cluster of PDs is apparent at ∼90°, that is, for movements away from the animal’s body. Fewer cells had PDs to the left (∼180°) and right (∼0°) for the track period of the constant speed task. The null hypothesis of uniformity of PDs was tested under the assumption of a bimodal PD distribution; the distribution was judged to be nonuniform [equal spacings test (Mardia, 1972), p < 0.05]. This nonuniform distribution of PDs, such that they tended to cluster in directions corresponding to movements toward and away from the body, is similar to that found previously (Fortier et al., 1989; Fu et al., 1997) for cerebellar cortical cells. Therefore, the distribution of preferred directions was nonuniform for the track period of the constant speed task.
Figure 6 reveals one important characteristic of this directional tuning. For both bell (Fig. 6D) and constant speed (Fig. 6E,F) tracking, significant directional tuning occurred most commonly at only one speed. This finding suggests that interactions between direction and speed may be an important determinant of Purkinje cell simple spike discharge. This result is similar to that of a previous study of Purkinje cell discharge (Fu et al., 1997), in that significant directional tuning usually occurred at only one movement distance.
In addition to directional tuning, the simple spike discharge of these cells displayed statistically significant speed-related modulation in both movement tasks. Thirty of the 53 cells (56.6%) in the bell tracking task either increased or decreased discharge rate with speed (Table 1B). Shown in Figure7A is a spoke plot of the distribution of positive and negative regression slopes for speed (β1), obtained from fitting Equation 3. Because six cells were modulated with speed at more than one movement direction, the total number of spokes (n = 39) exceeds the total number of cells with speed relations (n = 30). A slightly greater number of these speed slopes were positive (n = 22) than negative (n = 17), and there was a tendency for a greater number of speed relationships to occur in the quadrant spanning 135–225°. Cells with significant relationships to speed in this task were modulated most commonly in only one movement direction (Fig. 7D). Twenty-four cells were modulated with speed along one direction; six cells had relationships to speed at two to four directions, and no cells were modulated with speed at five or more directions.
Fig. 7.

Summary of movement speed-related discharge along each direction. A–C, Distribution of positive and negative speed slopes (β1 values; Eq. 3) andR2 values for cells with significant speed-related modulation (R2 > 0.9) in the track period of the bell tracking task (A) and in the cue (B) and track (C) periods of the constant speed tracking task.Spokes projecting from the inner octagonindicate β1 values; inward-directed spokesindicate negative values from −14 (inner dotted line) to 0; outward-directed spokes indicate positive β1 values, ranging from 0 to 14 (outer dotted line). Spokes projecting from the outer octagon indicate R2 values, spanning 0.9 to 1.0. Height of outer histogram blocks gives proportion of cells with speed-related modulation in the given hemiquadrant.Numbers of cells with statistically significant speed-related discharge modulation are given in thecenter of each plot. D–F, Number of cells with speed-related modulation at one or more directions during the track period of the bell task (D) and in the cue (E) and track (F) periods of the constant speed task.
In the constant speed task, the simple spike discharge of 34 cells (34 of 79, 43.0%) was modulated with movement speed during the cue period (Table 1B, Fig. 7B). As in the bell tracking task, a slightly greater number of speed slopes were positive (n = 29) than negative (n = 20). Here, there was a tendency for a greater number of significant speed regressions to occur in the quadrant spanning 45–135°. In addition, most cells were modulated with speed along only one direction (Fig.7E; n = 24). Ten cells had speed relationships at two to four directions, and no cells were related to speed along five or more directions. In the track period, the discharge of 47 cells (47 of 79, 59.5%) was significantly modulated with movement speed (Fig. 7C). Forty-six of the regression slopes were positive; 31 were negative. The distribution of these significant regressions in the track period was more uniform than that for the cue period. Again, simple spike discharge was modulated most commonly in one direction (Fig. 7F; n = 29); 18 cells had speed relations along two to six directions.
Simple spike modulation in the cue and track periods in the constant speed task
As was shown in Figures 6 and 7, more cells had direction- and speed-related discharge modulation in the track period (direction,n = 54; speed, n = 47) than in the cue period (direction, n = 39; speed, n = 34) during constant speed tracking. Furthermore, the depths of modulation for movement direction (Idir) and the absolute values of the slopes for movement speed (β1) were, on average, greater during the track period than during the cue period (Table 1C). The means ofIdir were significantly different (t = 2.72; p = 0.007), and there was a trend toward a greater mean β1 during the track period (t = 1.74; p = 0.08). What about cells that were directionally tuned at the same speed or speed-related for movements along the same direction in both the cue and track periods? Twenty of the 79 task-modulated cells were directionally tuned for movements at the same speed in both the cue and track periods. For this group of 20 cells, more cells had a greater depth of modulation (Idir) in the track period than in the cue period, and the average depth of modulation was greater in the track period (Table 1D; t = 4.29;p = 0.0003). Only six of the 79 task-related cells had speed-related modulation for movements in the same direction during both the cue and track periods. In five of six cells the magnitudes of the absolute values of the slopes (β1; Eq. 3) were greater during the track period, but the mean absolute values of these slopes for the track and cue periods were similar (Table1E). Therefore, across the cue and track periods, a minority of cells were directionally tuned for movements at the same speed, or speed-related for movements in the same direction, based on the simple linear models (Eqs. 1-3). More cells had a greater depth of modulation, and the average depth of modulation was increased for simple spike discharge recorded during the track period compared with the cue period.
Coincidence of directional tuning and speed-related modulation
As stated previously, the discharge of some cells was both tuned to movement direction and modulated with movement speed (Eqs. 1-3). In the track period of the bell task and in the cue and track periods of the constant speed task, 15 of 53, 16 of 79, and 31 of 79 cells, respectively, had statistically significant relationships to both parameters based on the simple linear models (Eqs. 1-3). This observation raises the question of whether the direction- and speed-related modulation was coupled and, if so, whether the discharge of the cells might be related to movement velocity. Velocity encoding predicts that speed modulation would occur preferentially along a cell’s preferred direction. In Figure8A–C, the distribution of directions along which speed-related modulation was found is shown after rotation of the PDs of each of the cells to 0°. Overall, a given Purkinje cell tended to have positive speed-related modulation (filled circles) in the same hemisphere as its PD. Conversely, negative speed modulation (open circles) occurred primarily in the opposite hemisphere. Over the population, the cell discharge was greater for increasing speed along or near the PD and linearly decreased for directions opposite to the PD. That is, cell discharge increased with movement (or target) speed increases along or near the direction along which cell discharge was highest. A similar finding was described for direction–speed modulation in the discharge of primary motor cortical cells (Schwartz, 1992). This coincidence of direction- and speed-related modulation provides further evidence that interactions between direction and speed (i.e., velocity) may be an important determinant of simple spike discharge.
Fig. 8.

Cells with both directionally tuned and speed-related discharge. Polar plots indicate the coincidence of direction- and speed-related modulation in the track period of the bell task (A) and in the cue (B) and track (C) periods of the constant speed task. Circles around plot peripheries indicate directions along which cells had speed-related discharge after rotation of cells’ PDs to 0°. Filled circles indicate positive speed slopes (β1 > 0; Eq. 3); open circles indicate negative speed slopes (β1 < 0). Rose plotsindicate numbers of positive (filled) and negative (open) speed slopes in each hemiquadrant (dotted line, n = 11). Density estimates show relative concentration of positive speed modulation in a given directional region. Cells tended to have positive speed-related modulation in the same hemisphere as the PD and negative speed-related modulation in the opposite hemisphere.
Response surface modeling of simple spike discharge
The findings presented in Figure 8 suggest that the simple spike discharge of some Purkinje cells is modulated by movement velocity. Most of the cells whose discharge was significantly tuned to movement direction, however, were modulated at only one speed (Fig. 6), and most cells with speed-related discharge were modulated along only one direction (Fig. 7). This finding suggested that the patterns of simple spike discharge observed across the direction–speed space may not have been described adequately by relatively simple linear models (Eqs.1-3). Therefore, a response surface modeling approach was used in which the mean simple spike discharge rates for each period of interest were evaluated over all 32 direction–speed combinations. Two advantages of this approach are (1) it can capture any nonlinearities in discharge rate over the direction–speed space, and (2) perhaps more importantly, it can be used to identify the direction–speed combinations corresponding to the maximal (and minimal) simple spike discharge rates; that is, it can be used to identify a cell’s preferred velocity.
Figure 9 shows the results of this response surface modeling for four different Purkinje cells, comparing the actual discharge with the predicted discharge for the 32 direction–speed combinations. The discharge pattern of a cell recorded during the bell task, and with no significant direction- or speed-related discharge according to the single-parameter analyses (Eqs. 1-3), is shown in polar form in Figure 9A. The directional discharge pattern of this cell was bimodal, such that maximal discharge occurred for movements along 0° and at speeds of ∼4–5 cm/sec, with another, slightly lower peak at 180°, also at 4–5 cm/sec. This second maximum contributed to the inability of the single-parameter models to fit the discharge. The majority of the overall variability in this cell’s discharge was accounted for by direction and speed in the response surface model (R2 = 0.74). The plot of the predicted surface (Fig. 9B) captures the essential feature seen in the raw data plot, that is, the bimodal distribution of discharge rates, with a separation of ∼180°. This cell’s preferred velocity (maximal discharge on the fitted surface) occurred at direction 23° and speed 3.8 cm/sec. Minimal discharge on the fitted surface was found for the velocity 270°, 2.1 cm/sec. Therefore, this cell’s simple spike discharge was not linearly related to direction or speed but instead was modulated at a direction–speed combination.
Fig. 9.
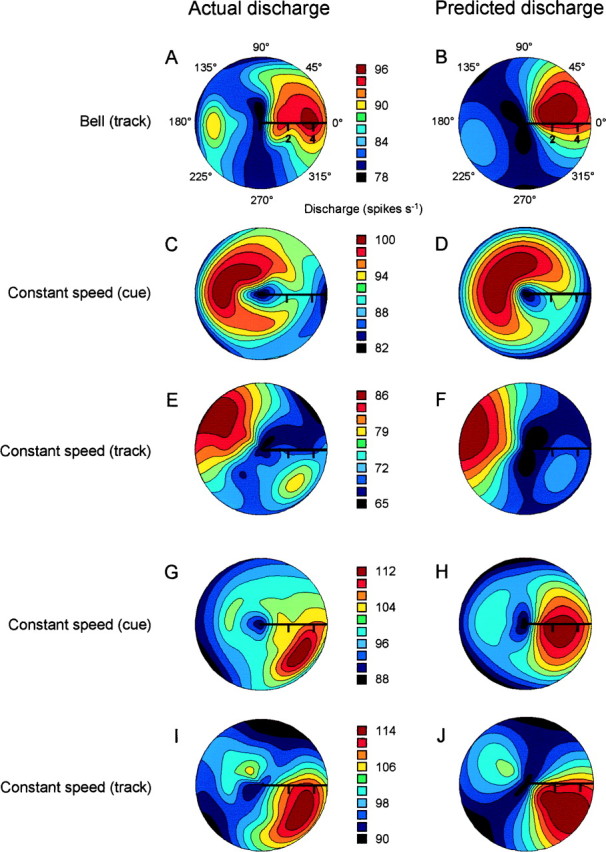
Actual and predicted simple spike discharge from fitting the response surface model. A–J, Color polar contour plots of actual simple spike discharge rates (left) and predicted discharge rates (right) for five Purkinje cells as a function of direction and speed. Speed is indicated on the radius arm. For the actual discharge plots (A, C, E, G, I) the average discharge is plotted for each of the 32 direction–speed combinations. The continuous surface was generated using bicubic interpolation of the 32 points. The plots of predicted discharge (B, D, F, H, J) were plotted using the predicted surfaces from the polynomial model.
The simple spike discharge of some cells could be tuned to velocity in the premovement cue period. The actual and predicted discharge rates of a cell recorded during the cue period in the constant speed task are shown in Figure 9, C and D, respectively. Qualitatively, this cell had an area of peak discharge in the hemiquadrant spanning 135–180° and at speeds of 2–4 cm/sec. The discharge of this cell was not tuned to target direction at any of the four speeds and was not modulated with speed along any direction using the single-parameter regression models. This cell’s discharge was, however, well described by the response surface model (R2 = 0.69). The preferred velocity occurred at 135° and 2.9 cm/sec; the minimum discharge rate on the surface was located at 305° and 4.9 cm/sec. The simple spike discharge of a different cell recorded during the track period of the constant speed task is shown in Figure 9E. Like the cells shown in Figure 9, A and C, the discharge of this cell was not found to be modulated with direction or speed in the single-parameter analyses (Eqs. 1-3). Similar to the discharge pattern shown in Figure 9A, this cell’s discharge was distributed in a bimodal manner across the workspace, with peak rates for movements along 135° and 4–5 cm/sec. A second peak occurred at 315°. The fitted model captured almost 80% of the variability in the discharge pattern (R2 = 0.79); the predicted values are shown in Figure 9F. The preferred velocity was at coordinates 154° and 4.1 cm/sec; the minimum on the surface was at 275° and 2.2 cm/sec.
Some cells had similar patterns of simple spike discharge during both the cue and track periods; the discharge of such a cell is shown in Figure 9, G (cue) and I (track). Like the actual discharge patterns of the cells shown in Figure 9, A andC, this cell had a nonlinear relationship to speed, with peak discharge at a speed of ∼4 cm/sec for both the cue and track periods. Direction-related discharge was also highly similar for the cue and track periods; maximal discharge occurred in the 315 to 0° hemiquadrant. The fitted surfaces (Fig.9H,J) strongly resemble the actual discharge profiles, reflecting the large proportions of variability in simple spike discharge rate accounted for by the surface model (cueR2 = 0.62; trackR2 = 0.86). The preferred velocities on the fitted surfaces were 352° and 3.9 cm/sec for the cue period and 321° and 4.1 cm/sec for the track period. Therefore, the preferred velocity of this cell’s discharge was very similar for both the cue and track periods.
Some cells, such as those shown in Figure 9, A andE, appeared to have bimodal discharge patterns, including a velocity corresponding to maximal discharge—the preferred velocity—as well as a second velocity at which the discharge rate was less than the maximum. The cells that significantly fitted the surface model were examined for this characteristic using arbitrarily set criteria. A cell’s discharge pattern was considered bimodal if (1) the discharge rate at the second velocity exceeded the midpoint between the mean and maximum discharge rates, and (2) the second velocity was located >90° from the preferred velocity. In the bell tracking task, 3 of 25 cells (12%) were bimodal; in the cue and track periods of the constant speed task, 7 of 39 cells (18%) and 9 of 67 cells (13%), respectively, were bimodal. Therefore, across both tasks, ∼85% of the cells with significant fits to the surface model had unique preferred velocities.
Direction and speed, in the context of the response surface model, accounted for a significant proportion of the variability in simple spike discharge rate in a large number of cells. The distribution of cells with statistically significant fits to this model is shown in Figure 10. The actual velocities corresponding to the maximum (filled circles) and minimum (open circles) discharge rates from fitting the response surface model are shown in Figure 10A–C; these velocities appear to be distributed uniformly throughout the direction–speed space. In Figure 10D–F, these maxima and minima are shown after rotation of the maximum discharge rate predicted by the surface model to the PD of the cell (Eq. 1, using data from all 32 direction–speed combinations) and alignment to 0°. It can be seen that the maximum velocities coincide with the PDs and that the minimum velocities are clustered in the opposite half of the workspace. Twenty-five of 53 task-related cells (47.2%) in the bell tracking task had significant fits to the surface model (Fig.10A,D), and the averageR2 value was 0.59 ± 0.15 (mean ± SD). After rotation to 0°, these preferred velocities occurred in a relatively well defined area, spanning 330–35° (mean = 2.91°; SD = 12.79°) and were distributed uniformly in the speed range of 2–5 cm/sec. The minimal discharge rates occurred in the opposite quadrant and were clustered along 180°. This latter finding resembles what was observed for the interaction between direction and speed shown in Figure 8, using the linear models.
Fig. 10.

Summary of movement velocity encoding in simple spike discharge. A–C, Velocities at which maximal (filled circles) and minimal (open circles) discharge rates were found for all cells with significant fits to the surface model during the track period of the bell tracking task (A) and in the cue (B) and track (C) periods of the constant speed task. Dotted lines indicate speeds of 2, 3, 4, and 5 cm/sec from the center. D–F, Velocities corresponding to maximal and minimal discharge rates after rotation of maximal velocities to the PD of the cell. Conventions are as in A–C.
In the constant speed task, 39 of 79 cells (49.4%) in the cue period (Fig. 10B,E) and 67 of 79 cells (84.8%) in the track period (Fig. 10C,F) significantly fitted the surface model. Average R2 values for the cue and track periods were 0.56 ± 0.13 and 0.62 ± 0.16 (mean ± SD), respectively. Similar to the results for the bell tracking task, after rotation to 0°, the preferred velocities for both the cue and track periods of the constant speed task were distributed throughout the quadrant centered at 0° (cue period: mean = 2.57°; SD = 23.42°; track period: mean = 0.76°; SD = 16.05°), and predicted discharge rates were at a minimum at ∼180°. These maximum and minimum velocities were distributed uniformly along the speed axis.
The proportions of variability in simple spike rate were also calculated for the linear ([cos(θ − θPD)], (s)), quadratic ([cos(θ − θPD)]2, (s)2), and cross-product ([cos(θ − θPD)] · (s)) predictors in the surface model. In the bell task, and in the cue and track periods of the constant speed task, the linear terms accounted for ∼40% of the total proportion of variability explained (Table 1G). On average, the quadratic terms accounted for more of the variability in discharge rate than the linear components. The cross-product term explained the least percentage of the variability in discharge. The higher overall contribution of the quadratic terms indicates that the relationship of simple spike discharge rate to direction and speed was often nonlinear.
Recording sites and spatial properties of the discharge
The recording areas and surface electrode penetration sites are shown relative to a dorsal view of the cerebellar cortex in Figure11A. In both animals, the anteroposterior loci of the recordings were near the primary fissure; in animal C (right), the recordings were centered ∼10 mm to the right of the midline, and in animal D (left), they were centered 13 mm to the left of the midline. Most recordings were either anterior to the primary fissure in lobule V or posterior in lobule VI, extending mediolaterally from the intermediate region well into the hemisphere (HV and HVI). Some cells (animal D) were located in lobule IV.
Fig. 11.
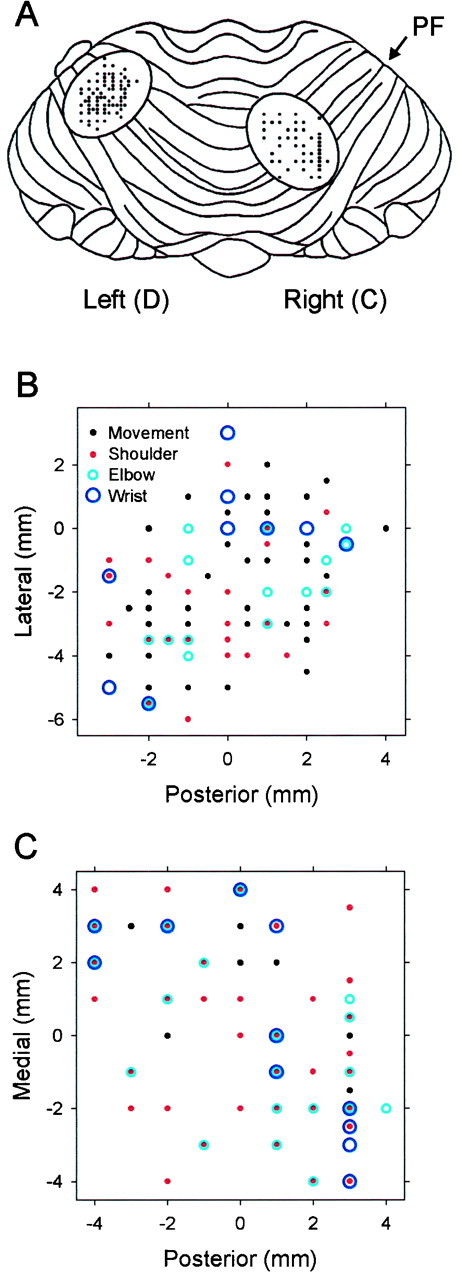
Recording sites. A, Regions and penetration coordinates for the recordings in animal D (left cerebellar hemisphere) and animal C (right hemisphere). PF, Primary fissure. B, C, Expanded view of the recording locations from animals D and C, respectively. At each recording site the color of the circleindicates whether a cell’s discharge responded to passive manipulation of the hand and wrist (red), arm and elbow (green), or shoulder (blue).Black dots indicate that the cell responded to active movements but not passive manipulations. In some penetration tracks more than one Purkinje cell was recorded.
In both animals, the distribution of recording sites relative to the dorsal surface of the cerebellum was examined for spatial differences with respect to the locus of sensitivity to peripheral stimulation (shoulder vs elbow vs wrist). The electrode penetrations illustrated in Figure 11A are expanded in Figure 11, Band C, indicating whether the cell(s) recorded in a given track were sensitive to shoulder (red), elbow (green), or wrist (blue) stimulation or to a combination thereof. Hotelling’s two-sample tests (Batschelet, 1981) with corrections for multiple comparisons (p < 0.05) showed no spatial differences in sensitivity in animals D (Fig.11B) and C (Fig. 11C).
These distributions of recording sites in animals D and C were also tested for spatial differences with respect to (1) correlations of simple spike discharge to movement direction versus speed (Eqs. 1, 3), (2) statistically significant simple spike discharge modulation during the cue versus track periods in the constant speed task, (3) the preferred directions of cells with significant directional tuning, and (4) the preferred velocities of cells whose discharge significantly fitted the surface model. Characteristics 1 and 2 above were tested using Hotelling’s two-sample tests; 3 and 4 were examined using a modified sign test (Mardia, 1972). No spatial differences were found among any of these measures (p < 0.05), providing evidence that the simple spike discharge modulation described here may relate more strongly to movement parameters than to muscle groups.
Task-related eye movements and muscle activity
Eye movements and muscle activity were recorded in both animals during the performance of both movement tasks in experimental sessions in which Purkinje cell discharge was not recorded. Single-trial records of eye movements obtained during bell and constant speed tracking are shown in Figure 12, A andB, respectively. In Figure 12A, the eyex and y positions from five movement trials are illustrated as a function of time for the four peak speeds (2, 3, 4, and 5 cm/sec) and for four of the eight movement directions (0, 90, 180, and 270°). Although saccadic eye movements were predominant during the initial and final hold periods, smooth pursuit movements occurred throughout much of the track period. At the highest peak speed (5 cm/sec), smooth pursuit eye movements were observed almost exclusively; at lower speeds (2, 3, and 4 cm/sec), the smooth pursuit movements during the track period were occasionally interrupted by periods of saccades, particularly as the animal approached the movement end points.
Fig. 12.
Task-related eye movements. A, Single-trial records of x and y eye positions in time during bell tracking at each of the four peak speeds (2, 3, 4, and 5 cm/sec) and at four of the eight movement directions (0, 90, 180, and 270°) recorded in animal D. Data from five overlapping trials are shown; first and second vertical dotted lines mark the Hold1 period–Track period and the Track period–Hold2 period transitions, respectively.B, Single-trial records of x andy eye positions during constant speed tracking at each of the four constant speeds (2, 3, 4, and 5 cm/sec) and at four of the eight movement directions (0, 90, 180, and 270°) from animal C. Five overlapping trials are shown. Vertical dotted lines mark the Hold period–Cue period transitions; vertical solid lines mark the Cue period–Track period transitions. Scale bar,x and y eye position excursions of 15°.
Eye x and y positions in time are shown in Figure12B for the four constant speeds (2, 3, 4, and 5 cm/sec) and for four movement directions (0, 90, 180, and 270°). At all directions and speeds, saccadic eye movements characterized the premovement hold period. At the three highest speeds (3, 4, and 5 cm/sec), smooth pursuit eye movements occurred throughout the cue and track periods. At the lowest speed (2 cm/sec), the animals initially engaged in a brief period of smooth pursuit movements after the appearance of the cue target, which was in turn followed by a period of saccades. During the next 500–750 msec before and after the cue period–track period transition, smooth pursuit movements resumed. Saccades commonly occurred in the latter half of the track period.
Task-related EMG activity was observed in all 10 muscles that were recorded in both animals during the performance of both tracking tasks (Fig. 13). In Figure 13A–C, the average EMG activity of the biceps (long head), spinodeltoid, and flexor carpi ulnaris muscles is shown. The activity of the biceps muscle (Fig. 13A) is shown for movements in all eight directions (0–315° in 45° increments) and at the slowest (2 cm/sec) and fastest (5 cm/sec) peak speeds during performance of the bell tracking task. Note the increase in EMG activity during the track period, which is apparent at both speeds in the directions ranging 180–270°, as well as the relative inactivity during the initial and final hold periods. This direction-related modulation during the track period can also be seen in the tuning curves obtained from fitting Eq.2 in Figure 13D, top. The activity of this muscle was tuned to movement direction at all four speeds (top) but was not tuned to movement speed at any of the eight directions (Fig.13D, bottom). The EMG activity of the spinodeltoid and flexor carpi ulnaris muscles, which was recorded during the constant speed task, is shown in Figure 13, B and C, respectively. In both of these muscles, little or no EMG activity was observed during the hold or premovement cue periods; along some directions, however (e.g., 180°), there was an increase in activity 50–100 msec before the beginning of the track period, consistent with previous observations (Georgopoulos et al., 1984; Turner et al., 1995). Direction-related modulation was observed during the track period in both muscles. In the spinodeltoid muscle (Fig. 13B), movement direction-related activity increases were seen in the range 45–135°, and in the flexor carpi ulnaris muscle (Fig.13C), increases in activity were apparent in the 180–270° quadrant (also see Fig. 13B). In both of these records, EMG activity was tuned to movement direction at all four speeds (Fig.13E,F, top) but was not modulated with changes in movement speed (Fig. 13E,F, bottom).
Fig. 13.

Task-related EMG activity. A–C, EMG activity of the biceps (long head), spinodeltoid, and flexor carpi ulnaris muscles recorded in animals D, D, and C, respectively. Also shown in each plot are x and y hand position (solid and dashed lines, middle) and speed (solid lines, bottom). Position and speed span −5 to 5 cm and 0–6 cm/sec, respectively. The biceps EMG was recorded during performance of the bell task; the spinodeltoid and flexor carpi ulnaris muscles were recorded during the constant speed task.D–F, Average EMG activity in standardized units as a function of direction (top) and speed (bottom) corresponding to A–C above. Each of these muscles was directionally tuned at all four speeds; no speed-related activity was observed along any of the directions.
The EMG activity of these 10 muscles was recorded in both animals during the performance of both tasks over three to six times each, for a total of 135 EMG recordings. Direction-related modulation has been well described in reaching tasks (Georgopoulos et al., 1984; Flanders, 1991; Turner et al., 1995) and was, in this study, a prominent feature of EMG activity recorded during the track period in both tasks. For all 10 muscles recorded, statistically significant directional tuning (Eqs.1, 2) of EMG activity at all movement speeds was observed in at least one EMG recording in both animals and for both tasks (90 EMG recordings total). Speed-related modulation (Eq. 3) was observed in five muscles [acromiodeltoid, biceps (long head), flexor carpi radialis, spinodeltoid, and triceps (long head)], for a total of 12 recordings for both animals and both tasks. Moreover, when present, directional tuning tended to occur for a given muscle at all four speeds (61 recordings), whereas speed-related modulation occurred most commonly at just one movement direction (7 recordings). The EMG activity obtained in these recordings was also fitted to the response surface model (Eq.4). A far smaller percentage of EMG recordings significantly fitted the model (61 of 135, 45.2%), and on average, these fits were poorer (meanR2 = 0.45). These poorer fits of the surface model were likely attributable to the failure of movement speed to contribute strongly to the overall variability observed in EMG activity.
DISCUSSION
Task-related modulation of Purkinje cell simple spike discharge
The simple spike discharge of most Purkinje cells was modulated during both visually guided tracking tasks and therefore was invariant with regard to the temporal profile of the tracking speed. In the most directly comparable study (Fu et al., 1997), in which Purkinje cell simple spike discharge was recorded during step movements, 179 of 231 (77.5%) cells were task-modulated, compared with 132 of 154 (85.7%) cells in this study. Therefore, the simple spike discharge of Purkinje cells is highly modulated during tracking tasks involving the arm. Because the simple spike discharge of floccular and vermal Purkinje cells is highly modulated during smooth pursuit eye tracking, a behavior for which the cerebellum is critical (Miles and Fuller, 1975;Lisberger and Fuchs, 1978; Kase et al., 1979), the present results suggest cerebellar involvement in general in pursuit tracking.
Although the simple spike discharge of some Purkinje cells is strongly modulated by smooth pursuit eye movements and saccades, it is unlikely that the simple spike modulation described here is simply attributable to eye movements or vision. Three findings support this. First, the Purkinje cells recorded in this study were located in the intermediate and lateral hemispheres, near the primary fissure; eye movement-related cells have been found mainly in the flocculus and vermis. In one study of eye movement-related Purkinje cell discharge recorded in the lateral cerebellum, only 2 of 134 (1.5%) cells had discharge that was related to a moving, visual target (Marple-Horvat and Stein, 1990). Two recent studies (Mano et al., 1991, 1996) found no modulation in Purkinje cell simple spike discharge during smooth pursuit eye movements but did find saccade-related simple spike discharge; the recording sites, however, were located much more posteriorly to those in this study, and no saccade-related activity was found in the areas of cerebellar cortex in which we recorded. Input and output neurons of the intermediate cerebellum also exhibit very little visual or eye movement-related discharge (van Kan et al., 1993a,b). Second, the number of cells with cue period-related discharge modulation was considerably less than that with track period-related modulation, and the depths of modulation (Idir) and slopes (β1) for the cue period were lower than those found during arm tracking. Third, simple spike discharge in the constant speed task significantly increased above baseline very close in time to the onset of the track period, not early in the cue period. The onset of significant discharge modulation occurred even later in the bell task. Because the eye movements and visual input were symmetric across the tasks, it is doubtful whether either played a significant role in the simple spike discharge modulation observed here. Therefore, neither eye movement nor visual input appears to have been a major contributor to the simple spike discharge modulation.
Relationship of Purkinje cell simple spike discharge to movement direction and speed
In this study, movement direction was an important determinant of Purkinje cell simple spike discharge rate. The discharge of 85 of 132 (64.4%) task-modulated cells was tuned to movement direction during arm tracking, based on the cosine model. This result complements the findings of the few studies (Marple-Horvat and Stein, 1987; Fortier et al., 1989, 1993; Fu et al., 1997) of cerebellar encoding of movement direction in primates during multijoint reaching. The percentage of cells with direction-related simple spike discharge in this tracking task (64.4%) was higher than that found in an earlier study (45.7%) of simple spike discharge during ballistic reaching movements (Fu et al., 1997). Therefore, in addition to the overall finding of a higher percentage of task-modulated cells in this visuomotor tracking task, a higher percentage of cells were directionally tuned during feedback-dependent tracking compared with ballistic reaching.
Movement speed was also an important predictor of simple spike discharge in the two tasks; 77 of 132 (58.3%) cells were modulated with movement speed during arm tracking. Two other studies have examined the speed–velocity sensitivity of Purkinje cell simple spike discharge in single or multijoint movement tasks. In a bidirectional, wrist movement task in which speed was varied over two broad ranges,Mano and Yamamoto (1980) found 19 of 92 (20.7%) cells to be modulated with movement speed. In a more recent study of Purkinje cell discharge in a four-direction reaching task (Marple-Horvat and Stein, 1987), 37 of 52 (71.2%) cells were correlated with speed, based on cross-correlation analyses. Speed was not systematically controlled, however. The tasks used in the present investigation, which varied speed over four levels and along eight movement directions, were designed explicitly to capture maximal information about Purkinje cell discharge modulation with regard to both direction and speed.
Relationship of Purkinje cell simple spike discharge to movement velocity
The results of the single-parameter analyses in this study were remarkable in that the simple spike discharge modulation was most commonly limited to directional tuning along one speed or to speed-related modulation along one direction. This suggested that the interaction between direction and speed may be the critical predictor of simple spike discharge. Analysis of the cells with both significant direction and speed modulation according to the single-parameter models (Eqs. 1-3) supported this concept (Fig. 8). Positive speed modulation tended to occur along a cell’s preferred direction, and negative speed modulation was found primarily in the opposite direction. The discharge of this group of cells is consistent with a linear code for movement velocity.
Because these linear analyses might not have fully captured the discharge properties of these cells across the 32-point direction–speed workspace, a response surface modeling of simple spike discharge rate was undertaken. This analysis, which was linear in the regression parameters but allowed for nonlinearity in the response, showed that the simple spike discharge of most Purkinje cells (92 of 132; 69.7%) was tuned to movement velocity during arm tracking. The quadratic terms were responsible for explaining the majority of the variability in simple spike discharge. Thus, those cells with strictly linear correlations to both direction and speed may constitute just a subset of the cells whose discharge is best described by both linear and nonlinear variation with these parameters. Importantly, all movement velocities were represented across the population of Purkinje cells. Therefore, the neural substrate may exist for providing a population code for velocity by summing the activity of these cells in a manner analogous to the population code described for movement direction in the primary motor cortex (Georgopoulos et al., 1988;Schwartz, 1993).
One implication of this property of Purkinje cells—a preferred velocity—is that the simple spike discharge is probably not best described as signaling direction and speed but, rather, as integrating their combination. In a single-joint movement study of mossy fibers, which serve as inputs to cerebellar Purkinje cells via granule cells, the phasic discharge was correlated to both movement direction and speed (van Kan et al., 1993b). Purkinje cells are known to play an integrative role with regard to other control signals, for example, in the combination of head and eye velocity signals to yield gaze velocity (Lisberger and Fuchs, 1978; Stone and Lisberger, 1990). The representation of movement velocity observed here in the simple spike discharge of cerebellar Purkinje cells most likely reflects a role for the cerebellum in the direct control of velocity. Patients and experimental animals with cerebellar lesions are characterized by abnormalities in the velocity of movements (Holmes, 1939; Beppu et al., 1984; Miall et al., 1987; Diener and Dichgans, 1992). The encoding of movement velocity in cerebellar neurons could be needed for predictive aspects of movements (Pellionisz and Llinas, 1979; Kettner et al., 1997). The ability to make smooth pursuit movements requires a prediction of the target’s trajectory, and a velocity signal would be useful in making such a prediction for both eye and limb movements.
Velocity encoding may also reflect a role for the cerebellum in the specification of movement dynamics. Information about movement velocity is required for the calculation of interaction torques, which are disrupted in subjects with cerebellar pathology (Bastian et al., 1996). Also, velocity may be used to compute forces related to viscosity as needed for a model of inverse dynamics (Shidara et al., 1993; Gomi et al., 1998). Nonetheless, the present finding of a velocity signal in the simple spike discharge for pursuit tracking with the arm and the known gaze velocity signal for the control of eye movements provides a unifying role for Purkinje cells in motor control.
Relationship of EMG activity to movement direction, speed, and velocity
A secondary aim of this study was to compare the magnitude and extent of significant correlations between simple spike discharge rate and direction, speed, and velocity with those of the correlations observed between EMG activity and each of these parameters. It has been proposed recently that the discharge of cerebellar neurons encodes movement commands in muscle-based coordinates (Miller and Houk, 1995). If this is so, then the relationship of simple spike discharge to movement direction and speed should be very similar to the relationship of EMG activity to these parameters. Using the same analysis as applied to the simple spike discharge, it was shown that significant relationships between EMG activity and movement direction were observed far more commonly than those between EMG activity and speed. In addition, when compared with the simple spike discharge records, a far smaller percentage of EMG activity recordings were well described by the response surface model, and the values ofR2 were lower. This dissimilarity of parameter relations between cell discharge and EMG activity suggests that the simple spike discharge of Purkinje cells does not contribute to limb movement simply by specifying patterns of muscle activation. Rather, the simple spike discharge appears to incorporate information about both direction and speed, signaling movement velocity.
Footnotes
This work was supported by National Institutes of Health Grant NS18338 and the Human Frontier Science Program. J.D.C. was supported by National Institutes of Health Grant MH11430, and M.T.V.J. was supported by National Institutes of Health Grant NS07361. We thank E. C. Ebner for programming the movement paradigm and M. L. McPhee for assistance with histology.
Correspondence should be addressed to Dr. Timothy J. Ebner, Department of Neurosurgery, University of Minnesota, 2001 Sixth Street SE, Room 421, Minneapolis, MN 55455.
REFERENCES
- 1.Bastian AJ, Martin TA, Keating JG, Thach WT. Cerebellar ataxia: abnormal control of interaction torques across multiple joints. J Neurophysiol. 1996;76:492–509. doi: 10.1152/jn.1996.76.1.492. [DOI] [PubMed] [Google Scholar]
- 2.Batschelet E. Circular statistics in biology. Academic; New York: 1981. [Google Scholar]
- 3.Becker WJ, Morrice BL, Clark AW, Lee RG. Multi-joint reaching movements and eye-hand tracking in cerebellar incoordination: investigation of a patient with complete loss of Purkinje cells. Can J Neurol Sci. 1991;87:407–420. doi: 10.1017/s0317167100032194. [DOI] [PubMed] [Google Scholar]
- 4.Beppu H, Suda M, Tanaka R. Analysis of cerebellar motor disorders by visually guided elbow tracking movement. Brain. 1984;107:407–420. doi: 10.1093/brain/107.3.787. [DOI] [PubMed] [Google Scholar]
- 5.Boussaoud D, Wise SP. Primate frontal cortex: neuronal activity following attentional versus intentional cues. Exp Brain Res. 1993;95:15–27. doi: 10.1007/BF00229650. [DOI] [PubMed] [Google Scholar]
- 6.Box GEP, Draper NR. Empirical model-building and response surfaces. Wiley; New York: 1987. [Google Scholar]
- 7.Crammond DJ, Kalaska JF. Modulation of preparatory neuronal activity in dorsal premotor cortex due to stimulus-response compatibility. J Neurophysiol. 1994;71:1281–1284. doi: 10.1152/jn.1994.71.3.1281. [DOI] [PubMed] [Google Scholar]
- 8.Diener HC, Dichgans J. Pathophysiology of cerebellar ataxia. Mov Disord. 1992;7:95–109. doi: 10.1002/mds.870070202. [DOI] [PubMed] [Google Scholar]
- 9.Ebner TJ, Fu Q-G. What features of visually guided arm movements are encoded in the simple spike discharge of cerebellar Purkinje cells? In: de Zeeuw CI, Strata P, Voogd J, editors. The cerebellum: from structure to control. Elsevier; Amsterdam: 1997. pp. 431–447. [DOI] [PubMed] [Google Scholar]
- 10.Fisher NI. Statistical analysis of circular data. Cambridge UP; New York: 1993. [Google Scholar]
- 11.Flanders M. Temporal patterns of muscle activation for arm movements in three-dimensional space. J Neurosci. 1991;11:2680–2693. doi: 10.1523/JNEUROSCI.11-09-02680.1991. [DOI] [PMC free article] [PubMed] [Google Scholar]
- 12.Fortier PA, Kalaska JF, Smith AM. Single unit activity of cerebellar cortical and nuclear cells in the monkey during whole-arm reaching movements over a 2-dimensional target board. J Neurophysiol. 1989;62:198–211. doi: 10.1152/jn.1989.62.1.198. [DOI] [PubMed] [Google Scholar]
- 13.Fortier PA, Smith AM, Kalaska JF. Comparison of cerebellar and motor cortex activity during reaching: directional tuning and response variability. J Neurophysiol. 1993;69:1136–1149. doi: 10.1152/jn.1993.69.4.1136. [DOI] [PubMed] [Google Scholar]
- 14.Frysinger RC, Bourbonnais D, Kalaska JF, Smith AM. Cerebellar cortical activity antagonist cocontraction and reciprocal inhibition of forearm muscles. J Neurophysiol. 1984;51:32–49. doi: 10.1152/jn.1984.51.1.32. [DOI] [PubMed] [Google Scholar]
- 15.Fu Q-G, Suarez JI, Ebner TJ. Neuronal specification of direction and distance during reaching movements in the superior precentral premotor area and primary motor cortex of monkeys. J Neurophysiol. 1993;70:2097–2116. doi: 10.1152/jn.1993.70.5.2097. [DOI] [PubMed] [Google Scholar]
- 16.Fu Q-G, Flament D, Coltz JD, Ebner TJ. Relationship of cerebellar Purkinje cell simple spike discharge to movement kinematics in the monkey. J Neurophysiol. 1997;78:478–491. doi: 10.1152/jn.1997.78.1.478. [DOI] [PubMed] [Google Scholar]
- 17.Georgopoulos AP, Kalaska JF, Caminiti R, Massey JT. On the relations between the direction of two-dimensional arm movements and cell discharge in primate motor cortex. J Neurosci. 1982;2:1527–1537. doi: 10.1523/JNEUROSCI.02-11-01527.1982. [DOI] [PMC free article] [PubMed] [Google Scholar]
- 18.Georgopoulos AP, Kalaska JF, Crutcher MD, Caminiti R, Massey JT. The representation of movement direction in the motor cortex: single cell and population studies. In: Edelman GM, Gall WE, Cowan WM, editors. Dynamic aspects of neocortical function. Wiley; New York: 1984. pp. 501–524. [Google Scholar]
- 19.Georgopoulos AP, Kettner RE, Schwartz AB. Primate motor cortex and free arm movements to visual targets in three-dimensional space. II. Coding of the direction of movement by a neuronal population. J Neurosci. 1988;8:2928–2937. doi: 10.1523/JNEUROSCI.08-08-02928.1988. [DOI] [PMC free article] [PubMed] [Google Scholar]
- 20.Gomi H, Shidara M, Takemura A, Inoue Y, Kawato M. Temporal ring patterns of Purkinje cells in the cerebellar ventral paraoculus during ocular following responses in monkeys. I. Simple spikes. J Neurophysiol. 1998;80:818–831. doi: 10.1152/jn.1998.80.2.818. [DOI] [PubMed] [Google Scholar]
- 21.Grill SE, Hallett M, Marcus C, McShane L. Disturbances of kinaesthesia in patients with cerebellar disorders. Brain. 1994;117:1433–1447. doi: 10.1093/brain/117.6.1433. [DOI] [PubMed] [Google Scholar]
- 22.Holmes G. The cerebellum of man. Brain. 1939;62:1–30. [Google Scholar]
- 23.Hore J, Wild B, Diener HC. Cerebellar dysmetria at the elbow, wrist, and fingers. J Neurophysiol. 1991;65:563–571. doi: 10.1152/jn.1991.65.3.563. [DOI] [PubMed] [Google Scholar]
- 24.Ivry RB, Diener HC. Impaired velocity perception in patients with lesions of the cerebellum. J Cognit Neurosci. 1991;3:355–366. doi: 10.1162/jocn.1991.3.4.355. [DOI] [PubMed] [Google Scholar]
- 25.Johnson MTV, Coltz JD, Hagen MC, Ebner TJ (1999) Visuomotor processing as reflected in the directional discharge of premotor and primary motor neurons. J Neurophysiol, in press. [DOI] [PubMed]
- 26.Kase M, Noda H, Suzuki DA, Miller DC. Target velocity signals of visual tracking in vermal Purkinje cells of the monkey. Science. 1979;205:717–720. doi: 10.1126/science.111350. [DOI] [PubMed] [Google Scholar]
- 27.Kettner RE, Mahamud S, Leung HC, Sitkoff N, Houk JC, Peterson BW, Barto AG. Prediction of complex two-dimensional trajectories by a cerebellar model of smooth pursuit eye movement. J Neurophysiol. 1997;77:2115–2130. doi: 10.1152/jn.1997.77.4.2115. [DOI] [PubMed] [Google Scholar]
- 28.Khuri AI, Cornell JA. Response surfaces: designs and analyses. Dekker; New York: 1996. [Google Scholar]
- 29.Krauzlis RJ, Lisberger SG. Simple spike responses of gaze velocity Purkinje cells in the floccular lobe of the monkey during the onset and offset of pursuit eye movements. J Neurophysiol. 1994;72:2045–2050. doi: 10.1152/jn.1994.72.4.2045. [DOI] [PubMed] [Google Scholar]
- 30.Lisberger SG, Fuchs AF. Role of primate flocculus during rapid behavioral modification of vestibuloocular reflex. I. Purkinje cell activity during visually guided horizontal smooth-pursuit eye movements and passive head rotation. J Neurophysiol. 1978;41:733–763. doi: 10.1152/jn.1978.41.3.733. [DOI] [PubMed] [Google Scholar]
- 31.Mano N-I, Yamamoto K-I. Simple-spike activity of cerebellar Purkinje cells related to visually guided wrist tracking movement in the monkey. J Neurophysiol. 1980;43:713–728. doi: 10.1152/jn.1980.43.3.713. [DOI] [PubMed] [Google Scholar]
- 32.Mano N, Ito Y, Shibutani H. Saccade-related Purkinje cells in the cerebellar hemispheres of the monkey. Exp Brain Res. 1991;84:465–470. doi: 10.1007/BF00230957. [DOI] [PubMed] [Google Scholar]
- 33.Mano N, Ito Y, Shibutani H. Context-dependent discharge characteristics of saccade-related Purkinje cells in the cerebellar hemispheres of the monkey. Prog Brain Res. 1996;112:423–430. doi: 10.1016/s0079-6123(08)63347-6. [DOI] [PubMed] [Google Scholar]
- 34.Mardia KV. Statistics of directional data. Academic; New York: 1972. [Google Scholar]
- 35.Marple-Horvat DE, Stein JF. Cerebellar neuronal activity related to arm movements in trained rhesus monkeys. J Physiol (Lond) 1987;394:351–366. doi: 10.1113/jphysiol.1987.sp016874. [DOI] [PMC free article] [PubMed] [Google Scholar]
- 36.Marple-Horvat DE, Stein JF. Neuronal activity in the lateral cerebellum of trained monkeys, related to visual stimuli or to eye movements. J Physiol (Lond) 1990;428:595–614. doi: 10.1113/jphysiol.1990.sp018230. [DOI] [PMC free article] [PubMed] [Google Scholar]
- 37.Miall RC, Weir DJ, Stein JF. Visuo-motor tracking during reversible inactivation of the cerebellum. Exp Brain Res. 1987;65:455–464. doi: 10.1007/BF00236319. [DOI] [PubMed] [Google Scholar]
- 38.Miles FA, Fuller JH. Visual tracking and the primate flocculus. Science. 1975;189:1000–1002. doi: 10.1126/science.1083068. [DOI] [PubMed] [Google Scholar]
- 39.Miller LE, Houk JC. Motor co-ordinates in primate red nucleus: preferential relation to muscle activation versus kinematic variables. J Physiol (Lond) 1995;488:533–548. doi: 10.1113/jphysiol.1995.sp020988. [DOI] [PMC free article] [PubMed] [Google Scholar]
- 40.Ohtsuka K, Noda H. Discharge properties of Purkinje cells in the oculomotor vermis during visually guided saccades in the macaque monkey. J Neurophysiol. 1995;74:1828–1840. doi: 10.1152/jn.1995.74.5.1828. [DOI] [PubMed] [Google Scholar]
- 41.Ojakangas CL, Ebner TJ. Purkinje cell complex and simple spike changes during a voluntary arm movement learning task in the monkey. J Neurophysiol. 1992;68:2222–2236. doi: 10.1152/jn.1992.68.6.2222. [DOI] [PubMed] [Google Scholar]
- 42.Pellionisz A, Llinas R. Brain modeling by tensor network theory and computer simulation. The cerebellum: distributed processor for predictive coordination. Neuroscience. 1979;4:323–348. doi: 10.1016/0306-4522(79)90097-6. [DOI] [PubMed] [Google Scholar]
- 43.Schwartz AB. Motor cortical activity during drawing movements: single-unit activity during sinusoid tracing. J Neurophysiol. 1992;68:528–541. doi: 10.1152/jn.1992.68.2.528. [DOI] [PubMed] [Google Scholar]
- 44.Schwartz AB. Motor cortical activity during drawing movements: population representation during sinusoid tracing. J Neurophysiol. 1993;70:28–36. doi: 10.1152/jn.1993.70.1.28. [DOI] [PubMed] [Google Scholar]
- 45.Schwartz AB, Kettner RE, Georgopoulos AP. Primate motor cortex and free arm movements to visual targets in three-dimensional space. I. Relations between single cell discharge and direction of movement. J Neurosci. 1988;8:2913–2927. doi: 10.1523/JNEUROSCI.08-08-02913.1988. [DOI] [PMC free article] [PubMed] [Google Scholar]
- 46.Shen L, Alexander GE. Preferential representation of instructed target location versus limb trajectory in dorsal premotor area. J Neurophysiol. 1997;77:1195–1212. doi: 10.1152/jn.1997.77.3.1195. [DOI] [PubMed] [Google Scholar]
- 47.Shidara M, Kawano K, Gomi H, Kawato M. Inverse-dynamics model eye movement control by Purkinje cells in the cerebellum. Nature. 1993;365:50–52. doi: 10.1038/365050a0. [DOI] [PubMed] [Google Scholar]
- 48.Stein JF, Glickstein M. Role of the cerebellum in visual guidance of movement. Physiol Rev. 1992;72:967–1017. doi: 10.1152/physrev.1992.72.4.967. [DOI] [PubMed] [Google Scholar]
- 49.Stone LS, Lisberger SG. Visual responses of Purkinje cells in the cerebellar flocculus during smooth-pursuit eye movements in monkeys. I. Simple spikes. J Neurophysiol. 1990;63:1241–1261. doi: 10.1152/jn.1990.63.5.1241. [DOI] [PubMed] [Google Scholar]
- 50.Suzuki DA, Keller EL. The role of the posterior vermis of monkey cerebellum in smooth-pursuit eye movement control. II. Target velocity-related Purkinje cell activity. J Neurophysiol. 1988;59:19–40. doi: 10.1152/jn.1988.59.1.19. [DOI] [PubMed] [Google Scholar]
- 51.Turner RS, Owens JWM, Anderson ME. Directional variation of spatial and temporal characteristics of limb movements made by monkeys in a two-dimensional work space. J Neurophysiol. 1995;74:684–697. doi: 10.1152/jn.1995.74.2.684. [DOI] [PubMed] [Google Scholar]
- 52.Turner RS, Grafton ST, Votaw JR, DeLong MR, Hoffman JM. Motor subcircuits mediating the control of movement velocity: a PET study. J Neurophysiol. 1998;80:2162–2176. doi: 10.1152/jn.1998.80.4.2162. [DOI] [PubMed] [Google Scholar]
- 53.van Donkelaar P, Lee RG. Interactions between the eye and hand motor systems: disruptions due to cerebellar dysfunction. J Neurophysiol. 1994;72:1674–1685. doi: 10.1152/jn.1994.72.4.1674. [DOI] [PubMed] [Google Scholar]
- 54.van Kan PL, Gibson AR, Houk JC. Output organization of intermediate cerebellum of the monkey. J Neurophysiol. 1993a;69:57–73. doi: 10.1152/jn.1993.69.1.57. [DOI] [PubMed] [Google Scholar]
- 55.van Kan PL, Gibson AR, Houk JC. Movement-related inputs to intermediate cerebellum of the monkey. J Neurophysiol. 1993b;69:74–94. doi: 10.1152/jn.1993.69.1.74. [DOI] [PubMed] [Google Scholar]
- 56.Vercher J-L, Gauthier GM. Cerebellar involvement in the coordination control of the oculo-manual tracking system: effects of cerebellar dentate nucleus lesion. Exp Brain Res. 1988;73:155–166. doi: 10.1007/BF00279669. [DOI] [PubMed] [Google Scholar]