

Abstract
GABAA-mediated miniature IPSCs (mIPSCs) were recorded from layer V pyramidal neurons of the visual cortex using whole-cell patch-clamp recording in rat brain slices. At room temperature, the benzodiazepine site agonist zolpidem enhanced both the amplitude (to 138 ± 26% of control value at 10 μm) and the duration (163 ± 14%) of mIPSCs. The enhancement of mIPSC amplitude was not caused by an increase of the single-channel conductance of the postsynaptic receptors, as determined by peak-scaled non-stationary fluctuation analysis of mIPSCs. The effect of zolpidem on fast, synaptic-like (1 msec duration) applications of GABA to outside-out patches was also investigated. The EC50 for fast GABA applications was 310 μm. In patches, zolpidem enhanced the amplitude of currents elicited by subsaturating GABA applications (100–300 μm) but not by saturating applications (10 mm). The increase of mIPSC amplitude by zolpidem provides evidence that the GABAA receptors are not saturated during miniature synaptic transmission in the recorded cells. By comparing the facilitation induced by 1 μm zolpidem on outside-out patches and mIPSCs, we estimated the concentration of GABA seen by the postsynaptic GABAA receptors to be ∼300 μm after single vesicle release. We have estimated a similar degree of receptor occupancy at room and physiological temperature. However, at 35°C, zolpidem did not enhance the amplitude of mIPSCs or of subsaturating GABA applications on patches, implying that, in these neurons, zolpidem cannot be used to probe the degree of receptor occupancy at physiological temperature.
Keywords: benzodiazepines, zolpidem, γ-aminobutyric acid type A receptors, miniature inhibitory postsynaptic currents, synaptic transmission
In the Central Nervous System, fast inhibitory synaptic transmission is primarily mediated by GABA acting on GABAA receptors. They bear various modulatory sites, among them the benzodiazepine (BZD) site (MacDonald and Olsen, 1994). The effects of BZD agonists on currents elicited by GABA to native or recombinant receptors (for review, see MacDonald and Olsen, 1994;Lavoie and Twyman, 1996; Mellor and Randall, 1997) are consistent with a change in the binding kinetics of GABA as well as desensitization kinetics of the receptor. This makes BZD agonists tools of choice to study the parameters of GABAA receptor activation during synaptic transmission (De Koninck and Mody, 1994; Frerking et al., 1995).
The high concentration of glutamate estimated in the synaptic cleft at excitatory synapses (Clements et al., 1992) has led to the hypothesis that receptor saturation occurs during a synaptic event. This assumption is consistent with the observation of peaky amplitude distributions of the evoked postsynaptic currents (Edwards et al., 1990) that result from the summation of elementary events, quanta, with a low coefficient of variation (CV). Given the low number of receptors activated during a miniature synaptic event (Edwards et al., 1990;Ropert et al., 1990), a low CV can be obtained only if the channel open probability is very high at the peak of the synaptic current (Jonas et al., 1993), implying that the degree of occupancy of postsynaptic receptors is high during synaptic transmission.
The view that receptor saturation occurs during single-site release in central synapses has recently been challenged for non-NMDA glutamate receptors (Tong and Jahr, 1994; Silver et al., 1996). For NMDA or GABAA receptors, whose affinity for their endogenous ligand is higher than for non-NMDA receptors, saturation is thought to occur during synaptic transmission (Clements, 1996). However, because the neurotransmitter is present only very briefly in the synaptic cleft, the relevant parameter is the binding rate of the ligand to its receptor rather than its affinity; therefore, GABAA and NMDA receptors may also not be saturated (Holmes, 1995; Frerking and Wilson, 1996). Consistent with this argument, the variability of uniquantal synaptic events can be large at inhibitory [Grantyn and Veselovsky (1997), but see Auger and Marty (1997)] and excitatory synapses, indicating that receptor occupancy is not maximal (Liu and Tsien, 1995; Stevens and Wang, 1995; Silver et al., 1996). Finally, it has been proposed that the amplitude of GABAergic miniature IPSCs (mIPSCs) depends on transmitter concentration (Frerking et al., 1995).
In the present study, we examined the issue of GABAAreceptor saturation during miniature synaptic transmission. We have tested the effect of the BZD agonist zolpidem on mIPSCs in layer V pyramidal cells in rat visual cortex. At room temperature, the mean amplitude of mIPSCs was increased by zolpidem, and we established that this effect reflects the binding and activation of more synaptic receptors, which implies that GABAA receptors are not saturated during synaptic transmission.
Some of these results have been published previously in abstract form (Perrais and Ropert, 1997).
MATERIALS AND METHODS
Brain slice preparation. Slices were prepared from young male Wistar rats (mean 17 d old; range, 15–25 d old). The animals were anesthetized with sodium pentobarbital and decapitated. The brain was rapidly removed and submerged in oxygenated (5% CO2, 95% O2) cold artificial CSF (ACSF) for dissection of the occipital cortex. Slices (300 μm thickness) were cut in the sagittal plane using a vibratome (DTK-1000, DSK) and maintained at a temperature of 35°C for at least 1 hr before recording.
Electrophysiology and data analysis. The neurons were identified using an upright microscope (Axioskop, Zeiss) with Nomarski optics and an infrared video camera (Newvicon, Hamamatsu) as reported previously (Stuart et al., 1993). Most of the recordings were made at room temperature (22–25°C) from slices kept under constant (2 ml/min) ACSF perfusion. For the experiments of Figures8 and 9, slices were recorded at 35°C. The ACSF was heated before entering the recording chamber. For outside-out patch recordings at 35°C, the application pipette was dipped into the bath along 5 mm, and thus the flowing solutions were heated to 35°C (Tong and Jahr, 1994). The temperature was measured by a thermal probe before and after each experiment.
Fig. 8.
Activation of GABAA receptors at physiological temperature. A, Peak-scaled NSFA was performed on 95 mIPSCs recorded at 35°C. The average (thick line)and three events (dotted line) are shown. The parabolic fit of the variance–mean current gave i = −2.14 pA andNp = 37.3. B, Currents (averages of 5 traces) evoked by the application of 300 μm(small trace) and 10 mm(large trace) GABA to an outside-out patch during 1 msec at 35°C. The top traceshows the open pipette response.
Fig. 9.

Action of zolpidem at physiological temperature.A, Effect of zolpidem on mIPSCs at 35°C. Average mIPSC before (thin line) and during (thick line) the application of 1 μm zolpidem. B, Cumulative histograms of amplitude and duration of mIPSCs before (thin line) and during (thick line) zolpidem application. Amplitudes are not significantly different (−54.7 ± 38.4 pA in control, 630 events vs −55.6 ± 40.9 pA in zolpidem, 689 events; KS test, p > 0.05), whereas durations are different (7.5 ± 3.1 msec in control, 166 events and 10.2 ± 3.5 msec in zolpidem, 153 events; KS test, p < 0.001). The potentiation of durations is uniform: the control distribution scaled to the distribution in zolpidem (dotted line) and the zolpidem distribution are not significantly different (p > 0.05). C, Effect of zolpidem (1 μm) on currents evoked by 300 μm GABA at 35°C. Average of five traces before (thin line) and during(thick line) zolpidem application. The trace on top shows the open pipette response. Right, The same traces are shown on a greater time scale.
Recording pipettes were made using cleaned and sterilized borosilicate glass. Their typical resistance was 1–2 MΩ for whole-cell recordings and 2–8 MΩ for outside-out somatic patch recordings. The pipettes were coated with beeswax. Recordings were performed using a patch-clamp amplifier (Axopatch 200A, Axon Instruments). During recording, the stability of the series resistance, between 5 and 15 MΩ, was checked using a +2 or +5 mV voltage step applied every 20 sec, and the recording was discarded if it increased by >10%. Evoked activity was stored on a computer online. Spontaneous synaptic activity was filtered at 2 kHz and stored on digital tape recorder (DTR-1202, 48 kHz sampling rate, Biologic) for subsequent analysis. The data were acquired using a Digidata 1200 board (Axon Instruments) and analyzed using programmable software (Acquis 1, Biologic).
Spontaneous synaptic activity during periods of 1–3 min was digitized at 20 kHz. Between 200 and 1500 synaptic events per period were detected using a threshold crossing of the derivative with parameters set for each cell and kept constant for the whole session. The events detected were then visually inspected to remove electrical artifacts. Their peak amplitude and 10–90% rise time were measured. The decay phase of individual events (with no superimposition) could be fitted by one or more exponentials. Because the changes observed during zolpidem application did not consistently affect one component in particular, the duration of mIPSCs was quantified by calculating an estimation of the time constant of decay (τe) without any assumption on the number of decay components:
where I is the current and A is the peak amplitude of the mIPSC. The integral is taken between the peak of the IPSC and the return to baseline. If one attempts to fit the decay by a sum of exponentials I(t) ≈ ∑Aiexp(−t/τi), then τe ≈ ∫∑Aiexp(−t/τi)dt/A= (∑Aiτi)/A, which corresponds to the mean of the decay time constants used for the fit. The estimation of the duration τe (term used in the rest of this paper) of the mIPSCs using this procedure and a classical fit with exponential functions gave similar results (see Fig.1B).
Fig. 1.

Distribution of miniature IPSCs recorded from a layer V cortical pyramidal cell. A, Histograms of amplitude (bin size 2 pA, 457 events), rise time (bin size 0.1 msec, 457 events), and duration (bin size 1 msec, 170 events) of miniature IPSCs occuring in 1 min. The mean ± SD of these parameters are −32.4 ± 19.3 pA, 1.00 ± 0.42 msec, and 14.5 ± 7.6 msec, respectively. In the amplitude histogram, the noise distribution is also shown (black histogram). B, The average of mIPSCs with no overlap (taken for duration measurements) is shown for the same cell. Its decay can be fitted by a single exponential, with τ = 13.7 msec. The duration of the same average mIPSC calculated with the method used for individual events is τe = 13.5 msec.C, Plot of duration versus rise time shows no strong correlation between these two parameters (correlation coefficient, 0.28; slope of the regression, 0.015).
The zolpidem concentration increase of mIPSC duration graphs (see Fig.3) were fitted with the following equation:
where Z is the concentration of zolpidem, τe,control is the duration of mIPSCs without zolpidem,Max is the maximal relative increase of the duration, EC50 is the half-maximal effect concentration, andh is the Hill coefficient. For each concentration, the stationarity of the mIPSC parameters was ascertained. Moreover, no change of the amplitude or the duration of mIPSCs was seen in control conditions over a period of 30 min, which exceeds the duration of the recordings necessary to test the effects of zolpidem.
Fig. 3.

Concentration-dependent effects of zolpidem on mIPSCs in neocortical pyramidal cells. A,a, Average mIPSCs recorded in a single cell in control conditions and during the application of 0.1, 1, 10, and 100 μm zolpidem, fromleft to right. b, The traces are scaled to the control amplitude to show the effect of zolpidem on the duration of the currents. B, Effect of zolpidem on (a) mean mIPSC amplitude and (b) mean mIPSC duration. The values obtained in various concentrations of zolpidem are plotted as ratios over control values. Each point represents the mean ± SD of the number of cells given in parentheses. The parameters of the fitted sigmoidal curve (see Materials and Methods) are EC50, 5.8 μm;h, 0.36; Max, 221%. C, Antagonistic effect of flumazenil (dotted line, 10 μm) on the effect of zolpidem (thick line, 1 μm) shown on one cell. Bottom, Summary graph (n= 5) of the effect of zolpidem and flumazenil on the amplitude (open bars) and duration (black bars) of mIPSCs.
Non-stationary fluctuation analysis (NSFA) was performed on currents elicited by fast applications of saturating concentrations of GABA on outside-out patches as described previously (Jonas et al., 1993). Series of 15–40 applications with stable maximal amplitude and duration were averaged. For each individual trace, the variance around the mean, minus the variance of the baseline noise, was computed for regularly spaced time intervals. For each interval, the corresponding mean current was measured, and the relation between the mean currentI and the variance ς2, minus the variance of the recording noise ςbasal2, was drawn. These two parameters can be decomposed asI(t) = NP(t)iand ς2 − ςbasal2 =NP(t)(1 −P(t))i2, whereN is the number of channels open at the peak of the current,P(t) is the open probability of channels, andi is the current carried by a single open channel. From these expressions a parabolic curve was fitted with the equation ς2 − ςbasal2 =iI − I2/N, giving i and N. The maximal open probability of the channels was also calculated with Po,max = 1 − (ςpeak2 − ςbasal2)/iIpeakwhere ςpeak2 andIpeak are the variance and the average of the current at its peak, respectively.
Peak-scaled NSFA was also performed on mIPSCs to estimate i(Traynelis et al., 1993; De Koninck and Mody, 1994; Silver et al., 1996). In cells where the mIPSC frequency was low enough, 30–100 mIPSCs were selected, with no overlap with other minis. The procedure was the same as for NSFA, except that the average of these mIPSCs was scaled to each individual mini before computing the variance. Therefore, the relation between I and ς2 becomes ς2 − ςbasal2 = iI −I2/Np, where Np is the number of channels open at the peak of the current.
All results are given as mean ± SD. The variability was measured by the CV, which is the ratio of the SD to the mean. The large sample approximation of the Kolmogorov–Smirnoff test (KS test) was used to compare the distributions of the mIPSC parameters. The paired or unpaired Student’s two-tailed t test was used to examine the level of significance of the results.
Solutions. The extracellular standard ACSF contained (in mm): NaCl 126, KCl 1.5, KH2PO41.25, MgSO4 1.5, CaCl2 2, NaHCO326, and glucose 10. GABAA-mediated mIPSCs were recorded in the presence 6-cyano-7-nitroquinoxaline-2,3-dione (CNQX, 10 μm; Tocris) andd(−)-2-amino-5-phosphonopentanoic acid (APV, 50 μm; Tocris) to block non-NMDA- and NMDA-mediated glutamatergic synaptic currents, and tetrodotoxin (TTX) to block action potentials (1 μm; Sigma, Janssen, or Latoxan). The mIPSCs or the GABA-evoked currents in outside-out patches were blocked by bicuculline methiodide (10 μm; Sigma) or picrotoxin (100 μm; Sigma). Zolpidem was a gift from Synthelabo Recherche, and flumazenil (Ro 15-788) was a gift from R. Corradetti (University of Firenze). Zolpidem was dissolved in water in stock solutions (5 mm), and flumazenil was dissolved in DMSO. The final fraction of DMSO was 0.2%, which had no effect on mIPSCs (n = 2) or on the effect of zolpidem (n= 4). In our preparation, the recovery after an application of zolpidem was not complete after 30 min wash out; therefore we took a new slice after each zolpidem inflow.
Intrapipette solutions for whole-cell recording contained (in mm): CsCl 140, HEPES 10, MgCl2 3, EGTA 0.5, pH 7.3, 280 mOsm. For outside-out patches and some whole-cell recordings, intrapipette solutions contained (in mm): CsCl 120, HEPES 10, ATP 4, GTP 0.5, MgCl2 2, EGTA 10, pH 7.3, 280 mOsm. Potentials were corrected for a −4 mV junction potential. Because no differences were seen between the recordings obtained with both intracellular solutions, the results were pooled together.
Fast application of GABA was performed on outside-out patches as described previously (Colquhoun et al., 1992). The control solution contained (in mm): NaCl 140, CaCl2 2, KCl 1.5, MgCl2 1, HEPES 10, adjusted to pH 7.4. In the GABA-containing solution, we added 30 mm sucrose to visualize the interface between the control and the GABA solutions, and 10 mm NaCl to measure the 10–90% exchange time between the control and the agonist solutions after blowing out the patch, which was typically 0.2 msec (see Fig. 5). Applications were made every 10 sec to avoid desensitization of the GABAA receptors. Usually, the responses during the first few GABA applications tended to diminish before reaching a stationary level. This initial amplitude decrease did not seem to be attributable to cumulative desensitization of the receptors, because it was not dependent on the application frequency and was not reversed if the application was stopped. Then the response could remain stable for up to 20 min. Up to four different solutions could be applied in each barrel by switching the perfusion tubes with a valve. The exchange time between the two solutions was ∼30 sec. When the effect of bicuculline or zolpidem was tested on the response to the application of GABA, both control and GABA solutions contained the modulators.
Fig. 5.

Fast applications of GABA to an outside-out patch excised from a pyramidal cell. A, The current elicited by application of GABA (1 mm) during 1 msec is blocked by bicuculline (10 μm). The traces represent the averages of five applications. Bicuculline was added in the control and the GABA flow. The trace above represents the response once the patch was blown out, showing the duration of the GABA application.B, GABA-evoked currents at various membrane potentials. Traces shown at −70, −50, −30, −10, 0, 10, 30, and 50 mV.Right, I–V curve of the peak currents. The reversal potential calculated from the second order polynomial fit is 0 mV. Inset shows the traces at −70 and +50 mV normalized and superimposed. C, Non-stationary fluctuation analysis of GABA (10 mm)-evoked currents. a, One individual current (dotted line) is shown superimposed with the average current. b, Plot of the current amplitude for successive applications. c, Plot of the variance–mean current curve, fitted with the equation ς2 = iI −I2/N, with i = 1.69 and N = 201. The maximal open probability,Po,max, is 0.65.
RESULTS
Description of mIPSCs
Spontaneous GABAA-mediated miniature postsynaptic currents were recorded in layer V cortical pyramidal neurons in the presence of 10 μm CNQX, 50 μm APV, and 1 μm TTX at a holding potential of −70 mV. The distributions of time intervals between events were fitted by a single exponential, as expected for a random Poisson process (see Fig.2D). The mean amplitudes of mIPSCs were −37.3 ± 9.2 pA (range, 21–57 pA; n = 18). The amplitude distributions of the mIPSCs recorded in each neuron were highly variable (CV = 0.56 ± 0.08; range, 0.42–0.69) and not normally distributed but skewed toward high values (Fig.1A), as in several other preparations (Edwards et al., 1990; Ropert et al., 1990; Frerking et al., 1995; Soltesz et al., 1995; Nusser et al., 1997). The durations (see calculation in Materials and Methods) and 10–90% rise times of the mIPSCs were also highly variable, and their distributions were also skewed toward high values (Fig. 1A). Their mean values were 14.5 ± 2.7 msec (range, 10.7–19.5 msec) and 0.98 ± 0.11 (range, 0.79–1.13 msec), respectively, and their CVs were 0.49 ± 0.13 and 0.44 ± 0.11, respectively. We saw a very low positive correlation between duration and rise time of mIPSCs (correlation coefficient: 0.17 ± 0.13, slope of the linear regression 0.012 ± 0.009) (Fig. 1C), and no significant correlation (correlation coefficient < 0.3) between the amplitude and the rise time or the duration of mIPSCs. This result indicates that dendritic filtering does not play an important role in shaping the distribution of mIPSC kinetics (Jonas et al., 1993; Soltesz et al., 1995).
Fig. 2.

Effects of bath application of 10 μmzolpidem on the mIPSCs recorded in a layer V cortical pyramidal cell.A, Recordings of miniature activity before and during the application of 10 μm zolpidem. B, Averages of mIPSCs in control (thin line, 329 events) and in 10 μm zolpidem (thick line, 313 events).Inset shows both traces normalized to their peak amplitudes.C, Cumulative histograms of amplitude, duration, and interevent interval in control (thin line) and zolpidem (thick line). The mean mIPSC amplitude is −47 ± 22 pA in control and −61 ± 29 pA in zolpidem, and the mean mIPSC duration is 19.5 ± 6.5 msec in control and 32.5 ± 9.6 msec in zolpidem. The distributions of these two parameters in zolpidem are significantly different from the control distributions (KS test;p < 0.001). The dotted lines show the calculated distributions of uniformly potentiated control values, which are not significantly different from the distribution in zolpidem (KS test; p > 0.05). The cumulative histograms of interevent intervals in control and zolpidem are not significantly different (p > 0.05).
Effect of zolpidem on mIPSCs
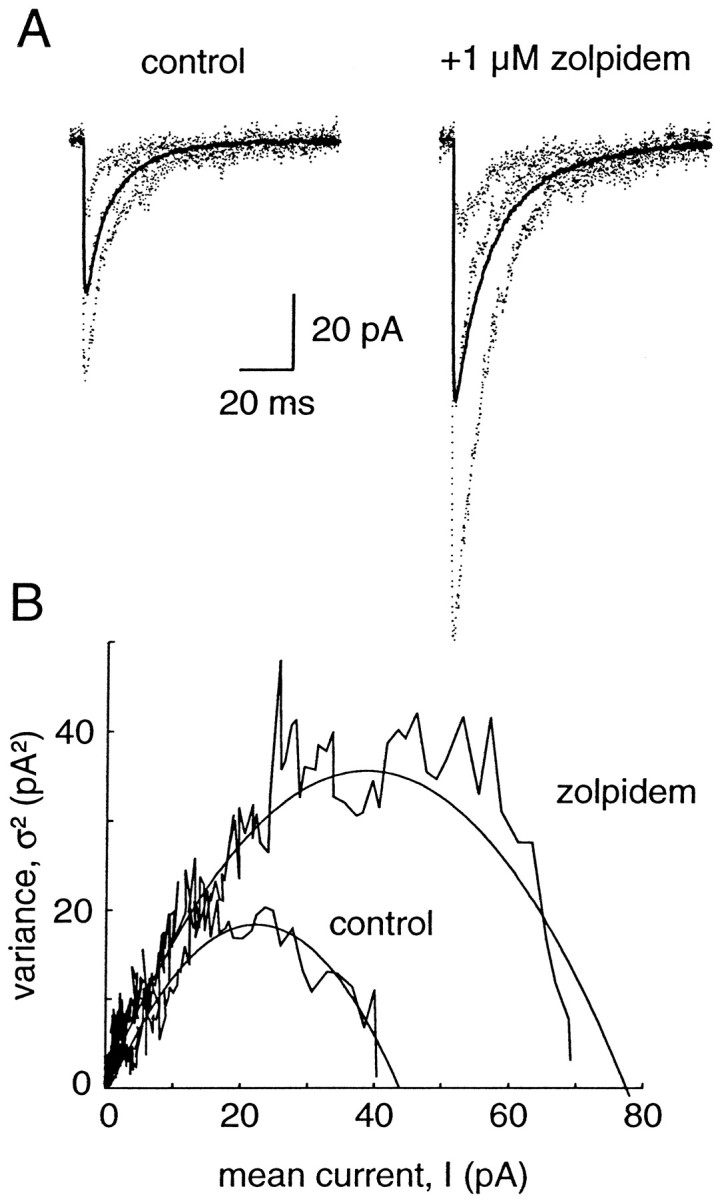
The effect of the BZD agonist zolpidem (10 μm) on mIPSCs was studied in layer V pyramidal cells (n = 12). It did not change the frequency of events (5.7 ± 3.0 Hz in control vs 6.1 ± 3.5 Hz in zolpidem; p > 0.05, paired t test), consistent with the purely postsynaptic actions ascribed to this compound (Fig.2C). Moreover, the input resistance of the cells and the noise level of the recordings were not changed by zolpidem. The observed effects are thus presumably caused exclusively by the binding of zolpidem to postsynaptic GABAA receptors.
Zolpidem applied in the bath enhanced significantly both the duration (163 ± 14% of control; p < 0.001) and the amplitude (138 ± 26% of control; p < 0.005) of events (Fig. 2B). The amplitude distributions in control and in 10 μm zolpidem were significantly different (KS test; p < 0.001) in 10 of 12 pyramidal cells, and the distributions of durations were significantly different in the 12 cells (KS test; p < 0.001). Zolpidem is among the most selective known BZD agonists: three types of GABAA receptors with high, intermediate, or low affinity for zolpidem can be differentiated (Lüddens et al., 1995). To test whether the zolpidem-induced increases in amplitude and duration were uniform, we compared the mIPSC distributions with and without zolpidem. We normalized the control distributions by a scaling factor equal to the ratio of the amplitude (or duration) in zolpidem and in control. These two distributions were not significantly different (KS test; p > 0.05) in the 12 pyramidal cells tested (Fig. 2C); therefore, the hypothesis of a non-uniform population of GABAergic synapses with distinct GABAA receptor subtypes activated in the presence of TTX is not supported by our data.
Even if all of the postsynaptic receptor clusters, active during TTX application, are equally affected by zolpidem, not all of the receptors in a synapse are necessarily equally sensitive to this compound. To test the intrasynaptic heterogeneity of GABAA receptors underlying mIPSCs in these cells, we looked at the effect of several concentrations of zolpidem (Fig. 3). The potentiation of the duration and amplitude were approximately parallel at low concentrations (<10 μm), but the effect on the amplitude decreased at the highest concentration tested (100 μm). In contrast, the dose–response curve for the duration could be fitted by the logistic equation (see Materials and Methods), and the calculated EC50, Hill coefficient, and maximal effect were 5.8 μm, 0.36, and 221% of control duration, respectively. The effect of zolpidem (1 μm) was reversed by the BZD antagonist flumazenil (10 μm): the mean amplitude of mIPSCs returned to 94 ± 3% of control (n = 5), and their duration returned to 104 ± 5% of control (Fig. 3C).
It should be noted that the mIPSCs recorded are filtered to some extent, compared with the synaptic conductance (Llano et al., 1991;Jonas et al., 1993). Therefore, we examined whether a lengthening of the synaptic current at its source could induce a significant increase in the peak amplitude of the recorded current caused by filtering. The filter (cell and recording system) can be modeled in a first approximation as a low-pass capacitive filter, with a time constantT. Because there is no correlation between the amplitude, rise time, and duration of mIPSCs (Fig. 1C), the events are presumably filtered to the same extent. We assumed a current source at the synapse Is(t) with an instantaneous rise and an exponential decay τ and calculated how this current amplitude is changed by filtering. The current source isIs(t) =I0*exp(−t/τ) for t≥ 0 and I(t) = 0 for t < 0. The current recorded at the soma is I(t) =I0*(τ/(τ −T))*(exp(−t/τ) − exp(−t/T)) for t ≥ 0 (Llano et al., 1991). The time-to-peak of the current recorded at the soma is t0 = (τ*T/(τ −T))*ln(τ/T), its amplitude isI(t0) =I0*exp(−t0/τ), and its estimated time constant (see Materials and Methods) is τe = τ/I(t0) = τ*exp(t0/τ). The highest rise time and the lowest duration of the recorded mIPSCs give values for events that are the most sensitive to filtering. They were chosen to estimateT and τ. The highest 10–90% rise time of the mIPSCs (1.1 msec) gives a value of t0 equal to 1.5 msec. From this value and the fastest decay of the mIPSCs (10.8 msec), we obtain a value of τ equal to 9 msec and a value of T equal to 0.5 msec. In these conditions, when τ is doubled, which is more than the change in the mIPSC duration observed in 10 μmzolpidem (163% of the control value), the recorded mIPSC amplitude would be 107% of the control amplitude, far lower than the value found (Fig. 3). Thus the increase of the amplitude of the recorded mIPSCs during zolpidem application is most likely mainly caused by an increase of the current source amplitude.
A postsynaptic current is attributable to the binding of the neurotransmitter and the activation of Nbindependent channels (Edmonds et al., 1995). The opening probability of a channel that has bound the neurotransmitter is a function of time, termed Po(t), and therefore the postsynaptic current can be decomposed as I(t) =Nb*Po(t)*i, where i is the current carried by a single channel. Thus the increase of the mean mIPSC peak amplitude Ipeakby zolpidem (Figs. 2, 3) can be attributable to the increase of these three different terms: Nb,Po,max, or i. The following experiments were performed to identify which terms are changed by zolpidem.
Peak-scaled non-stationary variance analysis of mIPSCs
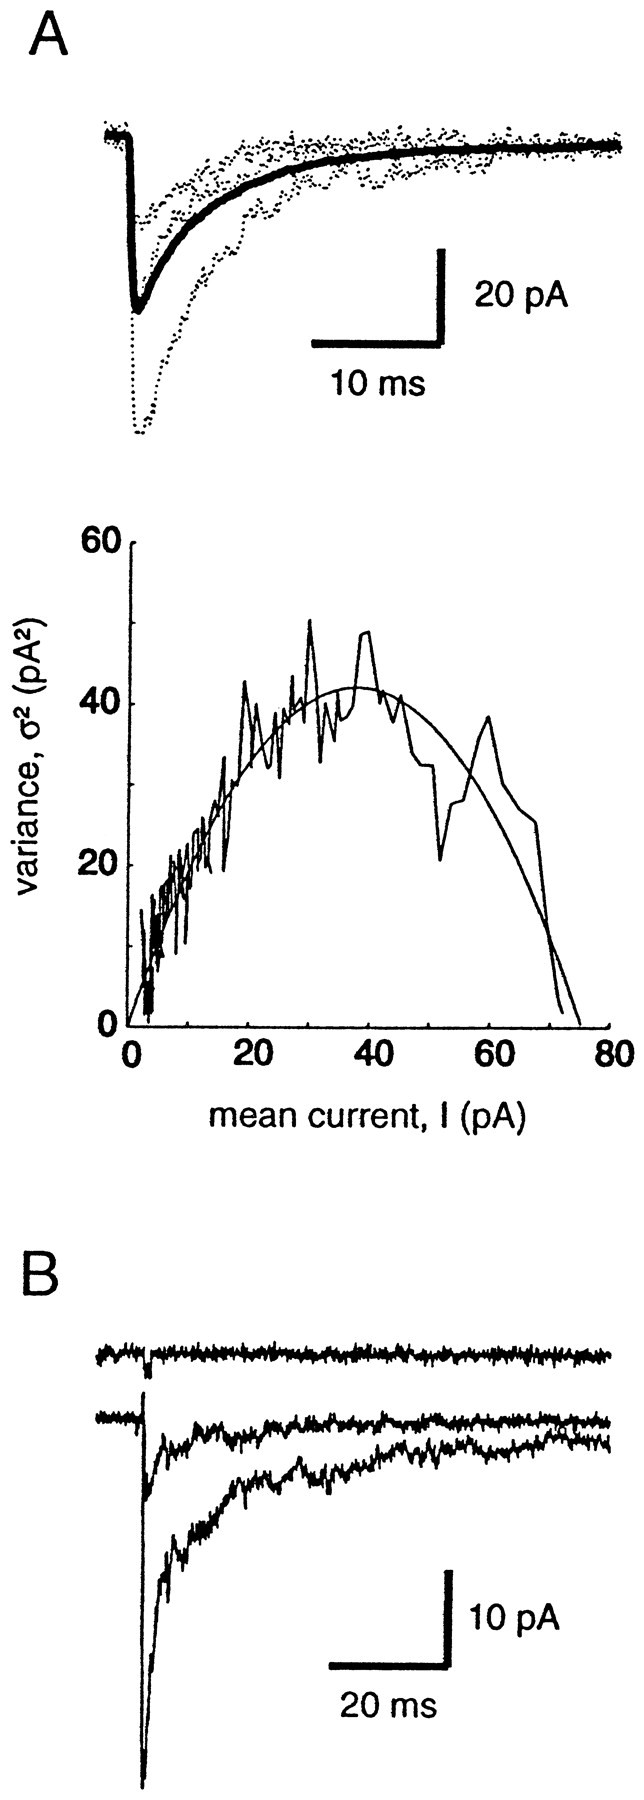
The elementary current i can be derived from peak-scaled nonstationary variance analysis of postsynaptic currents (Traynelis et al., 1993; De Koninck and Mody, 1994; Silver et al., 1996). In six pyramidal cells where the frequency was low enough to perform such an analysis (Fig. 4), we found i = −1.85 ± 0.17 pA, which leads, taking a reversal potential of 0 mV (Fig.5B), to a single-channel conductance of 26.4 ± 2.4 pS. The mean number of channels open at the peak (Np) for this sample is 30.9 ± 7.3. When zolpidem (1 or 10 μm) is applied, the elementary current i remains constant (−1.88 ± 0.26 pA, 103 ± 18% of control value; p = 0.8), whereas Np is enhanced (39.1 ± 7.6, 132 ± 36% of control; p = 0.06). Thus we can conclude that the enhancement of mIPSC amplitude by zolpidem is not caused by an increase in the single-channel conductance of postsynaptic GABAA receptors. However, because the mIPSCs are highly variable in amplitude (Fig. 1), presumably because the number of channels at different synapses or the amount of GABA released is variable, a scaling procedure was used, and thus it could not be determined by this method whether Nb orPo,max was enhanced. To answer these questions, we used a system in which the number of receptors was constant and we could control the concentration of GABA applied; that is, fast applications of GABA to outside-out patches.
Fig. 4.
Peak-scaled non-stationary variance analysis of mIPSCs before and during zolpidem application. A, Individual mIPSCs are shown (dotted lines) with the average currents(thick lines) in control and during bath application of 1 μm zolpidem. B, Relationship between the current and the variance in control and in zolpidem. The curves were fitted with the equation ς2 = iI −I2/Np. The values obtained are 1.75 and 1.82 pA for i, in control and zolpidem, respectively, and 25.4 and 46.7 forNp, in control and zolpidem.
Fast application of GABA to outside-out patches of layer V pyramidal neurons
After synaptic release, the neurotransmitter is thought to be present only very briefly at high concentration in the synaptic cleft (Clements et al., 1992). This synaptic concentration transient can be mimicked by short (1 msec) agonist applications to outside-out patches (Colquhoun et al., 1992; Jones and Westbrook, 1995; Galarreta and Hestrin, 1997). To test whether zolpidem can enhance the maximal probability of opening (Po,max) of GABAA receptors in conditions similar to those during synaptic release, we first determined at which concentration of GABA the receptors are saturated by a 1 msec application to outside-out patches.
The currents elicited by short pulses (1 msec) of 1 mm GABA are illustrated in Figure 5. The GABA currents are blocked by bicuculline (10 μm;n = 3). Their reversal potential is 0 mV (n = 7), corresponding to the chloride equilibrium potential in our recording conditions. On some patches, single-channel openings could be resolved (Fig.7D) with an elementary current of −1.78 ± 0.19 pA (n = 6), leading to a chord conductance of 25.4 ± 2.7 pS, which is close to the value found for channels underlying mIPSCs. The decay of these currents can be, like mIPSCs, well fitted by the sum of two exponentials (Table1). However, the slowest component is much greater in patches than for mIPSCs, as reported previously in various preparations (Tia et al., 1996; Galarreta and Hestrin, 1997;Mellor and Randall, 1997). The deactivation kinetics of GABAA receptor-channels are voltage independent (Fig. 5, Table 1).
Fig. 7.
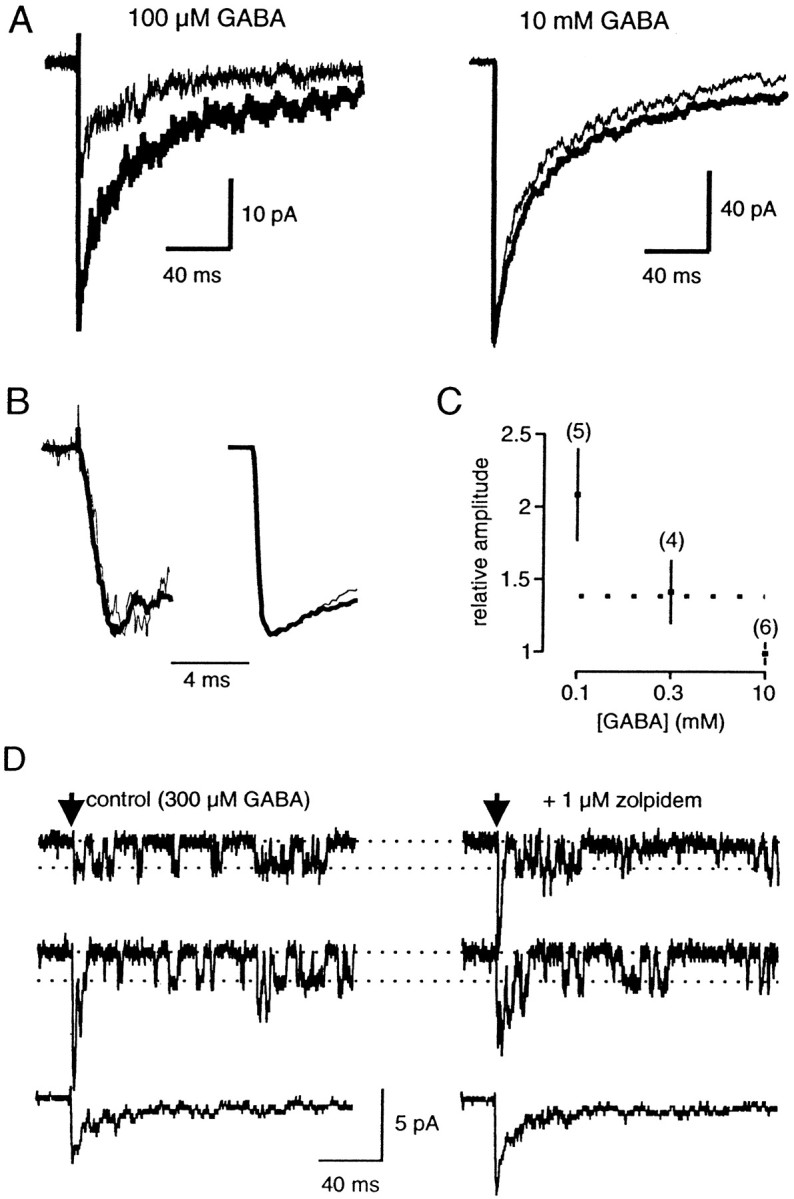
Effects of zolpidem on currents elicited by 1 msec applications of GABA to an outside-out patch taken from a pyramidal neuron. A, Averages of five traces before (thin line) and during (thick line) the application of 1 μm zolpidem. Left, Application of 100 μm GABA. Right, Application of 10 mm GABA. Data were obtained for two different patches.B, Same traces as in A, normalized and on a greater time scale. The rise time of the currents is not changed by zolpidem at the two GABA concentrations. C, Plot of the change in amplitude induced by zolpidem (1 μm) at different GABA concentrations. Significant differences between control and zolpidem for 100 (p < 0.005) and 300 μm GABA (p < 0.05). Thedotted line shows the value found for mIPSCs (see Fig. 3).D, In this patch, the application of 300 μmGABA induced the opening of only a few GABAA receptor channels (filter corner frequency, 1 kHz). Thus single-channel openings could be clearly resolved, giving an elementary current of 1.9 pA (conductance, 27 pS). Zolpidem (1 μm) induced a 40% enhancement of the peak amplitude, as seen at the bottom traces (averages of 20 responses in each condition), but no change in the channel conductance, as seen in the single-channel recordings.
Table 1.
Kinetic parameters of GABA-mediated currents
| Rise time (msec) | τ1(msec) | % (τ1) | τ2(msec) | τmoy or τe (msec) | n | |
|---|---|---|---|---|---|---|
| mIPSCs1-a | 0.81 ± 0.161-b | 8.7 ± 2.2 | 66 ± 12 | 27 ± 14 | 13.0 ± 3.3 | 18 |
| 10 mm | 0.40 ± 0.111-b | 5.0 ± 2.1 | 48 ± 8 | 95 ± 55 | 53 ± 24 | 10 |
| 1 mm | 0.57 ± 0.17 | 3.1 ± 0.9 | 58 ± 9 | 109 ± 36 | 47 ± 14 | 15 |
| 1 mm (+30 mV) | 0.60 ± 0.14 | 5.8 ± 4.0 | 52 ± 14 | 91 ± 19 | 43 ± 16 | 5 |
| 300 μm | 0.76 ± 0.121-b | 3.3 ± 1.2 | 64 ± 11 | 105 ± 22 | 39 ± 9 | 6 |
| 100 μm | 0.84 ± 0.201-b | n.d. | n.d. | n.d. | 35 ± 71-c | 6 |
n.d., Not determined.
The values are different from the text, because they result from the fit of the average mIPSCs.
Significantly different from the rise time of 1 mm GABA-elicited currents (p < 0.01).
The responses to 100 μm GABA were too small to be reliably fitted with exponentials. Therefore we used τe to quantify their decay kinetics. It is significantly (unpaired t test, p < 0.05) shorter that the decay of 1 mm GABA-elicited currents.
NSFA was performed on three patches (Fig. 5C) with saturating applications of GABA (10 mm) (see below). The fits of the variance–mean current gave an elementary current of −1.67 ± 0.02 pA (conductance: 23.9 ± 0.3 pS). This value is close to the one found for channels underlying mIPSCs and to measured single channel openings. Po,max could also be calculated (see Materials and Methods), which gave 0.61 ± 0.06 (n = 3). This value is in good agreement with previously reported values for GABAA receptors (Jones and Westbrook, 1997).
We constructed a concentration–response curve by taking the response to 1 msec pulses of 1 mm GABA as a reference and changing for one or more other concentrations on the same patch (Fig. 6). We measured an EC50 of 310 μm, a Hill coefficient of 1.74, and a maximal relative response of 1.13, which is close to previously reported values for the same cells (Galarreta and Hestrin, 1997). At a concentration of 10 mm the receptors are saturated, so we took this concentration of GABA to test the effect of zolpidem on Po,max.
Fig. 6.
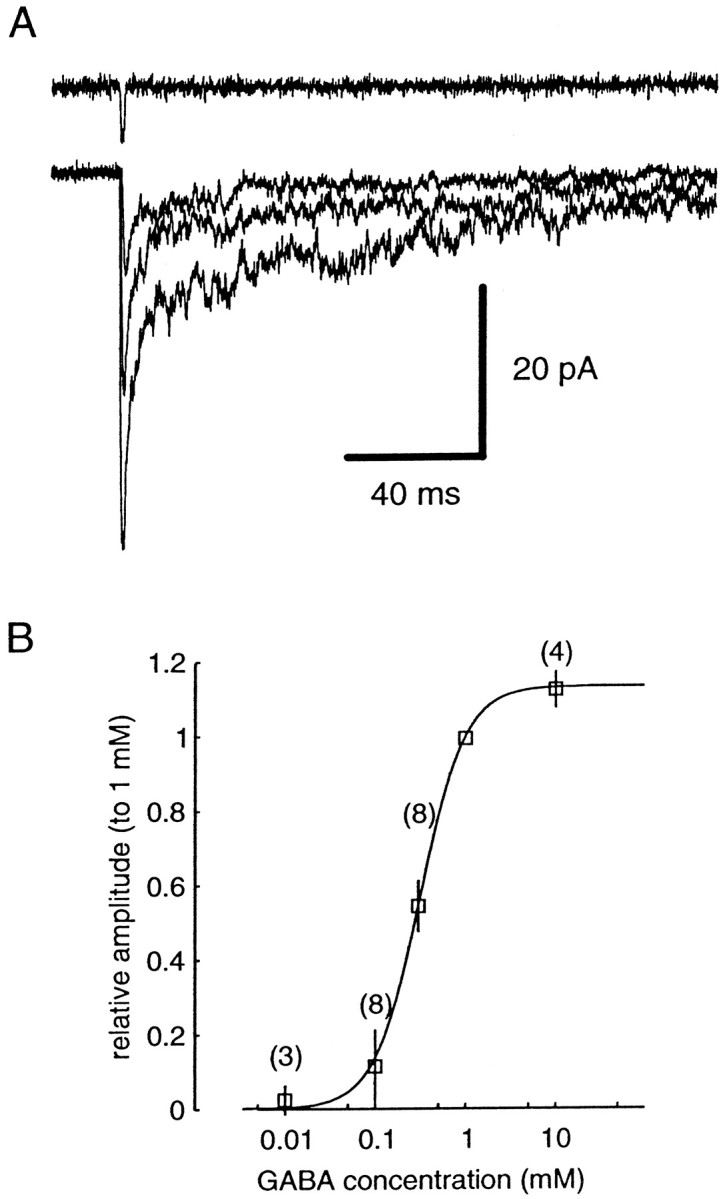
Concentration–response curve for 1 msec GABA applications to outside-out patches. A, Responses of a patch to 100 μm, 300 μm, and 1 mmGABA. Averages of five traces. The open pipette response is shown above. B, Concentration–amplitude curve, normalized to the response to 1 mm GABA. The number of patches used for each point (mean ± SD) is given in parentheses. The curve is fitted by a sigmoidal function, whose parameters are EC50 = 310 μm, h = 1.74,Imax = 1.13.
We also examined the changes in the kinetics of the GABA-evoked currents with the concentration of agonist applied. The 10–90% rise time of the currents was reduced as the concentration of GABA increased (Table 1). We did not see any significant change in the decay kinetics of the GABA-evoked currents for concentrations of GABA between 300 μm and 10 mm. We saw a significant decrease of the mean τ with 100 μm GABA, compared with 1 mm, which elicits only 11 ± 9% of the maximal response, as observed previously (Jones and Westbrook, 1995; Galarreta and Hestrin, 1997).
Effect of zolpidem on outside-out patches of layer V pyramidal cells
We tested the effect of 1 μm zolpidem on currents elicited by various concentrations of GABA for 1 msec on outside-out patches. When the concentration of GABA was not saturating (100 or 300 μm), the amplitude of the current was significantly enhanced by zolpidem, whereas it remained constant when 10 mm GABA was applied (Fig. 7). The rise time of the currents was not affected by zolpidem at all GABA concentrations (Fig.7B). The effect of zolpidem (1 μm) on the amplitude of the current was approximately the same when 300 μm GABA was applied during 1 msec (141 ± 22% of the control response; n = 4) as its effect on mIPSC amplitude (Fig. 7C). The application of zolpidem did not change the conductance of the channels when single-channel openings were examined (n = 2) (Fig. 7D). The duration of the GABA-evoked currents was also enhanced by zolpidem (133 ± 26, 122 ± 11, and 134 ± 13% of control;p < 0.05, for 0.1, 0.3, and 10 mm GABA, respectively).
These data show that zolpidem does not enhance the maximal open probability of bound GABAA receptors in outside-out patches. Therefore, it is unlikely that an increasedPo,max could account for the increase of mIPSC amplitude observed in the presence of zolpidem. The most likely explanation is that Nb, the number of receptors that have bound the neurotransmitter, is enhanced as a result of an increase of the affinity of GABA to its receptor.
Activation of GABAA receptors at physiological temperature
We recorded mIPSCs in layer V pyramidal cells in a more physiological situation, i.e., at a temperature of 35°C. When compared with room temperature recordings, the frequency of mIPSCs is increased (12.8 ± 6.3 Hz; n = 8), and their kinetics is accelerated: the mean rise time is 0.63 ± 0.16 msec, and the mean duration is 7.4 ± 1.8 msec. The mean amplitude of mIPSCs is also increased (−49.3 ± 4.5 pA). In five cells, the elementary current, determined by peak-scaled NSFA, was −2.23 ± 0.13 pA, which gives a chord conductance of 31.9 ± 1.8 pS, significantly different from the value determined at room temperature (p < 0.05). On the other hand, the mean number of channels open at the peak of mIPSCs (Np), calculated as the ratio of the mean current to the elementary current, was not significantly different (p > 0.2) at room temperature (20.2 ± 5.0) and at 35°C (22.1 ± 2.0). This suggests that the degree of occupancy of the receptors is the same at both temperatures.
To examine this latter issue further, we determined the sensitivity of GABAA receptors to fast applications of GABA on outside-out patches. At 35°C, the current evoked by 10 mm GABA during 1 msec had a rise time of 0.43 ± 0.22 msec (n = 7) and a duration of 16.8 ± 8.0 msec, which was significantly shorter than at room temperature (p < 0.001). In two patches, we estimated Po,max (see Materials and Methods). Taking i = −2.2 pA, measured on single-channel openings in three patches (data not shown), which is also the value determined by peak-scaled NSFA applied to mIPSCs at 35°C, a value of Po,max equal to 0.8 was found for both patches. Consequently, we can estimate the number of bound receptors during an mIPSC (Silver et al., 1996),Nb = Np/Po,max, 31 ± 8 at room temperature and 28 ± 3 at 35°C, which are not significantly different (p > 0.2). Assuming that the number of functional postsynaptic receptors is the same at the two temperatures, then the degree of occupancy of GABAAreceptors during synaptic transmission is similar. Moreover, the amplitude of the current evoked by 300 μm GABA, which is the measured EC50 for such applications at room temperature, was 30.1 ± 6.9% (n = 7) of the response to 10 mm GABA (Fig.8A). At this concentration, the rise time was 0.66 ± 0.18 msec and the duration was 19.3 ± 6.8 msec (n = 12). If we assume that the Hill coefficient is the same at room temperature and at 35°C (1.74), we estimate a value of 490 μm for the EC50 at 35°C, which is higher than the EC50at 25°C (310 μm).
Effect of zolpidem on GABAA receptors at 35°C
The effect of bath-applied zolpidem (1 μm) was examined on mIPSCs recorded in layer V pyramidal cells at 35°C (Fig.9A). As seen at room temperature, zolpidem did not change the frequency of mIPSCs (103 ± 18% of control frequency; n = 6) and enhanced the duration of events (160 ± 30% of control; p < 0.005). The two duration distributions were significantly different in the six cells tested (KS test; p < 0.001). The potentiation of the duration was also uniform, as at room temperature: when the duration distributions in control were scaled to the distributions in zolpidem, the resulting distributions were not significantly different (KS test; p > 0.05) from the one in zolpidem. However, the amplitude of mIPSCs was much less enhanced by zolpidem than at room temperature [108 ± 4% of the control amplitude; when cells are taken individually, a significant difference between the two distributions (KS test; p < 0.05) was detected in only one of six cells].
We then examined whether zolpidem could enhance the amplitude of currents evoked by subsaturating GABA applications. As shown on Figure9C, the amplitude of the current evoked by 300 μm GABA applications on outside-out patches at 35°C was not enhanced by zolpidem (104 ± 8% of the control amplitude;n = 5), whereas its duration was increased (135 ± 22% of control). Therefore, zolpidem does not seem to be able to reveal the degree of occupancy of GABAA receptors at high temperature.
DISCUSSION
We have shown that at GABAergic synapses, the BZD agonist zolpidem enhances, in a concentration-dependent manner, both the duration and amplitude of mIPSCs recorded at room temperature. The increase in amplitude is attributable to neither an increase in the conductance of the channels, as demonstrated by peak-scaled NSFA, nor the enhancement of the maximal open probability of GABAA channels, as shown by the effect of zolpidem on currents evoked by fast applications of saturating doses of GABA to outside-out patches. We therefore propose that zolpidem, by enhancing the affinity of the receptors for GABA, increases the number of receptors bound during transmitter release, indicating that GABAA receptors are not saturated after release of a single quantum.
Effects of zolpidem on GABAA receptors
Several observations argue for an increase of affinity, and more specifically, of the binding rate of GABA to its receptor in the presence of BZD agonists (MacDonald and Olsen, 1994). These compounds decrease the EC50 for GABA, without changing the maximal current evoked by GABA (Sigel and Baur, 1988), and increase the opening frequency of GABAA channels, without changing their mean open time and burst duration (Study and Barker, 1981; Rogers et al., 1994). Moreover, in agreement with Lavoie and Twyman (1996) and Mellor and Randall (1997), we have shown that at room temperature the amplitude of GABA-elicited currents can be enhanced by BZD agonists only when a subsaturating GABA concentration is applied. Moreover, in agreement with these studies, we have shown that the rise rate of GABA-evoked current is not enhanced by BZD agonists when a saturating GABA concentration is tested, consistent with an effect on the binding rate (Lavoie and Twyman, 1996). However, at 35°C, the amplitude of currents evoked by a subsaturating GABA application was not enhanced by zolpidem (Fig. 9C), providing evidence that the binding rate of GABA is little affected at this temperature. A possible explanation of these results is that the activation energy necessary for GABA binding and channel opening, which determines its activation kinetics (Jones et al., 1998), is lowered by zolpidem at 25°C and is unchanged at 35°C.
BZD agonists also increase the duration of mIPSCs in several neuron types (this study; De Koninck and Mody, 1994; Puia et al., 1994; Poncer et al., 1996; Mellor and Randall, 1997; Nusser et al., 1997), and that of GABA-elicited currents on outside-out patches [this study; Mellor and Randall (1997); but see Lavoie and Twyman (1996)]. Moreover, it has been shown that the duration of the current elicited by a brief agonist pulse is inversely correlated to the agonist unbinding rate (Jones and Westbrook, 1995; Jones et al., 1998). Therefore, the affinity increase of the GABAA receptor for its endogenous ligand by zolpidem can be attributed to a concomitant increase of the binding rate and decrease of the unbinding rate.
BZDs have been reported to enhance the conductance of GABAAchannels in dentate gyrus granule cells (Eghbali et al., 1997). However, this effect was seen only when a low concentration (<5 μm) of GABA was applied, and small conductance openings were observed. During synaptic transmission, however, a high concentration (>100 μm) of neurotransmitter is thought to be experienced by the receptors (Clements et al., 1992), so that this effect would not take place for the mIPSCs. We showed, with peak-scaled NSFA, that the conductance of channels underlying the mIPSCs was not changed by zolpidem. Consistent with this observation, the conductance of channels activated by fast GABA application on outside-out patches was also unchanged by zolpidem.
The effect of zolpidem on mIPSC amplitude decreased at the highest concentration tested (100 μm) (Fig. 4). A bell-shaped dose–response curve of BZD agonists has been reported in several studies using whole-cell applications of agonist (Sigel and Baur, 1988) and in single-channel studies (Rogers et al., 1994; Eghbali et al., 1997). The mechanism of such a behavior is unknown but could involve receptor desensitization (Mellor and Randall, 1997).
Use of fast applications to outside-out patches as a model synapse
The method of fast applications to outside-out patches offers the best technical approach currently available to mimic the synaptic release of transmitter. The GABA-elicited currents had fast rise times, like those of mIPSCs, and the single-channel conductance, determined directly or by NSFA, is close to that found for mIPSCs. However, receptors in patches may not behave exactly as in the synapse. The deactivation kinetics of currents evoked by GABA applications on outside-out patches is much slower than that of mIPSCs (this study; Tia et al., 1996; Galarreta and Hestrin, 1997; Jones and Westbrook, 1997) and is voltage independent, unlike that of mIPSCs in the same cells (Salin and Prince, 1996). Several explanations can be proposed: mechanical disturbance of channels during patch excision or loss of intracellular factors and a different state of phosphorylation (Jones and Westbrook, 1997) may change the behavior of channels; receptors in patches may differ from synaptic receptors (Tia et al., 1996); the concentration in the synaptic cleft may be much lower than usually thought (Galarreta and Hestrin, 1997); and the duration of GABA application, which determines partly the deactivation kinetics of GABAA receptors (Jones and Westbrook, 1995; Mellor and Randall, 1997), may be longer than the actual timecourse of the transmitter in the synaptic cleft. In any case, the discrepancy lies only in the late part of the response; thus the binding and opening rates are probably the same for synaptic channels and for channels in patches.
Implications for GABAergic synaptic transmission
After observing that zolpidem increased the duration but not the amplitude of mIPSCs in dentate gyrus granule cells at 35°C, De Koninck and Mody (1994) concluded that postsynaptic receptors were saturated by GABA during synaptic transmission. However, Frerking et al. (1995) have shown in culture at 25°C that diazepam, another BZD agonist, potentiates mIPSC amplitudes, and they proposed that the mIPSC amplitude is correlated with the peak concentration of transmitter released in the synaptic cleft and hence that GABAAreceptors are not saturated during synaptic transmission. It has been shown in various structures that the mIPSC amplitude could be enhanced at room temperature by BZD agonists (DeFazio and Hablitz, 1997; Mellor and Randall, 1997; Nusser et al., 1997). In another study (Poncer et al., 1996), no increase in mIPSC amplitude was seen, suggesting GABAA receptor saturation in CA3 pyramidal cells. In cerebellar stellate cells, two populations of GABAergic synapses seem to have different degrees of receptor occupancy. The smallest mIPSCs have their amplitude unaffected by the BZD agonist flurazepam, whereas the amplitude of the largest mIPSCs is enhanced (Nusser et al., 1997). With a different approach, Auger and Marty (1997) reached a similar conclusion, showing on the same cells a negative correlation between the peak open probability of channels at single synapses and the number of channels, which can be interpreted as a lower degree of occupancy in larger synapses. In layer V pyramidal cells, we found that the potentiation of mIPSC amplitude is uniform (Fig. 2), suggesting that the degree of receptor occupancy is not maximal and is similar for all of the synapses with miniature activity. An estimate of the concentration reached by GABA in the synaptic cleft can be made by matching the enhancement of the mIPSC amplitude with that of the GABA-elicited currents using 1 μm of zolpidem (Fig.7C): it gives a concentration of 300 μm, which is the EC50 found for the GABA dose–response curve (Fig.6) (Galarreta and Hestrin, 1997). However, it should be noted that the duration of the application to patches (1 msec) is much longer than estimates of the dwell times of neurotransmitter in the cleft (Clements et al., 1992; Holmes 1995; Clements, 1996); thus the peak concentration could be higher to achieve the same degree of occupancy.
For non-NMDA glutamate receptors, receptor occupancy during uniquantal synaptic transmission is thought to remain the same (Silver et al., 1996) or diminish as temperature is increased (Tong and Jahr, 1994). Thus we might expect GABAA receptors not to be saturated at physiological temperature. Consistent with this prediction, we found that the EC50 for 1 msec applications is higher at 35°C than at room temperature, and that the mean number of channels open at the peak of an mIPSC is not significantly changed between the two temperatures (also see De Koninck and Mody, 1994). However, we did not see any significant change in the mIPSC amplitude when zolpidem was applied at 35°C, as seen in other cell types (De Koninck and Mody, 1994; Soltesz and Mody, 1994; Poisbeau et al., 1997). We have also shown that zolpidem did not enhance the amplitude of currents evoked by subsaturating GABA concentration on outside-out patches. Therefore, no conclusion can be drawn from the effect of zolpidem on mIPSCs regarding receptor occupancy at pysiological temperature.
Our study shows that the postsynaptic GABAA receptors expressed by layer V pyramidal cells in visual cortex are not saturated by the release of GABA from a single vesicle, but this may not be the case in all GABAergic synapses (Auger and Marty, 1997; Nusser et al., 1997). Moreover, the release of multiple vesicles at a single active zone could increase receptor occupancy and eventually saturate postsynaptic receptors (Silver et al., 1996). In this latter case the variability of the postsynaptic current is very low. Modulation of the release probability of neurotransmitter could thus regulate both the strength and the variability of synaptic transmission.
Footnotes
We thank Drs. F. Sladeczek and F. Le Bouffant for their support with some of the equipment, and G. Sadoc for help with the acquisition and analysis software. We also thank Drs. B. Barbour and M. Häusser, and N. Gazères for useful discussions.
Correspondence should be addressed to Dr. Nicole Ropert, Institut Alfred Fessard, Centre National de la Recherche Scientifique UPR 2212, 1 Avenue de la Terrasse, 91198 Gif sur Yvette, France.
REFERENCES
- 1.Auger C, Marty A. Heterogeneity of functional synaptic parameters among single release sites. Neuron. 1997;19:139–150. doi: 10.1016/s0896-6273(00)80354-2. [DOI] [PubMed] [Google Scholar]
- 2.Clements JD. Transmitter timecourse in the synaptic cleft: its role in central synaptic function. Trends Neurosci. 1996;19:163–171. doi: 10.1016/s0166-2236(96)10024-2. [DOI] [PubMed] [Google Scholar]
- 3.Clements JD, Lester RAJ, Tong G, Jahr CE, Westbrook GL. The time course of glutamate in the synaptic cleft. Science. 1992;258:1498–1501. doi: 10.1126/science.1359647. [DOI] [PubMed] [Google Scholar]
- 4.Colquhoun D, Jonas P, Sakmann B. Action of brief pulses of glutamate on AMPA/kainate receptors in patches from different neurones of rat hippocampal slices. J Physiol (Lond) 1992;458:261–287. doi: 10.1113/jphysiol.1992.sp019417. [DOI] [PMC free article] [PubMed] [Google Scholar]
- 5.DeFazio T, Hablitz JJ. Zinc and zolpidem modulate miniature IPSCs in rat neocortex. Soc Neurosci Abstr. 1997;49:13. [Google Scholar]
- 6.De Koninck Y, Mody I. Noise analysis of miniature IPSCs in adult rat brain slices: properties and modulation of synaptic GABAA receptor channels. J Neurophysiol. 1994;71:1318–1335. doi: 10.1152/jn.1994.71.4.1318. [DOI] [PubMed] [Google Scholar]
- 7.Edmonds B, Gibb AJ, Colquhoun D. Mechanisms of activation of muscle nicotinic receptors and the time course of endplate currents. Annu Rev Physiol. 1995;57:469–493. doi: 10.1146/annurev.ph.57.030195.002345. [DOI] [PubMed] [Google Scholar]
- 8.Edwards FA, Konnerth A, Sakmann B. Quantal analysis of inhibitory synaptic transmission in the dentate gyrus of rat hippocampal slices: a patch-clamp study. J Physiol (Lond) 1990;430:213–249. doi: 10.1113/jphysiol.1990.sp018289. [DOI] [PMC free article] [PubMed] [Google Scholar]
- 9.Eghbali M, Curmi JP, Birnir B, Gage PW. Hippocampal GABAA channel conductance increased by diazepam. Nature. 1997;388:71–75. doi: 10.1038/40404. [DOI] [PubMed] [Google Scholar]
- 10.Frerking M, Wilson M. Saturation of postsynaptic receptors at central synapses? Curr Opin Neurobiol. 1996;6:395–403. doi: 10.1016/s0959-4388(96)80125-5. [DOI] [PubMed] [Google Scholar]
- 11.Frerking M, Borges S, Wilson M. Variation in GABA mini amplitude is the consequence of variation in transmitter concentration. Neuron. 1995;15:885–895. doi: 10.1016/0896-6273(95)90179-5. [DOI] [PubMed] [Google Scholar]
- 12.Galarreta M, Hestrin S. Properties of GABAA receptors underlying inhibitory synaptic currents in neocortical pyramidal neurons. J Neurosci. 1997;17:7220–7227. doi: 10.1523/JNEUROSCI.17-19-07220.1997. [DOI] [PMC free article] [PubMed] [Google Scholar]
- 13.Grantyn R, Veselovsky NS. Quantal analysis of “evoked” and “spontaneous” GABA release from individual synaptic boutons. Soc Neurosci Abstr. 1997;232:11. [Google Scholar]
- 14.Holmes WR. Modeling the effect of glutamate diffusion and uptake on NMDA and non-NMDA receptor saturation. Biophys J. 1995;69:1734–1747. doi: 10.1016/S0006-3495(95)80043-3. [DOI] [PMC free article] [PubMed] [Google Scholar]
- 15.Jonas P, Major G, Sakmann B. Quantal components of unitary EPSCs at the mossy fiber synapse on CA3 pyramidal cells of rat hippocampus. J Physiol (Lond) 1993;472:615–663. doi: 10.1113/jphysiol.1993.sp019965. [DOI] [PMC free article] [PubMed] [Google Scholar]
- 16.Jones MV, Westbrook GL. Desensitized states prolong GABAA channel responses to brief agonist pulses. Neuron. 1995;15:181–191. doi: 10.1016/0896-6273(95)90075-6. [DOI] [PubMed] [Google Scholar]
- 17.Jones MV, Westbrook GL. Shaping of IPSCs by endogenous calcineurin activity. J Neurosci. 1997;17:7626–7633. doi: 10.1523/JNEUROSCI.17-20-07626.1997. [DOI] [PMC free article] [PubMed] [Google Scholar]
- 18.Jones MV, Sahara Y, Dzubay JA, Westbrook GL. Defining affinity with the GABAA receptor. J Neurosci. 1998;18:8590–8604. doi: 10.1523/JNEUROSCI.18-21-08590.1998. [DOI] [PMC free article] [PubMed] [Google Scholar]
- 19.Lavoie AM, Twyman RE. Direct evidence for diazepam modulation of GABAA receptor microscopic affinity. Neuropharmacology. 1996;35:1383–1392. doi: 10.1016/s0028-3908(96)00077-9. [DOI] [PubMed] [Google Scholar]
- 20.Liu G, Tsien RW. Properties of synaptic transmission at single hippocampal synaptic boutons. Nature. 1995;375:404–408. doi: 10.1038/375404a0. [DOI] [PubMed] [Google Scholar]
- 21.Llano I, Marty A, Armstrong CM, Konnerth A. Synaptic- and agonist-induced excitatory currents of Purkinje cells in rat cerebellar slices. J Physiol (Lond) 1991;434:183–213. doi: 10.1113/jphysiol.1991.sp018465. [DOI] [PMC free article] [PubMed] [Google Scholar]
- 22.Lüddens H, Korpi ER, Seeburg PH. GABAA/benzodiazepine receptor heterogeneity: neurophysiological implications. Neuropharmacology. 1995;34:245–254. doi: 10.1016/0028-3908(94)00158-o. [DOI] [PubMed] [Google Scholar]
- 23.MacDonald RL, Olsen RW. GABAA receptor channels. Annu Rev Neurosci. 1994;17:569–602. doi: 10.1146/annurev.ne.17.030194.003033. [DOI] [PubMed] [Google Scholar]
- 24.Mellor JR, Randall AD. Frequency-dependent actions of benzodiazepines on GABAA receptors in cultured murine cerebellar granule cells. J Physiol (Lond) 1997;503:353–369. doi: 10.1111/j.1469-7793.1997.353bh.x. [DOI] [PMC free article] [PubMed] [Google Scholar]
- 25.Nusser Z, Cull-Candy SG, Farrant M. Differences in synaptic GABAA receptor number underlie variation in GABA mini amplitude. Neuron. 1997;19:697–709. doi: 10.1016/s0896-6273(00)80382-7. [DOI] [PubMed] [Google Scholar]
- 26.Perrais D, Ropert N. Effect of zolpidem on mIPSCs and occupancy of GABAA receptors in central synapses. Soc Neurosci Abstr. 1997;377:9. doi: 10.1523/JNEUROSCI.19-02-00578.1999. [DOI] [PMC free article] [PubMed] [Google Scholar]
- 27.Poisbeau P, Williams SR, Mody I. Silent GABAA synapses during flurazepam withdrawal are region-specific in the hippocampal formation. J Neurosci. 1997;17:3467–3475. doi: 10.1523/JNEUROSCI.17-10-03467.1997. [DOI] [PMC free article] [PubMed] [Google Scholar]
- 28.Poncer J-C, Dürr R, Gähwiler BH, Thompson SM. Modulation of synaptic GABAA receptor function by benzodiazepines in area CA3 of rat hippocampal slice cultures. Neuropharmacology. 1996;35:1169–1179. doi: 10.1016/s0028-3908(96)00055-x. [DOI] [PubMed] [Google Scholar]
- 29.Puia G, Costa E, Vicini S. Functional diversity of GABA-activated Cl− currents in Purkinje versus granule neurons in rat cerebellar slices. Neuron. 1994;12:117–126. doi: 10.1016/0896-6273(94)90157-0. [DOI] [PubMed] [Google Scholar]
- 30.Rogers CJ, Twyman RE, MacDonald RL. Benzodiazepine and β-carboline regulation of single GABAA receptor channels of mouse spinal neurones in culture. J Physiol (Lond) 1994;475:69–82. doi: 10.1113/jphysiol.1994.sp020050. [DOI] [PMC free article] [PubMed] [Google Scholar]
- 31.Ropert N, Miles R, Korn H. Characteristics of miniature inhibitory postsynaptic currents in CA1 pyramidal neurones of rat hippocampus. J Physiol (Lond) 1990;428:707–722. doi: 10.1113/jphysiol.1990.sp018236. [DOI] [PMC free article] [PubMed] [Google Scholar]
- 32.Salin PA, Prince DA. Spontaneous GABAA receptor-mediated inhibitory currents in adult rat somatosensory cortex. J Neurophysiol. 1996;75:1573–1588. doi: 10.1152/jn.1996.75.4.1573. [DOI] [PubMed] [Google Scholar]
- 33.Sigel E, Baur R. Allosteric modulation by benzodiazepines receptor ligands of the GABAA receptor channel expressed in Xenopus oocytes. J Neurosci. 1988;8:289–295. doi: 10.1523/JNEUROSCI.08-01-00289.1988. [DOI] [PMC free article] [PubMed] [Google Scholar]
- 34.Silver RA, Cull-Candy SG, Takahashi T. Non-NMDA glutamate receptor occupancy and open probability at a rat cerebellar synapse with single and multiple release sites. J Physiol (Lond) 1996;494:231–250. doi: 10.1113/jphysiol.1996.sp021487. [DOI] [PMC free article] [PubMed] [Google Scholar]
- 35.Soltesz I, Mody I. Patch-clamp recordings reveal powerful GABAergic inhibition in dentate hilar neurons. J Neurosci. 1994;14:2365–2376. doi: 10.1523/JNEUROSCI.14-04-02365.1994. [DOI] [PMC free article] [PubMed] [Google Scholar]
- 36.Soltesz I, Smetters DK, Mody I. Tonic inhibition originates from synapses close to the soma. Neuron. 1995;14:1273–1283. doi: 10.1016/0896-6273(95)90274-0. [DOI] [PubMed] [Google Scholar]
- 37.Stevens CF, Wang Y. Facilitation and depression at single central synapses. Neuron. 1995;14:795–802. doi: 10.1016/0896-6273(95)90223-6. [DOI] [PubMed] [Google Scholar]
- 38.Stuart GJ, Dodt HU, Sakmann B. Patch-clamp recordings from the soma and dendrites of neurons in brain slices using infrared video microscopy. Pflügers Arch. 1993;423:511–518. doi: 10.1007/BF00374949. [DOI] [PubMed] [Google Scholar]
- 39.Study RE, Barker JL. Diazepam and (−)-pentobarbital: fluctuation analysis reveals different mechanisms for potentiation of γ-aminobutyric acid responses in cultured central neurons. Proc Natl Acad Sci USA. 1981;78:7180–7184. doi: 10.1073/pnas.78.11.7180. [DOI] [PMC free article] [PubMed] [Google Scholar]
- 40.Tia S, Wang JF, Kotchabhakdi N, Vicini S. Developmental changes of inhibitory synaptic currents in cerebellar granule neurons: role of GABAA receptor α6 subunit. J Neurosci. 1996;16:3630–3640. doi: 10.1523/JNEUROSCI.16-11-03630.1996. [DOI] [PMC free article] [PubMed] [Google Scholar]
- 41.Tong G, Jahr CE. Block of glutamate transporters potentiates postsynaptic excitation. Neuron. 1994;13:1195–1203. doi: 10.1016/0896-6273(94)90057-4. [DOI] [PubMed] [Google Scholar]
- 42.Traynelis SF, Silver RA, Cull-Candy SG. Estimated conductance of glutamate receptor channels activated during EPSCs at the cerebellar mossy fibre-granule cell synapse. Neuron. 1993;11:279–289. doi: 10.1016/0896-6273(93)90184-s. [DOI] [PubMed] [Google Scholar]