

Abstract
Effects of oxygen/glucose deprivation (OGD) on subcellular elemental composition and water content were determined in nerve cell bodies from CA1 areas of rat hippocampal slices. Electron probe x-ray microanalysis was used to measure percentage water and concentrations of Na, P, K, Cl, Mg, and Ca in cytoplasm, nucleus, and mitochondria of cells exposed to normal and oxygen/glucose deficient medium. As an early (2 min) consequence of OGD, evoked synaptic potentials were lost, and K, Cl, P, and Mg concentrations decreased significantly in all morphological compartments. As exposure to in vitro OGD continued, a negative DC shift in interstitial voltage occurred (∼5 min), whereas general elemental disruption worsened in cytoplasm and nucleus (5–42 min). Similar elemental changes were noted in mitochondria, except that Ca levels increased during the first 5 min of OGD and then decreased over the remaining experimental period (12–42 min). Compartmental water content decreased early (2 min), returned to control after 12 min of OGD, and then exceeded control levels at 42 min. After OGD (12 min), perfusion of hippocampal slices with control oxygenated solutions (reoxygenation) for 30 min did not restore synaptic function or improve disrupted elemental composition. Notably, reoxygenated CA1 cell compartments exhibited significantly elevated Ca levels relative to those associated with 42 min of OGD. When slices were incubated at 31°C (hypothermia) during OGD/reoxygenation, neuronal dysfunction and elemental deregulation were minimal. Results show that in vitro OGD causes loss of transmembrane Na, K, and Ca gradients in CA1 neurons of hippocampal slices and that hypothermia can obtund this damaging process and preserve neuronal function.
Keywords: oxygen/glucose deprivation, ischemia, reperfusion injury, CA1 cells, hypothermia, neuroprotection, electron probe x-ray microanalysis
Ischemic or hypoxic events rapidly compromise nerve cell function in brain tissues (Hansen, 1985;Erecinska and Silver, 1994; Hossmann, 1996; Silver et al., 1997). Within minutes of oxygen and/or glucose deprivation, cellular ATP levels decrease, excitatory amino acids are released, and cellular ion gradients collapse with resulting membrane depolarization (Siesjo, 1992; Martin et al., 1994). Because neuronal function is critically dependent on maintenance of Na+, K+, Cl−, and Ca2+ transmembrane distributions, loss of ion gradients is considered to be a cardinal event in the pathophysiology of brain ischemia (Hansen, 1985; Martin et al., 1994). Results from whole-animal models have suggested that ischemic/hypoxic perturbation of cellular ion regulation can be divided into two phases. Phase 1 is associated with a gradual rise in extracellular K+(K+o) concentrations, with little change in other ions (Hansen, 1985; Moghaddam et al., 1986; Zetterstrom et al., 1995). As ischemia or hypoxia continues, phase 2 changes develop and consist of an additional large increase in K+o, a corresponding negative shift in interstitial voltage, and substantial decreases in extracellular Na+, Cl−, and Ca2+ concentrations (Hansen and Zeuthen, 1981;Harris et al., 1981; Silver and Erecinska, 1990; Somjen et al., 1990). CNS ischemic or hypoxic events in vivo are often transient and are succeeded by regional reperfusion. Despite restoration of normal extraneuronal oxygen tension and glucose content, the reperfusion period can be paradoxically associated with additional nerve cell injury (Siesjo, 1992). This secondary injury involves multiple factors (e.g., free radical generation, mitochondrial dysfunction) that promote additional neuronal Na+and Ca2+ entry (Young, 1986; Siesjo, 1992; Choi, 1995; Kristian and Siesjo, 1996). Thus, disruption of intraneuronal ion balance and Ca2+ overload appear to be critically involved in neuronal cell injury associated with ischemia and reperfusion.
Despite the potential importance of disturbed nerve cell ion homeostasis during transient oxygen/glucose deprivation (OGD), very little direct, detailed information exists regarding corresponding altered intraneuronal disposition of Na+, K+, Ca2+, and other ions in brain tissue. In particular, the magnitude and extent of ion translocation among ischemic subcellular organelles and compartments are not known, nor is it understood how these ionic changes relate to ensuing structural and functional alterations. To understand this information gap, we used electron probe x-ray microanalysis (EPMA) to determine the effects of OGD and reoxygenation on intracellular distribution of Na, K, Ca, and other biological elements in CA1 nerve cells from rat hippocampal slices. Both morphology and synaptic function were assessed in these tissue slices, and results were correlated with respective EPMA data. EPMA is a quantitative electron microscopy technique that simultaneously measures water content and total (free plus bound) concentrations of elements in selected morphological compartments of rapidly frozen tissue [for detailed technical discussion see LoPachin (1995)]. This technique permits optical identification of individual neurons and analyses of respective subcellular compartments such as mitochondria and nuclei. Microprobe analysis has been used to quantify nervous tissue elemental disturbances in various neuropathological conditions (LoPachin and Lehning, 1997).
MATERIALS AND METHODS
In the present study, rat hippocampal tissue slices were used, because unlike other in vitro model systems (e.g., cultured embryonic nerve cells), a relatively normal anatomical microenvironment is maintained. Neurons in CA1 regions of these slices were analyzed because these cells are highly sensitive to OGD, and their neuropathological and electrophysiological responses have been well described (Balestrino et al., 1989; Taylor and Weber, 1993; Taylor et al., 1995). Elemental changes induced by OGD or experimental ischemia were measured, therefore, in vulnerable adult CNS neurons under conditions similar to those in vivo. In addition, parallel determinations of synaptic function and histopathology were conducted in the same tissue. Consequently, we were able to correlate onset of elemental disruption with changes in structural and functional parameters. All aspects of this study were in accordance with theNIH Guide for Care and Use of Laboratory Animals and were approved by local animal care committees.
Preparation of hippocampal slices. Methods for hippocampal slice preparation were similar to those discussed in detail elsewhere (Taylor and Weber, 1993; Weber and Taylor, 1994); a brief description is provided here. Male Wistar rats (200–275 gm) were anesthetized with pentobarbital (50 mg/kg, i.p.) and decapitated. Brains were rapidly excised and placed in cold (4°C) oxygenated artificial CSF (aCSF) containing (in mm): NaCl 125, KCl 3.5, MgSO4 1.0, CaCl2 2.0, NaHCO3 26, NaH2PO4 1.25, and d-glucose 10. Cooled brains were hemisected at the midline and trimmed, leaving a rectangular block of tissue that included the dorsal hippocampus. The tissue block was glued to the stage of a vibrating slicer (Campden Instruments Vibroslice 752M) and sectioned coronally (450 μm) at low temperatures (0°C). A small number of randomly selected fresh slices were quench-frozen or conventionally fixed immediately after Vibroslice cutting (see below). The majority of slices were placed in an interface recording chamber (Scientific Systems Design) at room temperature and preincubated for 1–2 hr by superfusion with aCSF that was gradually warmed to 36°C. Slices were superfused continuously (1 ml/min) with either normal aCSF (control) or OGD medium. Extracellular glass micropipettes containing 2 m NaCl (4–10 MΩ resistance) were placed into the stratum radiatum of the CA1 region and used to record EPSPs in response to stimuli (40–150 μA, 0.4 msec pulses) from paired wire electrodes placed ∼1 mm from the recording site. Voltage recordings were made with an electrometer (Axon Instruments Axoprobe 200), and evoked potentials were stored digitally once every 60 sec. A continuous strip-chart record was used to observe DC negative shifts (5–25 mV), which are similar in waveform to spreading depression that follows brain oxygen and glucose deprivation.
Light microscopy. For morphological observations in conventionally fixed hippocampal tissues, representative slices were selected immediately after Vibroslice cutting or were removed from the incubation medium at selected experimental times and fixed overnight by immersion in Bouin’s solution (27°C). After fixation, slices were alcohol-dehydrated, infiltrated with paraffin, and sectioned (3 μm). Sections were mounted on glass slides, stained with hematoxylin/eosin, and examined on an upright compound microscope and photographed.
In vitro OGD. OGD was produced by superfusing slices with d-glucose-deficient aCSF equilibrated with a 95% N2/5% CO2 gas mixture (Weber and Taylor, 1994). Oxygen tension of the oxygen/glucose-deficient aCSF was 5% or lower, as determined with polarized glass-insulated carbon-fiber electrodes. Oxygen tension measured ∼100 μm below the tissue surface fell to near zero within 30 sec of initiating oxygen/glucose deprivation. Slices (n = 5–8 per experimental group) were removed from the perfusion chamber after 0, 2, 5, 12, and 42 min of OGD exposure. To assess post-OGD recovery of neuronal water content and elemental composition, slices (n = 6) were exposed to 12 min of experimental ischemia and then returned to oxygenated, glucose-containing medium for 30 min (reoxygenation). As a control for the OGD and reoxygenation periods, slices (n = 3 per time point) were incubated with normal aCSF for 12 and 42 min beyond the initial equilibration time (t = 0; see above). Results demonstrated that respective elemental data fort = 0, 12, and 42 min non-OGD control incubations were not statistically different and therefore were pooled. As an additional study to determine the effects of excision and subsequent preincubation procedures on recovery of intraneuronal elemental composition, a separate group of slices (n = 6) were quench-frozen or conventionally fixed immediately after Vibroslice cutting; i.e., slices received no in vitro incubation. The neuroprotective capacity of mild hypothermia was also determined in the in vitro OGD/reoxygenation model. Slices (n = 7) were superfused with cooled (31°C) oxygen/glucose-deficient aCSF for 12 min and then exposed to cooled (31°C) normal oxygenated solutions for 30 min. As a control, slices (n = 4) were incubated in oxygenated, glucose-containing aCSF for 42 min at 31°C. This control hypothermic period did not modify neuronal elemental composition relative to control incubations at 36°C (i.e., pooled 0, 12, and 42 min control data; see above). At the end of each experimental or control period, tissue samples were rapidly removed from the incubation chamber and were immediately quench-frozen by immersion in melting isopentane. Frozen slices were then stored in liquid nitrogen for later analysis.
Cryoultramicrotomy and EPMA. The methodologies for cryomicrotomy and EPMA have been published extensively (Saubermann et al., 1981a,b; Foster and Saubermann, 1991; LoPachin et al., 1991;LoPachin, 1995). Briefly, frozen hippocampal slices were sectioned (500 nm nominal thickness) on a cryomicrotome at an ambient cryochamber temperature of −55°C. Unstained, unfixed, hydrated cryosections were then transferred under vacuum to the cold stage (−185°C) of an AMRay 1000 scanning electron microscope. The electron microscope was equipped with a Tracor Northern energy dispersive detector and pulse processor that was connected to a PC-based multichannel analyzer for collection and processing of x-rays (Foster and Saubermann, 1991). For quantitative analyses of elements in hippocampal cryosections, wet-weight specimen mass was measured in frozen hydrated sections by determining continuum generation rates (Saubermann et al., 1981a,b;Saubermann and Heyman, 1987). Cryosections were then dehydrated in the electron microscope column vacuum by raising the temperature of the cold stage from −185 to −60°C for 30 min. Stage temperature was returned to −185°C for microanalysis. The electron beam (20 kV, 0.4 nA current) was rastered within anatomical boundaries of the chosen structures. X-ray spectra were collected over 100 sec of live counting time. Dry weight elemental mass fractions (millimoles/kilogram of dry weight) for Na, K, P, Cl, Mg, and Ca were determined using software applying the Hall et al. (1973) method of continuum normalization (Foster and Saubermann, 1991; Saubermann et al., 1992). Water content (percentage water) of morphological compartments was determined by the ratio of respective continuum counts in hydrated versus dried states (Bulger et al., 1981; Saubermann et al., 1981b). EPMA does not distinguish ionic versus bound element but rather measures total elemental concentrations. Therefore, symbols for each element are expressed without oxidation state (e.g., K) when corresponding concentrations have been derived by EPMA. Oxidation states are indicated (e.g., K+) for discussions of previous research involving ion-sensitive measurements or for physiological processes (e.g., membrane transport) in which involvement of the ionized species is implicit.
Compartment identification. Morphological compartments (cytoplasm, nuclei, and mitochondria) were visualized in dehydrated cryosections using scanning-transmission electron microscopy. Spatial resolution in unfixed, unstained hippocampal cryosections is not sufficient to distinguish individual submitochondrial cytoplasmic constituents. Thus, “cytoplasm” is a primarily a composite measurement of Nissl substance, Golgi apparatus, and microtubule/neurofilament regions (Peters et al., 1991). The nuclear compartment represents EPMA of nucleoplasm and excludes analysis of the nucleolus. CA1 cell mitochondria in frozen hippocampal sections appeared as dense (cristea are not visible), multivariate forms (spherical to slender rodlets) with dimensions of ∼0.1 μm diameter and 0.1–0.5 μm length. In the absence of positive identification, it is possible that corresponding EPMA data are contaminated by analyses of similarly sized cytoplasmic objects such as lysosomes or lipofuscin granules. However, several observations suggest that the mitochondrial compartment is appropriately identified. Mitochondria and other subcellular organelles or areas can be differentiated by elemental composition and water content. For example, relative to other compartments, lysosomes exhibit very high sulfur concentrations because of the prevalence of S-containing enzymes (LeFurgey et al., 1991; R. L. Pachin and E. Lehning, unpublished data). When compared with respective cytoplasm (see Table 2), mitochondria from CA1 cells maintained in control conditions exhibited higher Na, P, and Cl concentrations (p < 0.05) and a lower water content (p < 0.05). Furthermore, mitochondria can be distinguished by function. Thus, observed Ca sequestration and accumulation by our mitochondrial compartment during OGD/reoxygenation (see Results) are predictable behaviors based on presumed pathophysiological roles. Therefore, the present mitochondria data likely reflect compartment-specific analyses [see also LoPachin et al. (1988) and LoPachin and Stys (1995)].
Table 2.
Elemental composition and water content of CA1 nerve cells from control incubated and nonincubated hippocampal slices
| Na | P | Cl | K | Ca | Mg | Water | |
|---|---|---|---|---|---|---|---|
| Cytoplasm | |||||||
| Incubated control (93) | 252 ± 11 | 609 ± 35 | 265 ± 17 | 662 ± 32 | 5 ± 1 | 25 ± 4 | 75 ± 1 |
| Nonincubated (61) | 1290 ± 41* | 495 ± 18* | 823 ± 31* | 122 ± 4* | 31 ± 5* | 7 ± 1* | 82 ± 1* |
| Mitochondria | |||||||
| Incubated control (46) | 321 ± 18 | 776 ± 70 | 351 ± 28 | 739 ± 38 | 3 ± 1 | 29 ± 8 | 63 ± 1 |
| Nonincubated (25) | 1420 ± 68* | 525 ± 17* | 984 ± 41* | 126 ± 6* | 51 ± 12* | 1 ± 1* | 72 ± 1* |
| Nucleus | |||||||
| Incubated control (29) | 232 ± 22 | 758 ± 81 | 254 ± 31 | 807 ± 75 | 6 ± 1 | 31 ± 6 | 62 ± 1 |
| Nonincubated (26) | 1330 ± 46* | 458 ± 12* | 964 ± 32* | 117 ± 4* | 26 ± 5* | 2 ± 1* | 75 ± 1* |
Rat hippocampal slices were prepared as described in Materials and Methods and were either frozen immediately without incubation (nonincubated) or were subsequently incubated in cooled (31°C) aCSF that was subsequently warmed to 36°C. After at least 1 hr at 36°C, incubated slices were superfused with normal, oxygenated aCSF for 0, 12, or 42 min. Compartmental data from these timed control periods (i.e., 0, 12, and 42 min) did not differ statistically and therefore were combined to form a pooled incubated control. Elemental concentrations from analyses of CA1 nerve cell compartments are expressed as mean millimoles of element per kilogram of dry weight ± SEM. Compartmental water contents are expressed as mean percentage water ± SEM. *Significantly different (p < 0.05) from incubated control. Numbers in parentheses represent compartmental analyses per experimental group.
Statistics. Nested ANOVA was used to show that analyses of nerve cells from individual slices of an experimental group could be pooled to derive a group mean. Therefore, descriptive parameters such as group means and SE of the mean are not based on number of slices (e.g., n = 3–4 per time point), but rather are derived from pooled nerve cell data. Statistical differences (p < 0.05) among group means were determined using one-factor ANOVA followed by Dunnett’s test modified for unbalanced data.
RESULTS
CA1 cell neuropathology
In cryosections from control oxygenated hippocampal slices, the CA1 region was easily identified, and cellular morphology of respective pyramidal-shaped neurons was well preserved, i.e., cytoplasm, mitochondria, nuclei, and apical dendrites were readily evident. Morphological observations of cryosections from frozen slices exposed to 12 min of OGD indicated minimal neuropathic disruption. However, 42 min of OGD or 12 min OGD/30 min reoxygenation produced similar dendritic blebbing with pronounced somatic and mitochondrial swelling. Parallel examination of conventionally fixed, paraffin-imbedded sections (Fig. 1) confirmed morphological findings in cryosections. Light microscopy of slices fixed immediately after Vibroslice preparation (Fig.1A) indicated significant swelling of pyramidal neurons, i.e., cell bodies, mitochondria, dendrites, and nuclei were enlarged and hydropic. After 1.5 hr of incubation in control aCSF, pyramidal neurons had a normal appearance, with compact nuclei, normal nucleoli, narrower primary dendrites, and no evidence of dendritic blebbing (Fig. 1B). However, after 12 min of OGD and 30 min of reoxygenation at 36°C, tissue morphology was severely disrupted (Fig. 1C) and was characterized by darkly stained, swollen perikarya, mitochondria, and nuclei, grossly disrupted cell bodies, and blebbed dendrites. In contrast, slices removed after 12 min of OGD and 30 min reoxygenation at 31°C (Fig. 1D) exhibited excellent histological appearance, including compact cell bodies and nuclei, and dendrites without blebbing.
Fig. 1.
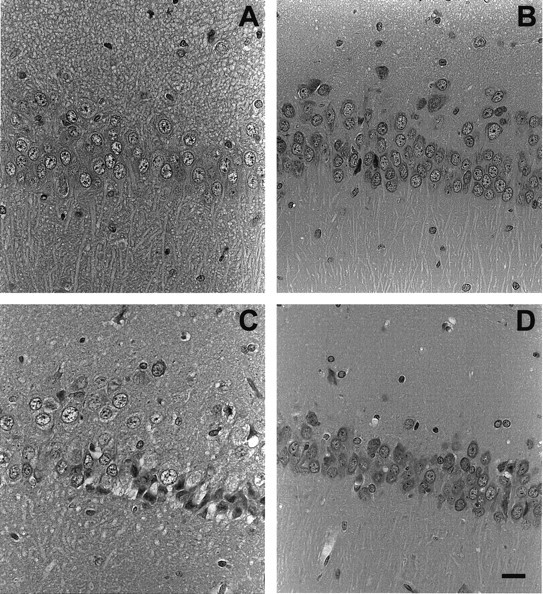
Hematoxylin and eosin-stained sections (3-μm-thick) illustrating changes in slice morphology as a function of different incubation conditions. A, Tissue fixed immediately after slicing (nonincubated). Note swollen pyramidal cell nuclei and dendritic shafts, as well as pronounced blebbing (granular appearance) in dendritic areas. B, Slice fixed after ∼1.5 hr of incubation in normal aCSF at 36°C. Neuronal perikarya, nuclei, and apical dendrites exhibit nearly normal appearance.C, Tissue fixed after incubation for 1.5 hr in normal aCSF at 36°C followed by 12 min ischemia and 30 min reperfusion. Grossly swollen CA1 neuronal cell bodies and nuclei were observed with some disintegrated somata and others that stained darkly (pyknosis). Dendritic areas are highly granular, and individual dendritic shafts cannot be distinguished. D, Tissue fixed after incubation for 1.5 hr in normal aCSF at 31°C followed by 12 min ischemia and 30 min reperfusion. Preservation of histological features is remarkable and is similar in appearance to hippocampal regions of brain fixed in situ by cardiac perfusion (data not shown). Scale bar, 25 μm (for all micrographs).
Electrophysiology
Normal synaptic evoked potentials [i.e., similar in waveform to those occurring in vivo (Andersen and Lomo, 1966)] were observed in CA1 stratum radiatum before OGD (mean amplitude was 5.2 ± 0.44 mV, n = 38) (Fig.2A). As reported previously (Weber and Taylor, 1994), extracellular EPSPs disappeared within 5 min of OGD onset (Fig. 2B). Subsequently, a negative DC voltage shift (5–25 mV) was seen in all slices that were oxygen/glucose-deprived for 12 min at 36°C (Table1). Previous studies have shown that such negative shifts correspond to cellular depolarization and large changes in extracellular ionic composition (Hansen, 1985). The mean time to negative shift in all slices exposed to either 12 or 42 min of OGD was ∼5 min at 36°C (Table 1). Evoked EPSPs were measured in groups of slices exposed to OGD/reoxygenation at either 36°C or 31°C. None of the slices kept at 36°C had EPSPs that were at least 50% of starting amplitude, which indicates a loss of normal synaptic function. In contrast, all slices subjected to OGD at 31°C had EPSPs that recovered during reoxygenation (Table 1). Furthermore, less than half of these slices displayed a DC negative shift during the 12 min OGD period; negative shifts that were observed were significantly delayed (Table 1). These results confirm previous reports (Weber and Taylor, 1994) of hypothermia (31°C) as a neuroprotectant.
Fig. 2.

Evoked EPSPs were recorded at 1 min intervals throughout a representative OGD experiment (36°C). A, EPSP waveform evoked by 0.4 msec stimulus of Shaffer collaterals before OGD (1; solid trace), loss of EPSP and presynaptic fiber volley at end of OGD (2; dotted trace), and recovery of fiber volley (but not EPSP) 20 min after OGD (3; dashed trace).B, The maximal EPSP amplitude was plotted throughout a representative experiment. In this example, EPSPs were irreversibly lost after 12 min of OGD. Numerals refer to individual traces from A. Note that with lowered temperature, most slices recovered EPSPs after OGD (Table 1).
Table 1.
Percentage of slices with DC negative shifts and recovery of EPSPs after oxygen and glucose deprivation (OGD)
| Experimental condition | Percentage of slices with DC negative shift (n) | Onset of DC negative shift (n) | Evoked EPSP (percentage of initial EPSP amplitude) |
|---|---|---|---|
| Control | 0 (0/9)1-a | 110 ± 111-c | |
| OGD (2 min) | 33 (2/6) | 1.0 (2)1-b | |
| OGD (5 min) | 67 (4/6) | 1.5 ± 0.5 (4) | |
| OGD (12 min) | 100 (5/5) | 4.75 ± 1.3 (5) | |
| OGD (42 min) | 100 (8/8) | 5.00 ± 1.9 (8) | |
| OGD/ROX-36°C | 100 (6/6) | 5.9 ± 0.75 (6) | 16 ± 8.5 |
| OGD/ROX-31°C | 43 (7/7) | 8.5 ± 0.76 (3) | 65 ± 16 |
Ratio in parentheses is number of slices exhibiting DC negative shift per total number of slices in experimental group.
Onset (mean minutes of oxygen/glucose deprivation ± SEM) of DC negative shift for those slices (n) exhibiting a shift during the OGD period. See Materials and Methods for electrophysiological protocol.
Differences among treatment and control groups were statistically significant (p < 0.05; Kruskal–Wallis on rank ANOVA with Bonferroni correction).
Elemental composition and water content of CA1 nerve cells from control incubated and nonincubated hippocampal slices
Analyses of nerve cells from nonincubated slices (i.e., slices prepared and frozen immediately without in vitro incubation) revealed gross morphological changes (Fig. 1A) in conjunction with losses of transmembrane elemental gradients and osmoregulation; i.e., in all subcellular compartments, intracellular water content and Na, Cl, and Ca concentrations increased significantly, whereas K, P, and Mg levels decreased (Table2). This initial excision trauma was reversible, however. When hippocampal slices were isolated and incubated under control conditions described in Materials and Methods, CA1 cell morphological characteristics (Fig. 1B) and subcellular elemental composition and water contents were normalized (Table 2). In fact, cytoplasmic distributions of Na, K, Cl, and other elements in these recovered control cells were quantitatively similar to the EPMA-determined elemental composition of rat cortical neurons that were rapidly frozen in situ (Table3). This indicates that cells maintained under our in vitro conditions can establish subcellular ion distributions similar to those in vivo. Electrically evoked EPSPs determined in control incubated slices also were similar to those recorded in other in vivo studies (Table 1), which implies normal ion channel function and neurotransmission. Together, these findings suggest that the methods used for excision and slice preparation in the present studies prevent irreversible damage by promoting restoration of ion gradients and recovery of CA1 nerve cell function.
Table 3.
Elemental composition of cortical and CA1 nerve cell cytoplasm
| Element | Cortical cells | CA1 cells |
|---|---|---|
| Na | 293 ± 9 | 252 ± 11 |
| P | 516 ± 18 | 574 ± 25 |
| Cl | 167 ± 5 | 265 ± 17 |
| K | 600 ± 16 | 662 ± 32 |
| Ca | 6 ± 1 | 5 ± 1 |
| Mg | 42 ± 2 | 24 ± 3 |
Data for cortical cells are from Somlyo et al. (1985). Rat cortex was rapidly frozen in situ by pressing a solid plug of liquid nitrogen-cooled Freon 22 to the exposed brain surface. Frozen tissue was removed, cryosectioned, and then analyzed by EPMA. Control CA1 cell data are from the current study (Table 2). Data are expressed as mean millimoles of element per kilogram of dry weight ± SEM.
Table 2 also shows the elemental composition and water content of subcellular compartments from CA1 hippocampal neurons incubated in control conditions. Mean (± SEM) dry weight Na, Cl, Mg, and Ca concentrations (millimoles of element per kilogram) were similar regardless of compartment examined. Compartments were distinguished by differences in P, K, and water content. Mean P and K concentrations were lower in cytoplasm when compared with mitochondria or nucleus, whereas water content of cytoplasm was higher than that of the other compartments (Table 2).
Elemental composition and water content of CA1 nerve cells from oxygen/glucose-deprived hippocampal slices
OGD caused a progressive loss of elemental regulation in cytoplasm, mitochondria, and nucleus of CA1 nerve cells that correlated temporally with the onset of DC negative shifts and disappearance of evoked EPSPs. Figure 3 shows that after 2 min of experimental ischemia, the K content of all compartments was significantly decreased. Concomitant reductions in Cl, Mg, and P concentrations were also observed (Table4), whereas Ca content of nucleus increased modestly at this time point (Fig. 3). These early elemental changes coincided with the onset of electrically evoked failure of EPSPs; i.e., EPSPs disappeared ∼1.5 min after OGD onset. As oxygen/glucose deprivation continued, large negative shifts in extracellular voltages became more prevalent (mean of 4.8 ± 0.7 min post-OGD initiation) (Table 1). During the 5–42 min interval, compartmental K (Fig. 3), P, and Mg (Table 4) losses worsened progressively, whereas Na concentrations (Fig. 3) increased. Cytoplasmic Ca levels increased substantially (Fig. 3A), whereas in mitochondrial (Fig. 3B) and nuclear (Fig.3C) areas, Ca concentrations increased significantly at 5 min and then decreased after 12 min of experimental ischemia. Cytosolic water content was significantly decreased after 2 min of OGD and then returned toward control over the next 10 min, whereas the water contents of mitochondria and nucleus remained unchanged during 12 min of OGD (Table 4). However, all compartments exhibited significant increases in percentage water after 42 min of OGD exposure (Table4).
Fig. 3.
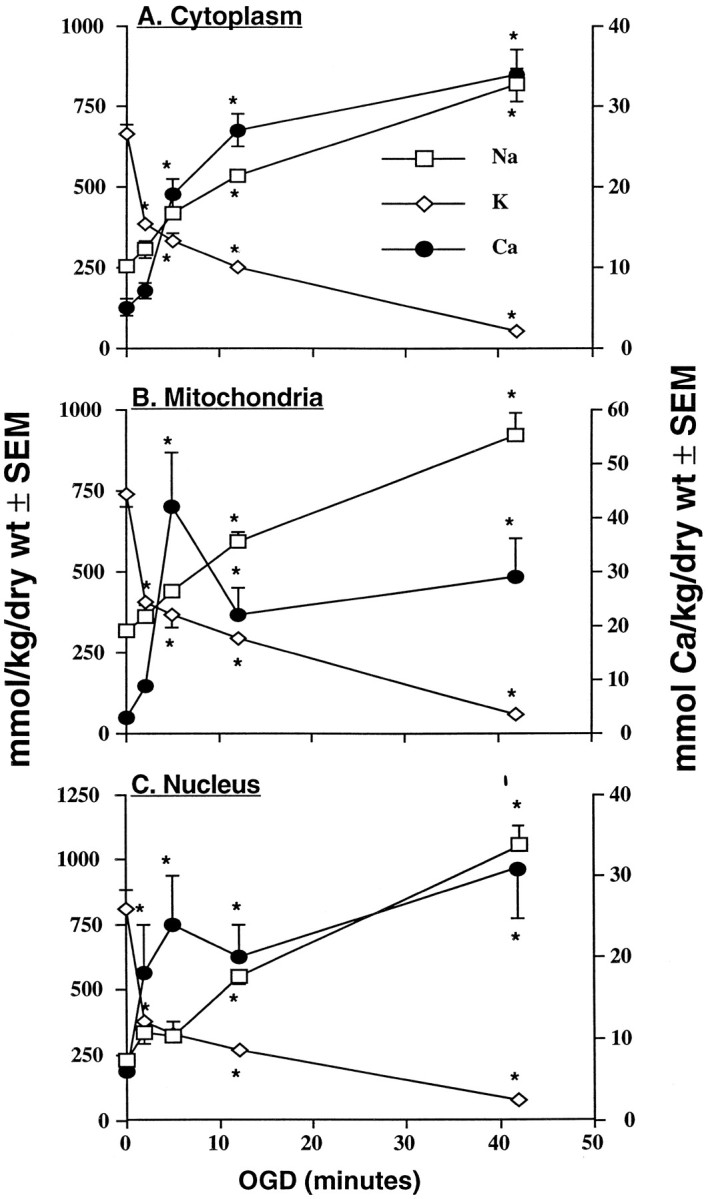
Mean (±SEM) dry weight Na, K, and Ca concentrations (millimoles of element per kilogram) in cytoplasm (A3), mitochondria (B3), and nucleus (C3) of CA1 nerve cells from rat hippocampal slices. Slices were exposed to oxygen/glucose-deficient aCSF for 2, 5, 12, or 42 min. Zero (0) time = pooled control data as presented in Table2. Number of analyses per compartment is presented in Table 4. Left ordinate is concentration scale for Na and K; right ordinate is the Ca scale. * indicates significantly different (p < 0.05) from time (0) control.
Table 4.
Elemental composition and water content of CA1 nerve cells exposed to OGD or OGD/reoxygenation (OGD/ROX) at 36°C or 31°C
| P | Cl | Mg | Water | |
|---|---|---|---|---|
| Cytoplasm | ||||
| 0 min (93) | 609 ± 35 | 265 ± 17 | 25 ± 4 | 75 ± 1 |
| 2 min (47) | 528 ± 15* | 185 ± 5* | 19 ± 1* | 71 ± 1* |
| 5 min (50) | 518 ± 9* | 234 ± 9 | 9 ± 1* | 74 ± 2 |
| 12 min (60) | 452 ± 10* | 324 ± 14 | 2 ± 1* | 75 ± 1 |
| 42 min (46) | 541 ± 21* | 432 ± 29* | 0 ± 1* | 84 ± 1* |
| OGD/ROX-36°C (72) | 439 ± 8* | 690 ± 20* | 1 ± 0* | 83 ± 1* |
| OGD/ROX-31°C (90) | 510 ± 14* | 411 ± 24* | 13 ± 2* | 75 ± 1** |
| Mitochondria | ||||
| 0 min (46) | 776 ± 70 | 351 ± 28 | 29 ± 8 | 63 ± 1 |
| 2 min (27) | 576 ± 22* | 202 ± 10* | 14 ± 2* | 62 ± 1 |
| 5 min (29) | 615 ± 17* | 235 ± 13* | 14 ± 2* | 63 ± 1 |
| 12 min (28) | 546 ± 14* | 351 ± 22* | 2 ± 1* | 62 ± 1 |
| 42 min (32) | 581 ± 33* | 447 ± 41* | 0 ± 1* | 76 ± 3* |
| OGD/ROX-36°C (48) | 502 ± 14* | 825 ± 28* | 1 ± 1* | 79 ± 1* |
| OGD/ROX-31°C (67) | 556 ± 19* | 236 ± 17*,** | 24 ± 2** | 65 ± 1** |
| Nucleus | ||||
| 0 min (29) | 758 ± 81 | 245 ± 31 | 31 ± 6 | 62 ± 1 |
| 2 min (16) | 615 ± 25* | 186 ± 11 | 17 ± 3* | 63 ± 2 |
| 5 min (20) | 558 ± 19* | 185 ± 22 | 14 ± 2* | 63 ± 3 |
| 12 min (19) | 490 ± 17* | 347 ± 36 | 5 ± 2* | 70 ± 3* |
| 42 min (23) | 423 ± 34* | 534 ± 50* | 3 ± 2* | 81 ± 2* |
| OGD/ROX-36°C (41) | 450 ± 45* | 760 ± 37* | 2 ± 1* | 77 ± 1* |
| OGD/ROX-31°C (42) | 580 ± 20* | 185 ± 21*,** | 26 ± 3** | 61 ± 1 |
Slices were incubated in control conditions or were exposed to oxygen/glucose deprivation (OGD) for 2, 5, 12, or 42 min. The (0) time-point represents pooled control data as described in Table 2. In additional studies, slices were exposed to 12 min of OGD followed by reoxygenation with normal oxygenated aCSF for 30 min at 36°C (OGD/ROX-36°C) or 31°C (OGD/ROX-31°C). Data are expressed as mean millimoles of element per kilogram of dry weight ± SEM. Numbers in parentheses represent analyses per experimental condition. *Significantly different (p < 0.05) from pooled control; **significantly different (p < 0.05) from reoxygenation at 36°C.
To assess the ability of oxygen/glucose-deprived neurons to recover normal elemental composition and synaptic function, hippocampal slices were exposed to OGD and subsequently perfused with normal oxygenated aCSF superfusion (reoxygenation). Results show that regardless of morphological compartment examined, reoxygenation failed to restore normal elemental distribution and evoked EPSPs (Fig.4, Table 1). In fact, the magnitude of element and water deregulation associated with 12 min of OGD was worsened by 30 min of subsequent reoxygenation (Fig. 4). The OGD/reoxygenation sequence produced levels of element and water deregulation that were comparable to disruption induced by 42 min of OGD (Fig. 4). Compartmental Ca responses to reoxygenation, however, were a notable exception; i.e., Ca concentrations were significantly higher in reoxygenated cells when compared with Ca levels of neurons subjected to 42 min of OGD (Fig. 4).
Fig. 4.

Mean (± SEM) dry weight Na, K, and Ca concentrations (millimoles of element per kilogram) in cytoplasm (A4), mitochondria (B4), and nucleus (C4) of CA1 nerve cells from rat hippocampal slices. Slices were exposed to oxygen/glucose-deficient aCSF for 12 or 42 min (OGD). To measure changes in cellular elemental composition during reoxygenation (ROX), hippocampal slices were exposed to OGD for 12 min followed by 30 min of perfusion with normal oxygenated aCSF (OGD/ROX).C, Pooled control data as presented in Table 2.Top graphs present Na and K data; bottom graphs present Ca data. 1 indicates significantly different (p < 0.05) from 12 min (12′) OGD data; 2 indicates significantly different (p < 0.05) from 42 min (42′) OGD data.
Neuroprotective effects of mild hypothermia
To determine whether hypothermia might be neuroprotective, nerve cell elemental composition and water contents were determined in hippocampal slices incubated at 31°C during both oxygen/glucose deprivation (12 min) and subsequent superfusion with normal aCSF (30 min). Figure 5A shows that when compared with the severe elemental deregulation induced by OGD/reoxygenation at 36°C, superfusion at 31°C significantly reduced cytoplasmic Na and Ca accumulation and retarded K loss. In addition, mild hypothermia modified the derangement of cytoplasmic water content and P, Cl, and Mg concentrations normally associated with reoxygenation (Table 4). Hypothermic incubation completely prevented reoxygenation-induced mitochondrial Na and Cl accumulation (Fig.5B) and truncated K loss and Ca gain; e.g., in hypothermic conditions mitochondria lost only 22% of their K content as opposed to an 81% loss during normothermic reperfusion. Mitochondrial Mg and water contents in hypothermic cells did not differ from control, whereas P levels were decreased modestly (Table 4). Nuclear regions from hypothermic nerve cells exhibited nearly normal elemental composition and water content. Dry weight concentrations of Na and Ca were similar to control, whereas nuclear K was reduced slightly; i.e., K content decreased only 16% in hypothermic conditions versus an 84% reduction during normothermic reperfusion (Fig. 5C). Reoxygenation during hypothermia prevented nuclear changes in Mg and water, although P levels were below control values (Table 4). These improvements in compartmental elemental composition and water content corresponded to a mean recovery of 65% EPSP magnitude (Table 1).
Fig. 5.

Mean (±SEM) dry weight Na, K, and Ca concentrations (millimoles of element per kilogram) in cytoplasm (5A), mitochondria (5B), and nucleus (5C) of CA1 nerve cells from rat hippocampal slices. Slices were exposed to oxygen/glucose-deficient aCSF for 12 min followed by incubation with normal medium for 30 min (OGD/ROX). To assess the potential neuroprotective effect of hypothermia, aCSF temperature was maintained at either 36°C or 31°C throughout the ischemic and post-ischemic periods. C, Pooled control data as presented in Table 2. Number of analyses per compartment is presented in Table 4. Top graphs present Na and K data; bottom graphspresent Ca data. 1 indicates significantly different (p < 0.05) from control (C); 2 indicates significantly different (p < 0.05) from reoxygenation at 36°C.
DISCUSSION
Effects of OGD on element and water deregulation in CA1 nerve cells
Oxygen/glucose deprivation produced early-onset loss of synaptic function and progressive element and water deregulation in CA1 neurons. Within 2 min of OGD, evoked EPSPs failed, and cytoplasm, mitochondria, and nuclei exhibited substantial decreases in K with smaller reductions in Mg, Cl, and P concentrations. Loss of neuronal K probably occurs secondary to reduced Na+-K+ATPase activity. The precise mechanism of K+ efflux during experimental ischemia/anoxia is unknown, although several lines of evidence implicate membrane leak in conjunction with increased K+ conductance via ionotropic glutamate receptors (AMPA, NMDA receptors) or through voltage- or ATP-sensitive K+ channels (Leblond and Krnjevic, 1989; Jiang and Haddad, 1991; Siesjo, 1992; Zetterstrom et al., 1995). Regardless, intraneuronal K loss is the likely basis of elevated K+o identified previously (Hansen et al., 1982; Lipton and Whittingham, 1982; Enseleit et al., 1984; Murphy and Greenfield, 1992). K efflux during OGD was associated with decreases in cytoplasmic Cl, P, and water in all neuronal compartments. More than likely Cl and P reductions counterbalance cation (K+) loss. At physiological pH, inorganic P is present in two anionic forms: HPO4− and H2PO42−, which in conjunction with Cl− efflux might maintain electroneutrality. Currently, the mechanism of outward HPO4−/H2PO42−transport in neurons is unknown. A significant increase in nuclear Ca content was also an early consequence of experimental ischemia. This selective effect is consistent with previous studies demonstrating a rapid and large Ca2+ rise in nuclei of glutamate-stimulated or K+-depolarized nerve cells (Hernandez-Cruz et al., 1990; Przywara et al., 1991; Kocsis et al., 1993).
After 5 min of OGD, and in very close association with the onset of negative DC shifts, elemental disruption in CA1 nerve cells worsened. This was particularly evident in cytoplasm where mean Na and Ca levels rose significantly, whereas Mg and K continued to decline. These findings support the suggestion that OGD-induced DC shifts or spreading depression-like depolarizations are principally mediated by increased K+ conductance with subsequent elevation of extraneuronal K+ (Hansen, 1985; Katsura et al., 1992; Zetterstrom et al., 1995). Our data also show that an initial loss of transmembrane K+ gradients and depolarization are linked to an acceleration of general ion disruption (Martin et al., 1994). Previous hippocampal slice studies have demonstrated large increases in interstitial glutamate at about this time (Taylor et al., 1995). Although not measured in the present study, elevated glutamate would produce direct activation of ligand-gated cation channels and secondary stimulation of voltage-gated channels. Resulting ion conductances might contribute to or mediate observed intracellular elemental changes. Mitochondrial Ca accumulation after 5 min of OGD was twofold higher than that of either cytoplasm or nuclei, which likely reflects the buffering role of this organelle (Guenter et al., 1994). Although we did not attempt to dissect the relative contribution of internal (e.g., release from smooth endoplasmic reticulum) versus external Ca2+ pools to increased mitochondrial Ca content, influx of Ca2+o appears to be a primary source based on the low intraneuronal baseline levels versus the magnitude of OGD-induced net Ca increases. The route(s) of Ca2+o entry during OGD has not been identified conclusively, although several studies suggest a complex interaction among glutamate receptor-coupled Ca2+conductances, voltage-dependent Ca2+ channels, and reverse Na+/Ca2+-exchanges (Lobner and Lipton, 1993; Hoyt et al., 1998).
Continuation of oxygen/glucose deprivation (12–42 min) progressively intensified Na, K, and Mg changes in all compartments. Although cytoplasmic Ca accumulation continued at a near linear pace over the 12–42 min period, Ca levels in mitochondrial and nuclear regions decreased or remained constant relative to the 5 min data. The mechanism of truncated mitochondrial Ca accumulation and abrupt egress is uncertain. It is possible that this represents Ca2+ efflux from mitochondria via extramitochondrial Na+-stimulated Na+–Ca2+ exchange (White and Reynolds, 1997). Alternatively, Ca loss might be mediated by OGD-induction of mitochondrial permeability transition (mPT). mPT is characterized by opening of a proteinaceous inner mitochondrial pore with subsequent loss of membrane potential, rapid Ca2+ efflux, and leakiness to K+, Mg2+, and other solutes (Bernardi et al., 1994). A growing body of evidence suggests that mPT and resulting mitochondrial dysfunction are importantly involved in ischemic/hypoxic neuronal injury (Guenter et al., 1994; Kristian and Siesjo, 1996; White and Reynolds, 1996; Kristal and Dubinsky, 1997). Regardless, loss of mitochondrial Ca2+ buffering and resulting increased cytoplasmic Ca2+ burden could contribute significantly to ischemic damage of CA1 nerve cells (Kristian and Siesjo, 1996).
An exacerbated neuronal Ca2+ burden characterizes reoxygenation injury
Previous research demonstrated a lack of functional synaptic recovery during post-OGD reperfusion of hippocampal slices (Balestrino et al., 1989; Boening et al., 1989; Taylor and Weber, 1993; Weber and Taylor, 1994). Similarly, in our study of CA1 cells reoxygenated after 12 min of OGD, evoked EPSPs were absent and cellular elemental composition was severely disturbed. Thus, elemental deregulation initiated during OGD worsened despite restoration of normal oxygen and glucose perfusion. This severe level of disruption was similar to the extent of element and water deregulation produced by 42 min of continuous OGD, with the exception that reoxygenation was distinguished by selective exacerbation of Ca entry and compartmental accumulation. Neither the corresponding mechanism nor pathophysiological implications of this augmented Ca2+ entry are fully understood. However, it should be noted that net mitochondrial Ca accumulation during reoxygenation was substantial and surpassed that of either cytoplasm or nuclei. Uniporter-mediated Ca2+transport can dissipate the mitochondrial membrane potential and thereby interfere with energy production (Guenter et al., 1994). That mitochondria from reoxygenated neurons are dysfunctional is suggested by the extent of general elemental disruption and loss of osmoregulation observed in the present study. Severe mitochondrial impairment after post-ischemia recirculation has been documented previously (Rehncrona et al., 1979; Hillered et al., 1984; Sims, 1991;Almeida et al., 1995), and injured mitochondria are considered to be a significant source of reactive oxygen species that might additionally contribute to neuronal reperfusion injury (Vlessis et al., 1990;Dykens, 1994; Reynolds and Hastings, 1995; White and Reynolds, 1996). Amplification of cell Ca2+ burden and associated mitochondrial dysfunction caused by reoxygenation might therefore be responsible for, or contribute to, the inability of neurons to recover from transient OGD (Young, 1986; Siesjo, 1992).
Calculated neuronal ionic concentrations
Aqueous ionic (millimolar) concentrations of elements can be calculated from respective EPMA-derived millimoles of element per kilogram of dry weight and percentage water data (LoPachin and Stys, 1995; Stys et al., 1997). Thus, when mm concentrations of major diffusable ions are calculated for control CA1 nerve cells, results are higher than anticipated; i.e., Na+ = 60 mm, Cl− = 83 mm, and K+ = 188 mm. A similar discrepancy exists when ionic concentrations were calculated based on EPMA data from rat dorsal root ganglion nerve cells (LoPachin et al., 1988). During OGD and reoxygenation of hippocampal slices, total intraneuronal elemental content rose progressively but was not accompanied by compensatory increases in cell water of equal magnitude (Fig. 3, Table4). These observations apparently contradict the principle of osmolarity and therefore might reflect methodological problems such as inaccurate water or element measurements. However, that EPMA can provide reliable and accurate information is suggested by a control mean (±SEM) neuronal water content of 75 ± 1% (Table 4), which corresponds to accepted values (75–80%) (Macknight, 1987). Moreover, recent work in CNS and PNS nerves has shown that EPMA-based calculations of control axonal resting membrane potentials, free Na+, K+, and Cl− concentrations, and corresponding ion equilibrium potentials are in close agreement with previously published results derived by other electrophysiological or analytical methods (Stys et al., 1997). Because EPMA cannot distinguish ionic versus bound element, the discrepancy between estimated and expected ion concentrations for CA1 neurons likely results from inclusion of a nonexchangeable fraction in calculations of aqueous ion concentrations. These results also suggest that nerve soma contains a relatively large bound or ionically inactive fraction of Na, K, and Cl (Brinley, 1967;Woodward et al., 1969; Brown and Scholfield, 1974), whereas these elements in axons are primarily ionized (Walker and Brown, 1977).
Hypothermia and neuroprotection
The effects of hypothermia (31°C) on OGD/reoxygenation-induced CA1 cell elemental disruption were also investigated. Previous research indicates that moderate hypothermia (30–31°C) during transient ischemia and reperfusion can modify associated structural and functional perturbations; e.g., hypothermia prevented histopathological changes (Morikawa et al., 1992), retarded tissue Ca2+ accumulation (Mitani et al., 1991), glutamate release (Globus et al., 1988), free radical activity (Globus et al., 1995), and membrane depolarization (Onitsuka et al., 1998), and promoted recovery of synaptic potentials (Taylor and Weber, 1993). In our study, incubation of hippocampal slices at 31°C provided nearly complete protection against neuronal element and water deregulation induced by OGD/reoxygenation. In addition, hypothermia mostly preserved postsynaptic potentials. It is notable that near-normal cellular Mg contents were maintained during hypothermia because this element is closely associated with functional viability (Alvarez-Leefmans et al., 1987). For mitochondria in particular, preservation of Mg has potential significance because Mg2+ moderates both mitochondrial Ca2+ uptake and formation of the transition pore (Guenter et al., 1994; Novgorodov et al., 1994). Regardless, it is not known how hypothermia lessens synaptic dysfunction and ion perturbation induced by OGD/reoxygenation. It is likely that acute neuronal recovery during hypothermia is facilitated by a reduction in ATP consumption and cellular Ca2+burden that appears to correspond to preservation of mitochondrial and nuclear ion distribution and function (Erecinska and Silver, 1994;Globus et al., 1995). In addition, moderation of elevated cytosolic Ca2+ concentrations during hypothermia could prevent activation of calcium-stimulated proteases (calpains) that might play a role in ischemia-induced neuronal damage (Wang and Yuen, 1994). Inhibition of nuclear Ca accumulation by hypothermia could also prevent Ca2+ activation of cell-death genes that might mediate delayed-onset ischemia-induced neurodegeneration (Nitatori et al., 1995).
Conclusions
In vitro exposure of rat hippocampal slices to experimental ischemia produced early (2 min OGD) decreases in intraneuronal concentrations of K, Cl, P, and Mg. Continued OGD was associated with more extensive derangement of subcellular elemental composition characterized by significantly elevated Na, Cl, and Ca levels and progressive K and Mg losses. The onset of intraneuronal elemental disturbance during hippocampal OGD was temporally correlated to developing cellular morphological alterations and synaptic deficits. This suggests that K+ loss and Na+/Ca2+ gains in deprived CA1 cells are causally linked to induction of structural and functional perturbations (Hansen, 1985; Choi, 1988, 1995; Lobner and Lipton, 1993;Martin et al., 1994). Post-OGD superfusion of slices with oxygenated, glucose-containing media did not promote CA1 cell recovery, and instead intraneuronal elemental disruption continued to deteriorate. The observed patterns of ion translocation that characterize reoxygenated individual subcellular organelles (mitochondria, nuclei) might play a critical role in mediating early and delayed consequences of transient ischemia (Nitatori et al., 1995; Kristian and Siesjo, 1996; White and Reynolds, 1996, 1997). Regardless, our findings suggest that hypothermia might be neuroprotective because of slowing of this ion redistribution and consequential preservation of subcellular ion composition and organelle function. The present study has provided detailed, previously unavailable data regarding the extent and magnitude of ion deregulation in OGD/reoxygenation-injured CNS nerve cells. Such information represents a basis for refining our understanding of ischemic nerve injury and for development and testing of potential neuroprotective strategies.
Footnotes
This study was sponsored by a Research Initiation Grant from Montefiore Medical Center to R.M.L. and E.J.L and by salaries and supplies from Parke-Davis Research Division to C.P.T. and M.L.W. We thank Drs. Peter Lipton, Peter Stys, David Andrews, and Cathryn Jarvis for their helpful comments and criticisms.
Correspondence should be addressed to Dr. Richard M. LoPachin, Anesthesia Research–Moses 7, Montefiore Medical Center, 111 E. 210th Street, Bronx, NY 10467-2490.
REFERENCES
- 1.Almeida A, Allen KL, Bates TE, Clark JB. Effect of reperfusion following cerebral ischaemia on the activity of the mitochondrial respiratory chain in the gerbil brain. J Neurochem. 1995;65:1698–1703. doi: 10.1046/j.1471-4159.1995.65041698.x. [DOI] [PubMed] [Google Scholar]
- 2.Alvarez-Leefmans FJ, Giraldez F, Gamino SM. Intracellular free magnesium in excitable cells: its measurement and its biologic significance. Can J Physiol Pharmacol. 1987;65:915–925. doi: 10.1139/y87-147. [DOI] [PubMed] [Google Scholar]
- 3.Andersen P, Lomo T. Mode of activation of hippocampal pyramidal cells by excitatory synapses on dendrites. Exp Brain Res. 1966;2:247–260. [PubMed] [Google Scholar]
- 4.Balestrino M, Aitken PG, Somjen GG (1989) Spreading depression-like hypoxic depolarization in CA 1 and fascia dentata of hippocampal slices: relationship to selective vulnerability. Brain Res 102–107. [DOI] [PubMed]
- 5.Bernardi P, Broekemeier KM, Pfeiffer DR. Recent progress on regulation of the mitochondrial permeability transition pore: a cyclosporin-sensitive pore in the inner mitochondrial membrane. J Bioenerg Biomembr. 1994;26:509–517. doi: 10.1007/BF00762735. [DOI] [PubMed] [Google Scholar]
- 6.Boening JA, Kass IS, Cottrell JE, Chambers G. The effect of blocking sodium influx on anoxic damage in the rat hippocampal slice. Neuroscience. 1989;33:263–268. doi: 10.1016/0306-4522(89)90205-4. [DOI] [PubMed] [Google Scholar]
- 7.Brinley FJ. Potassium accumulation and transport in the rat sympathetic ganglion. J Neurophysiol. 1967;30:1531–1560. doi: 10.1152/jn.1967.30.6.1531. [DOI] [PubMed] [Google Scholar]
- 8.Brown DA, Scholfield CN. Changes in intracellular sodium and potassium ion concentrations in isolated rat superior cervical ganglia induced by depolarizing agents. J Physiol (Lond) 1974;242:307–319. doi: 10.1113/jphysiol.1974.sp010709. [DOI] [PMC free article] [PubMed] [Google Scholar]
- 9.Bulger RE, Beeuwkes R, Saubermann AJ. Application of scanning electron microscopy to x-ray analysis of frozen-hydrated sections. III. Elemental content of cells in the rat renal papillary tip. J Cell Biol. 1981;88:274–280. doi: 10.1083/jcb.88.2.274. [DOI] [PMC free article] [PubMed] [Google Scholar]
- 10.Choi DW. Calcium-mediated neurotoxicity: relationship to specific channel types and role in ischemic damage. Trends Neurosci. 1988;11:465–469. doi: 10.1016/0166-2236(88)90200-7. [DOI] [PubMed] [Google Scholar]
- 11.Choi DW. Calcium: still center-stage in hypoxic-ischemic neuronal death. Trends Neurosci. 1995;18:58–60. [PubMed] [Google Scholar]
- 12.Dykens JA. Isolated cerebral and cerebellar mitochondria produce free radicals when exposed to elevated Ca2+ and Na+: implications for neurodegeneration. J Neurochem. 1994;63:584–591. doi: 10.1046/j.1471-4159.1994.63020584.x. [DOI] [PubMed] [Google Scholar]
- 13.Enseleit WH, Domer FR, Jarrott DM, Baricos WH. Cerebral phospholipid content and Na, K-ATPase activity during ischemia and postischemic reperfusion in the Mongolian gerbil. J Neurochem. 1984;43:320–327. doi: 10.1111/j.1471-4159.1984.tb00903.x. [DOI] [PubMed] [Google Scholar]
- 14.Erecinska M, Silver IA. Ions and energy in mammalian brain. Prog Neurobiol. 1994;43:37–71. doi: 10.1016/0301-0082(94)90015-9. [DOI] [PubMed] [Google Scholar]
- 15.Foster MC, Saubermann AJ. Personal-computer-based system for electron beam X-ray microanalysis of biological samples. J Microsc. 1991;161:367–373. doi: 10.1111/j.1365-2818.1991.tb03097.x. [DOI] [PubMed] [Google Scholar]
- 16.Globus MY-T, Busto R, Dietrich WD, Martinez E, Valdes I, Ginsberg MD. Intra-ischemic extracellular release of dopamine and glutamate is associated with striatal vulnerability to ischemia. Neurosci Lett. 1988;91:36–40. doi: 10.1016/0304-3940(88)90245-5. [DOI] [PubMed] [Google Scholar]
- 17.Globus MY-T, Busto R, Lin B, Schnippering H, Ginsberg MD. Detection of free radical activity during transient global ischemia and recirculation: effects of intra-ischemic brain temperature modulation. J Neurochem. 1995;65:1250–1256. doi: 10.1046/j.1471-4159.1995.65031250.x. [DOI] [PubMed] [Google Scholar]
- 18.Guenter TD, Gunter KK, Sheu SS, Gavin CE. Mitochondrial calcium transport: physiological and pathological relevance. Am J Physiol. 1994;267:C313–C339. doi: 10.1152/ajpcell.1994.267.2.C313. [DOI] [PubMed] [Google Scholar]
- 19.Hall TA, Anderson HC, Appleton T. The use of thin specimens for x-ray microanalysis in biology. J Microsc. 1973;99:177–182. [Google Scholar]
- 20.Hansen AJ. Effect of anoxia on ion distribution in the brain. Physiol Rev. 1985;65:101–148. doi: 10.1152/physrev.1985.65.1.101. [DOI] [PubMed] [Google Scholar]
- 21.Hansen AJ, Zeuthen T. Extracellular ion concentrations during spreading depression and ischemia in rat brain cortex. Acta Physiol Scand. 1981;113:437–445. doi: 10.1111/j.1748-1716.1981.tb06920.x. [DOI] [PubMed] [Google Scholar]
- 22.Hansen AJ, Hounsgaard J, Jahnsen H. Anoxia increases potassium conductance in hippocampal nerve cells. Acta Physiol Scand. 1982;115:301–310. doi: 10.1111/j.1748-1716.1982.tb07082.x. [DOI] [PubMed] [Google Scholar]
- 23.Harris RJ, Symon L, Branston NM, Bayham M. Changes in extracellular calcium activity in cerebral ischemia. J Cereb Blood Flow Metab. 1981;1:203–209. doi: 10.1038/jcbfm.1981.21. [DOI] [PubMed] [Google Scholar]
- 24.Hernandez-Cruz A, Sala F, Adams PR. Subcellular calcium transients visualized by confocal microscopy in a voltage-clamped vertebrate neuron. Science. 1990;247:858–862. doi: 10.1126/science.2154851. [DOI] [PubMed] [Google Scholar]
- 25.Hillered L, Siesjo BK, Arfors KE. Mitochondrial response to transient forebrain ischemia and recirculation in the rat. J Cereb Blood Flow Metab. 1984;4:438–446. doi: 10.1038/jcbfm.1984.63. [DOI] [PubMed] [Google Scholar]
- 26.Hossmann KA. Peri-infarct depolarizations. Cerebrovasc Brain Metab Rev. 1996;8:195–208. [PubMed] [Google Scholar]
- 27.Hoyt HR, Arden SR, Aizenman E, Reynolds IJ. Reverse Na+/Ca2+ exchange contributes to glutamate-induced intracellular Ca2+ concentration increases in cultured rat forebrain neurons. Mol Pharmacol. 1998;53:742–749. [PubMed] [Google Scholar]
- 28.Jiang C, Haddad GG. Effect of anoxia on intracellular and extracellular potassium activity in hypoglossal neurons in vitro. J Neurophysiol. 1991;66:103–111. doi: 10.1152/jn.1991.66.1.103. [DOI] [PubMed] [Google Scholar]
- 29.Katsura K, Minamisava H, Ekholm A, Folbergrova J, Siesjo BK. Changes of labile metabolites during anoxia in moderately hypo- and hyperthermic rats: correlation to membrane fluxes of K+. Brain Res. 1992;590:6–12. doi: 10.1016/0006-8993(92)91075-p. [DOI] [PubMed] [Google Scholar]
- 30.Kocsis JD, Rand MN, Chen B, Waxman SG, Pourcho R. Kainate elicits elevated nuclear calcium signals in retinal neurons via calcium-induced calcium release. Brain Res. 1993;616:273–282. doi: 10.1016/0006-8993(93)90218-c. [DOI] [PubMed] [Google Scholar]
- 31.Kristal BS, Dubinsky JM. Mitochondrial permeability transition in the central nervous system: induction by calcium cycling-dependent and -independent pathways. J Neurochem. 1997;69:524–538. doi: 10.1046/j.1471-4159.1997.69020524.x. [DOI] [PubMed] [Google Scholar]
- 32.Kristian T, Siesjo BK. Calcium-related damage in ischemia. Life Sci. 1996;59:357–367. doi: 10.1016/0024-3205(96)00314-1. [DOI] [PubMed] [Google Scholar]
- 33.Leblond J, Krnjevic K. Hypoxic changes in hippocampal neurons. J Neurophysiol. 1989;62:1–14. doi: 10.1152/jn.1989.62.1.1. [DOI] [PubMed] [Google Scholar]
- 34.LeFurgey A, Spencer AJ, Jacobs WR, Ingram P, Mandel LJ. Elemental microanalysis of organelles in proximal tubules. I. Alterations in transport and metabolism. J Am Soc Nephrol. 1991;1:1305–1320. doi: 10.1681/ASN.V1121305. [DOI] [PubMed] [Google Scholar]
- 35.Lipton P, Whittingham TS. Reduced ATP concentrations: a basis for synaptic transmission failure during hypoxia in the in vitro guinea-pig hippocampus. J Physiol (Lond) 1982;325:51–65. doi: 10.1113/jphysiol.1982.sp014135. [DOI] [PMC free article] [PubMed] [Google Scholar]
- 36.Lobner D, Lipton P. Intracellular calcium levels and calcium fluxes in the CA 1 region of the rat hippocampal slice during in vitro ischemia: relationship to electrophysiological cell damage. J Neurosci. 1993;13:4861–4871. doi: 10.1523/JNEUROSCI.13-11-04861.1993. [DOI] [PMC free article] [PubMed] [Google Scholar]
- 37.LoPachin RM. Electron probe X-ray microanalysis as a tool for discerning mechanism of nerve injury. In: Chang L, Slikker W, editors. Neurotoxicology: approaches and methods. Academic; San Diego: 1995. pp. 445–453. [Google Scholar]
- 38.LoPachin RM, Lehning EJ. Mechanism of calcium entry during axon injury and degeneration. Toxicol Appl Pharmacol. 1997;143:233–244. doi: 10.1006/taap.1997.8106. [DOI] [PubMed] [Google Scholar]
- 39.LoPachin RM, Stys P. Elemental composition and water content of rat optic nerve myelinated axons and glial cells: effects of in vitro anoxia and reoxygenation. J Neurosci. 1995;15:6735–6746. doi: 10.1523/JNEUROSCI.15-10-06735.1995. [DOI] [PMC free article] [PubMed] [Google Scholar]
- 40.LoPachin RM, Lowery J, Eichberg J, Kirkpatrick JB, Cartwright J, Saubermann AJ. Distribution of elements in rat peripheral axons and nerve cell bodies determined by x-ray microprobe analysis. J Neurochem. 1988;51:764–775. doi: 10.1111/j.1471-4159.1988.tb01811.x. [DOI] [PubMed] [Google Scholar]
- 41.LoPachin RM, Castiglia CM, Saubermann AJ. Elemental composition and water content of myelinated axons and glial cells in rat central nervous system. Brain Res. 1991;549:253–259. doi: 10.1016/0006-8993(91)90465-8. [DOI] [PubMed] [Google Scholar]
- 42.Macknight ADC. Volume maintenance in isosmotic conditions. Curr Topics Membr Transp. 1987;30:3–43. [Google Scholar]
- 43.Martin RL, Lloyd HGE, Cowan AI. The early events of oxygen and glucose deprivation: setting the scene for neuronal death? Trends Neurosci. 1994;17:251–257. doi: 10.1016/0166-2236(94)90008-6. [DOI] [PubMed] [Google Scholar]
- 44.Mitani A, Kakoya F, Kataoka K. Temperature dependence of hypoxia-induced calcium accumulation in gerbil hippocampal slices. Brain Res. 1991;562:159–163. doi: 10.1016/0006-8993(91)91201-b. [DOI] [PubMed] [Google Scholar]
- 45.Moghaddam B, Schenk JO, Stewart WB, Hansen AJ. Temporal relationship between neurotransmitter release and ion flux during spreading depression and anoxia. Can J Physiol Pharmacol. 1986;65:1105–1110. doi: 10.1139/y87-173. [DOI] [PubMed] [Google Scholar]
- 46.Morikawa E, Ginsberg MD, Dietrich WD, Duncan RC, Kraydieh S, Globus MY-T, Busto R. The significance of brain temperature in focal cerebral ischemia: histopathological consequences of middle cerebral artery occlusion in the rat. J Cereb Blood Flow Metab. 1992;12:380–389. doi: 10.1038/jcbfm.1992.55. [DOI] [PubMed] [Google Scholar]
- 47.Murphy KPSJ, Greenfield SA. Neuronal selectivity of ATP-sensitive potassium channels in guinea-pig substantia nigra revealed by responses to anoxia. J Physiol (Lond) 1992;453:167–183. doi: 10.1113/jphysiol.1992.sp019222. [DOI] [PMC free article] [PubMed] [Google Scholar]
- 48.Nitatori T, Sata N, Wafuri S, Karasawa Y, Araki H, Shibanai K, Kominami E, Uchiyama Y. Delayed neuronal death in the CA 1 pyramidal cell layer of the gerbil hippocampus following transient ischemia is apoptosis. J Neurosci. 1995;15:1001–1011. doi: 10.1523/JNEUROSCI.15-02-01001.1995. [DOI] [PMC free article] [PubMed] [Google Scholar]
- 49.Novgorodov SA, Gudz TI, Brierley GP, Pfeiffer DR. Magnesium ion modulates the sensitivity of the mitochondrial permeability transition pore to cyclosporin A and ADP. Arch Biochem Biopsyiol. 1994;311:219–228. doi: 10.1006/abbi.1994.1230. [DOI] [PubMed] [Google Scholar]
- 50.Onitsuka M, Mihara S, Inokuchi H, Shigemori M, Higashi H. Mild hypothermia protects rat hippocampal CA1 neurons from irreversible membrane dysfunction induced by experimental ischemia. Neurosci Res. 1998;30:1–6. doi: 10.1016/s0168-0102(97)00110-7. [DOI] [PubMed] [Google Scholar]
- 51.Peters A, Palay SL, Webster HD. The fine structure of the nervous system: neurons and their supporting cells, ed 3, pp 14–69. Oxford UP; New York: 1991. The neuronal cell body. [Google Scholar]
- 52.Przywara DA, Behave S, Behave A, Wakade TD, Wakade AR. Stimulated rise in neuronal calcium is faster and greater in the nucleus than the cytosol. FASEB J. 1991;5:217–222. doi: 10.1096/fasebj.5.2.2004666. [DOI] [PubMed] [Google Scholar]
- 53.Rehncrona S, Mela L, Siesjo BK. Recovery of brain mitochondrial function in the rat after complete and incomplete cerebral ischemia. Stroke. 1979;10:437–446. doi: 10.1161/01.str.10.4.437. [DOI] [PubMed] [Google Scholar]
- 54.Reynolds IJ, Hastings TG. Glutamate induces the production of reactive oxygen species in cultured forebrain neurons following NMDA receptor activation. J Neurosci. 1995;15:3318–3327. doi: 10.1523/JNEUROSCI.15-05-03318.1995. [DOI] [PMC free article] [PubMed] [Google Scholar]
- 55.Saubermann AJ, Heyman RV. Quantitative digital x-ray imaging using frozen hydrated and frozen dried tissue sections. J Microsc. 1987;146:169–182. doi: 10.1111/j.1365-2818.1987.tb01338.x. [DOI] [PubMed] [Google Scholar]
- 56.Saubermann AJ, Beeuwkes R, Peters PD. Application of scanning electron microscopy to X-ray analysis of frozen-hydrated sections. II. Analysis of standard solutions and artificial electrolyte gradients. J Cell Biol. 1981a;88:268–273. doi: 10.1083/jcb.88.2.268. [DOI] [PMC free article] [PubMed] [Google Scholar]
- 57.Saubermann AJ, Echlin P, Peters PD, Beeuwkes R. Application of scanning electron microscopy to X-ray analysis of frozen-hydrated sections. I. Specimen handling techniques. J Cell Biol. 1981b;88:257–267. doi: 10.1083/jcb.88.2.257. [DOI] [PMC free article] [PubMed] [Google Scholar]
- 58.Saubermann AJ, Castiglia CM, Foster MC. Preferential uptake of rubidium from extracellular space by glial cells compared to neurons in leech ganglia. Brain Res. 1992;577:64–72. doi: 10.1016/0006-8993(92)90538-k. [DOI] [PubMed] [Google Scholar]
- 59.Siesjo BK. Pathophysiology and treatment of focal cerebral ischemia. Part I: pathophysiology. J Neurosurg. 1992;77:169–184. doi: 10.3171/jns.1992.77.2.0169. [DOI] [PubMed] [Google Scholar]
- 60.Silver IA, Erecinska M. Intracellular and extracellular changes of [Ca2+] in hypoxia and ischemia in rat brain in vivo. J Gen Physiol. 1990;95:837–866. doi: 10.1085/jgp.95.5.837. [DOI] [PMC free article] [PubMed] [Google Scholar]
- 61.Silver IA, Deas J, Erecinska M. Ion homeostasis in brain cells: differences in intracellular ion responses to energy limitation between cultured neurons and glial cells. Neuroscience. 1997;78:589–601. doi: 10.1016/s0306-4522(96)00600-8. [DOI] [PubMed] [Google Scholar]
- 62.Sims NR. Selective impairment of respiration in mitochondrial isolated from brain subregions following transient forebrain ischemia in the rat. J Neurochem. 1991;56:1836–1844. doi: 10.1111/j.1471-4159.1991.tb03438.x. [DOI] [PubMed] [Google Scholar]
- 63.Somjen GG, Aitken PG, Balestrino M, Herreras O, Kawasaki K (1990) Spreading depression-like depolarization and selective vulnerability of neurons: a brief review. Stroke [Suppl III] 21:III-179–III-183. [PubMed]
- 64.Somlyo AP, Urbanics R, Vadasz G, Kovach AGB, Somlyo AV. Mitochondrial calcium and cellular electrolytes in brain cortex frozen in situ: electron probe analysis. Biochem Biopsy Res Commun. 1985;132:1071–1078. doi: 10.1016/0006-291x(85)91916-3. [DOI] [PubMed] [Google Scholar]
- 65.Stys PK, Lehning EJ, Saubermann AJ, LoPachin RM. Intracellular concentrations of major ions in rat myelinated axons and glia: calculations based on electron probe X-ray microanalysis. J Neurochem. 1997;68:1920–1928. doi: 10.1046/j.1471-4159.1997.68051920.x. [DOI] [PubMed] [Google Scholar]
- 66.Taylor CP, Weber ML. Effect of temperature on synaptic function after reduced oxygen and glucose in hippocampal slices. Neuroscience. 1993;52:555–562. doi: 10.1016/0306-4522(93)90405-5. [DOI] [PubMed] [Google Scholar]
- 67.Taylor CP, Burke SP, Weber ML. Hippocampal slices: glutamate release and cellular damage from ischemia are reduced by sodium channel blockade. J Neurosci Methods. 1995;59:121–128. doi: 10.1016/0165-0270(94)00202-r. [DOI] [PubMed] [Google Scholar]
- 68.Vlessis AA, Widener LL, Bartos D. Effect of peroxide, sodium, and calcium on brain mitochondrial respiration in vitro: potential role in cerebral ischemia and reperfusion. J Neurochem. 1990;54:1412–1418. doi: 10.1111/j.1471-4159.1990.tb01977.x. [DOI] [PubMed] [Google Scholar]
- 69.Walker JL, Brown HM. Intracellular ionic activity measurements in nerve and muscle. Physiol Rev. 1977;57:729–781. doi: 10.1152/physrev.1977.57.4.729. [DOI] [PubMed] [Google Scholar]
- 70.Wang KW, Yuen P-W. Calpain inhibition: an overview of its therapeutic potential. Trends Pharmacol Sci. 1994;15:412–419. doi: 10.1016/0165-6147(94)90090-6. [DOI] [PubMed] [Google Scholar]
- 71.Weber ML, Taylor CP. Damage from oxygen and glucose deprivation in hippocampal slices is prevented by tetrodotoxin, lidocaine and phenytoin without blockade of action potentials. Brain Res. 1994;664:167–177. doi: 10.1016/0006-8993(94)91967-4. [DOI] [PubMed] [Google Scholar]
- 72.White RJ, Reynolds IJ. Mitochondrial depolarization in glutamate-stimulated neurons: an early signal specific to excitotoxin exposure. J Neurosci. 1996;15:5688–5697. doi: 10.1523/JNEUROSCI.16-18-05688.1996. [DOI] [PMC free article] [PubMed] [Google Scholar]
- 73.White RJ, Reynolds IJ. Mitochondria accumulate Ca2+ following intense glutamate stimulation of cultured rat forebrain neurons. J Physiol (Lond) 1997;498:31–47. doi: 10.1113/jphysiol.1997.sp021839. [DOI] [PMC free article] [PubMed] [Google Scholar]
- 74.Woodward JK, Bianchi CP, Erulkar SD. Electrolyte distribution in rabbit superior cervical ganglion. J Neurochem. 1969;16:289–299. doi: 10.1111/j.1471-4159.1969.tb10367.x. [DOI] [PubMed] [Google Scholar]
- 75.Young W. Ca paradox in neural injury: a hypothesis. Cent Nerv Syst Trauma. 1986;3:235–251. doi: 10.1089/cns.1986.3.235. [DOI] [PubMed] [Google Scholar]
- 76.Zetterstrom TSC, Vaughan-Jones RD, Grahame-Smith DG. A short period of hypoxia produces a rapid and transient rise in [K+]e in rat hippocampus in vivo which is inhibited by certain K+-channel blocking agents. Neuroscience. 1995;67:815–821. doi: 10.1016/0306-4522(95)00107-t. [DOI] [PubMed] [Google Scholar]