

Abstract
To define the spatiotemporal development of and simultaneously select for oligodendrocytes (OLs) and Schwann cells (SCs), transgenic mice were generated that expressed a bacterial β-galactosidase (β-gal) and neomycin phosphotransferase fusion protein (βgeo) under the control of murine 2′3′-cyclic nucleotide 3′-phosphodiesterase (muCNP) promoters I and II. Transgenic β-gal activity was detected at embryonic day 12.5 in the ventral region of the rhombencephalon and spinal cord and in the neural crest. When cells from the rhombencephalon were cultured in the presence of G418, surviving cells differentiated into OLs, indicating that during development this brain region provides one source of OL progenitors. Postnatally, robust β-gal activity was localized to OLs throughout the brain and was absent from astrocytes, neurons, and microglia or monocytes. In the sciatic nerve β-gal activity was localized exclusively to SCs. Cultures from postnatal day 10 brain or sciatic nerve were grown in the presence of G418, and within 8–9 d exposure to antibiotic, 99% of all surviving cells were β-gal-positive OLs or SCs. These studies demonstrate that the muCNP-βgeo transgenic mice are useful for identifying OLs and SCs beginning at early stages of the glial cell lineage and throughout their development. This novel approach definitively establishes that the β-gal-positive cells identifiedin vivo are glial progenitors, as defined by their ability to survive antibiotic selection and differentiate into OLs or SCs in vitro. Moreover, this experimental paradigm facilitates the rapid and efficient selection of pure populations of mouse OLs and SCs and further underscores the use of cell-specific promoters in the purification of distinct cell types.
Keywords: 2′,3′-cyclic nucleotide 3′-phosphodiesterase; β-galactosidase; CNS; development; glia; neomycin resistance; peripheral nervous system; selection; tissue culture
Many properties of neural cells have been determined by in vitro characterization. The advantage of a tissue culture system is that specific biological questions can be addressed under controlled conditions. Cells derived from the peripheral nervous system (PNS) or CNS and maintained in culture have been shown to be physiologically, antigenically, and morphologically similar to their in situ correlates (Landis, 1976; Patterson and Chun, 1977; Abney et al., 1983; Porter et al., 1986; Barres et al., 1988; Morrissey et al., 1991) and can function normally once transplanted back into their appropriate in vivo environments (Porter et al., 1986; Feltri et al., 1992; Gage et al., 1995; Gross et al., 1996; Martin et al., 1996; Li and Raisman, 1997; Lundberg et al., 1997; McKay, 1997; Svendsen et al., 1997). Tissue culture paradigms are useful for analyzing the origins of specific neural cell types and determining whether cells identified as presumptive precursor cells in vivo are capable of differentiating into mature neurons or glia. For example, in the oligodendrocyte (OL) lineage, cells that originate from specific CNS regions and express 2′3′-cyclic nucleotide 3′-phosphodiesterase (CNP), PDGF-α receptor, or DM-20 mRNAs are thought to represent OL progenitors (Pringle and Richardson, 1993; Yu et al., 1994;Timsit et al., 1995; for review, see Miller, 1996). However, in view of the plasticity of neural cells and the possibility they may transiently express some markers without committing to a specific lineage, it is difficult to determine whether these same cells differentiate into OLs or Schwann cells (SCs), making an approach for selecting progenitors desirable.
None of the presently available selection strategies incorporate the advantage of simultaneously marking cells for future analyses, beginning early in their lineage progression. Using a transgenic (Tg) model, we describe a novel method to identify mouse OL and SC progenitors and to efficiently isolate these cells directly from the CNS and PNS, respectively. The murine CNP (muCNP) promoters I and II (Kurihara et al., 1990; Gravel et al., 1998) were used to drive the expression of a β-galactosidase (β-gal) and neomycin phosphotransferase (NPT, neomycin resistance) fusion gene (βgeo;Friedrich and Soriano, 1991) in Tg mice (muCNP-βgeo).
Consistent with the expression patterns of several myelin genes (Zeller et al., 1985; Monge et al., 1986; Jordan et al., 1989; Yu et al., 1994;Timsit et al., 1995; Hajihosseini et al., 1996; Landry et al., 1997;Lee et al., 1997; Parmantier et al., 1997; Peyron et al., 1997), CNP is present in the nervous system early in mammalian development, and increased expression coincides with the onset of myelination (Braun et al., 1988; Reynolds and Wilkin, 1988; Jordan et al., 1989; Kanfer et al., 1989; Sprinkle, 1989; Hardy and Reynolds, 1991; Scherer et al., 1994; Yu et al., 1994; Peyron et al., 1997). The muCNP promoter region was chosen to generate Tg mice because CNP expression is localized to cells of the OL and SC lineage in the brain and peripheral nerve, respectively, thus providing a system for analyzing and further manipulating purified myelin-forming cells at various stages of development. We demonstrate that the muCNP-βgeo transgene was useful for identifying and characterizing OL and SC progenitors beginning early in their lineage and for selecting viable OLs and SCs from Tg mouse tissues.
MATERIALS AND METHODS
Construction of the muCNP-βgeo transgene and microinjection of fertilized eggs
All animal procedures were performed according to National Institutes of Health (Bethesda, MD) guidelines. The muCNP-βgeo plasmid was constructed by ligating a 3.7 kbNotI–HindIII fragment containing muCNP-promoters I and II (Gravel et al., 1998), to theNotI–HindIII site of the bacterial β-gal and NPT fusion gene in a KS plasmid (pBKSβgeo), a 4.2 kb reporter gene encoding a protein with both β-gal and NPT activity (a generous gift from Dr. Philippe Soriano; Fred Hutchinson Cancer Research Center, Seattle, WA; Friedrich and Soriano, 1991). An 8 kb muCNP-βgeo fragment (Fig. 1) was excised with SalI and NotI, purified from the prokaryotic portion of the plasmid by a 10–40% (w/v) sucrose gradient, and dialyzed against injection buffer (10 mm Tris-HCl, pH 7.4, 0.1 mm EDTA). Transgenic mice on a [C57BL/6J × C3H] F1 × [C57BL/6J × C3H] F1 background were generated by pronucleus injection of the DNA (2 μg/ml) according to standard protocols (Hogan et al., 1986). Tg founders were bred with either C57BL/6J or [C57BL/6J × C3H] F1 mice, and lines were expanded by mating siblings within each individual line. Three different lines, cgeo1–cgeo3, were expanded and analyzed. Unless specified, the data presented in figures are derived from cgeo1 heterozygotes.
Fig. 1.

Schematic illustration of the muCNP-βgeo construct used to generate Tg mice. The muCNP-βgeo construct was made by ligating the NotI and HindIII fragment of the muCNP promoter region, containing promoters I and II, to theNotI and HindIII sites of the pBKSβgeo reporter gene encoding a protein with both β-gal and neomycin phosphotransferase activity. The regions to which primers were made for the reverse transcription-PCR are marked withblack (upstream) and white (downstream)arrowheads. The internal splice acceptor (ISA) and the ATG translational start sites are indicated. pI, muCNP promoter I; pII, muCNP promoter II.
Tg DNA analysis
Tail DNA was isolated according to standard protocols (Hogan et al., 1986). For Southern blotting, 10 μg of DNA was digested for 24 hr at 37°C with 50 U of EcoRI (New England Biolabs, Beverly, MA), and fragments were separated on 0.8% agarose gels and transferred to Biodyne membranes (Life Technologies, Grand Island, NY). Membranes were UV cross-linked and, after preincubation in hybridization buffer (5× SSPE, 50% formamide, 5× Denhardt’s solution, and 1% SDS), were incubated with hybridization solution containing 100 μg/ml salmon sperm DNA (5 Prime → 3 Prime, Inc., Boulder, CO) and 106 counts/ml 32P random prime-radiolabeled βgeo probe. Subsequently, blots were washed and analyzed on a PhosphorImager (Molecular Dynamics, Sunnyvale, CA). The βgeo random prime probe was generated by cutting pBKSβgeo withEcoRI and EcoRV and isolating and radioactively labeling the 1.8 kb βgeo fragment.
To estimate Tg copy numbers, 10 μg of genomic DNA from each line and 12 pg (equivalent to about one copy) dilutions of the injected muCNP-βgeo fragment (with non-Tg genomic DNA as a carrier) were loaded onto a filtration manifold system (Life Technologies) and transferred onto a Nytex membrane (Schleicher & Schuell, Keene, NH). Membranes were incubated with 106 counts/ml32P random prime-radiolabeled βgeo probe and washed as described above. The integrated volume values for each band were analyzed on a PhosphorImager (Molecular Dynamics).
PCR was performed on 0.5 μg of tail DNA using the HotStart method (Life Technologies). The following oligonucleotide primers corresponding to the CNP promoter and βgeo regions were used to amplify a 313 bp sequence that was selectively amplified in Tg animals: sense primer, 5′-ATCCTTGGAGCCAGAGACTAAG-3′ (−290 bp/HindIII); antisense primer, 5′-GCCATGTCACAGATCATCAAGC-3′ (+22 bp/HindIII).
PCR reactions were performed for 30 cycles (denatured, 94°C, 30 sec; reannealed, 55°C, 45 sec; extension, 72°C, 1 min) using a final concentration of 0.4 mm primers (Gene Link, Inc., Thornwood, NY), 0.25 mm dNTPs, 1.5 mmMg2+, and 1 U of Taq polymerase (Promega, Madison, WI). Tail DNA from non-Tg mice from the same line and reaction solutions devoid of DNA were run in parallel with experimental samples and served as negative controls, whereas 0.5 ng of the muCNP-βgeo construct was amplified as a positive control. After the PCR reaction, samples were analyzed by electrophoresis on a 1.5% agarose gel.
Reverse transcription-PCR
Total RNA was isolated and processed according to the Tri reagent method (Molecular Research Center, Inc., Cincinnati, OH) described by the manufacturer. The RNA was treated with RQ1 RNase-free DNase (1 U/μl; Promega) and was reverse-transcribed using the SuperScript preamplification system (Life Technologies) according to the manufacturer’s recommended protocol. Subsequently, 0.5 μg of cDNA/tube was PCR-amplified as described above. Parallel samples were prepared in the absence of reverse transcriptase to control for nonspecific DNA amplification. The following primers were used: CNP I sense primer, 5′-GGCTGGCTTTGAGGAGCC-3′; CNP II sense primer, 5′-AAAGGCGGTGACGGCGGTG-3′; CNP I/II antisense primer, 5′-GCCTTCCCGTAGTCACA-3′.
The CNP I and CNP II sense primers were used in combination with the CNPI/II antisense primer to amplify a region of the endogenous CNP I (830 bp) and CNP II (813 bp) coding sequences, respectively. Alternatively, they were used in combination with the antisense primer described above for the DNA analysis to amplify a region specific to the transgenic CNP I-βgeo (83 bp) or CNP II-βgeo (73 bp) coding sequences (Fig. 1). Samples were analyzed on a 2% agarose gel.
Tissue culture
Culture media. Serum-containing media were composed of DMEM (high glucose, 2 mm glutamine, and 110 gm/l pyruvate), 10% heat-inactivated fetal calf serum, and 10 μg/ml gentamycin (Life Technologies). Serum-free DMEM was formulated according to the method of Cohen et al. (1996) and contained 25 μg/ml apo-transferrin (Sigma, St. Louis, MO), 30 nmtriiodothyronine (Calbiochem, San Diego, CA), 20 nmhydrocortisone (Sigma), 20 nm progesterone (Sigma), 10 nm biotin (Sigma), trace element B1(Cellgro; Fisher, Pittsburgh, PA), 30 nm selenium (Sigma), 5 μg/ml insulin (Sigma), 1 μg/ml putrescine (Sigma), 0.1% BSA (Life Technologies), and 10 μg/ml gentamycin. Conditioned media were composed of a 7:3 ratio (v/v) of fresh serum-free media and serum-free media obtained after 3 d incubation with either rat brain astrocytes (Gard et al., 1990) or the B104 neuroblastoma cell line (Bottenstein et al., 1988), respectively. For all cultures and explants, cells were plated onto poly-d-lysine (Sigma; 10 mg/ml)-treated tissue culture dishes (Becton Dickinson, Lincoln Park, NJ), and media were changed every 2 d. Cultures were maintained in a humidified atmosphere (8% C02) at 37°C.
Embryonic OLs. Anesthetized embryonic day 12.5 (E12.5) embryos were killed, and their brains were removed. The rhombencephalon region (see Fig. 4A,inset, blue region) was separated from the rest of the brain and was enzymatically digested at 37°C for 45–60 min in HBSS (Life Technologies) containing 12 U/ml papain (Sigma), 2 mm EDTA, 5.5 mml-cysteine, and 20 mm HEPES, pH 7.4. The tissue was dissociated by trituration and gravity-filtered through a 70 μm Nytex screening mesh (Tetco, Briarcliff, NY). The filtrate was centrifuged at 200 ×g for 10 min, and the pellet was resuspended in serum-free DMEM containing 0.5% heat-inactivated fetal calf serum (Life Technologies), 10 ng/ml recombinant human platelet-derived growth factor-AA (Pepro Tech Inc., Rocky Hill, NJ), and 10 ng/ml recombinant human glial growth factor (GGF; generously supplied by Dr. M. Marchionni, Cambridge Neuroscience, Cambridge, MA). Cells were plated at a density of 6.5 × 10⁵ cells/1.5 ml. After 24 hr, G418 (Life Technologies) was added at a final concentration of 180 μg/ml.
Fig. 4.
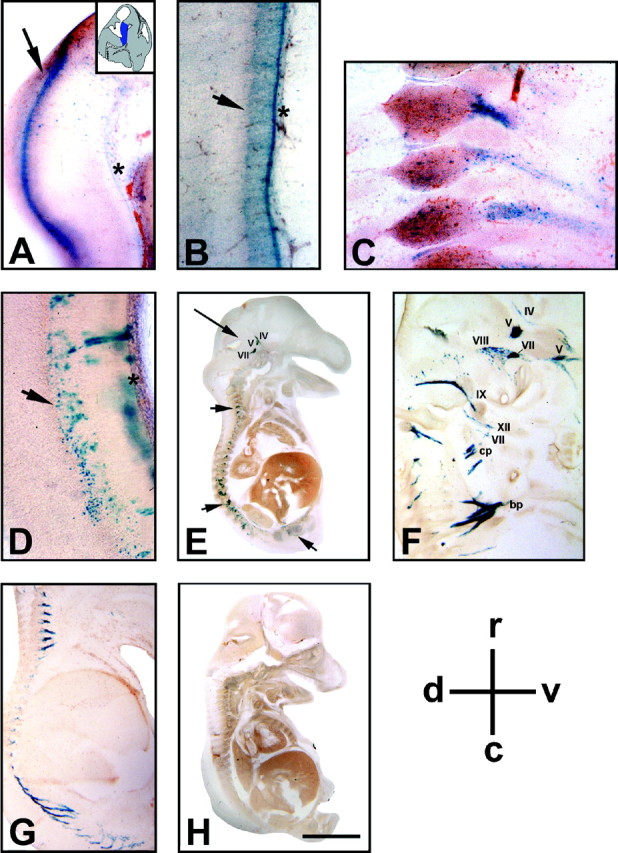
LacZ staining in muCNP-βgeo embryos. A–C, Whole-mount sagittal sections from E12.5 Tg embryos. A, In the brain, β-gal activity was found in the ventral regions of the rhombencephalon (arrow, asterisk; this region corresponds to the blue area depicted in the inset). B, In the spinal cord, lacZ-positive cells were evident in the ventral (arrowhead) and floor plate (asterisk) regions. C, In the PNS, blue cells were present in neural crest cells surrounding and projecting ventrally off the spinal cord ganglia. D–H, Whole-mount sagittal sections from E15 Tg mice. D, Transgene activity was present in the lower thoracic spinal cord in the ventral (arrowhead) and floor plate (asterisk) regions. In the PNS, transgene activity was found in cranial nerves (E, long arrow, F) and peripheral nerve projections (E, arrowheads, F, G).H, Whole-embryo X-gal staining of a non-Tg E15 sibling showed no endogenous β-gal activity. Cranial nerves:V, trigeminal; VII, facial;VIII, vestibulocochlear; IX, glossopharyngeal; XII, hypoglossal. Cervical nerves:bp, brachial plexus; cp, cervical plexus. Sections were 200-μm-thick. Scale bars: A, 350 μm;B, D, 700 μm; C, 250 μm; E, H, 3.0 mm; F, 900 μm; G, 2.0 mm. Similar results were seen in three embryos per time point, each using different mating pairs.
Postnatal OLs. Anesthetized postnatal day 10 (P10) mice were killed, and their brains were removed. The cortices and brainstems were stripped of meninges and gently teased apart using fine forceps. The tissue was digested as described above and was gently triturated 3–10 times every 10–15 min. The suspension was diluted to a total volume of 50 ml with serum-containing media and was gravity-filtered successively through 250, 150, and 75 μm Nytex screening mesh (Tetco). The filtrate was centrifuged at 200 × g for 10 min, and the pellet was resuspended in Ca2+/Mg2+ HBSS for further manipulations. Alternatively, the cell pellet was resuspended in a 1:1 (v/v) solution of serum-containing media and either astrocyte- or B104-conditioned media, at a density of 1.7 × 10⁶ cells/ml, and was seeded (3 ml/dish) onto 60 mm tissue culture dishes (Becton Dickinson, Lincoln Park, NJ). The cell suspension (two brains in 3 ml of HBSS/gradient) was gently overlaid onto 10 ml of a 15% (2 ml)/60% (8 ml) Percoll gradient (Pharmacia, Alameda, CA) in a 15 ml conical tube (Sarstedt, Newton, NC) and centrifuged at 500 × g for 20 min. The interface between the 15 and 60% Percoll layers was collected and diluted with several volumes of plating media. The suspension was centrifuged at 200 × g for 10 min, resuspended, and washed in serum-containing media. The cells were diluted 1:1 (v/v) solution of serum-containing media and either astrocyte- or B104-conditioned media to a density of 1.3 × 10⁶ cells/ml and plated (3 ml/dish) onto 60 mm dishes. After 24–36 hr cells were grown in astrocyte- or B104-conditioned media supplemented with 1% FCS and 180 μg/ml G418 (Life Technologies). The G418 selection was performed for up to 12 d in culture.
SCs. Sciatic nerves from P10 mice were dissected; the epineurial sheaths were stripped off with fine forceps; and explants were maintained in serum-containing media. Once SCs began migrating off, the explants were transferred to new plates. Cells that had migrated onto the dishes were maintained in DMEM and 5% FCS supplemented with 20 ng/ml GGF (Cambridge Neuroscience) and 2 μm forskolin (Calbiochem, La Jolla, CA) to promote cell division and induce myelin gene expression, respectively (Mirsky et al., 1980; McMorris, 1983; Lemke and Brockes, 1984; Morgan et al., 1991; Marchionni et al., 1993). After 48 hr, 5-bromo-4-chloro-3-indolyl galactopyranoside (X-gal) staining was performed on cultures to confirm transgene activity, and, subsequently, G418 was added. When the G418 was used at a concentration of 180 μg/ml, fibroblast cell death was delayed; therefore, all studies were done using 360 μg/ml antibiotic.
Dissociated cultures of SCs were obtained from sciatic nerves that were minced and incubated in HBSS containing 10 U/ml Papain (Sigma) and 0.03% collagenase (Life Technologies) at 37°C for 30 min. The preparation was centrifuged, and the pellet was resuspended in serum-containing media. The suspension was triturated five times, passed through a 60 μm Nytex filter (Tetco), and centrifuged. The pellet was resuspended in serum-containing media and plated onto a 60-mm-diameter tissue culture dish (Becton Dickinson). Cells were maintained in serum-containing media supplemented with GGF (10 ng/ml) and forskolin (2 μm). Forty-eight hours after plating, 360 μg/ml G418 was added to the cultures.
For all cultures, homozygous Tg males were mated with [C57BL/6J] females, and the DNA from the heterozygous offspring was analyzed by PCR to confirm the presence of the muCNP-βgeo transgene. Unless specified, all analyses were done on cultures exposed to antibiotics for up to 12 d.
Processing of tissue
For in vivo studies, mice were anesthetized and killed, and the tissue was perfused with 4% paraformaldehyde in 10 mm phosphate buffer, pH 7.4. After a 24 hr incubation at 4°C, brains were washed with PBS and sectioned with a Vibratome (Ted Pella Inc., Redding, CA). Alternatively, tissue was saturated with 20% sucrose, mounted in Tissue-Tek mounting–freezing media (Miles, Inc., Elkhart, IN), and sectioned using a cryostat (Leica, Deerfield, IL).
For in vitro studies, tissue from mouse brains and sciatic nerves were cultured and subsequently fixed with 4% paraformaldehyde in PBS for 30 min at 4°C before experimental assays.
β-Gal substrate staining
DetectaGene Green staining was performed as recommended by the manufacturer (Molecular Probes, Eugene, OR). Sections or cultures were pretreated with 1 mm chloroquine to inhibit endogenous lysosomal β-gal activity. Subsequently, samples were incubated with 100 μm DetectaGene Green substrate reagent [5-chloromethylfluorescein di-β-d-galacto-pyranoside (CMFDG)], a green fluorogenic β-gal substrate that reacts with intracellular glutathione. The CMFDG-glutathione adduct is subsequently converted by β-gal to a fluorescent product that does not readily cross cellular membranes. After a 1 hr incubation at 37°C, further β-gal activity was inhibited by the addition of 1 mmphenylethyl β-d-thio-galacto pyranoside, a competitive inhibitor of β-gal. Incubation of tissue from non-Tg siblings served as negative controls.
For X-gal staining, fixed sections or cultures were permeabilized with 2 mm MgCl, 0.01% sodium deoxycholate, and 0.02% NP-40. Subsequently, samples were incubated in staining solution, pH 7.0 [0.15 m NaCl, 10 mmNa2HPO4, 17.5 mmK3Fe(CN)6, 17.5 mmK4Fe(CN)6, 2 mm MgCl, 0.01% sodium deoxycholate, and 0.02% NP-40] containing 0.05% X-gal (Promega) for between 2 and 24 hr.
Immunochemistry
For immunostaining procedures, fixed sections or cultures were permeabilized with 0.5% Triton X-100 and blocked with diluent (10% lamb serum, 10% calf serum, and 0.1% sodium azide in PBS). Sections or cultures were incubated overnight at 4°C with the following antibodies: β-gal (rabbit polyclonal Ig, 1:200; 5 Prime → 3 Prime), CNP (mouse monoclonal IgG1, 1:400; Sternberger Monoclonals Inc., Baltimore, MD), glial fibrillary acidic protein (GFAP; mouse monoclonal IgG1, 1:400; Sigma), neuron-specific enolase (NSE; rabbit polyclonal Ig, 1:10,000; Polysciences, Inc., Warrington, PA), and S-100 (rabbit polyclonal, 1:250; Dako, Glostrup, Denmark). For live staining, cells were incubated with 1 μg/ml affinity-purified A2B5 (mouse monoclonal IgM; American Type Culture Collection, Rockville, MD) or O1 (mouse monoclonal IgM; a gift from Dr. S. Pfeiffer, University of Connecticut, Farmington, CT; Sommer and Schachner, 1981) for 20 min at 37°C. For fluorescent detection of primary antibodies, the secondary antibodies (Southern Biotechnology, Birmingham, AL) goat anti-rabbit IgG fluorescein isothiocyanate (for β-gal), goat anti-mouse IgG1 tetramethylrhodamine isothiocyanate (TRITC, for CNP and GFAP), goat anti-rabbit IgG TRITC (for NSE and S100), and goat anti-mouse IgM μ-chain TRITC (for A2B5 or O1) were used at a dilution of 1:200.
For bright-field immunodetection, endogenous peroxidase activity was quenched with 0.3% H2O2 (Sigma). Subsequently, sections or cultures were incubated with CNP (mouse monoclonal IgG1, 1:200; Sternberger Monoclonals) or ED1 (mouse monoclonal IgG1, 1:1000; Serotec, Raleigh, NC) antibodies in 3% BSA, followed by incubation with biotinylated secondary antibody (Vectastain ABC Elite kit; Vector Laboratories, Burlingame, CA), ABC reagent, and peroxidase diaminobenzidine substrate solution (Polysciences).
For all immunostaining, cell nuclei were stained with 4,6-diamidino-2-phenylindole (DAPI, 1:10,000 dilution; Sigma) in 1× PBS. Negative controls for each experimental condition consisted of appropriate dilutions of secondary antibodies alone. Representative photographs reflect the results obtained from at least three independent experiments in the cgeo1 and cgeo3 Tg lines.
Western analyses
Mice were killed under deep anesthesia by transcardiac perfusion of saline for 5 min to flush out blood from tissue. Organs were homogenized in 20 mm phosphate, pH 7.6, supplemented with 0.1% SDS, NP-40, and Triton X-100 and Complete protease inhibitors (Boehringer Mannheim, Indianapolis, IN).
For Western blot analysis, the indicated amount of protein for each tissue or cell type examined was resolved by SDS-PAGE analysis on 10% NuPage gels (Novex, San Diego, CA) and electroblotted at 30 V for 2 hr (Novex) or overnight at 4°C (Bio-Rad, Cambridge, MA) onto nitrocellulose (Micron Separations Inc., Westborough, MA). After the transfer, gels were stained with Ponceau S solution (Sigma) as a control for protein transfer. Membranes were placed in heat-sealed polyethylene bags and blocked for 1 hr at 37°C with 1% (w/v) Hammarsten-grade casein (BDH Chemicals Ltd., Poole, England) in PBS and 0.05% Tween 20 (blocking solution) and subsequently washed with PBS and 0.05% Tween 20 (TPBS). Next, the primary antibodies β-gal (mouse monoclonal IgG2A, 1:1000; Promega), NPT II (rabbit polyclonal IgG, 1:500; 5 Prime → 3 Prime), and CNP (mouse monoclonal IgG1, 1:10,000; Sternberger Monoclonals) were diluted in staining solution (0.5% casein in TPBS) and added to the nitrocellulose membranes. Blots were then incubated overnight at 4°C on an orbital shaker and washed the following day. The secondary antibody, donkey anti-rabbit (for NPT II) or mouse (for β-gal and CNP) coupled to horseradish peroxidase (Jackson ImmunoResearch, West Grove, PA), was diluted 1:10,000 in staining solution and incubated with the membranes for 1–2 hr at room temperature. The blots were washed once for 15 min and four times for 5 min each in PBS before 1 min incubation with an enhanced luminol solution (SuperSignal System; Pierce, Rockford, IL). Then the blots were quickly dried, exposed to x-ray film, and processed in an Eastman Kodak (Rochester, NY) automatic developer.
RESULTS
Establishment of the muCNP-βgeo transgenic lines
The muCNP-βgeo construct that was microinjected into the pronuclei of fertilized eggs used the CNP promoters I and II to drive expression of a β-gal and neomycin resistance (NPT) fusion protein (Fig. 1). Transcripts originating from CNP promoter I of this construct would encode a protein in which the βgeo initiation codon was used, whereas transcripts originating from the CNP II promoter would initiate translation in exon 0 and therefore contain nine amino acids of CNP fused in frame with βgeo.
Quantitative Southern blotting was used to identify variations in the site of transgene integration and genotype (Fig.2A–C). The integrated volume for the 6 kb Tg radioactive band (Fig. 2A) for each sample was divided by the integrated volume value for the total amount of DNA in the lane (Fig. 2B, ethidium bromide staining), and the resulting ratios were plotted (Fig. 2C). Genotype determination was first made by comparing values for the heterozygous (Fig. 2A, single asterisk) parents to that for their offspring (Fig. 2A, F2 generation). Next, putative homozygous (Fig. 2A, double asterisks) mice were mated with wild-type animals to confirm their genotype. Three stable lines bearing ∼6 (cgeo1), 20 (cgeo2), and 50 (cgeo3) copies of the transgene (see Materials and Methods for copy number determination), respectively, were independently bred and routinely screened for the presence of muCNP-βgeo by PCR analysis of genomic tail DNA (see Materials and Methods). β-gal expression was less robust in cgeo3 compared with cgeo1 (data not shown), indicating that in our system there was no direct correlation between copy number and transgene expression. Within all three lines, Tg animals were fertile and appeared normal throughout their development.
Fig. 2.

Southern blot analysis of the cgeo 1 Tg line.A, PhosphorImager analysis ofEcoRI-digested genomic DNA (stained with ethidium bromide B). EcoRI cut the transgene twice, producing a 6 kb band in Tg that was not detected in non-Tg mice, using the βgeo probe. One asterisk indicates heterozygous; two asterisks indicate homozygous, and the absence of asterisks indicates a non-Tg sibling. F0, founder; F1, F1 generation; F2, F2 generation. C, The integrated volume for the 6 kb Tg radioactive band for each sample was divided by the integrated volume value for the total DNA in the lane, and the resulting ratios were plotted. D, Total RNA was extracted from the brains of P21 Tg mice or non-Tg littermates, and the level of expression of CNP I, CNP II, CNP I-βgeo, or CNP II-βgeo was analyzed by reverse nscription-PCR. The endogenous CNP I and CNP II sequences were amplified in both the Tg and non-Tg samples, as shown by a positive band at ∼800 bp. By contrast, the CNP I-βgeo (83 bp) and CNP II-βgeo (73 bp) sequences were present only in Tg mice. Reactions run in the absence of reverse transcriptase (−RT) showed no amplified band.
muCNP-βgeo promoter efficacy and tissue-specific expression of the βgeo protein
Total RNA from P21 mouse brain was reverse-transcribed and analyzed by PCR to determine the transcriptional efficacy of the CNP promoter region. Using primers to amplify part of the endogenous CNP I or CNP II coding sequences, bands at the correct size (∼800 bp) were present in both the non-Tg and Tg tissue (Fig. 2D). In the presence of primers specific for the transgene coding sequence (Fig. 1), a band of the correct size for both CNP I-βgeo (83 bp) and CNP II-βgeo (73 bp) was amplified only in the transgenic samples and only in the presence of reverse transcriptase (Fig.2D). These results provide evidence that both the CNP I and CNP II promoters were capable of driving the transcription of the βgeo fusion gene.
X-gal staining of freshly isolated protein from P55 Tg and non-Tg control tissue (Fig. 3A) demonstrated transgene activity in the brain, spinal cord, sciatic nerve, and thymus in Tg mice. P21 mice were examined by Western blotting to determine whether muCNP-βgeo drives the translation of the βgeo fusion gene in Tg animals. Using antibodies raised against either β-gal or NPT II (neomycin resistance; Fig. 3B), a doublet at the estimated size for the βgeo fusion protein (150 kDa) was observed only in Tg animals and was absent from control spinal cord. Similar results were observed in three independent preparations (results not shown), suggesting that these bands arose from the transcriptional activity of promoters I and II. Alternatively, these findings could reflect distinct modifications of one of the protein species or protein degradation.
Fig. 3.

Immunoblot analyses on tissue from Tg and non-Tg mice. A, Total protein (700 μg) was transferred from a P55 Tg mouse to a nylon membrane and incubated with X-Gal. The brain, spinal cord, sciatic nerve, and thymus showed greatly increased β-gal activity compared with the same tissue from non-Tg siblings.B, To examine the presence of the βgeo fusion protein in Tg animals, 12 μg of total protein from P21 Tg or non-Tg sibling animals was resolved on a 7.5% acrylamide gel, electrotransferred, and probed for both β-gal and NPT II. The blots were processed for chemiluminescent detection and exposed to film for 10 min. Using either β-gal or NPT II antibodies, immunoreactive bands, corresponding to the appropriate size for the βgeo fusion protein (∼150 kDa), were found only in Tg spinal cord and were absent from control tissue.C, When blots were probed for CNP, protein levels were similar in both Tg and control mouse tissues. Blots were exposed for 10 sec (brain, spinal cord, and sciatic nerve) and 1 hr (testis, kidney, spleen, liver, heart, lung, and thymus). Horizontal arrows delineate approximate molecular weights.C, Non-Tg littermate control; ScN, sciatic nerve; SpC, spinal cord. Similar results were observed in four independent experiments.
Genomic integration and expression of the muCNP-βgeo transgene did not appear to alter the levels of CNP protein in any of the tissues examined. Similar patterns of expression of the 46 and 48 kDa species were observed in both Tg and control tissues (Fig. 3C). Both the CNP I-immunoreactive (46 kDa) and CNP II-immunoreactive (48 kDa) species were found in the brain, spinal cord, and sciatic nerve. Moreover, consistent with reports of CNP expression in the non-neural tissues thymus and testis (Bernier et al., 1987; Vogel and Thompson, 1988; Sprinkle, 1989; Scherer et al., 1994), a band migrating around that of CNP I (46 kDa) was observed in these tissues as well as in spleen, lung, and liver (Fig. 3C). However, excluding the spleen, protein levels were considerably lower than in the brain or peripheral nerve. A smaller immunoreactive band (<46 kDa) was also present in these tissues that could reflect degradation, a product with distinct post-translational modifications, or nonspecific cross-reactivity.
Of the three transgenic muCNP-βgeo lines, cgeo1 expressed the transgene at the highest level and, consequently, was expanded for further study. However, the developmental and tissue-specific expression of βgeo was similar in all three lines.
Tagging oligodendrocytes and Schwann cells with the β-galactosidase reporter
muCNP-βgeo β-gal activity was observed early during development. In sagittal sections of E12.5 mice,lacZ-positive cells were observed in the CNS. Two distinct columns of blue cells were evident in the ventral region of the rhombencephalon (Fig. 4A, arrow, asterisk; A corresponds to the highlighted, blue, region in the inset). A band of transgene-positive cells continued caudally along the region of the ventral spinal cord (Fig. 4B, arrowhead) and floor plate (Fig. 4B, asterisk), with additional blue cells scattered in the ventral mantal layer. Blue staining present around the floor plate region (Fig. 4B,D, asterisk) may represent radial glial projections (Kurtz et al., 1994). SeverallacZ-positive cells were also present in the telencephalon, adjacent to the third ventricle (results not shown). In the PNS, transgene activity was present predominantly in ventral projections of the spinal cord ganglia (Fig. 4C).
At E15, in the CNS strong lacZ staining was observed in cells within the ventral spinal cord (Fig. 4D, arrowhead) and around the floor plate (Fig. 4D, asterisk) at the level of the lower thoracic (Fig.4D), lumbar, and sacral spinal cord. Minimal transgene activity was detected in the cervical spinal cord or in higher cortical regions (results not shown). In the PNS, β-gal activity was observed throughout the rostral to caudal extent of the spinal cord in peripheral nerve fibers projecting both dorsally and ventrally (Fig. 4E, arrowheads, F,G) and in cranial nerve projections (Fig. 4E, arrow, F). At both E12.5 and E15, lacZ-positive cells were also observed in cells within the intercostal nerves, liver, inner ear, adrenal medulla, and eye (results not shown). Staining was absent from non-Tg littermates at the same age (Fig. 4H).
Immunohistochemical studies were performed on P21 mice to characterize the cellular distribution of β-gal staining throughout the postnatal brain (Figs. 5, 6) and sciatic nerve (Fig. 7). For all immunochemistry, staining was absent from negative controls in which the primary antibody was omitted. Coronal sections of the CNS showed robust lacZ staining in white matter tracts of the cortex (Fig. 5A), brainstem (Fig. 5B), and cerebellum (Fig. 5B) that was indistinguishable from CNP expression patterns (Trapp et al., 1988; Vogel and Thompson, 1988). Moreover, robust β-gal activity was present in white matter tracts of 13-month-old Tg animals from each line (results not shown), the latest time point examined. Higher-power magnification of the cortical region shown in Figure 5A confirmed lacZ-positive cells (blue) in CNP-positive (brown) OLs (Fig.5C,D). Double immunostaining with CNP (Fig. 5E) and bacterial β-gal (Fig. 5F) antibodies demonstrated the co-localization of these antigens to individual OLs (arrow, arrowhead).
Fig. 5.
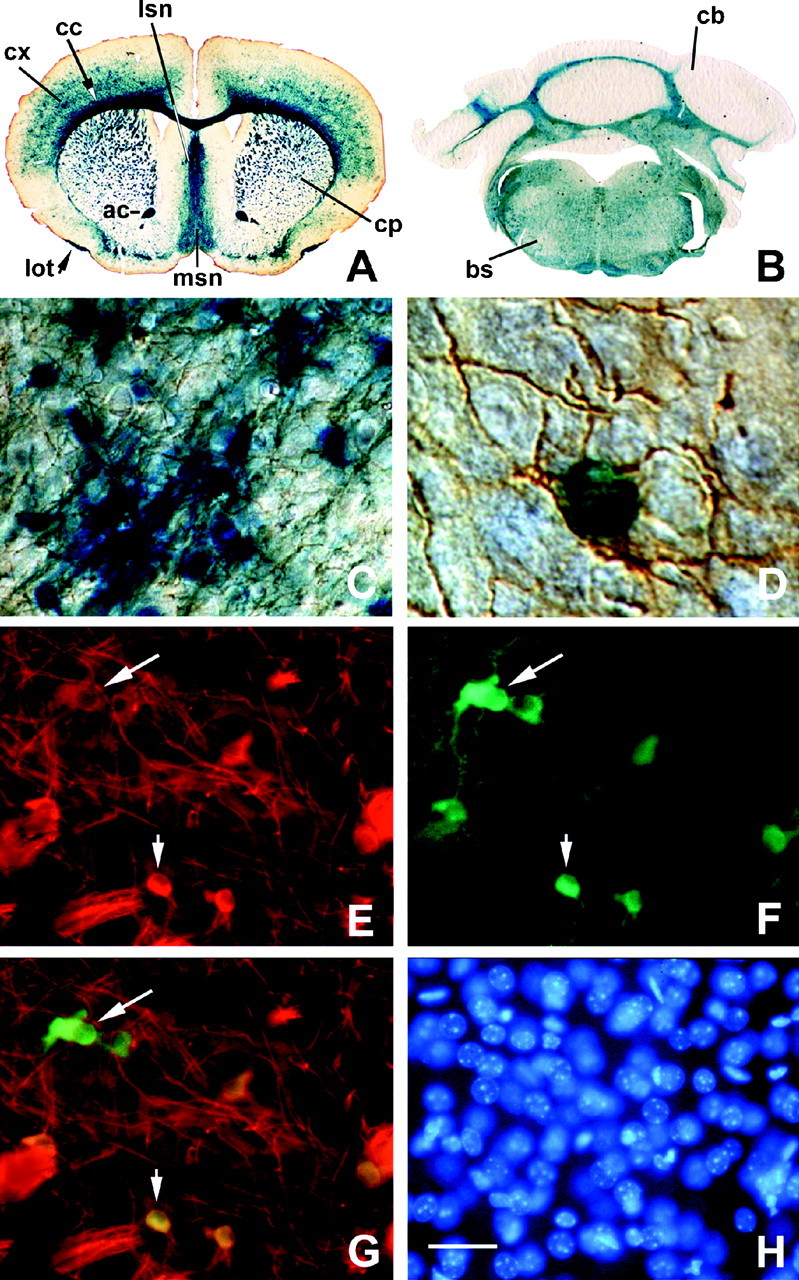
Tg β-gal staining in oligodendrocytes in vivo. X-gal staining (blue) of 40-μm-thick coronal sections from cortex (A), brainstem (B), and cerebellum of a P21 mouse showed β-gal activity throughout CNS white matter tracts. Higher-power magnifications of muCNP-βgeo promoter activity in the cortex (C) and in an individual cell (D) demonstrated that β-gal activity (blue) was localized to CNP-positive (brown) OLs. Note that the cell bodies and arborized processes of the CNP- and X-gal-positive cells are characteristic of OLs. Indirect immunofluorescence of a section double-labeled with CNP-specific (E) and β-gal-specific (F) antibodies demonstrated co-localization of these two antigens within the same cells (arrow, arrowhead). G, Overlay of the β-gal and CNP double immunostaining shown in E and F.H, DAPI staining of the individual cell nuclei in the section shown in E–G. Scale bars: A, 1.6 mm; B, 800 μm; C, E–H, 40 μm; D, 10 μm. ac, Anterior commissure; bs, brainstem; cb, cerebellum; cc, corpus callosum; cp, caudate putamen; cx, cortex; lot, lateral olfactory tract; lsn, lateral septal nucleus;msn, medial septal nucleus. Similar results were seen in five independent preparations.
Fig. 6.
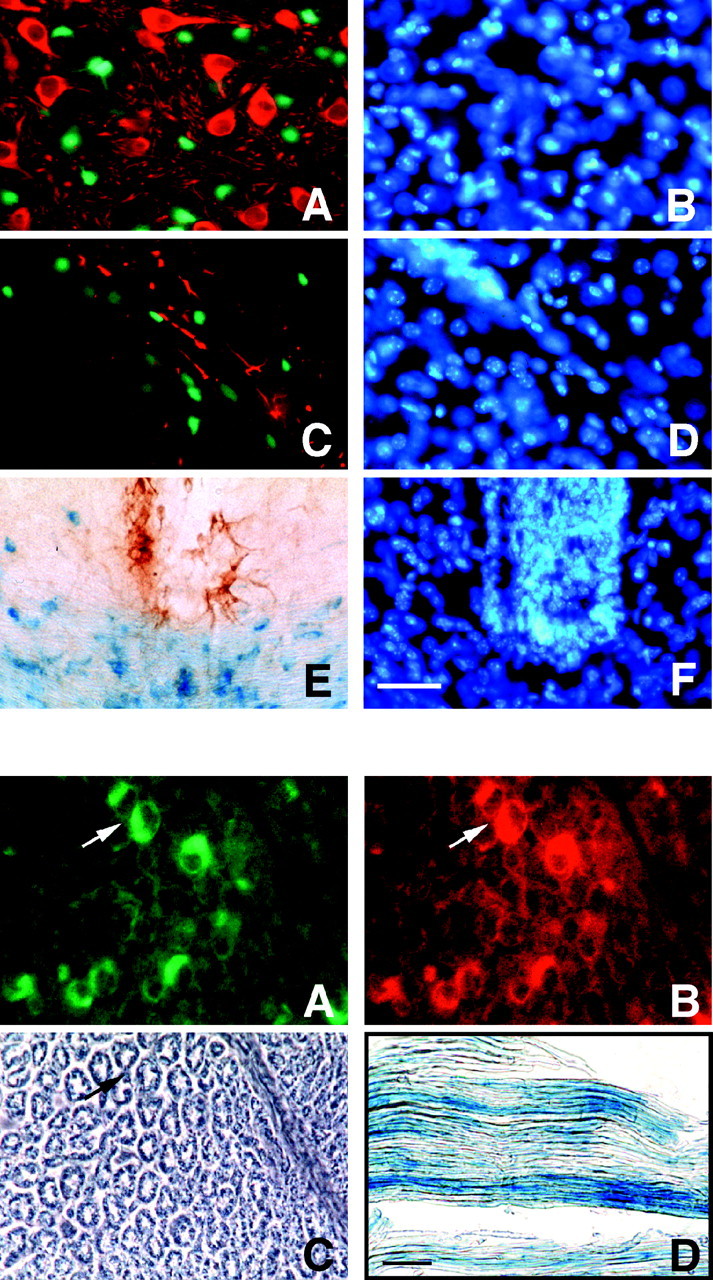
Tg β-gal activity in neurons, astrocytes, and microglia in vivo. Forty-micrometer-thick coronal sections from the brains of P21 mice were double-stained with either the β-gal substrate CMFDG or X-gal and NSE, GFAP, or ED1-specific antibodies. CMFDG (A, C, fluorescent green) orlacZ (E, blue) staining did not co-localize to (A) NSE-positive neurons (A, fluorescent red), GFAP-positive astrocytes (C, fluorescent red), or ED1-positive microglia or monocytes (brown) in the cerebrum. B, D, F, DAPI staining (fluorescent blue) of individual cell nuclei in A, C, and D, respectively. Top, Dorsal; bottom, ventral. A, B, Caudate putamen; C, D, corpus callosum; E, F, brainstem just below fourth ventricle. Scale bar, 50 μm. Similar results were seen in five independent preparations.
Fig. 7.
Double immunostaining of a transverse section from a Tg postnatal 2 month sciatic nerve (10-μm-thick section) demonstrating β-gal-positive (A) and S-100-positive (B) SCs (e.g., seearrow in A–C). C, Phase-contrast photomicrograph of corresponding field shown inA and B. D, Longitudinal section from a P17 sciatic nerve demonstrating β-gal activity along the length of a Schwann cell internode (20-μm-thick section). Scale bar: A–C, 30 μm; D, 50 μm. Similar results were seen in three independent preparations.
Double immunostaining of P21 brain sections with neuron-specific (NSE; Fig. 6A), astrocytic (GFAP; Fig. 6C), or microglial-specific (ED1; Fig.6E) markers showed no co-localization with the β-gal substrates CMFDG (Fig. 6A,C) and X-gal (Fig.6E) in the CNS. DAPI staining of cell nuclei in each field was used to identify individual cells (Fig.6B,D,F).
In P17 (Fig. 7D) and P2 month (Fig. 7A–C) sciatic nerve, β-gal immunoreactivity (Fig.7A) and transgene activity (Fig. 7D) were localized to S-100-positive (Fig. 7B) SCs and were not present in Thy 1.1-positive fibroblasts (results not shown). Staining was observed along the length of the Schwann cell internode (Fig. 7D).
The half-life of the β-gal enzyme varies depending on the cell type in which it is expressed and the nature of the amino acid at the N terminus of β-gal and, in vivo, has been reported to range from 3 min to 20 hr (Bachmair et al., 1986). At P10, when both CNP I and II are expressed (Scherer et al., 1994) and the muCNP-βgeo transgene was strongly expressed in vivo, there was a rapid decrease in β-gal expression in SCs within 12 hr after they were removed from the animal. These results indicate that in our model the β-gal turnover was relatively rapid and that the muCNP-βgeo expression patterns reported corresponded well to promoter activity.
The different levels of CNP expression observed between individual OLs (Fig. 5E, arrow vs arrowhead) or SCs (Fig. 7) could reflect spatial differences in the distribution of CNP within individual cells that are evident depending on the plane of view of the section. Alternatively, these differences could represent heterogeneity in the OL or SC phenotype. β-Gal immunoreactivity, however, was present in all CNP-positive (for OLs) or S-100-positive (for SC) cell bodies identified within each field.
Selecting oligodendrocytes with the neomycin phosphotransferase reporter
A strong band of transgene-positive cells was detected in the rhombencephalon at E12.5 (Fig. 4A, inset, blue area); therefore, cells were isolated from this brain region and developmental stage and cultured in serum-free DMEM containing GGF and PDGF to determine whether they would differentiate into OLs (Fig.8). After 3 d in culture transgene-positive cells were identified (Fig. 8A,B), and after 9 d exposure to G418, most of the viable cells werelacZ-positive (Fig. 8C,D) or β-gal-positive (Fig. 8E,G). Double immunostaining demonstrated the presence of β-gal-positive cells that were A2B5-negative (arrow, Fig.8E,F, arrows) or cells characterized by a more rounded soma that were A2B5-positive (Fig. 8E,F, arrowheads). Further characterization showed the presence of more differentiated β-gal- and O1-positive OLs (Fig. 8G,H, arrows). All lacZ-negative or A2B5 single-positive cells appeared to be dead or dying as determined by their round, phase-bright appearance or negative DAPI stain (Fig. 8C–F, arrowheads and top right). When cultures were grown in the presence of neural basal media or serum-containing media alone, no transgene-positive cells were detected (data not shown).
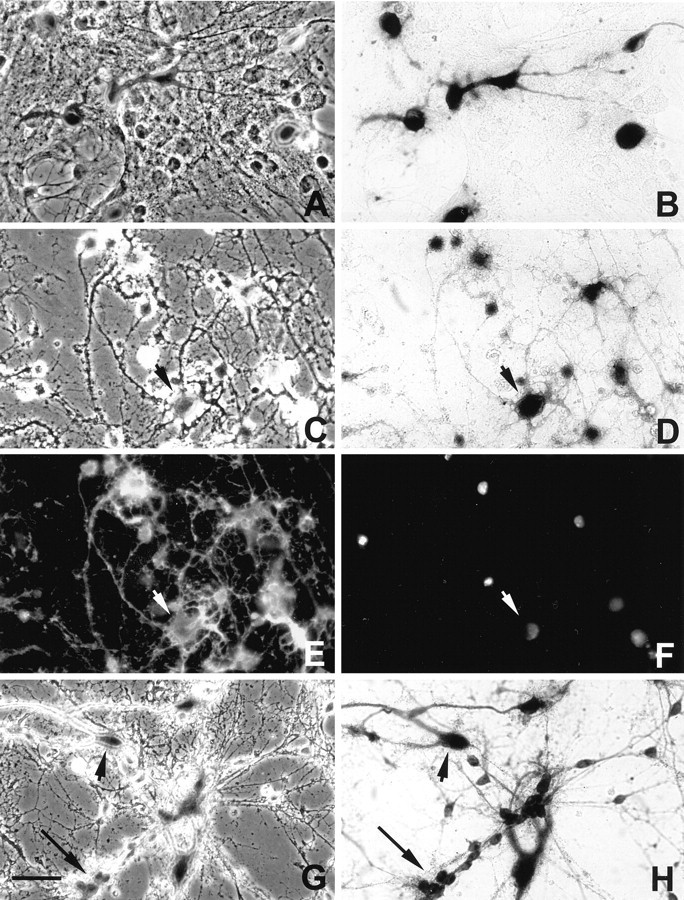
Fig. 8.
In vitro selection and antigenic characterization of transgene positive-cells from E12.5 rhombencephalon. A, B, Phase-contrast (A) and corresponding bright-field (B) photomicrographs of dissociated rhombencephalon cultures showing lacZ-positive staining (arrow) after 3 d in culture and 48 hr exposure to G418. C, D, Phase-contrast (C) and corresponding bright-field (D) photomicrographs of cells taken after 9 d exposure to G418, demonstrating that most of the surviving cells were β-gal-positive. Transgene-negative cells were round and phase-bright in appearance (C, D, arrowheads), and many lacked an identifiable cell nucleus (red cells; E, F, top right). Double immunostaining showed that (E) β-gal-positive cells were A2B5-negative (E, green cells, arrow) or A2B5-positive (E, yellow, arrowheads). Additionally, many cells were positive for both β-gal and O1 (G, yellow fluorescence). F, H, DAPI staining of the individual cell nuclei shown in E andG, respectively. Scale bar: A, B, E–J, 50 μm; C, D, 90 μm. Similar results were seen in two independent preparations.
The activity of the NPT portion of the βgeo fusion protein was also examined by culturing mixed cells obtained from P10 mouse brains in the presence of the antibiotic G418. Cells from the CNS were grown in the presence of either B104 or astrocyte-conditioned media. Within 24–36 hr after plating, 180 μg/ml G418 was added, and cell survival was assayed. In non-Tg mouse cultures, within 3 d of exposure to the antibiotic there was extensive cell death, and after 8 d there was no cell survival. In muCNP-βgeo mice, β-gal-positive cells (Fig.9A,B) were present among the adhering heterogeneous population. The total number of OLs or other cell types were added from 15 random fields at various times after the addition of 180 μg/ml G418 (Table 1). Sister cultures were fixed and stained with X-gal or anti-CNP antibody to assess transgene activity and OL morphology, respectively, for cell counts. Before the addition of G418, it was difficult to discern individual OLs because of the large number of other cell types in the dish (>70%); therefore, cell counts were not done in the absence of antibiotics. However, after 4 d of G418 treatment, OLs could be clearly distinguished from other cell types, and cell counts were obtained.
Fig. 9.
In vitro selection of transgene-positive oligodendrocytes in P10 Tg mice. A,B, Phase-contrast (A) and corresponding bright-field (B) photomicrographs of dissociated brain cultures 24 hr after plating. The heterogeneous cellular fraction contained lacZ-positive cells (blue) that were round to spindle-shaped cells and contained few extended processes. After 12 d exposure to 180 μg/ml G418, surviving cells were positive for bothlacZ (C, phase-contrast;D, bright-field) and, using indirect immunfluorescent microscopy, CNP (E). F, DAPI staining of individual nuclei within the same field asC–E confirmed cell number. In the presence of B104-conditioned media, many cells contained multipolar processes (C–F, arrowheads). G, H, Phase-contrast (G) and bright-field (H) G418-selected cultures grown in the presence of astrocyte-conditioned media contained β-gal-positive progenitor cells (arrow) with bipolar processes and more differentiated cells (arrowhead). Scale bar, 50 μm. Similar results were seen in six independent preparations.
Table 1.
In vitro G418 selection of oligodendrocytes
| 4–5 d | 7 d | 9 d | 12 d | |||||||||
|---|---|---|---|---|---|---|---|---|---|---|---|---|
| #OL | # Other | % Other | # OL | # Other | % Other | # OL | #Other | % Other | # OL | # Other | % Other | |
| ACM | 134 | 63 | 32.0 | 165 | 11 | 6.3 | 155 | 3 | 1.9 | 279 | 2 | 0.7 |
| 1911-a | 541-a | 22.01-a | 1551-a | 121-a | 7.21-a | 4581-a | 31-a | 0.71-a | 6001-a | 21-a | 0.31-a | |
| B104 | 199 | 108 | 35.2 | – | – | – | 204 | 6 | 2.9 | 201 | 0 | 0 |
| 166 | 105 | 38.7 | – | – | – | 180 | 6 | 3.2 | 184 | 2 | 1.1 | |
The total number of OLs or other cell types were added from 15 random fields (200× magnification), 4–5, 7, 9, and 12 d after exposure to 180 μg/ml G418. The results are from two independent tissue culture preparations from cells grown in either astrocyte- or B104-conditioned media, respectively. Note that there was a significant decrease in the number of non-OL cell types that survived over time. ACM, Astrocyte-conditioned media;
, total cell numbers; %, percent of total; –, no data.
Data are from cells that were filtered (as described in Materials and Methods) and directly plated. All other data are from cells that were collected from a Percoll gradient before plating.
Cells that were collected from a Percoll gradient (refer to Materials and Methods) and grown in B104-conditioned media were analyzed quantitatively, and the total number of OLs did not significantly change after 12 d of exposure to G418 (Table 1, B104). By contrast, within 4–5 d after exposure to the antibiotic, there was a significant (p < 0.001) decrease in the number of other cells types in the dish. At 12 d of exposure to G418, cultures were fixed and stained, and 99% of the surviving cells were both β-gal-positive (Fig. 9C,D) and CNP-positive (Fig.9E) OLs (arrowhead). DAPI staining (Fig.9F) of individual nuclei confirmed cell numbers.
Cells grown in astrocyte-conditioned media and G418 were analyzed quantitatively. In preparations in which cells were plated directly after filtering (refer to Materials and Methods), the total number of OLs dramatically increased over time (Table 1, ACM, a). The morphology of surviving OLs varied from round bipolar “progenitor-like” cells (Fig. 9G,H, arrow) to more differentiated cells containing multipolar arborized processes (Fig.9G,H, arrowhead). In preparations that were collected from a Percoll gradient, there was a significant increase in the number of OLs 12 d after the addition of the antibiotic. However, OL cell numbers were lower than in the preparations in which cells were plated directly after filtering (Table 1). Under both conditions, within 7 d there was a significant (p < 0.001) decrease in the number of cells that were not OLs. In all preparations, cultures were fixed and stained after 12 d of exposure to G418, and only between 0 and 1.4% (Table 1) of the surviving cells were β-gal- and CNP-negative.
Conditioned media from B104 neuroblastoma cells or rat astrocytes stimulates cell division in OL progenitor cells (Botten- stein et al., 1988; Gard et al., 1990, 1995). However, in preparations that were run through a Percoll gradient, B104-conditioned media did not significantly increase the number of OLs (Table 1). Moreover, in astrocyte-conditioned media, after antibiotic selection there were many more progenitor cells in preparations that were filtered compared with those that were subsequently run through a Percoll gradient (Table 1). Because Percoll separates cells based on their density, this step may have preferentially selected for the more buoyant, differentiated OLs (Maric et al., 1997). Moreover, increased numbers of OLs may be generated more efficiently by using younger animals, because at P10 cells begin to differentiate, and once placedin vitro, many may not respond to mitogens as robustly as in earlier stages of development.
When OL cultures were exposed to G418, there was substantial astrocytic cell death and a dramatic increase in cellular debris. Rinsing the dishes several times every 2 d during feedings eliminated debris. In preparations in which cells were plated directly after filtration, initially there was relatively more debris compared with the Percoll preparations. However, over time cellular debris was washed away with media changes, and both progenitor and more differentiated cells were present after G418 selection. Thus, filtration and selection alone were sufficient to generate pure populations of OLs. In preparations of optic nerve OLs (K. J. Chandross, R. I. Cohen, and L. D. Hudson, unpublished observations) and sciatic nerve SCs there was minimal debris, and dying cells were easily removed when the media were replaced.
Selecting Schwann cells with the neomycin phosphotransferase reporter
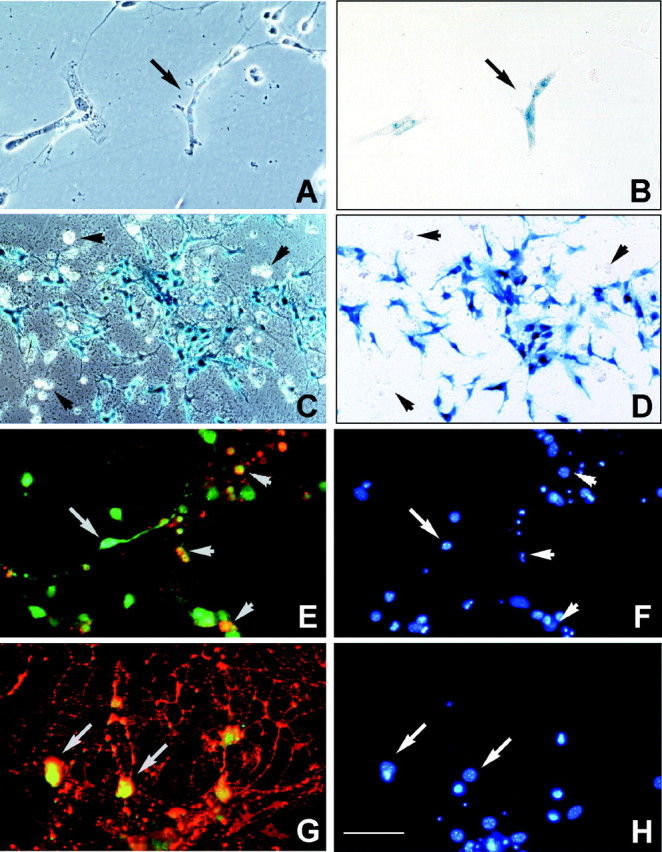
Transgene activity was clearly evident in P10 sciatic nerve (data not shown); however, it was barely detectable in culture once cells migrated off explants and began to dedifferentiate (data not shown). Therefore, after cells began to migrate onto the dish, explants were removed, and the cultures were supplemented with GGF and forskolin. Two waves of SC migration off the explants were analyzed (Table2), the first occurring within 1 week and the second within 2 weeks after dissection. Within 48 hr,lacZ-positive cells were detected (data not shown), and G418 was added to the cultures (Fig.10A). Before the addition of antibiotics, cultures consisted of between 48% (Table 2, primary migration) and 23% (Table 2, secondary migration) fibroblasts. In non-Tg cultures all cells died within 8 d of exposure to the antibiotic. In preparations from muCNP-βgeo heterozygous mice, 3 d after the addition of G418, fibroblasts were still present in the cultures (Table 2, Fig. 10B–D); however, in contrast to Schwann cells they were negative for the fluorescent β-gal product CMFDG (Fig. 10B–D, arrow) and S-100 (results not shown). Within 8 d, only 1% of the cells were fibroblasts (Table2). At 12 d of exposure to G418 (Fig.10E–H), cells were fixed and stained, and surviving cells were β-gal-positive (CMFDG, Fig.10F) and S-100-positive (Fig. 10G) SCs. DAPI staining of individual nuclei (Fig.10D,H) confirmed cell numbers. After 12 d, the G418 was removed, and SCs were expanded in the presence of forskolin and GGF. When analyzed after 21 d, surviving cells continued to express the transgene (results not shown), and only 0.2% of the cells were fibroblasts. Moreover, in dissociated SC cultures, within 1 week after adding G418, 99% of the cells were S-100- and β-gal-positive SCs.
Table 2.
In vitro G418 selection of Schwann cells
| 0 d | 3–4 d | 8 d | |||||||
|---|---|---|---|---|---|---|---|---|---|
| # SC | # Fib | % Fib | # SC | # Fib | % Fib | # SC | #Fib | % Fib | |
| Primary | 403 | 366 | 47.6 | 1036 | 244 | 19.1 | 1124 | 16 | 1.4 |
| Secondary | 1506 | 503 | 25.0 | – | – | – | 4497 | 56 | 1.2 |
| 1137 | 307 | 21.3 | 1494 | 65 | 4.2 | 1601 | 18 | 1.1 | |
The total numbers of SCs or fibroblasts were added from 15 random fields (200× magnification), 0, 3–4, 8, and 21 d after exposure to 360 μg/ml G418. The results are from two independent tissue culture preparations. Note that although the number of SCs increased, there was a significant decrease in the number fibroblasts in the dish over time. Fib, Fibroblast; Primary, primary migration off of the explants; Secondary, secondary migration off of the explants;
, total cell numbers; %, percent of total; –, no data.
Fig. 10.
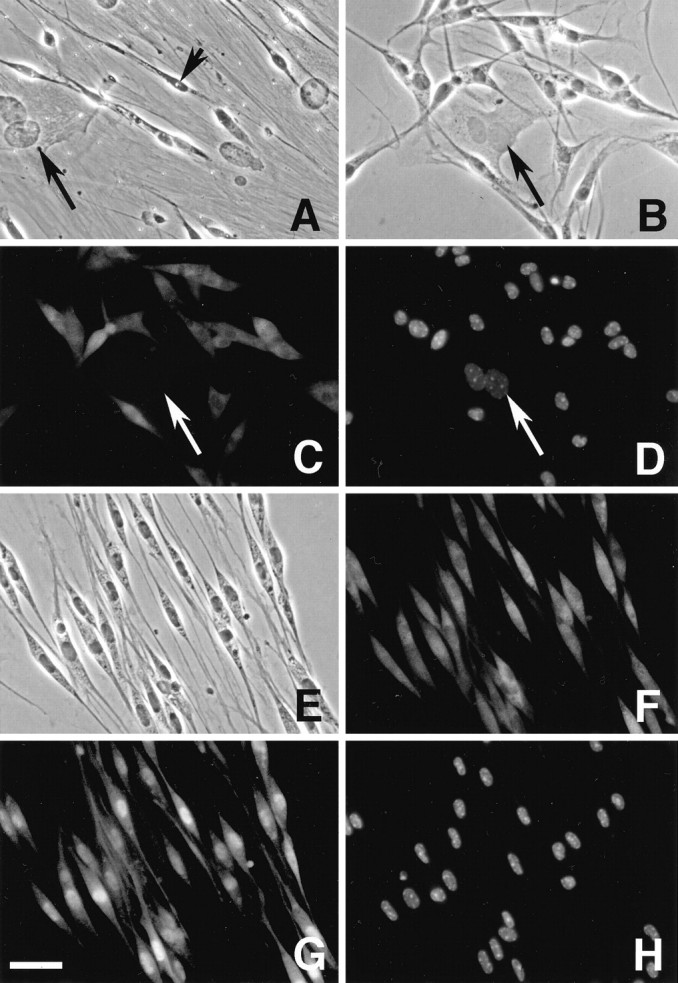
In vitro selection of transgene-positive Schwann cells in P10 muCNP-βgeo mice. (A) Before selection, the phase-contrast photomicrograph shows that cultures contained Schwann cells (arrowhead; spindle-shaped, bipolar cells) and fibroblasts (arrow; flat, multipolar cells).B–D, Within 3 d of exposure to 360 μg/ml G418, SCs were positive, whereas fibroblasts (B–D, arrow) were negative for CMFDG (C). D, The corresponding field from A and B, stained with DAPI, demarcates individual cell nuclei.E–H, At 12 d of exposure to G418 (E, phase-contrast), surviving cells were positive for both CMFDG (F, fluorescent micrograph) and S-100 (G, fluorescent micrograph). H, Corresponding field from E–G, stained with DAPI, demarcates individual cell nuclei. Scale bar, 50 μm. Similar results were seen in three independent preparations.
DISCUSSION
The muCNP promoter effectively drives the expression of a βgeo fusion protein in Tg mice, allowing for the simultaneous detection (β-gal) and selection (neomycin resistance) of OLs and SCs. Our results demonstrate the effectiveness and sensitivity of this system for analyzing glial cell lineage progression, migration, and fate, bothin vitro and in vivo. For example, the transgene-positive cells identified at E12.5 within the ventral rhombencephalon are OL progenitors, as defined by their ability to differentiate into OLs in vitro under selective conditions. Moreover, the data show in general that cell-specific promoters can be used as a powerful tool for the rapid and efficient selection of mouse OL and SC in vitro.
CNP in muCNP-βgeo mice
Transcription of the CNP gene is initiated at two separate promoters; the upstream driving expression of a 2.4 kb CNP II mRNA species and the downstream resulting in transcription of a 2.6 kb CNP I mRNA species (Kurihara et al., 1990). The 2.6 kb transcript encodes a 46 kDa CNP I protein isoform (Monoh et al., 1989; Kurihara et al., 1990; Gravel et al., 1994), whereas the 2.4 kb mRNA can direct the synthesis of both the 46 kDa CNP I and the 48 kDa CNP II protein isoforms (O’Neill et al., 1997). Although CNP I is the most prominent mRNA and protein found in OLs and SCs, CNP II mRNA and protein are also expressed by these cells, and CNP II is the only mRNA isoform characterized to date that has been described in precursor cells (Scherer et al., 1994). Both CNP promoters become increasingly active postnatally, coincident with observed increases in protein expression, the onset of cellular differentiation, and myelination (Braun et al., 1988; Jordan et al., 1989; Sprinkle, 1989; Hardy and Reynolds, 1991;Tsukada and Kurihara, 1992; Scherer et al., 1994).
CNP II is the only mRNA species detected in non-neural tissues (Scherer et al., 1994; Gravel et al., 1998; present study); however, CNP I is the predominant polypeptide identified in these tissues (O’Neill et al., 1997). Myelin gene expression has been reported in immune tissue (Pribyl et al., 1993, 1996; Kuramoto et al., 1997; Kalwy et al., 1998), and consistent with previous reports of CNP expression in the thymus (O’Neill et al., 1997), in muCNP-βgeo Tg mice, lacZ staining was present in the thymus, liver, and spleen. Moreover, in E12.5 and E15 embryos, β-gal activity was detected in the eye, adrenal gland, and liver, indicating a role for CNP outside of the nervous system at early stages of development. These results suggest that the muCNP-βgeo mice can be useful to further identify and purify non-neural cell types in tissues in which the CNP promoter is active and to help delineate the function of CNP.
In the nervous system, transgene expression is restricted to oligodendrocytes and Schwann cells
In all postnatal Tg neural tissue examined, both CNPI-βgeo and CNPII-βgeo mRNA were present, indicating that both promoters were active. Furthermore, anti-β-gal- or NPT II-immunoreactive species, migrating at the expected molecular weight (∼150 kDa), were also detected.
In the mouse CNS, CNP mRNA is detected at E12 (Peyron et al., 1997), and, subsequently, immunoreactivity is observed at E14 (Yu et al., 1994), coincident with the expression of the PDGF-α receptor (Yu et al., 1994) and presumably the onset of glial cell development. In the muCNP-βgeo mice, transgene activity was evident within the brain, spinal cord, and neural crest derivatives at E12.5, earlier than previously reported for CNP protein expression. In the CNS, positivelacZ staining formed a continuous longitudinal column of cells along the ventral domain of the CNS, beginning at the level of the rhombencephalon and continuing caudally along the extent of the spinal cord. There is evidence that in the spinal cord OLs are derived from a restricted region of the ventricular zone, near the floor plate (Warf et al., 1991; Noll and Miller, 1993; Pringle and Richardson, 1993; Yu et al., 1994; Timsit et al., 1995; Peyron et al., 1997). The onset of muCNP-βgeo expression coincided spatially with the expression of known OL markers and ventrally derived growth factors believed to be important for their development (Stemple and Anderson, 1992; Yu et al., 1994; Orentas and Miller, 1996; Richardson et al., 1997), indicating that the transgene-positive cells expressed at E12.5 and E15 represent OL progenitors.
Temporal and spatial information regarding the origins of OLs in the brain is limited. PDGF-α receptor- and DM-20-expressing cells in the germinative neuroepithelium are believed to be OL precursors (Peyron et al., 1997), but expression of these markers may not be absolutely limited to glial cells (Johe et al., 1996; Williams et al., 1997). By culturing cells from E12.5 rhombencephalon in the presence of antibiotic, we clearly demonstrated that the transgene-positive cells from this region represent a foci of progenitors capable of differentiating into mature OLs. This discrete population may arise from the migration of cells into the brain from the spinal cord before E12.5, or they may represent a distinct population. The presence of OL progenitors in the rhombencephalon at E12.5, together with the limited number of transgene-positive cells observed throughout the rest of the brain at this developmental stage (e.g., small population in the telencephalon), suggests that the rhombencephalon may be an important source of OL in the brain. Several studies support a role for distinct pools of OL progenitors in the brain (Privat and Leblond, 1972; Pringle and Richardson, 1993; Timsit et al., 1995; Peyron et al., 1997).
Transgene activity was also observed in neural crest progenitor cells at E12.5, indicating that the CNP promoter region used was active in SC precursors and may be useful for studying their development.
The temporal expression pattern of the muCNP-βgeo transgene highly correlated with CNP, with lower levels of β-gal activity early in development and increased transgene activity postnatally. The muCNP-βgeo transgene activity observed early during development may reflect increased sensitivity to low-level promoter activity amplified by the β-gal enzyme compared with CNP immunostaining. Although this level of detection may not represent physiologically relevant promoter activity, low levels of myelin-related mRNAs and proteins were reported in both precursors of OLs (Yu et al., 1994; Timsit et al., 1995;Hajihosseini et al., 1996; Parmantier et al., 1997; Peyron et al., 1997) and SCs (Landry et al., 1997; Lee et al., 1997). Previous developmental studies examining CNP expression may have been limited by the sensitivity of the available probes and antibodies.
muCNP-βgeo oligodendrocytes and Schwann cells are antibiotic-resistant
Several different strategies have been used to selectively isolate individual cell types from a heterogeneous population. For example, enrichment procedures take advantage of the ability of one cell type to preferentially attach to a substrate (McCarthy and De Vellis, 1980;Sasaki et al., 1989). However, it may take several weeks to optimize the purity of these cultures, especially when taking into consideration the subsequent manipulations that are necessary to generate pure populations of mouse, rather than rat, OLs (Levison and McCarthy, 1992;Gard et al., 1995). Immunopanning (Mage et al., 1977; Wysocki and Sato, 1978; Barres et al., 1992), immunomagnetic (Meier et al., 1982;Chalazonitis et al., 1994; Wright et al., 1997), and fluorescence-activated cell sorting (Abney et al., 1983) techniques use the expression of surface molecules to select specific cell types. Although these approaches can be effective, they can be costly and are limited by cell-specific surface epitopes and the availability of the corresponding antibodies. Furthermore, fluorescence-activated cell sorting requires costly specialized equipment and highly trained personnel. Although many selection strategies when applied properly yield large numbers of OLs and SCs, they can be harsh on cells, and a compromise must be made with regard to viability, the level of purity, and yield. By contrast, within 8–9 d of exposure to G418, we were able to generate large numbers of tagged, antibiotic-resistant OL and SC cultures that were 99% free of other cell types, a strategy that is not limited by antibody specificity or complicated procedures. Moreover, in the presence of mitogens, increased cell numbers were observed; thus cells can be expanded as they are being selected.
In general, separation procedures may be characterized by inherent biases that preferentially optimize for the selection of a particular phenotype, rather than an individual cell type. For example, in vivo the CNP II promoter is turned on in the developing nervous system, whereas CNP I promoter activity is restricted to differentiating cells (Scherer et al., 1994); thus, in vitrothe weakly expressing progenitors may have been more sensitive to the dose of G418. However, in the muCNP-βgeo preparations, the concentration of G418 did not preferentially select only the most robustly expressing cells (e.g., the more-differentiated cell types). We observed lacZ staining in the E12.5 embryo, and, when cultured, these OL progenitors were resistant to antibiotics. Moreover, for all of the culture preparations, the morphology of surviving OLs or SCs varied from progenitor-like to more differentiated and both dividing and mitotically quiescent cells were present. All antibiotic-resistant OLs and SCs expressed some β-gal activity; however, there was heterogeneity in the level of lacZ staining. Further analysis with several different developmentally homogeneous cell populations should clarify whether this reflects differences in the levels of transgene expression related to the developmental stage of cells or, alternatively, mosaicism.
In toto, these results suggest that the muCNP-βgeo mice provide a sensitive, quantitative approach to detecting cells, especially at early stages of neural development when detection is defined by the limited sensitivity of available probes. Preliminary studies demonstrate that this system is useful for tracing the origin and migratory routes of cells during their ontogeny. Moreover, at different stages of development cells can be isolated, selected, and studiedin vitro. Additionally, the muCNP-βgeo transgene may be crossed into a range of transgenic mouse lines, including conditional knock-out lines in which the neo cassette can be excised out. The muCNP-βgeo Tg may also be useful for examining the temporal and spatial signals that regulate CNP expression. In contrast to the other available techniques for purifying mouse OLs and SCs, after selection the muCNP-βgeo cells are tagged and, therefore, may be useful for subsequent co-culture, transplantation, lineage, and promoter activity analyses.
Footnotes
This study was supported by National Institute for Neurological Diseases and Stroke intramural funds. R.I.C. was supported by National Multiple Sclerosis Society Grant FG1197-A1. We thank Dr. P. Soriano for generously supplying the pBKSβgeo construct, Dr. M. Marchionni for the GGF, and Dr. S. Pfeiffer for the O1 antibody. Thanks to Melissa Comiso for technical assistance and Drs. D. Agoston, H. Arnheiter, B. Y. Champagne, J. A. Kessler, I. Maric, D. Maric, E. Mezey, U. Pott, M. E. Rubio, and A. Zimmer for helpful discussions and advice.
Correspondence should be addressed to Dr. Karen J. Chandross, National Institutes of Health, National Institute for Neurological Diseases and Stroke, Laboratory of Developmental Neurogenetics, Building 36, Room 5D21, Bethesda, MD 20892.
REFERENCES
- 1.Abney ER, Williams BP, Raff MC. Tracing the development of oligodendrocytes from precursor cells using monoclonal antibodies, fluorescence-activated cell sorting and cell culture. Dev Biol. 1983;100:166–171. doi: 10.1016/0012-1606(83)90207-5. [DOI] [PubMed] [Google Scholar]
- 2.Bachmair A, Finley D, Varshavsky A. In vivo half-life of a protein is a function of its amino-terminal residue. Science. 1986;234:179–186. doi: 10.1126/science.3018930. [DOI] [PubMed] [Google Scholar]
- 3.Barres BA, Chun LLY, Corey DP. Ion channel in vertebrate glia. Annu Rev Neurosci. 1988;13:441–474. doi: 10.1146/annurev.ne.13.030190.002301. [DOI] [PubMed] [Google Scholar]
- 4.Barres BA, Hart IK, Coles HSR, Burne JF, Voyvodic JT, Richardson WD, Raff MC. Cell death and control of cell survival in the oligodendrocyte lineage. Cell. 1992;70:31–46. doi: 10.1016/0092-8674(92)90531-g. [DOI] [PubMed] [Google Scholar]
- 5.Bernier L, Alvarez F, Norgard EM, Raible DW, Mentaberry A, Schembri JG, Sabatini DD, Colman DR. Molecular cloning of a 2′,3′-cyclic nucleotide 3′-phosphodiesterase: mRNAs with different 5′-ends encode the same set of proteins in nervous and lymphoid tissues. J Neurosci. 1987;7:2703–2710. doi: 10.1523/JNEUROSCI.07-09-02703.1987. [DOI] [PMC free article] [PubMed] [Google Scholar]
- 6.Bottenstein JE, Hunter SF, Seidel M. CNS neuronal cell line-derived factors regulate gliogenesis in neonatal rat brain cultures. J Neurosci Res. 1988;20:291–303. doi: 10.1002/jnr.490200303. [DOI] [PubMed] [Google Scholar]
- 7.Braun PE, Sandillon F, Edwards A, Matthieu J-M, Privat A. Immunocytochemical localization by electron microscopy of 2′,3′-cyclic nucleotide 3′-phosphodiesterase in developing oligodendrocytes of normal and mutant brain. J Neurosci. 1988;8:3057–3066. doi: 10.1523/JNEUROSCI.08-08-03057.1988. [DOI] [PMC free article] [PubMed] [Google Scholar]
- 8.Chalazonitis A, Rothman TP, Chen J, Lambelle F, Barbacid M, Gershon MD. Neurotrophin-3 induces neural crest-derived cells from fetal rat gut to develop in vitro as neurons or glia. J Neurosci. 1994;14:6571–6584. doi: 10.1523/JNEUROSCI.14-11-06571.1994. [DOI] [PMC free article] [PubMed] [Google Scholar]
- 9.Cohen RI, Marmur R, Norton WT, Mehler MF, Kessler JA. Nerve growth factor and neurotrophin-3 differentially regulate the proliferation and survival of developing rat brain oligodendrocytes. J Neurosci. 1996;16:6433–6442. doi: 10.1523/JNEUROSCI.16-20-06433.1996. [DOI] [PMC free article] [PubMed] [Google Scholar]
- 10.Feltri ML, Scherer SS, Wrabetz L, Kamholz J, Shy ME. Mitogen-expanded Schwann cells retain the capacity to myelinate regenerating axons after transplantation into rat sciatic nerve. Proc Natl Acad Sci USA. 1992;89:8827–8831. doi: 10.1073/pnas.89.18.8827. [DOI] [PMC free article] [PubMed] [Google Scholar]
- 11.Friedrich G, Soriano P. Promoter traps in embryonic stem cells: a genetic screen to identify and mutate developmental genes in mice. Genes Dev. 1991;5:1513–1523. doi: 10.1101/gad.5.9.1513. [DOI] [PubMed] [Google Scholar]
- 12.Gage FH, Coates PW, Palmer TD, Kuhn HG, Fisher LJ, Suhonen JO, Peterson DA, Suhr ST, Ray J. Survival and differentiation of adult neuronal progenitor cells transplanted to the adult brain. Proc Natl Acad Sci USA. 1995;92:11879–11883. doi: 10.1073/pnas.92.25.11879. [DOI] [PMC free article] [PubMed] [Google Scholar]
- 13.Gard AL, Pfeiffer SE. Two proliferative stages of the oligodendrocyte lineage (A2B5+O4− and O4+GalC−) under different mitogenic control. Neuron. 1990;5:615–625. doi: 10.1016/0896-6273(90)90216-3. [DOI] [PubMed] [Google Scholar]
- 14.Gard AL, Burrell MR, Pfeiffer SE, Rudge JS, Williams WC. Astroglial control of oligodendrocyte survival mediated by PDGF and leukemia inhibitory factor-like protein. Development. 1995;121:2187–2197. doi: 10.1242/dev.121.7.2187. [DOI] [PubMed] [Google Scholar]
- 15.Gravel M, De Angelis DA, Braun PE. Molecular cloning and characterization of 2′,3′-cyclic nucleotide 3′-phosphodiesterase isoform 2. J Neurosci Res. 1994;38:243–247. doi: 10.1002/jnr.490380302. [DOI] [PubMed] [Google Scholar]
- 16.Gravel M, Di Polo A, Valera PB, Braun PE. A 4 kb sequence of the mouse CNP gene directs spatial and temporal expression of lacZ in transgenic mice. J Neurosci Res. 1998;53:393–404. doi: 10.1002/(SICI)1097-4547(19980815)53:4<393::AID-JNR1>3.0.CO;2-1. [DOI] [PubMed] [Google Scholar]
- 17.Gross RE, Mehler MF, Mabie PC, Zang Z, Santschi L, Kessler JA. Bone morphogenetic proteins promote astroglial lineage commitment by mammalian subventricular zone progenitor cells. Neuron. 1996;17:595–606. doi: 10.1016/s0896-6273(00)80193-2. [DOI] [PubMed] [Google Scholar]
- 18.Hajihosseini M, Tham TN, Dubois-Dalcq M. Origin of oligodendrocytes within the human spinal cord. J Neurosci. 1996;16:7981–7994. doi: 10.1523/JNEUROSCI.16-24-07981.1996. [DOI] [PMC free article] [PubMed] [Google Scholar]
- 19.Hardy R, Reynolds R. Proliferation and differentiation potential of rat forebrain oligodendroglial progenitors both in vitro and in vivo. Development. 1991;111:1061–1080. doi: 10.1242/dev.111.4.1061. [DOI] [PubMed] [Google Scholar]
- 20.Hogan B, Costantini F, Lacy E. Manipulating the mouse embryo: a laboratory manual. Cold Spring Harbor Laboratory; Cold Spring Harbor, NY: 1986. [Google Scholar]
- 21.Johe K, Hazel T, Muller T, Dugich-Djordjevic M, McKay R. Single factors direct the differentiation of stem cells from the fetal and adult nervous system. Genes Dev. 1996;10:3129–3140. doi: 10.1101/gad.10.24.3129. [DOI] [PubMed] [Google Scholar]
- 22.Jordan C, Friedrich V, Jr, Dubois-Dalcq M. In situ hybridization analysis of myelin gene transcripts in developing mouse spinal cord. J Neurosci. 1989;9:248–257. doi: 10.1523/JNEUROSCI.09-01-00248.1989. [DOI] [PMC free article] [PubMed] [Google Scholar]
- 23.Kalwy S, Marty M-C, Bausero P, Pessac B. Myelin basic protein-related proteins in mouse brain and immune tissues. J Neurochem. 1998;70:435–438. doi: 10.1046/j.1471-4159.1998.70010435.x. [DOI] [PubMed] [Google Scholar]
- 24.Kanfer J, Parenty M, Goujet-Zalc C, Munge M, Bernier L, Campagnoni AT, Dautigny A, Zalc B. Developmental expression of myelin proteolipid protein, myelin basic protein, and 2′,3′-cyclic nucleotide 3′ phosphodiesterase transcripts in different brain regions. J Mol Neurosci. 1989;1:39–46. doi: 10.1007/BF02896855. [DOI] [PubMed] [Google Scholar]
- 25.Kurihara T, Monoh K, Sakimura K, Takajashi Y. Alternative splicing of mouse brain 2′3′-cyclic nucleotide 3′-phosphodiesterase. Biochem Biophys Res Commun. 1990;170:1074–1081. doi: 10.1016/0006-291x(90)90502-e. [DOI] [PubMed] [Google Scholar]
- 26.Kuramoto H, Hozumi I, Inuzuka T, Sato S. Occurrence of myelin-associated glycoprotein (MAG)-like immunoreactivity in some nervous, endocrine, and immune-related cells of the rat. An immunohistochemical study. Mol Chem Neuropathol. 1997;31:85–94. doi: 10.1007/BF02815163. [DOI] [PubMed] [Google Scholar]
- 27.Kurtz A, Zimmer A, Schnütgen F, Brüning G, Spener F, Müller T. The expression pattern of a novel gene encoding brain-fatty acid binding protein correlates with neuronal and glial cell development. Development. 1994;120:2637–2649. doi: 10.1242/dev.120.9.2637. [DOI] [PubMed] [Google Scholar]
- 28.Landis SC. Rat sympathetic neurons and cardiac myocytes developing in microcultures: correlation of the fine structure of endings with neurotransmitter function in single neurons. Proc Natl Acad Sci USA. 1976;73:4220–4224. doi: 10.1073/pnas.73.11.4220. [DOI] [PMC free article] [PubMed] [Google Scholar]
- 29.Landry CF, Ellison J, Skinner E, Campagnoni AT. Golli-MBP proteins mark the earliest stages of fiber extension and terminal arboration in the mouse peripheral nervous system. J Neurosci Res. 1997;50:265–271. doi: 10.1002/(SICI)1097-4547(19971015)50:2<265::AID-JNR15>3.0.CO;2-7. [DOI] [PubMed] [Google Scholar]
- 30.Lee M, Brennan A, Blanchard A, Zoidl G, Dong Z, Tabernero A, Zoidl C, Dent MA, Jessen KR, Mirsky R. P0 is constitutively expressed in the rat neural crest and embryonic nerves and is negatively and positively regulated by axons to generate non-myelin-forming and myelin-forming Schwann cells, respectively. Mol Cell Neurosci. 1997;8:336–350. doi: 10.1006/mcne.1996.0589. [DOI] [PubMed] [Google Scholar]
- 31.Lemke GE, Brockes JP. Identification and purification of glial growth factor. J Neurosci. 1984;4:75–83. doi: 10.1523/JNEUROSCI.04-01-00075.1984. [DOI] [PMC free article] [PubMed] [Google Scholar]
- 32.Levison SW, McCarthy KD. Astroglia in culture. In: Banker G, Goslin K, editors. Culturing nerve cells. MIT; Cambridge, MA: 1992. pp. 309–336. [Google Scholar]
- 33.Li Y, Raisman G. Integration of transplanted cultured Schwann cells into the long myelinated fiber tracts of the adult spinal cord. Exp Neurol. 1997;145:397–411. doi: 10.1006/exnr.1997.6502. [DOI] [PubMed] [Google Scholar]
- 34.Lundberg C, Martinez-Serrano A, Cattaneo E, McKay RD, Bjorklund Survival, integration, and differentiation of neural stem cell lines after transplantation to the adult rat striatum. Exp Neurol. 1997;145:342–360. doi: 10.1006/exnr.1997.6503. [DOI] [PubMed] [Google Scholar]
- 35.Mage MG, McHugh LL, Rothstein TL. Mouse lymphocytes with and without surface immunoglobulin: preparative scale separation on polystyrene tissue culture dishes coated with specifically purified anti-immunoglobulin. J Immunol Methods. 1977;15:47–56. doi: 10.1016/0022-1759(77)90016-3. [DOI] [PubMed] [Google Scholar]
- 36.Marchionni MA, Goodearl ADJ, Chen MS, Bermingham-McDonogh O, Kirk C, Hendricks M, Danehy F, Misumi D, Sudhalter J, Kobayashi K, Wroblewski D, Lynch C, Baldassare M, Hiles I, Davis JB, Hsuan JJ, Totty NF, Otsu M, McBurney RN, Waterfield MD, Stroobant P, Gwynne D. Glial growth factors are alternatively spliced erbB2 ligands expressed in the nervous system. Nature. 1993;362:312–318. doi: 10.1038/362312a0. [DOI] [PubMed] [Google Scholar]
- 37.Maric D, Maric I, Ma W, Lahojuji F, Somogyi R, Wen X, Sieghart W, Fritschy J-M, Barker JL. Anatomical gradients in proliferation and differentiation of embryonic rat CNS accessed by buoyant density fractionation: α3, β3 and γ2 GABAA receptor subunit co-expression by post-mitotic neocortical neurons correlates directly with cell buoyancy. Eur J Neurosci. 1997;9:507–522. doi: 10.1111/j.1460-9568.1997.tb01628.x. [DOI] [PubMed] [Google Scholar]
- 38.Martin D, Robe P, Franzen R, Delree P, Schoenen J, Stevenaert A, Moonen G. Effects of Schwann cell transplantation in a contusion model of rat spinal cord injury. J Neurosci Res. 1996;45:588–597. doi: 10.1002/(SICI)1097-4547(19960901)45:5<588::AID-JNR8>3.0.CO;2-8. [DOI] [PubMed] [Google Scholar]
- 39.McCarthy KD, De Vellis J. Preparation of separate astroglia and oligodendroglia cell cultures from rat cerebral tissue. J Cell Biol. 1980;85:890–902. doi: 10.1083/jcb.85.3.890. [DOI] [PMC free article] [PubMed] [Google Scholar]
- 40.McKay R. Stem cells in the central nervous system. Science. 1997;276:66–71. doi: 10.1126/science.276.5309.66. [DOI] [PubMed] [Google Scholar]
- 41.McMorris FA. Cyclic AMP induction of the myelin enzyme 2′,3′-cyclic nucleotide 3′-phosphohydrolase in rat oligodendrocytes. J Neurochem. 1983;41:506–515. doi: 10.1111/j.1471-4159.1983.tb04768.x. [DOI] [PubMed] [Google Scholar]
- 42.Meier DH, Lagenaur C, Schachner M. Immunoselection of oligodendrocytes by magnetic beads. I. Determination of antibody coupling parameters and cell binding conditions. J Neurosci Res. 1982;7:119–134. doi: 10.1002/jnr.490070204. [DOI] [PubMed] [Google Scholar]
- 43.Miller R. Oligodendrocyte origins. Trends Neurosci. 1996;19:92–96. doi: 10.1016/s0166-2236(96)80036-1. [DOI] [PubMed] [Google Scholar]
- 44.Mirsky R, Winter J, Abney E, Pruss RM, Gavrilovic J, Raff MC. Myelin-specific proteins and glycolipids in rat Schwann cells and oligodendrocytes in culture. J Cell Biol. 1980;84:483–494. doi: 10.1083/jcb.84.3.483. [DOI] [PMC free article] [PubMed] [Google Scholar]
- 45.Monge M, Kadiiski D, Jacque CM, Zalc B. Oligodendroglial expression and deposition of four major myelin constituents during development. Dev Neurosci. 1986;8:222–235. doi: 10.1159/000112255. [DOI] [PubMed] [Google Scholar]
- 46.Monoh K, Kurihara T, Sakimura K, Takahashi Y. Structure of mouse 2′3′-cyclic nucleotide 3′-phosphodiesterase gene. Biochem Biophys Res Commun. 1989;165:1213–1220. doi: 10.1016/0006-291x(89)92731-9. [DOI] [PubMed] [Google Scholar]
- 47.Morgan L, Jessen KR, Mirsky R. The effects of cAMP on differentiation of cultured Schwann cells: progression from an early phenotype (O4+) to a myelin phenotype (P0+, GFAP−, N-CAM−, NGF-receptor−) depends on growth inhibition. J Cell Biol. 1991;112:457–467. doi: 10.1083/jcb.112.3.457. [DOI] [PMC free article] [PubMed] [Google Scholar]
- 48.Morrissey TK, Kleitman N, Bunge RP. Isolation and functional characterization of Schwann cells derived from adult peripheral nerve. J Neurosci. 1991;11:2433–2442. doi: 10.1523/JNEUROSCI.11-08-02433.1991. [DOI] [PMC free article] [PubMed] [Google Scholar]
- 49.Noll E, Miller RH. Oligodendrocyte precursors originate at the ventral ventricular zone dorsal to the ventral midline in the embryonic rat spinal cord. Development. 1993;118:563–573. doi: 10.1242/dev.118.2.563. [DOI] [PubMed] [Google Scholar]
- 50.O’Neill RC, Minuk J, Cox ME, Braun PE, Gravel M. CNP2 mRNA directs synthesis of both CNP1 and CNP2 polypeptides. J Neurosci Res. 1997;50:248–257. doi: 10.1002/(SICI)1097-4547(19971015)50:2<248::AID-JNR13>3.0.CO;2-4. [DOI] [PubMed] [Google Scholar]
- 51.Orentas DM, Miller RH. The origin of spinal cord oligodendrocytes is dependent on local influences from the notochord. Dev Biol. 1996;177:43–53. doi: 10.1006/dbio.1996.0143. [DOI] [PubMed] [Google Scholar]
- 52.Parmantier E, Braun C, Thomas JL, Peyron F, Martinez S, Zalc B. PMP-22 expression in the central nervous system of the embryonic mouse defines potential transverse segments and longitudinal columns. J Comp Neurol. 1997;378:159–172. [PubMed] [Google Scholar]
- 53.Patterson PH, Chun LLY. The induction of acetylcholine synthesis in primary cultures of dissociated rat sympathetic neurons. Dev Biol. 1977;56:263–280. doi: 10.1016/0012-1606(77)90269-x. [DOI] [PubMed] [Google Scholar]
- 54.Peyron R, Timsit S, Thomas J-L, Kagawa T, Ikenaka K, Zalc B. In situ expression of PLP/DM-20, MBP, and CNP during embryonic and postnatal development of the jimpy mutant and of transgenic mice overexpressing PLP. J Neurosci Res. 1997;50:190–201. doi: 10.1002/(SICI)1097-4547(19971015)50:2<190::AID-JNR8>3.0.CO;2-A. [DOI] [PubMed] [Google Scholar]
- 55.Porter S, Clark MB, Glaser L, Bunge RP. Schwann cells stimulated to proliferate in the absence of neurons retain full functional capability. J Neurosci. 1986;6:3070–3078. doi: 10.1523/JNEUROSCI.06-10-03070.1986. [DOI] [PMC free article] [PubMed] [Google Scholar]
- 56.Pribyl TM, Campagnoni CW, Kampf K, Kashima T, Handley VW, McMahon J, Campagnoni AT. The human myelin basic protein gene is included within a 179-kilobase transcription unit: expression in the immune and central nervous systems. Proc Natl Acad Sci USA. 1993;90:10695–10699. doi: 10.1073/pnas.90.22.10695. [DOI] [PMC free article] [PubMed] [Google Scholar]
- 57.Pribyl TM, Campagnoni CW, Kampf K, Handley VW, Campagnoni AT. The major myelin protein genes are expressed in the human thymus. J Neurosci Res. 1996;45:812–819. doi: 10.1002/(SICI)1097-4547(19960915)45:6<812::AID-JNR18>3.0.CO;2-X. [DOI] [PubMed] [Google Scholar]
- 58.Pringle NP, Richardson WD. A singularity of PDGF alpha-receptor expression in the dorsoventral axis of the neural tube may define the origin of the oligodendrocyte lineage. Development. 1993;117:525–533. doi: 10.1242/dev.117.2.525. [DOI] [PubMed] [Google Scholar]
- 59.Privat A, Leblond CP. The subependymal layer and neighbouring region in the brain of young rats. J Comp Neurol. 1972;142:277–302. doi: 10.1002/cne.901460302. [DOI] [PubMed] [Google Scholar]
- 60.Reynolds R, Wilkin GP. Development of macroglial cells in rat cerebellum. II. An in situ immunohistochemical study of oligodendroglial lineage from precursor to mature myelinating cell. Development. 1988;102:409–425. doi: 10.1242/dev.102.2.409. [DOI] [PubMed] [Google Scholar]
- 61.Richardson WD, Pringle NP, Yu W-P, Hall AC. Origins of spinal cord oligodendrocytes: possible developmental and evolutionary relationships with motor neurons. Dev Neurosci. 1997;19:58–68. doi: 10.1159/000111186. [DOI] [PubMed] [Google Scholar]
- 62.Sasaki A, Levison SW, Ting JP-Y. Comparison and quantitation of Ia antigen expression on cultured macroglia and amoeboid microglia from Lewis rat cerebral cortex: analyses and implications. J Neuroimmunol. 1989;25:63–74. doi: 10.1016/0165-5728(89)90087-8. [DOI] [PubMed] [Google Scholar]
- 63.Scherer SS, Braun P, Grinspan J, Collarini E, Wang D-y, Kamholz J. Differential regulation of the 2′,3′-cyclic nucleotide 3′-phosphodiesterase gene during oligodendrocyte development. Neuron. 1994;12:1363–1375. doi: 10.1016/0896-6273(94)90451-0. [DOI] [PubMed] [Google Scholar]
- 64.Sommer I, Schachner M. Monoclonal antibodies (O1 to O4) to oligodendrocyte cell surface: an immunocytological study in the central nervous system. Dev Biol. 1981;83:311–327. doi: 10.1016/0012-1606(81)90477-2. [DOI] [PubMed] [Google Scholar]
- 65.Sprinkle TJ. 2′,3′-Cyclic nucleotide 3′-phosphodiesterase, an oligodendrocyte-Schwann cell and myelin-associated enzyme of the nervous system. CRC Crit Rev Neurobiol. 1989;4:235–301. [PubMed] [Google Scholar]
- 66.Stemple DL, Anderson DJ. Isolation of a stem cell for neurons and glia from the mammalian neural crest. Cell. 1992;71:973–985. doi: 10.1016/0092-8674(92)90393-q. [DOI] [PubMed] [Google Scholar]
- 67.Svendsen CN, Caldwell MA, Shen J, ter Borg MG, Rosser AE, Tyers P, Karmiol S, Dunnett SB. Long-term survival of human central nervous system progenitor cells transplanted into a rat model of Parkinson’s disease. Exp Neurol. 1997;148:135–146. doi: 10.1006/exnr.1997.6634. [DOI] [PubMed] [Google Scholar]
- 68.Timsit S, Martinez S, Allinquant B, Peyron F, Puelles L, Zalc B. Oligodendrocytes originate in a restricted zone of the embryonic ventral neural tube defined by DM-20 mRNA expression. J Neurosci. 1995;15:1012–1024. doi: 10.1523/JNEUROSCI.15-02-01012.1995. [DOI] [PMC free article] [PubMed] [Google Scholar]
- 69.Trapp BD, Bernier L, Andrews SB, Colman D. Cellular and subcellular distribution of CNP and its mRNA in the rat CNS. J Neurochem. 1988;51:859–868. doi: 10.1111/j.1471-4159.1988.tb01822.x. [DOI] [PubMed] [Google Scholar]
- 70.Tsukada Y, Kurihara T. 2′,3′-cyclic nucleotide 3′-phosphodiesterase: molecular characterization and possible functional significance. In: Matenson RE, editor. Myelin: biology and chemistry. CRC; Boca Raton, FL: 1992. pp. 449–480. [Google Scholar]
- 71.Vogel US, Thompson RJ. Molecular structure, localization, and possible function of the myelin-associated enzyme 2′3′-cyclic nucleotide 3′-phosphodiesterase. J Neurochem. 1988;50:1667–1677. doi: 10.1111/j.1471-4159.1988.tb02461.x. [DOI] [PubMed] [Google Scholar]
- 72.Warf BC, Fok-Seang J, Miller RH. Evidence for the ventral origin of oligodendrocyte precursors in the rat spinal cord. J Neurosci. 1991;11:2477–2488. doi: 10.1523/JNEUROSCI.11-08-02477.1991. [DOI] [PMC free article] [PubMed] [Google Scholar]
- 73.Williams BP, Park JK, Alberta JA, Muhlebach SG, Hwang GY, Roberts TM, Stiles CD. A PDGF-regulated immediate early gene response initiates neuronal differentiation in ventricular zone progenitor cells. Neuron. 1997;18:553–562. doi: 10.1016/s0896-6273(00)80297-4. [DOI] [PubMed] [Google Scholar]
- 74.Wright AP, Fitzgerald RJ, Colello RJ. Rapid purification of glial cells using immunomagnetic separation. J Neurosci Methods. 1997;74:37–44. doi: 10.1016/s0165-0270(97)22400-3. [DOI] [PubMed] [Google Scholar]
- 75.Wysocki LJ, Sato VL. “Panning” for lymphocytes: a method for cell selection. Proc Natl Acad Sci USA. 1978;61:477–483. doi: 10.1073/pnas.75.6.2844. [DOI] [PMC free article] [PubMed] [Google Scholar]
- 76.Yu W-P, Collarini EJ, Pringle NP, Richardson WD. Embryonic expression of myelin genes: evidence for a focal source of oligodendrocyte precursors in the ventral ventricular zone of the neural tube. Neuron. 1994;12:1353–1362. doi: 10.1016/0896-6273(94)90450-2. [DOI] [PubMed] [Google Scholar]
- 77.Zeller NK, Behar TN, Dubois-Dalcq ME, Lazzarini RA. The timely expression of myelin basic protein gene in cultured rat brain oligodendrocytes is independent of continuous neuronal influences. J Neurosci. 1985;5:2955–2962. doi: 10.1523/JNEUROSCI.05-11-02955.1985. [DOI] [PMC free article] [PubMed] [Google Scholar]