

Abstract
Voltage-activated calcium currents (ICa) are one way by which calcium influx into neurons is mediated. To investigate changes in kinetic properties of ICa during neuronal development and to correlate possible kinetic changes with specific differentiation processes, the ICa of retinal ganglion cells (RGCs) was recorded with the perforated patch-clamp technique in rat retinal slices and in whole mounts at different prenatal and postnatal stages.
ICa density increased between embryonic day (E) 20 and the adult stage, paralleled by a shift in activation of the ω-conotoxin GVIA-sensitive ICa toward more negative membrane potentials. Furthermore, developmental alterations were observed in ICa inactivation rate during a 120 msec test pulse and in steady-state inactivation ofICa. The most striking feature inICa kinetics was a transient slowing of calcium current deactivation, which peaked at postnatal day (P)3–5 and affected all ICa subtypes.
Although the shift in activation and the decreased inactivation rate ofICa can be explained by differential regulation of distinct calcium channel subtypes, it is more likely that a more general alteration of the cells’ functional state was the underlying factor in alterations in steady-state inactivation and current deactivation of ICa.
Alterations in the ω-conotoxin GVIA-sensitive and the toxin-resistant currents temporarily coincide with dendritic differentiation, and it is tempting to speculate about their role in network formation in the inner retina. In contrast, alterations in steady-state inactivation and current deactivation may be involved in the regulation of RGC survival, because they occur during the period of programmed cell death in the ganglion cell layer.
In conclusion, distinct time windows of alterations in calcium channel properties were found, and this study has provided a basis for performing functional assays to clarify in detail the developmental process to which these alterations are related.
Keywords: retina, retinal ganglion cell, development, perforated patch clamp, voltage-activated calcium channels, kinetic properties, rat
Calcium ions have a key regulatory function for many neuronal pathways of the CNS. Intracellular calcium has been shown to play a crucial role in regulating proliferation, cell migration, and neurite outgrowth (for review, see Doherty and Walsh, 1994; Gu et al., 1994; Kocsis et al., 1994; Rakic and Komuro, 1994;Rakic et al., 1994; Takuwa et al., 1995), as well as in processes of neuronal plasticity (Mattson and Barger, 1993) and natural cell death (for review, see Orrenius and Nicotera, 1994; Wolszon et al., 1994).
Neurons possess complex systems for regulating intracellular calcium levels, including voltage-activated calcium channels in the plasma membrane. It has been shown that activation of intracellular processes that affect distinct developmental events depends on the type of channel through which calcium enters the cell (Collins et al., 1991;Komuro and Rakic, 1992). Knowing which types of calcium channels are expressed during the development of a distinct neuron and what their functional characteristics are is therefore important for an understanding of the role of calcium currents in differentiation processes in neural tissues in vivo and the correlation between functional development and neuroanatomical differentiation.
The mammalian retinal ganglion cell (RGC) provides a particularly attractive model for such investigations, because the morphological development and connectivity of this cell type have been well described (Potts et al., 1982; Bunt et al., 1983; Perry et al., 1983; O’Leary et al., 1986). To date, not much is known about alterations in calcium current expression and kinetics during the development and maturation of RGCs. However, it seems appropriate to link alterations in calcium channel properties with distinct events in RGC development, because, for example, neurite outgrowth and RGC survival depend for a restricted developmental period on neurotrophic factors (Castillo et al., 1994;Cohen et al., 1994; Cui and Harvey, 1994; Meyer-Franke et al., 1995). These factors have been shown in various tissues to act by the modulation of kinetic properties of voltage-activated calcium channels (Eschweiler and Bähr, 1993; Levine et al., 1995a; Tanaka and Koike, 1995).
Most previous studies on voltage-activated calcium channels in RGCs were performed mainly in cell cultures and restricted to only one distinct developmental stage (Lipton and Tauck, 1987; Karschin and Lipton, 1989; Ishida, 1991; Kaneda and Kaneko, 1991; Guenther et al., 1994a; Liu and Lasater, 1994; Bindokas and Ishida, 1996). Rörig and Grantyn (1994) were the first to describe voltage-activated current expression in mouse RGCs in two different embryonic stages in retinal whole mounts, and Rothe and Grantyn (1994) investigated changes in the relative abundance of different types of calcium currents in mouse RGCs during the first 3 weeks of in vitro development.
In a previous study, we investigated in situ alterations in calcium current composition and the pharmacological properties of different types of calcium currents during prenatal and postnatal development in rat RGCs (Schmid and Guenther, 1996).
The present study now describes for the first time developmental alterations in the kinetic properties of calcium currents during the whole period of RGC development in situ. It thus provides the basis for more sophisticated functional assays that will clarify the role of these alterations in developmental processes that are temporarily interrelated, such as RGC death, dendritic differentiation, and synapse formation.
MATERIALS AND METHODS
Preparation of slices and whole mounts. Postnatal retinal slices were obtained from pigmented rats (Brown Norway) between embryonic day (E) 15 and the adult stage [≥ postnatal day (P) 20]. After cervical dislocation and enucleation, the retinas were gently removed from the eye cups and kept in extracellular solution (ec1) on ice that was continuously bubbled with oxygen. For slice preparation, retinas were embedded in agar (2% in ec1) held at 39°C and immediately cooled on ice. A small agar block containing the retina was trimmed and glued to the stage of a vibratome (TSE). The stage was immersed in ice-cold ec1, and slices of 200 μm were cut transversely. Before being used for recording, the slices were incubated in ec1 and continuously bubbled with oxygen for at least 1 hr at room temperature.
For preparation of embryonic retinal whole mounts, staged pregnant rats were anesthetized with ether and injected with an overdose of Nembutal. Embryos were quickly removed from the uterus and transferred into ice-cold ec1. After decapitation, the eyes were removed and reimmersed in ice-cold ec1. The retinas were dissected free and incubated in oxygenated ec1 at room temperature for at least 1 hr before recording. Embryonic retinas were not sliced, because retinal diameter was only 1–2 mm. Slicing of postnatal retinas was necessary because the layer of Müller glia endfeet and ganglion cell axons overlying the ganglion cell somata was too thick and sticky to be perforated by the patch-electrode in retinas from stages older than P6. To provide comparable conditions, all postnatal retinas were sliced.
Electrophysiological recording procedure. For electrophysiological recordings, slices or whole mounts were transferred into a poly-l-lysine-coated recording chamber on a microscope stage (Zeiss Axioskop) and fixed with a small grid made of fine nylon strings tightened between a U-shaped platinum wire. The recording chamber was superfused with 1.5–2 ml of oxygenated ec1 per minute.
Patch pipettes were pulled out of borosilicate capillaries (Biologica). Pipette resistance was 3–6 MΩ after heat-polishing. Pipettes were first front-filled for 10 sec with intracellular solution (ic) and thereafter backfilled with the same solution plus nystatin.
After sealing, light suction was applied, and the light of the microscope was switched off. Some minutes later, series resistance started to decrease. After reaching 15–25 MΩ, series resistance was usually stable and did not decrease further. Cell capacity and series resistance were then compensated, and recordings were started.
Recordings were made with an Axopatch 200 A amplifier at a sampling rate of 10 kHz using a low-pass Bessel filter of 2 kHz. Series resistance compensation was usually 60–80%. The liquid junction potential was ∼3 mV, and data were not corrected for it. The adequacy of space clamping was assessed by fitting a single exponent to the capacity charging current. Cells showing inadequate clamping were not included in the analysis. Cells were normally kept at a holding potential of −80 mV, and increasingly depolarized test potentials between −70 and 20 mV (in 10 mV steps) were applied for 120 msec at 10 sec intervals.
Data were displayed and stored for subsequent off-line analysis on an IBM PC. The commercial software program PCLAMP 6.0.2 was used for data acquisition and analysis, and Sigma-Plot was used for curve fitting and plotting.
Identification of retinal ganglion cells. Cells were chosen for recording according to their position in the ganglion cell layer and their soma size (Guenther et al., 1994b). Only large diameter ganglion cells were selected. Because α- or type I RGCs have been shown to have much larger cell somata than displaced amacrine cells and other types of RGCs (Perry, 1979; Thanos and Mey, 1995), we assume that we mainly recorded from this ganglion cell type. Other morphological criteria were inapplicable, because dendritic arborization, on which ganglion cell identification in adults is normally based, is immature in embryonic and postnatal stages <P10. Retrograde labeling of RGCs by injection of 2 μl of the fluorescent dye DiI (25 mg/500 μl DMF; Molecular Probes, Eugene, OR) into the superior colliculus of neonatal Brown Norway rats was occasionally performed and yielded a 100% correspondence with the identification made by soma size. Moreover, all cells that fulfilled the size criteria showed substantially higher transient sodium inward currents than cells identified as displaced amacrine cells (except E15 cells, which do not express voltage-activated currents). This is a further indication that they were indeed RGCs.
Data analyses. Time constants (τ) were determined by fitting the single exponential functionAn*exp[−(t −K)/τn] + C to the data, where A is the amplitude relative to offset evaluated at the start of the fit region (n), C is the steady-state asymptote, and (t − K) is the time [set to zero at the beginning (K) of the fit region]. Fitting procedures were performed with PCLAMP routines using the noniterative Chebyshev technique and minimizing the sum-of-squared errors.
Time to peak (tp) was determined by measuring the time from the beginning of the depolarization until peak current was reached.
Grouping of postnatal developmental stages. Postnatal stages were grouped as follows: a neonatal stage P1–2, when the number of RGCs is still maximum; an early postnatal stage P3–5, when most of the RGCs die by programmed cell death (Potts et al., 1982; Schmid and Guenther, 1996); stage P6–9, when programmed cell death of RGCs is greatly diminished, and the displaced amacrine cells have migrated to the ganglion cell layer (Perry et al., 1983); and P10–12, when cell death is completed, and the size and complexity of dendritic trees are greatest before being extensively remodeled (O’Leary et al., 1986;Yamasaki and Ramoa, 1993). Rats that had opened their eyes (P20–27) were considered adult, because RGCs were now receiving functional input. For still unknown reasons, no stable recording conditions could be established between P13 and P19, and data from these stages were not included in the present study. Because experimental conditions were unchanged, we believe that this problem was not caused by the recording procedure but rather by the cellular membrane during the period of dendritic remodeling and eye opening around P16/17.
Solutions and drugs. Ec1 was used for preparation and maintenance of slices and whole mounts. It consisted of (in mm): NaCl 130, KCl 5, CaCl2 2, MgCl2 1, HEPES 10, and glucose 20, pH 7.4 adjusted with 1m NaOH. For the isolation of calcium currents, ec1 was replaced with ec2, containing (in mm): choline chloride 110, KCl 5, BaCl2 2, MgCl2 1, HEPES 10, TEA-Cl 20, 4-AP 0.1, and glucose 20, pH 7.4, adjusted with 1 mCsOH. Both solutions were held at room temperature and continuously bubbled with oxygen during the whole experiment. A short puff of tetrodotoxin (5 μm; Sigma, St. Louis, MO) was additionally applied by a superfusion pipette after solution exchange to accelerate sodium channel blocking.
The pipette solution (ic) contained (in mm): Cs acetate 90, CsCl2 40, MgCl2 2, EGTA 10, and HEPES 10, pH 7.2, adjusted with 1 m CsOH. Nystatin stock solution (1 mg/10 μl DMSO) was added to the ic to an end concentration of 50 μm. The solution was sonicated for 15 min before being used. When stored on ice and strictly protected from light, the nystatin containing ic had to be renewed every 2–3 hr.
The separation of different calcium current types in rat RGCs was based on pharmacological properties (Guenther et al., 1994a; Rothe and Grantyn, 1994; Schmid and Guenther, 1996). Drugs were applied by the six-barrel superfusion pipette in the following order: ω-conotoxin GVIA (5 μm; Alomone Labs), which irreversibly block the N-type calcium channel, then nitrendipine (50 μm; Bayer AG, Wuppertal, Germany) [or alternatively nifedipine (50 μm; Sigma) plus diltiazem (50 μm; Sigma), which together had the same blocking efficiency as nitrendipine] to block the remaining L-type calcium channel, and finally cadmium (1 mm; Sigma), as an unspecific calcium channel blocker to block the remaining toxin-resistant current. Additionally, ω-conotoxin MVIIC (2 μm; Sigma) and ω-agatoxin IVA (100 nm) were applied in some experiments after dihydropyridine (DHP) application to test the sensitivity of the toxin-resistant calcium current for these drugs. All drugs were diluted in oxygenated ec2.
RESULTS
Expression of voltage-activated calcium currents
As reported before (Schmid and Guenther, 1996), voltage-activated calcium currents were expressed in RGCs from E17 on and were exclusively of a low-voltage-activating (LVA) type at this developmental stage (Fig.1A). The number of RGCs expressing LVA currents decreased in subsequent stages, and no LVA current was detected in adult RGCs. LVA currents were not analyzed further in the present study. High-voltage-activating (HVA) calcium currents were expressed from E20 on (Fig. 1A). The peak amplitude and current density of total calcium currents increased from −26 pA (±5, n = 6) and −16 pA/pF (±3,n = 6) at E17 to −326 pA (±28, n = 50) and −115 pA/pF (±9, n = 50) in the adult stage, respectively (Schmid and Guenther, 1996). The HVA current consisted of three pharmacologically distinct types: a ω-conotoxin GVIA-sensitive current, a DHP-sensitive current, and a toxin-resistant current type, which could not be blocked with any specific calcium channel blocker (Fig. 1B). The ratio of these current types did not significantly change during development except for a small decrease in ω-conotoxin GVIA-sensitive current between P11 and the adult stage; this was significant with p < 0.01 (Kruskal–Wallis test) (Fig. 1C).
Fig. 1.

A, Calcium current (ICa) traces from three different developmental stages, elicited by depolarization from the holding potential of −80 mV to different membrane potentials between −70 and +20 mV for 120 mV. The ICa in RGCs of E17 is exclusively of the LVA type and is completely inactivated within 120 msec. The first HVA currents are expressed at E20.ICa is almost completely sustained in adult RGCs. Calibration bars, 50 pA. B, TotalICa of an adult RGC elicited by depolarization from −80 to −10 mV for 120 msec. The application of the specific N-type channel blocker ω-conotoxin GVIA and the L-type channel blocker nifedipine (a dihydropyridine) plus diltiazem reduced total ICa, whereas application of the Q-type channel blocker ω-agatoxin IVA and ω-conotoxin MVIIC had no further effect on ICa. The toxin-resistant calcium current was blocked by the unspecific calcium channel blocker cadmium. Calibration bar, 100 pA. C, Ratio of the ω-conotoxin GVIA-sensitive, the dihydropyridine-sensitive, and the toxin-resistant calcium current subtype at different developmental stages. Values were determined by the percentage of peak calcium current at −10 mV that could be blocked by either ω-conotoxin GVIA or subsequent application of dihydropyridines or was toxin resistant. Only the decrease of the ω-conotoxin GVIA-sensitive current at the adult stage marked by an asterisk is significant (Kruskal–Wallis test, p < 0.01). Forn see Table 1. The number of different animals always exceeds n/2. Vertical bars indicate SE.
Developmental changes in current–voltage relations
To elicit HVA calcium currents, RGCs were successively depolarized for 120 msec to different membrane potentials between −70 and 20 mV in steps of 10 mV, starting from a holding potential of −80 mV. Figure2 shows the current–voltage relation (I–V plot) of the calcium currents at different developmental stages. Calcium currents were elicited at E20 by depolarization positive to −50 mV, and the maximum calcium inward current was reached in all embryonic RGCs at a membrane potential of 0 mV (Fig. 2, ●). Depolarization to more positive membrane potentials resulted in a decrease of the calcium current amplitudes, and calcium currents finally reversed around +40 mV.
Fig. 2.

Current–voltage relation (I–Vplot) of peak ICa from four different stages. The amplitude of peak ICa increased, and the voltage of maximum ICa shifted from 0 to −10 mV during development. The holding potential was always −80 mV, n = 13 at E20, n = 12 at P3–P5, n = 10 at P10–P12, andn = 28 at the adult stage. Vertical bars indicate SE.
In subsequent stages, an increasing number of RGCs had a maximum total calcium current at membrane potentials of −10 mV, resulting in meanI–V plots with a maximum between 0 and −10 mV (Fig. 2, ▴ and ▾). Adult RGCs, however, all showed a maximum inward calcium current at a membrane potential of −10 mV (Fig. 2, ♦).
The specific channel blocker ω-conotoxin GVIA and dihydropyridine were applied to clarify which types of calcium currents are responsible for the developmental shift in the current–voltage relation. This is illustrated for an RGC at the stages P3–5 (Fig.3A) and in the adult (Fig.3B). In embryonic and early postnatal RGCs, application of ω-conotoxin GVIA resulted in a shift of maximum calcium current from the control value of 0 to −10 mV in all cells tested. In contrast, no shift was observed after application of ω-conotoxin GVIA in adult RGCs where the control value was already −10 mV (Fig. 3B). Further application of dihydropyridines did not shift theI–V relation of calcium currents in any developmental stage. Moreover, application of dihydropyridines before that of ω-conotoxin GVIA had no effect on the I–V relation at any developmental stage (data not shown).
Fig. 3.

I–V plots of peakICa before and after subsequent application of ω-conotoxin GVIA and dihydropyridines from an RGC of P3–P5 (A) and the adult stage (B). Although the application of ω-conotoxin GVIA shifted the maximum ICa from 0 to −10 mV in P3–P5, there was no shifting effect in adult RGCs or after the application of dihydropyridines. Note the different scales of the current amplitudes.
To confirm our suggestion that the developmental shift in maximum current–voltage is caused by a shift in the ω-conotoxin GVIA-sensitive calcium current subtype, the whole-cell calcium current after the application of ω-conotoxin GVIA was subtracted from the control calcium current for each RGC. The I–V relation of the resulting ω-conotoxin GVIA-sensitive subtype always revealed a maximum at +10 mV at prenatal and neonatal stages, whereas it was at −10 mV in adult RGCs (Fig.4A). Tail current analysis of the ω-conotoxin GVIA-sensitive currents are shown in Figure 4B. The activation curves of whole-cell tail currents were fitted with the Boltzmann equation and revealed a shift in half activation of 12.5 mV from −7 mV at P3–5 to −19.5 in the adult.
Fig. 4.

A, The ω-conotoxin GVIA-sensitiveICa during development. MeanI–V plots of the ω-conotoxin GVIA-sensitiveICa of RGCs at stages E20, P3–P5, and in the adult (n = 5 for E20, n = 14 for P3–P5, and n = 18 for the adult). The maximum of the ω-conotoxin GVIA-sensitive calcium current shifted from +10 to −10 mV between E20 and the adult. Vertical bars indicate SE. B, Tail current analysis of the ω-conotoxin GVIA-sensitive ICa. The activation curves of the tail currents at different test potentials were fitted by the Boltzmann equation f(x) =a/(1 + exp((Va1/2 − Vm)/k)). The membrane potential of half activation Va1/2 shifted from −7 mV at P3–P5 to −19.5 mV at the adult (n = 14 for P3–P5 and n = 18 for the adult). Vertical bars indicate SD.
Developmental alterations in activation kinetics of calcium currents
The time constant of activation (τac) and time-to-peak (tp) current values were determined (see Materials and Methods) to analyze activation kinetics for the different types of voltage-activated calcium currents. Both parameters were strongly voltage dependent at all developmental stages and did not significantly change during development at test potentials between −50 and −20 mV (Student’s t test, p < 0.001). Figure 5 shows the mean time constants of activation and time-to-peak values of 12 adult RGCs before and after application of ω-conotoxin GVIA. Both parameters showed an increase for total calcium current within a potential range between −20 and 0 mV (Fig. 5, ●). This increase was caused by activation of the ω-conotoxin GVIA-sensitive current because it was abolished by blocking this calcium current subtype (Fig. 5, diamonds). Thus the ω-conotoxin GVIA-sensitive current is a slowly activating calcium current subtype compared with the other subtypes. This can be seen in Figure 6, where typical examples for the total calcium current and the different isolated calcium current subtypes are shown for an adult RGC. Time constants of activation, tp values, and inactivation rates are indicated. The ω-conotoxin GVIA-sensitive current displayed markedly slower kinetics than the two other calcium current subtypes in all RGCs tested.
Fig. 5.

Voltage dependence of time-to-peak (tp) and the time constant of activation (τac). For determination of values see Material and Methods. τac was determined by a single exponential function because multiple exponential functions did not reveal better fits. Values for mean tp (top) and τac(bottom) of the total ICa(●) in adult RGCs decrease at larger depolarization and show a transient increase between membrane potentials of −20 and +10 mV. This increase is eliminated by the application of ω-conotoxin GVIA (diamonds), indicating that the ω-conotoxin GVIA-sensitive current, which activates at membrane potentials positive from −20 mV, is a slowly activating current subtype. Bars indicate SE.n = 12, each stage. The inset in the bottom graph illustrates the determination of τac of an original whole-cell calcium current trace of an adult RGC at a membrane potential of −10 mV. The fitting region is indicated by two arrows.
Fig. 6.

Current traces of the different calcium current subtypes at depolarizations to a membrane potential to −10 mV. Current traces of an adult RGC before and after application of ω-conotoxin GVIA and subsequent application of dihydropyridines were subtracted to isolate the pharmacologically distinct calcium current subtypes (also see Materials and Methods). Time-to-peak (tp), time constant of activation (τac), and inactivation rates are indicated. In this example, 20% of the DHP-sensitive calcium current inactivated, whereas the ω-conotoxin GVIA-sensitive calcium current did not inactivate at all. In some other RGCs, the DHP-sensitive current did not inactivate or both current types partly inactivated.
Inactivation of calcium currents
Calcium current inactivation rates in the present study indicated the percentage of maximum calcium currents that were inactivated at the end of a 120 msec test pulse. We found a significant decrease in calcium current inactivation rates during RGC development. The total calcium current inactivation rate was always near 100% at E17, when only transient LVA currents were expressed (Fig. 1A). In subsequent stages, mean inactivation rates at a test potential of −10 mV decreased significantly from 43% (±21, n = 11) at E20/21 to 18% (±12, n = 28) in adult RGCs (Student’s t test, p < 0.001) (Table1).
Table 1.
Inactivation rates of calcium channel subtypes at different developmental stages
| Stage | n | Whole-cell calcium current | ω-Conotoxin GVIA-sensitive current | DHP-sensitive current | Toxin-resistant current |
|---|---|---|---|---|---|
| E20 | 11 | 43 ± 21 (0, 45) | 11 ± 18 (0, 50) | 7 ± 7 (0, 50) | 65 ± 24 (58, 100) |
| P1–P2 | 9 | 40 ± 14 (0, 50) | 12 ± 16 (0, 43) | 3 ± 6 (0, 14) | 90 ± 12 (68, 100) |
| P3–P5 | 8 | 31 ± 16 (18, 55) | 9 ± 16 (0, 48) | 14 ± 25 (0, 70) | 89 ± 19 (44, 99) |
| P6–P9 | 5 | 35 ± 18 (10, 58) | 20 ± 28 (0, 60) | 11 ± 15 (0, 32) | 80 ± 19 (56, 98) |
| P10–P12 | 8 | 33 ± 10 (18, 64) | 8 ± 15 (0, 47) | 20 ± 34 (0, 80) | 67 ± 21 (44, 98) |
| Adult | 23 | 18 ± 12 (10, 82) | 12 ± 19 (0, 70) | 15 ± 22 (0, 70) | 20 ± 12 (7, 49) |
Mean inactivation rates (in percent) of the different calcium channel subtypes during a 120 msec test pulse from −80 to −10 mV. Mean values and SEs are shown. The lowest and highest inactivation rates for each current subtype and stage are shown in parentheses. The number of different animals per stage always exceedsn/2.
Pharmacological separation of different calcium current subtypes revealed large variations in the inactivation rates of the same current subtype in different RGCs of the same developmental stage, especially for the ω-conotoxin GVIA-sensitive and the dihydropyridine-sensitive calcium current type. The mean inactivation rates of the total calcium current and the three calcium current subtypes are shown in Table 1. The lowest and highest inactivation rates are indicated in brackets. Interestingly, there are RGCs in which either the ω-conotoxin GVIA-sensitive or the DHP-sensitive current type was not inactivated at all, in contrast to RGCs in which both current types were partly inactivated. RGCs in which both current types showed no inactivation were not found. The mean rate of inactivation of the ω-conotoxin GVIA-sensitive or the DHP-sensitive calcium current subtypes showed no relation to RGC age (Table 1).
In contrast, the toxin-resistant current subtype was always at least partly inactivated, and mean inactivation rates of this current type continuously decreased from 90% (±12, n = 9) in neonatal animals to 20% (±12, n = 23) in adults (Fig. 7; Table 1). We thus think that the toxin-resistant current is a likely candidatefor mediation of the decreased inactivation rate of total calcium current during development. The downregulation of the ω-conotoxin GVIA-sensitive current, however, may contribute a certain amount to this effect.
Fig. 7.

Original recordings of the toxin-resistant calcium current in a P2 and an adult RGC. During a depolarizing test pulse from −80 to −10 mV for 120 msec, the toxin-resistant calcium current inactivated almost completely at P2 (81%), whereas only 29% of the toxin-resistant calcium current was inactivated at the adult.
Steady-state inactivation
The steady-state inactivation of calcium currents at different developmental stages was investigated by depolarization to −10 mV for 120 msec from holding potentials between −100 and −10 mV, which were applied for 1.2 sec. Figure 8 shows the mean steady-state inactivation curves for the total calcium current at three different stages and the original calcium current traces of an embryonic (E20) and an adult RGC. The separation of different calcium current subtypes with specific antagonists was not possible here because recovery of calcium currents was incomplete after a steady-state protocol. Steady-state inactivation curves were sigmoid in embryonic stages but showed a linear slope for holding potentials beyond −70 mV in postnatal RGCs (Fig. 8, left). This can be explained by the fact that the transient component of the total calcium current, which was more prominent in prenatal and neonatal stages (Fig.8, right; Table 1), was inactivated almost completely at holding potentials between −70 and −50 mV, whereas the sustained calcium current component was inactivated only gradually between −70 and −10 mV, linear to the membrane potential.
Fig. 8.

Steady-state inactivation ofICa at different developmental stages. A test pulse to 0 mV was applied from holding potentials varying from −100 to −10 mV. The peak current amplitudes of each cell were standardized to the maximum calcium current. The I–Vplot shows the mean standardized current amplitude for E20 (n = 10), P3–P5 (n = 5), and adult (n = 5) with SE (left). A large fraction of total ICa in E20 inactivated between −70 and −50 mV, whereas in the other stages steady-state inactivation was nearly linear to voltage. The original current traces (right) show that the strong inactivation between −70 and −50 mV at E20 was caused by the inactivation of the transient current component. There are large capacitive currents at the beginning and end of the test pulses because they could not be compensated at this pulse protocol.
Deactivation of calcium currents
To estimate deactivation kinetics of the total calcium currents, the deactivation time constant (τdeac) was determined by fitting a single exponential function to the calcium tail current at the end of the test pulse (Fig.9A). As shown in Figure9B (squares), τdeac showed no voltage dependence in adult RGCs. The values for τdeacwere ∼0.4 msec at all membrane potentials tested, and there was only a small variation between different RGCs (Fig. 9C,squares). In contrast, values for τdeac were markedly higher in prenatal and early postnatal stages, especially at P3–5 (Fig. 9A,B). Figure 9C shows the original values of τdeac for all RGCs investigated from stages P3–5 (▴) and the adult (■). In most RGCs of P3–5, τdeac was increased, resulting in mean values of ∼1.5 msec for membrane potentials positive to 0 mV, but single values ranged from 0.2 to 3.3 msec.
Fig. 9.
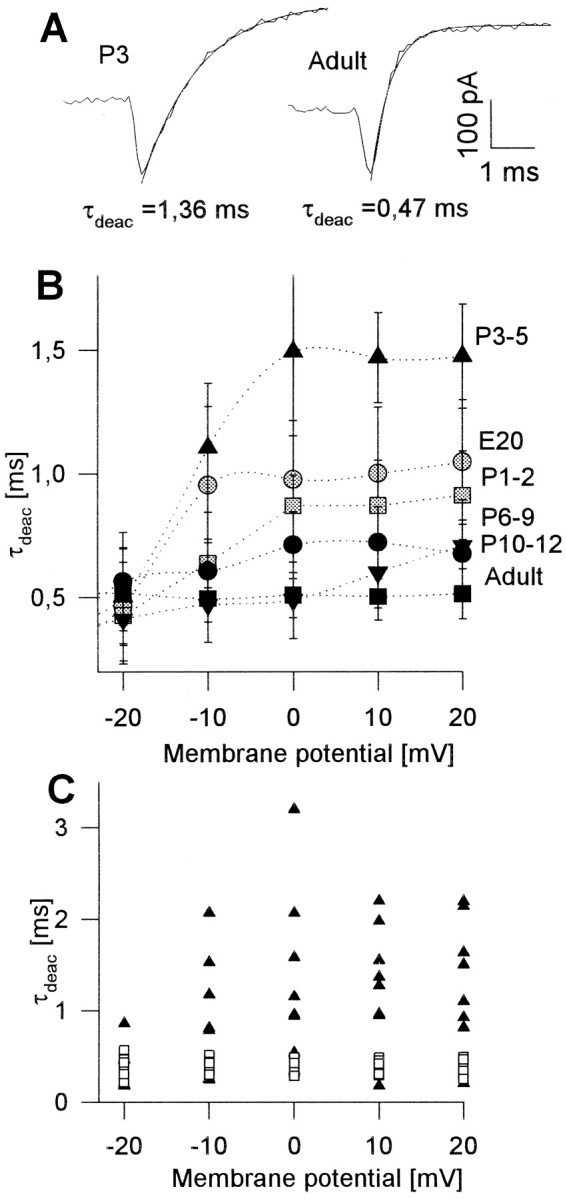
Time constant of deactivation ofICa at different developmental stages.A, Original recordings of total calcium currents at repolarization from −10 to −80 mV for a RGC from P3 (left) and adult (right). Single exponential curves were fitted to determine the time constants of deactivation τdeac (see Material and Methods).B, Mean values for the time constant of deactivation (τdeac) of ICa at repolarization to −80 mV from different test potentials for all developmental stages. The mean values of τdeac for embryonic ICa and especially forICa from P3–5 RGCs, as well as the SE, are markedly increased. C, Original values of τdeac for ICa of adult RGCs (■) are all ∼0.4 msec, whereas values of τdeacfor P3–P5 RGCs (●) show large variations between 0.2 and 3.3 msec.
Application of ω-conotoxin GVIA and further application of dihydropyridine had no significant influence on τdeac. For example, τdeac was 0.386 msec (±0.024;n = 9) for the control current, 0.325 msec (±0.053;n = 9) after application of ω-conotoxin GVIA, and 0.319 msec (±0.024; n = 9) after additional application of dihydropyridine in adult RGCs at a test potential of 10 mV (not significant, paired Student’s t test). This was also true for RGCs of P3–5. Thus the transient increase of τdeac in prenatal and neonatal stages, especially in P3–5, was caused not by the slow deactivation of only one calcium channel subtype but by the slow deactivation of all three calcium channel subtypes.
DISCUSSION
This study aimed at determining the time windows within which distinct alterations in calcium channel properties take place that might be relevant for processes of RGC differentiation and retinal wiring. The data acquired by this study thus provide a detailed description of the expression and kinetic properties of voltage-activated calcium channels in rat retinal ganglion cells during the whole period of development. On the basis of the results presented here, it will now be possible to perform more sophisticated functional analysis at distinct points of retinal development.
HVA calcium currents were expressed in RGCs from E21 on. Rörig and Grantyn (1994) showed an onset of HVA current expression in mouse RGCs from E18 on. This corresponds well with our data, because gestation in mice is 2–3 d shorter than in rats. A role of N-type calcium channels in migration processes as proposed by Komuro and Rakic (1992) can therefore be excluded, because rat RGCs migrate into the ganglion cell layer between E14 and E20 (Bunt et al., 1983).
Perforated patch recordings of RGCs from prenatal to postnatal stages revealed several alterations in kinetic properties of whole-cell calcium currents: (1) an increase in total calcium current density; (2) a shift in the potential of peak ω-conotoxin GVIA-sensitive current from +10 to −10 mV; (3) a decrease in the inactivation rate, probably attributable to the decrease in the toxin-resistant current inactivation rate; (4) a decreased steady-state inactivation for holding potentials beyond −70 mV; and (5) a transient slowing of deactivation kinetics of all calcium current types peaking at P3–5.
Alterations in current densities
An increase in the density of HVA calcium currents between onset of channel expression and adulthood has already been shown for many ion channels in different neuronal cell types and may be a common feature of ion channels during neuronal development. In contrast, the expression of LVA calcium channels was downregulated during RGC differentiation in rats. This has also been shown in sensory neurons and motoneurons of the chick (Gottmann et al., 1988, 1991; McCobb et al., 1989), in amphibian spinal neurons (Barish, 1986), in mammalian hippocampal neurons (Yaari et al., 1987), and in rat dorsal root ganglion cells (Lovinger and White, 1989). A specific role of LVA currents in early neuronal development has therefore been proposed (Bertolino and Llinàs, 1992; Spitzer, 1994) but cannot yet be related to distinct processes.
Alterations in kinetic properties
Along with the increase in total calcium current amplitude we found a shift in the current–voltage relation that was caused by a shift in the I–V relation of the whole-cell ω-conotoxin GVIA-sensitive current toward more negative potentials.
Such activation shifts have been shown for sodium currents (Park and Ahmed, 1991; Skaliora et al., 1993; Schmid and Guenther, 1998) and recently for calcium currents in acute isolated neocortex neurons of the rat (Lorenzon and Foehring, 1995). Because the activation of all calcium current types shifted in the latter study toward more negative potentials, the authors could not exclude systematic errors attributable to an increase in series resistance during development. In the present study, however, only the ω-conotoxin GVIA-sensitive current subtype showed a shift in I–V relation. Moreover, systematic errors were not responsible for the developmental shift in calcium current–voltage relation during RGC development, because series resistances were controlled and showed no developmental alterations. The restriction of this effect to only one specific calcium current subtype indicates a differential regulation of this current type during RGC development. This may be based on molecular alterations in one subunit or/and alterations in the subunit composition of the ion channel (see below).
A differential regulation of channel subunits may also have been responsible for the reduction in the inactivation rate of the toxin-resistant current between P10 and P12 and the adult. Interestingly, Rossi et al. (1994) reported kinetic changes of calcium currents in rat cerebellar granule cells during postnatal development and described a similar reduction in total calcium current inactivation rates from 50% to 10–20%. Unfortunately, different calcium current subtypes were not pharmacologically distinguished in that study. The authors also described a developmental reduction of steady-state inactivation at a membrane potential of approximately −50 mV because of the reduction of the transient current component during development. Steady-state inactivation curves of calcium currents in cerebellar granule cells of P11 and P24 in that study showed a striking similarity to the steady-state inactivation curves in RGCs in our study at stages E20/21 and P3/5 or the adult (Fig. 7). These kinetic alterations may therefore reflect a more general feature of maturing neurons.
Because both the activation shift of macroscopic current and the decrease of inactivation rate of ICa be related to specific calcium channel subtypes, it would be interesting to know whether these alterations are determined by alterations in the molecular organization of these channel subtypes. The single-cell RT-PCR method provides a powerful tool for that kind of analysis (Schmid et al., 1998).
Another important finding of the present study was the transient slowing of calcium current deactivation in the embryonic and neonatal stages. To exclude systematic errors, other parameters such as series resistance, I–V relation of voltage-gated currents, amplitudes, and the adequacy of space clamp were checked for all cells and showed no significant deviations from mean values. To our knowledge, this is the first time that transient alterations in kinetic properties of ion channels during neuronal differentiation have been described in situ. Most previous studies compared only two clearly distinct developmental stages, and transient kinetic alterations were thus probably not detected previously (Park and Ahmed, 1991; Skaliora et al., 1993); however, they cannot be excluded for other developing neurons.
Because all subtypes of voltage-activated calcium currents showed this transient slowing of deactivation, a general mechanism that originates somewhere in the cell metabolism may cause this alteration rather than a differential regulation of ion channel subunits. Interestingly, the slowing of calcium current deactivation coincides with the slowing of voltage-activated sodium current kinetics (Schmid and Guenther, 1998), a process that results in broader action potentials and a larger sodium ion influx. Because sodium currents have been shown to play a crucial role in the formation and refinement of retinotectal projections (O’Leary et al., 1986; Wong et al., 1993; Olson and Meyer, 1994), it is an attractive idea that differential tuning of sodium current activity determines the wiring of retinotectal projections.
The interpretation of the slowing of calcium current deactivation during the same period of development is much more difficult. Slow current deactivation as well as the described shift of the ω-conotoxin GVIA-sensitive current, the reduction in steady-state inactivation, and the inactivation rate lead to an increase in calcium ion influx. It remains to be determined by calcium imaging experiments whether these kinetic alterations all lead to a rise of intracellular free calcium, which in turn could trigger various differentiation processes, such as calcium release from intracellular calcium stores or gene transcription by calcium-regulated transcription factors (for review, see Gallin and Greenberg, 1995).
Time windows of calcium current alterations
The shift of the ω-conotoxin GVIA-sensitive current and the reduction of the inactivation rate of the toxin-resistant current occur at the second postnatal week, which is a period of extensive dendritic differentiation and remodeling. Because an increase in intracellular calcium after voltage-dependent calcium channel activation has been shown to be crucial for neurite outgrowth in amphibian spinal cord neurons and rat dorsal root ganglion cells (Holliday and Spitzer, 1993;Kocsis et al., 1994), the dendritic differentiation in RGCs might also be regulated by the activation of specific voltage-gated calcium channels. Immunocytochemical examination of the subcellular distribution of the ω-conotoxin GVIA-sensitive and the toxin-resistant calcium channel during this specific time period could give further insights into their possible role in dendritic differentiation processes.
In contrast, the alterations of steady-state inactivation and deactivation time constants of ICa cannot be related to a specific calcium channel subtype and occur mainly in the first postnatal week, the period of maximum programmed cell death (Potts et al., 1982). Nearly 50% of RGCs die within the first 2 weeks of postnatal development because of apoptotic processes that have been shown to be triggered by elevated intracellular calcium levels [Wyllie (1980); for review, see Orrenius and Nicotera (1994)]. This again points to the importance of calcium imaging experiments during this critical period of RGC development to analyze the relation between kinetic alterations described here and changes in intracellular calcium concentration.
There is evidence that those RGCs that did not make proper connections within their target tissue predominantly died because of a lack of neurotrophins (O’Leary et al., 1986; Cui and Harvey, 1995; Ma et al., 1998). Interestingly, Levine et al. (1995b) described an increase of HVA calcium currents by neurotrophins, and Franklin et al. (1995) found that activation of voltage-activated calcium channels can substitute for trophic factors in promoting cell survival of neurons that would otherwise undergo programmed cell death. Thus there is evidence that voltage-activated calcium currents are involved in mediating naturally occurring apoptotic cell death, and the modulation of their kinetic properties by neurotrophic factors is one way in which this could occur. Because the slowing of deactivation and the reduction of steady-state inactivation coincidences with the period of natural cell death, it will also be necessary to investigate the effect of different neurotrophins on these kinetic properties of voltage-activated calcium currents.
In summary, the present study provided insight into the regulation of voltage-activated calcium channels during RGC differentiation and gives some ideas about their possible role in developmental processes within the retina. Because alterations of calcium channel properties occur almost exclusively within the first or second postnatal week, we conjecture that they are mainly related to either cell death or dendritic differentiation processes. When RGCs receive the first visual input at ages around P16–18, the properties of calcium currents are already the same as in adult RGCs, indicating that the visual input does not provide any trigger for further developmental changes.
Footnotes
This work was funded by the “Graduiertenkolleg Neurobiologie” Tuebingen (German Research Council).
Correspondence should be addressed to Dr. Elke Guenther, Experimental Ophthalmology, University Eye Hospital, Roentgenweg 11, D-72076 Tuebingen, Germany.
REFERENCES
- 1.Barish ME. Differentiation of voltage-gated potassium current and modulation of excitability in cultured amphibian spinal neurons. J Physiol (Lond) 1986;375:229–250. doi: 10.1113/jphysiol.1986.sp016114. [DOI] [PMC free article] [PubMed] [Google Scholar]
- 2.Bertolino M, Llinàs RR. The central role of voltage-activated and receptor-operated calcium channels in neuronal cells. Annu Rev Pharmacol Toxicol. 1992;32:399–421. doi: 10.1146/annurev.pa.32.040192.002151. [DOI] [PubMed] [Google Scholar]
- 3.Bindokas VP, Ishida AT. Conotoxin-sensitive and conotoxin-resistant Ca2+ currents in fish retinal ganglion cells. J Neurobiol. 1996;29:429–444. doi: 10.1002/(SICI)1097-4695(199604)29:4<429::AID-NEU2>3.0.CO;2-A. [DOI] [PubMed] [Google Scholar]
- 4.Bunt SM, Lund RD, Land PW. Prenatal development of the optic projection in albino and hooded rats. Dev Brain Res. 1983;6:149–168. doi: 10.1016/0165-3806(83)90093-7. [DOI] [PubMed] [Google Scholar]
- 5.Castillo B, Jr, del Cerro M, Breakefield XO, Frim DM, Barnstable CJ, Dean DO, Bohn MC. Retinal ganglion cell survival is promoted by genetically modified astrocytes designed to secrete brain-derived neurotrophic factor (BDNF). Brain Res. 1994;647:30–36. doi: 10.1016/0006-8993(94)91395-1. [DOI] [PubMed] [Google Scholar]
- 6.Cohen A, Bray GM, Aguayo AJ. Neurotrophin-4/5 (NT-4/5) increases adult rat retinal ganglion cell survival and neurite outgrowth in vitro. J Neurobiol. 1994;25:953–959. doi: 10.1002/neu.480250805. [DOI] [PubMed] [Google Scholar]
- 7.Collins F, Schmidt MF, Guthrie PB, Kater SB. Sustained increase in intracellular calcium promotes neuronal survival. J Neurosci. 1991;11:2582–2587. doi: 10.1523/JNEUROSCI.11-08-02582.1991. [DOI] [PMC free article] [PubMed] [Google Scholar]
- 8.Cui Q, Harvey AR. NT-4/5 reduces naturally occurring retinal ganglion cell death in neonatal rats. NeuroReport. 1994;5:1882–1884. doi: 10.1097/00001756-199410000-00010. [DOI] [PubMed] [Google Scholar]
- 9.Cui Q, Harvey AR. At least two mechanisms are involved in the death of retinal ganglion cells following target ablation in neonatal rats. J Neurosci. 1995;15:8143–8155. doi: 10.1523/JNEUROSCI.15-12-08143.1995. [DOI] [PMC free article] [PubMed] [Google Scholar]
- 10.Doherty P, Walsh FS. Signal transduction events underlying neurite outgrowth stimulated by cell adhesion molecules. Curr Opin Neurobiol. 1994;4:49–55. doi: 10.1016/0959-4388(94)90031-0. [DOI] [PubMed] [Google Scholar]
- 11.Eschweiler GW, Bähr M. Flunarizine enhances rat retinal ganglion cell survival after axotomy. J Neurol Sci. 1993;116:43–40. doi: 10.1016/0022-510x(93)90086-e. [DOI] [PubMed] [Google Scholar]
- 12.Franklin JL, Sanz-Rodriguez C, Juhasz A, Deckwerth TL, Johnson EM., Jr Chronic depolarization prevents programmed cell death of sympathetic neurons in vitro but does not support growth: requirement for Ca2+ influx but not Trk activation. J Neurosci. 1995;15:643–664. doi: 10.1523/JNEUROSCI.15-01-00643.1995. [DOI] [PMC free article] [PubMed] [Google Scholar]
- 13.Gallin WJ, Greenberg ME. Calcium regulation of gene expression in neurons: the mode of entry matters. Curr Opinion Neurobiol. 1995;5:367–374. doi: 10.1016/0959-4388(95)80050-6. [DOI] [PubMed] [Google Scholar]
- 14.Gottmann K, Dietzel ID, Lux HD, Huck S, Rohrer H. Development of inward currents in chick sensory and autonomic neuronal precursor cells in culture. J Neurosci. 1988;8:3722–3732. doi: 10.1523/JNEUROSCI.08-10-03722.1988. [DOI] [PMC free article] [PubMed] [Google Scholar]
- 15.Gottmann K, Rohrer H, Lux HD. Distribution of Ca2+ and Na+ conductances during neuronal differentiation of chick DRG precursor cells. J Neurosci. 1991;11:3371–3378. doi: 10.1523/JNEUROSCI.11-11-03371.1991. [DOI] [PMC free article] [PubMed] [Google Scholar]
- 16.Gu X, Olson EC, Spitzer NC. Spontaneous neuronal calcium spikes and waves during early differentiation. J Neurosci. 1994;14:6325–6335. doi: 10.1523/JNEUROSCI.14-11-06325.1994. [DOI] [PMC free article] [PubMed] [Google Scholar]
- 17.Guenther E, Rothe T, Taschenberger H, Grantyn R. Separation of calcium currents in retinal ganglion cells from postnatal rat. Brain Res. 1994a;633:223–235. doi: 10.1016/0006-8993(94)91543-1. [DOI] [PubMed] [Google Scholar]
- 18.Guenther E, Schmid S, Grantyn R, Zrenner E. In vitro identification of retinal ganglion cells of all stages of development without the need of any dye labeling. J Neurosci Methods. 1994b;51:177–181. doi: 10.1016/0165-0270(94)90008-6. [DOI] [PubMed] [Google Scholar]
- 19.Holliday J, Spitzer NC. Calcium regulates neuronal differentiation both directly and via co-cultured myocytes. J Neurobiol. 1993;24:506–514. doi: 10.1002/neu.480240408. [DOI] [PubMed] [Google Scholar]
- 20.Ishida AT. Regenerative sodium and calcium currents in goldfish retinal ganglion cell somata. Vision Res. 1991;31:477–485. doi: 10.1016/0042-6989(91)90099-q. [DOI] [PubMed] [Google Scholar]
- 21.Kaneda M, Kaneko A. Voltage-gated calcium currents in isolated retinal ganglion cells of the cat. Jpn J Physiol. 1991;41:35–48. doi: 10.2170/jjphysiol.41.35. [DOI] [PubMed] [Google Scholar]
- 22.Karschin A, Lipton SA. Calcium channels in solitary retinal ganglion cells from post-natal rat. J Physiol (Lond) 1989;418:379–396. doi: 10.1113/jphysiol.1989.sp017847. [DOI] [PMC free article] [PubMed] [Google Scholar]
- 23.Kocsis JD, Rand MN, Lankford KL, Waxman SG. Intracellular calcium mobilization and neurite outgrowth in mammalian neurons. J Neurobiol. 1994;25:252–264. doi: 10.1002/neu.480250306. [DOI] [PubMed] [Google Scholar]
- 24.Komuro H, Rakic P. Selective role of N-type calcium channels in neuronal migration. Science. 1992;257:806–809. doi: 10.1126/science.1323145. [DOI] [PubMed] [Google Scholar]
- 25.Levine ES, Dreyfus CF, Black IB, Plummer MR. Brain-derived neurotrophic factor rapidly enhances synaptic transmission in hippocampal neurons via postsynaptic tyrosine kinase receptors. Proc Natl Acad Sci USA. 1995a;92:8074–8077. doi: 10.1073/pnas.92.17.8074. [DOI] [PMC free article] [PubMed] [Google Scholar]
- 26.Levine ES, Dreyfus CF, Black IB, Plummer MR. Differential effects of NGF and BDNF on voltage-gated calcium currents in embryonic basal forebrain neurons. J Neurosci. 1995b;15:3084–3094. doi: 10.1523/JNEUROSCI.15-04-03084.1995. [DOI] [PMC free article] [PubMed] [Google Scholar]
- 27.Lipton SA, Tauck DL. Voltage-dependent conductances of solitary ganglion cells dissociated from the rat retina. J Physiol (Lond) 1987;385:361–391. doi: 10.1113/jphysiol.1987.sp016497. [DOI] [PMC free article] [PubMed] [Google Scholar]
- 28.Liu Y, Lasater EM. Calcium currents in turtle retinal ganglion cells. I. The properties of T- and L-type currents. J Neurophysiol. 1994;71:733–742. doi: 10.1152/jn.1994.71.2.733. [DOI] [PubMed] [Google Scholar]
- 29.Lorenzon NM, Foehring RC. Characterization of pharmacologically identified voltage-gated calcium channel currents in acutely isolated rat neocortical neurons. II. Postnatal development. J Neurophysiol. 1995;71:733–742. doi: 10.1152/jn.1995.73.4.1443. [DOI] [PubMed] [Google Scholar]
- 30.Lovinger DM, White G. Postnatal development of burst firing behavior and the low-threshold transient calcium current examined using isolated neurons from rat dorsal root ganglia. Neurosci Lett. 1989;102:50–57. doi: 10.1016/0304-3940(89)90306-6. [DOI] [PubMed] [Google Scholar]
- 31.Ma Y-T, Hsieh T, Forbes ME, Johnson JE, Frost DE. BDNF injected into the superior colliculus reduces developmental retinal ganglion cell death. J Neurosci. 1998;18:2097–2107. doi: 10.1523/JNEUROSCI.18-06-02097.1998. [DOI] [PMC free article] [PubMed] [Google Scholar]
- 32.Mattson MP, Barger SW. Roles for calcium signaling in structural plasticity and pathology in the hippocampal system. Hippocampus. 1993;3:73–88. [PubMed] [Google Scholar]
- 33.McCobb DP, Best PM, Beam KG. Development alters the expression of calcium currents in chick limb motoneurons. Neuron. 1989;2:1633–1643. doi: 10.1016/0896-6273(89)90052-4. [DOI] [PubMed] [Google Scholar]
- 34.Meyer-Franke A, Kapan MR, Pfrieger FW, Barres BA. Characterization of the signaling interactions that promote the survival and growth of developing retinal ganglion cells in culture. Neuron. 1995;15:805–819. doi: 10.1016/0896-6273(95)90172-8. [DOI] [PubMed] [Google Scholar]
- 35.O’Leary DDM, Fawcett JW, Cowan WM. Topographic targeting errors in the retinocollicular projection and their elimination by selective ganglion cell death. J Neurosci. 1986;6:3692–3705. doi: 10.1523/JNEUROSCI.06-12-03692.1986. [DOI] [PMC free article] [PubMed] [Google Scholar]
- 36.Olson MD, Meyer RL. Normal activity dependent refinement in a compressed retinotectal projection in goldfish. J Comp Neurol. 1994;347:481–494. doi: 10.1002/cne.903470402. [DOI] [PubMed] [Google Scholar]
- 37.Orrenius S, Nicotera P. The calcium ion and cell death. J Neural Transm [Suppl] 1994;43:1–11. [PubMed] [Google Scholar]
- 38.Park CC, Ahmed Z. Characterization of sodium current in developing rat diencephalic neurons in serum-free culture. J Neurophysiol. 1991;65:1011–1021. doi: 10.1152/jn.1991.65.5.1011. [DOI] [PubMed] [Google Scholar]
- 39.Perry VH. The ganglion cell layer of the retina of the rat: a golgi study. Proc R Soc Lond B Biol Sci. 1979;204:363–375. doi: 10.1098/rspb.1979.0033. [DOI] [PubMed] [Google Scholar]
- 40.Perry VH, Henderson Z, Linden R. Postnatal changes in retinal ganglion cell and optic axon populations in the pigmented rat. J Comp Neurol. 1983;219:356–368. doi: 10.1002/cne.902190309. [DOI] [PubMed] [Google Scholar]
- 41.Potts RA, Dreher B, Bennett MR. The loss of ganglion cells in the developing retina of the rat. Dev Brain Res. 1982;3:481–486. doi: 10.1016/0165-3806(82)90013-x. [DOI] [PubMed] [Google Scholar]
- 42.Rakic P, Komuro H. The role of receptor/channel activity in neuronal cell migration. J Neurobiol. 1994;26:299–315. doi: 10.1002/neu.480260303. [DOI] [PubMed] [Google Scholar]
- 43.Rakic P, Cameron RS, Komuro H. Recognition, adhesion, transmembrane signaling and cell motility in guided neuronal migration. Curr Opin Neurobiol. 1994;4:63–69. doi: 10.1016/0959-4388(94)90033-7. [DOI] [PubMed] [Google Scholar]
- 44.Rörig B, Grantyn R. Ligand- and voltage-gated ion channels are expressed by embryonic mouse retinal neurons. NeuroReport. 1994;5:1197–1200. doi: 10.1097/00001756-199406020-00009. [DOI] [PubMed] [Google Scholar]
- 45.Rossi P, D’Angelo E, Magistretti J, Toselli M, Taglietti V. Age-dependent expression of high-voltage activated calcium currents during cerebellar granule cell development in situ. Pflügers Arch Eur J Physiol. 1994;429:107–116. doi: 10.1007/BF02584036. [DOI] [PubMed] [Google Scholar]
- 46.Rothe T, Grantyn R. Retinal ganglion neurons express a toxin-resistant developmentally regulated novel type of high-voltage-activated calcium channel. J Neurophysiol. 1994;72:2542–2546. doi: 10.1152/jn.1994.72.5.2542. [DOI] [PubMed] [Google Scholar]
- 47.Schmid S, Guenther E. Developmental regulation of voltage-activated Na+ and Ca2+ currents in rat retinal ganglion cells. NeuroReport. 1996;7:677–681. doi: 10.1097/00001756-199601310-00070. [DOI] [PubMed] [Google Scholar]
- 48.Schmid S, Guenther E. Alterations in key properties of the sodium current in retinal ganglion cells of the rat during in vivo differentiation. Neuroscience. 1998;85:249–258. doi: 10.1016/s0306-4522(97)00644-1. [DOI] [PubMed] [Google Scholar]
- 49.Schmid S, Fauser S, Wheeler-Schilling TH, Munz M, Guenther E. Molecular and functional properties of NMDA receptors in developing rat retinal ganglion cells. Invest Ophthal Vis Sci [Suppl] 1998;39:4534. [Google Scholar]
- 50.Skaliora I, Scobey RP, Chalupa LM. Prenatal development of excitability in cat retinal ganglion cells: action potentials and sodium currents. J Neurosci. 1993;13:313–323. doi: 10.1523/JNEUROSCI.13-01-00313.1993. [DOI] [PMC free article] [PubMed] [Google Scholar]
- 51.Spitzer NC. Spontaneous Ca2+ spikes and waves in embryonic neurons: signaling systems for differentiation. Trends Neurosci. 1994;17:115–118. doi: 10.1016/0166-2236(94)90120-1. [DOI] [PubMed] [Google Scholar]
- 52.Takuwa N, Zhou W, Takuwa Y. Calcium, calmodulin and cell cycle progression. Cell Signal. 1995;7:93–104. doi: 10.1016/0898-6568(94)00074-l. [DOI] [PubMed] [Google Scholar]
- 53.Tanaka S, Koike T. Up-regulation of L-type Ca2+ channel associated with the development of elevated K+-mediated survival of superior cervical ganglion cells in vitro. Dev Biol. 1995;168:166–178. doi: 10.1006/dbio.1995.1069. [DOI] [PubMed] [Google Scholar]
- 54.Thanos S, Mey J. Type-specific stabilization and target-dependent survival of regenerating ganglion cells in the retina of adult rats. J Neurosci. 1995;15:1057–1079. doi: 10.1523/JNEUROSCI.15-02-01057.1995. [DOI] [PMC free article] [PubMed] [Google Scholar]
- 55.Wolszon LR, Rehder V, Kater SB, Macagno ER. Calcium wave fronts that cross gap junctions may signal neuronal death during development. J Neurosci. 1994;14:3437–3448. doi: 10.1523/JNEUROSCI.14-06-03437.1994. [DOI] [PMC free article] [PubMed] [Google Scholar]
- 56.Wong ROL, Meister M, Shatz CJ. Transient period of correlated burst activity during development of the mammalian retina. Neuron. 1993;11:923–938. doi: 10.1016/0896-6273(93)90122-8. [DOI] [PubMed] [Google Scholar]
- 57.Wyllie AH. Glucocorticoid-induced thymocyte apoptosis is associated with endogenous endonuclease activation. Nature. 1980;284:555–556. doi: 10.1038/284555a0. [DOI] [PubMed] [Google Scholar]
- 58.Yaari Y, Hamon B, Lux HD. Development of two types of calcium channels in cultured mammalian hippocampal neurons. Science. 1987;235:680–682. doi: 10.1126/science.2433765. [DOI] [PubMed] [Google Scholar]
- 59.Yamasaki EN, Ramoa AS. Dendritic remodeling of retinal ganglion cells during development of the rat. J Comp Neurol. 1993;329:277–289. doi: 10.1002/cne.903290209. [DOI] [PubMed] [Google Scholar]