

Abstract
Sensorimotor transformations in the mammalian superior colliculus (SC) are mediated by large sets of distributed neurons. For such distributed coding systems, stimulus superposition poses problems attributable to the merging of neural populations coding for different stimuli. Such superposition problems could be overcome by synchronization of neuronal discharges, because it allows the selection of a subset of distributed responses for further joint processing. To assess the putative role of such a temporal binding mechanism in the SC, we have applied correlation analysis to visually evoked collicular activity. We performed recordings of single-unit and multiunit activity in the SC of anesthetized and paralyzed cats with multiple electrodes. Autocorrelation analysis revealed that collicular neurons often discharged in broad (20–100 msec) bursts or with an oscillatory patterning in the α- and β-frequency range. Significantly modulated cross-correlograms were observed in 50% (128 of 258) of the collicular multiunit recording pairs, and for these pairs significant correlations occurred in 44% of the stimulation epochs. For the single-unit pairs, significant interactions were observed in 14 of 48 cases studied (29%). Collicular cross-correlograms were often oscillatory, and these oscillations covered a broad frequency range of up to 100 Hz, with a predominance of oscillation frequencies in the α- and β-range. In the majority of the significant correlograms (64%) the phase lag of the center peak was <5 msec. The probability of collicular synchronization increased with the overlap of the receptive fields and the proximity of the recording sites. Correlations were also observed between cells in the superficial and deep SC layers. Collicular synchronization required activation of the respective cells with a single coherent stimulus and broke down when the neurons were activated with two different stimuli. These data are consistent with the notion that collicular synchrony could define assemblies of functionally related cells.
Keywords: synchronization, cell assembly, oscillation, cat, superior colliculus, correlation analysis
A wide variety of experimental findings support the idea that sensorimotor transformations in the mammalian superior colliculus (SC) are mediated by large populations of distributed neurons (McIlwain, 1991). The large size of the receptive and movement fields of collicular cells implies that individual sensory stimuli and orienting movements are associated with the activation of a large set of widely distributed neurons. Experiments based on focal pharmacological inactivation of parts of the SC demonstrate directly the distributed nature of collicular motor commands (Lee et al., 1988). The inactivation of a small part of the collicular motor map influences the metrics of a wide range of eye movements, indicating that movement parameters are specified by the joint and graded activation of large and distributed sets of neurons rather than by a small set of maximally activated cells. Inactivation and stimulation experiments suggest that the parameters of collicular orienting responses are determined by the average of the graded vectors represented by the population response. Such a distributed coding mechanism is robust against the loss of single processing elements and by means of averaging achieves great precision even with noisy processing elements.
However, in distributed coding systems ambiguities arise if multiple nearby stimuli are to be encoded because of the possibility that the respective populations of activated neurons overlap. If neural populations coding for different stimuli merge, this results in a loss of stimulus-specific information (von der Malsburg, 1986). To cope with this superposition problem, a mechanism is required to demarcate the neuron populations coding for different stimuli. Precise synchronization of neuronal discharges could accomplish the required segregation of population responses, provided that cells coding for one stimulus fire in synchrony but are not discharging synchronously with cells coding for another stimulus. In this way, spatially overlapping population responses can be disambiguated by rapid multiplexing on a time scale that is shorter than the overall duration of the responses (von der Malsburg, 1986, 1994). Support for such a mechanism comes from experiments on the visual cortex, which suggest that synchronization of neuronal responses serves the integration of activity into coherent representational states and the selection of distributed responses for further joint processing (Singer and Gray, 1995; Engel et al., 1997;Singer et al., 1997).
The goal of the present study was to investigate whether response synchronization occurs also in the SC and, if so, whether it exhibits a stimulus dependence compatible with a putative function in the disambiguation of population responses. To this end, we investigated with multielectrode recordings the temporal relations among collicular responses by applying cross-correlation techniques to visually evoked activity in the SC of anesthetized cats. To test the hypothesis that synchronization serves the disambiguation of overlapping populations, we analyzed whether collicular synchronization reflects the gestalt laws of perceptual grouping (Gray et al., 1989). In addition, we investigated whether temporal correlations exist between cells in the superficial and deep collicular layers (in the following, we refer to all layers below the stratum opticum as “deep collicular layers”). The functional relationship of superficial and deep collicular layers is one of the major unresolved issues of collicular physiology (Edwards, 1980; Sparks and Hartwich-Young, 1989; Moschovakis, 1997), and because correlation analysis had not been applied previously, we expected further insight from this approach.
MATERIALS AND METHODS
Preparation. Data were recorded from 15 adult anesthetized cats. Anesthesia was induced with ketamine and xylazine (10 and 2.5 mg/kg, respectively) and was maintained with a mixture of 70% N2O and 30% O2 supplemented by halothane (0.6–1%). After tracheotomy, the animal was placed in a stereotactic head holder. A craniotomy was performed, and the skull was cemented to a metal rod. After completion of all surgical procedures the ear and eye bars were removed, and the halothane was reduced to a level of 0.4%–0.6%. After we had assured that the level of anesthesia was stable and sufficiently deep to prevent any vegetative reactions to somatic stimulation, the animals were paralyzed with pancuronium bromide (0.2 mg · kg−1 · hr−1). Glucose and electrolytes were supplemented intravenously. The electrocardiogram and the electroencephalogram were monitored continuously, and end-tidal CO2 and rectal temperature were kept in the range of 3–4% and 37–38°C, respectively. Corneal contact lenses with an artificial pupil of 3 mm diameter were fitted to both eyes. The eyes were refracted for a viewing distance of 1.14 m where a tangent screen was positioned. As landmarks of the animal’s visual field, the optic disks and the areae centrales were plotted with a reversible ophthalmoscope.
Recording. Collicular activity was recorded either with a multielectrode drive, which allowed independent movement of up to six electrodes or, alternatively, with one or two fixed electrode arrays. Most of the recordings were performed with the multielectrode drive, and in these experiments a guide tube was used to target the electrodes to the SC. In these cases, all electrode tips generally had a small separation of <1 mm in the horizontal plane. In contrast, the fixed electrode array used in other measurements consisted of two to five microelectrodes whose spacing was between 0.2 and 3 mm. The recorded signals were amplified, bandpass-filtered, and fed through a Schmitt trigger to obtain transistor transistor logic pulses, which signaled spike timing.
In most of the experiments, we recorded multiunit activity. In these measurements, the Schmitt trigger threshold was adjusted to exceed the noise limit at least twofold. In a number of experiments we additionally studied single-unit activity. In these cases we separated the spikes of different cells by a real-time template-matching algorithm (MSD spike sorter, Alpha-Omega). For several reasons, the analysis of collicular correlation patterns was greatly facilitated by including multiunit activity (for a detailed discussion of the advantages and potential pitfalls of multiunit cross-correlation analysis, see Bedenbaugh and Gerstein, 1997). First, the cross-correlation technique requires a sufficient density of events to yield reliable results. Because the firing rates of collicular neurons are quite low, it is difficult to detect temporal relationships between the activity of single neurons within short analysis windows. Second, for the same reasons it is difficult to assess the short-term fluctuations (from trial to trial) of correlation patterns among single units. Third, because the analysis of multiunit activity permits rapid sampling, it was particularly useful for analysis of the spatial distribution of collicular correlation patterns by comparing many recording sites within the same experiment. These advantages of the multiunit signal are particularly pronounced if nearby cells are functionally similar, and this appears to be the case in the SC (Huerta and Harting, 1984).
Receptive fields were mapped onto a tangent screen, and the ocular dominance, the orientation tuning, and the direction preferences of each multiunit or single-unit recording were assessed with hand-held stimuli. For quantitative measurements visual stimuli were projected onto the tangent screen via a computer-controlled optic bench. Typically, moving bars served as stimuli. Multiunit clusters or single units with overlapping or nearby receptive fields were activated with a single bar, whereas cells with distant receptive fields were activated with two coherently moving bars. Generally, the bar stimuli were positioned outside the receptive fields (RFs) close to the RF border and moved through the RF in a 3 sec period. In a few cases computer-generated flow fields were presented on a 21 inch monitor. Responses were recorded for at least 10 stimulus repetitions, and, if not specified otherwise, the data from such blocks of 10 trials were combined for analysis.
Data analysis. For all responses, peristimulus time histograms, auto- and cross-correlation functions, as well as their first-order shift predictors were computed. Cross-correlograms were computed with a bin width of 1 msec. The contribution of stimulus coordination to the observed correlation patterns was assessed by shift predictor correlograms. To obtain the first-order shift predictor, cross-correlograms were computed from responses to successive stimuli rather than from simultaneous responses to the same stimulus, as was the case for the cross-correlation functions (Perkel et al., 1967). On the fast time scale considered here (time shifts of ≤250 msec), these correlograms from shifted trials were almost always (>95% of cases) flat (also see Fig. 1); i.e., the fitting procedure described below did not discover significant peaks in such correlograms. Usually, the correlograms were computed over the whole response epoch, which generally consisted of a 3 sec period during which a bar stimulus moved across the receptive field.
Fig. 1.

Analysis and classification of correlation patterns. A, Example of a successfully fitted cross-correlation function. The black line represents the generalized Gabor function that was fitted to the data.B, Parameters derived from the fitted function for characterizing the cross-correlation pattern. The amplitudes of the central peak (A) and the first side peak (S) are measured from the offset (O). The strength of the correlation and the oscillatory patterning can then be quantified by calculating the RMA of the center peak, i.e., the ratio A/O and the relative modulation of the side peak S/O, respectively. Error bars indicate the estimates of the SEs for the central peak and the first satellite peak. C, First-order shift predictor of the cross-correlogram shown in A. For computation of the shift predictor, spike trains are taken from successive stimulus presentations.
According to our experience it is useful to restrict the analysis to correlograms with a sufficient filling. Therefore the following criteria were applied. Correlograms for multiunit recordings were included in the analysis only if the firing rates of each cell cluster exceeded 10 Hz and if the correlogram had an average entry of at least two coincidences per bin. Because the shift predictors were flat, we did not have to subtract them to distinguish between stimulus-locked and internally generated correlations. In this respect our procedure differs from that of other authors (Ghose and Freeman, 1992). Assessing correlation strength from raw correlograms is legitimate only if shift predictors are flat (i.e., if there is no stimulus-locked correlation), but then it is preferable, because the subtraction procedure increases the noise in the correlograms (for discussion, see Kreiter and Singer, 1996).
In addition to computation of averaged correlograms, a sliding window analysis was applied to a subset of the data to analyze the time course of collicular correlations during the stimulus presentation. In these cases, a short analysis window (100 or 400 msec duration) was moved over the responses in steps of 50 or 100 msec. The correlograms obtained from each of those overlapping windows were plotted as a two-dimensional array, where the x-axis denotes the time course of the responses. The amplitude of the correlograms was normalized by the geometric mean of firing rates and displayed in a color-coded manner. Finally, to assess the frequency contents of neuronal interactions, power spectra were computed. To exclude contributions to the frequency spectrum by stimulus-locked response components, the power spectra were computed from averaged cross-correlograms of which the respective shift predictor had been subtracted.
To quantify the modulation of the correlograms, generalized Gabor functions (damped cosine functions) were fitted to the correlograms; this method is described in detail by König (1994). As illustrated in Figure 1, the strength of cross-correlation was measured by computing the relative modulation amplitude (RMA), which we define as the ratio of center peak amplitude over the offset of the correlogram modulation. A correlation was considered as significant if the following four criteria were met: (1) The fitted function had to explain at least 20% of the variance of the data points (χ2 reduction). This requirement leads to a rejection of fitting functions, which would be judged to be poor according to the visual inspection of the fit (also see Young et al., 1992). (2) The Z score for the amplitude of the largest peak had to exceed a value of 2, implying that this peak was significant at the 5% level. This significance estimate was based on the results of the Marquardt–Levenberg algorithm, which supplies error estimates for parameters of the fitted function and allows calculation of confidence intervals over all data points (König, 1994). (3) The RMA had to exceed a value of 0.10. (4) The shift predictor had to be flat. Accordingly, a correlogram was considered to indicate an oscillatory patterning of activity if the largest satellite peak had a Zscore of >2. This method of quantification has two major virtues. First, the RMA provides an intuitive measure of correlations caused by neuronal interactions, because the offset term of the fitted function represents the amount of spurious coincidences at the respective sites in the case of independent firing. Thus, the RMA measures coincidences exceeding the predicted chance level. Second, the strength of synchronization (RMA of the central peak) and strength of oscillation (RMA of the satellite peak) can be determined independently. From the fitted functions we also determined the phase shift of the largest peak relative to zero time lag, the width of the central peak at half height, and the oscillation frequency in case of oscillatory patterning. From these data we calculated the percentage of recording pairs in which a significant correlation was observed. Moreover, for any given pair with significant interactions the percentage of correlograms with an oscillatory modulation was calculated.
Histology. At the end of each experiment a lethal dose of sodium pentothal was given, and the animal was perfused through the heart with warm saline followed by cold (4–8°C) fixative (4% paraformaldehyde in PBS). The brain was removed, frozen, and cut in the frontal plane into 60 μm sections. These sections were alternately stained for cell bodies (Nissl) and fibers (Gallyas method). Small lesions (electrode tip-negative, 12 sec DC current, 12 μA) made after each recording penetration allowed the reconstruction of the recording track. SC laminae were classified according to the method of Kanaseki and Sprague (1974).
RESULTS
Recording sites and pairs
The majority of the results reported here are based on multiunit recordings from 315 collicular sites. Cross-correlation patterns were computed for 258 recording pairs. The vast majority of the multiunit recording sites were localized in the superficial collicular layers: 173 were located in the stratum griseum superficiale; 54 were located in the stratum opticum; and 68 recording sites could not be attributed unambiguously, but the majority of these were presumably located in the superficial SC laminae. Eighteen multiunit recording sites were located in the intermediate collicular layers, in the stratum griseum intermediale. In addition to these multiunit recordings, we analyzed 45 well isolated single units from which we collected a sufficient number of spikes to compute meaningful correlograms. In this sample cross-correlation patterns were studied for 48 pairs.
Collicular correlation patterns
The autocorrelation functions of SC multiunits displayed in Figure2 give a survey of the temporal structure of collicular activity. As shown in the averaged autocorrelograms for multiunits in Figure 2, we often observed cell clusters that discharged in bursts, which lasted 20–100 msec (Fig. 2A,B). In Figure 2, C and D, correlograms of single-unit activity are illustrated. In general, high-frequency oscillations in the γ range (as illustrated in Fig. 2D) were encountered only rarely. When oscillations occurred, their frequencies often varied from trial to trial and therefore were difficult to assess in averages. Figure 2E–H illustrates selected single-sweep autocorrelograms of a multiunit recording (compare the corresponding averaged correlogram shown in Fig. 2A), which exhibited a pronounced variability of firing patterns. From Figure 2E–H it is clear that also the firing rate of the cell group exhibited substantial variability. In this case as well as in other examples studied, we did not observe any obvious relationship between firing rates and temporal firing pattern.
Fig. 2.
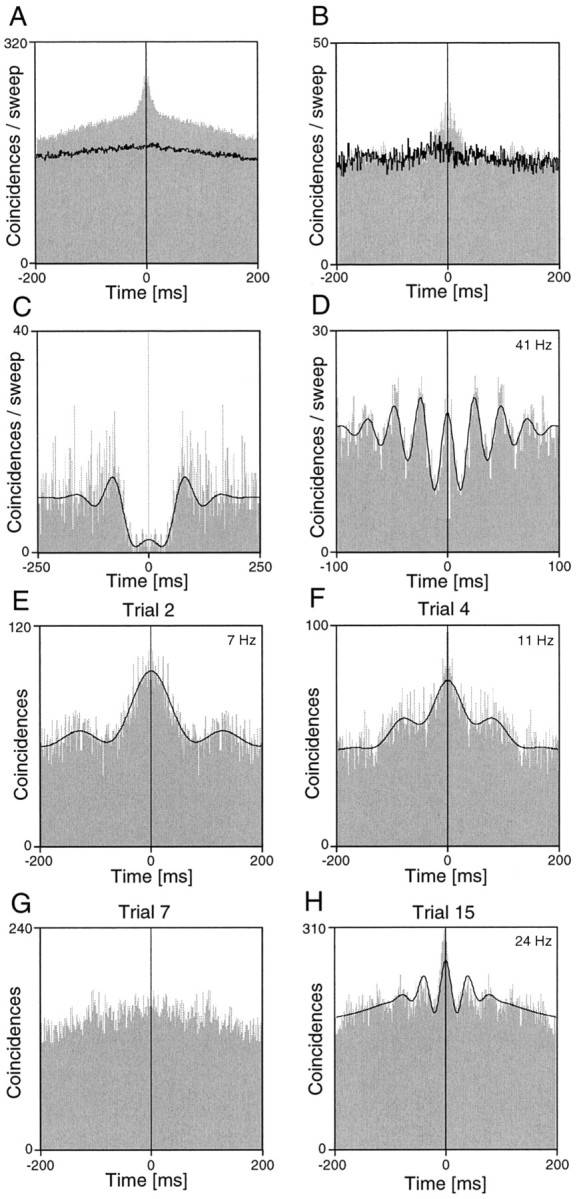
Autocorrelograms computed for multi- and single-unit recordings from different sites in superficial SC layers.A, B, Averaged autocorrelograms of multiunit activity. The black line indicates the shift predictor. A very broad peak is seen in A, but in the autocorrelogram shown in B only a center peak towers above the shift predictor, which represents the spurious rate-dependent and stimulus-locked coincidences. C, D, Averaged autocorrelograms of single-unit activity. The cell shown inC had a long refractory period and exhibited a tendency to fire in regular intervals. D, Single-unit autocorrelogram with a high-frequency oscillatory modulation.E–H, Autocorrelograms computed from individual stimulation epochs (3 sec duration) recorded successively from the same cell cluster as in A. Note the variability of the temporal structure in successive responses to the same stimulus. InC–F and H, the black linerepresents the generalized Gabor function that was fitted to the data.
Significant cross-correlations were observed in approximately half (128 of 258, 49.6%) of the collicular multiunit recording pairs. For those recording pairs in which at least one significantly modulated correlogram was detected, correlations occurred in 44% of the stimulation epochs (each epoch comprising 10 stimulus repetitions, whereby we recorded on average 9 such stimulation epochs per recording pair). Figure 3 illustrates examples of cross-correlograms obtained in multiunit and single-unit recording pairs. Figure 3 also shows that subtracting the respective shift predictors from the correlograms did not affect their modulation (except for slightly increasing the noise level). This indicates that the correlations were attributable to intrinsic neuronal interactions rather than to stimulus locking of the respective responses. Moreover, the frequency spectra of the cross-correlograms are provided. As far as can be inferred from the small number of single-unit pairs, the correlation patterns of single and multiple units appeared to be similar. In 14 of 48 (29%) single-unit pairs the correlations reached significance. The only notable difference was that anticorrelated responses (i.e., those with a central trough in the correlogram) were seen twice in the single-unit pairs but never in the multiunit recordings.
Fig. 3.

Cross-correlograms computed for multiunit (A–H) and single-unit (I–L) recordings from different sites in superficial SC layers. A, Top diagram, The two recorded cell groups were located in the right SC, both in the lower stratum griseum superficiale. The distance between the two recording sites was ∼1.5 mm. Bottom diagram, Schematic plot of the receptive fields of the two recording sites and the stimulus. Note that the receptive field of cell group 1extended substantially into the ipsilateral visual field (dashed line, vertical meridian). B, The cross-correlogram for the two multiunit responses shows a broad peak.C, This broad peak remains after subtracting the shift predictor. D, Power spectrum of the cross-correlogram computed after subtracting the first-order shift predictor as shown inC. E, Top diagram, The two recorded cell groups were nearby in the right SC, both in the stratum griseum superficiale. Bottom diagram, Plot of the receptive fields of the two recording sites and the stimulus.F, The cross-correlogram shows an oscillatory modulation at a frequency of ∼13 Hz, which remains after subtracting the shift predictor (G). H, Power spectrum of the cross-correlogram calculated after subtraction of the first-order shift predictor as shown in G.I, Top diagram, The two recorded single units were isolated by template matching from an electrode in the lower stratum opticum. Bottom diagram, Plot of the receptive fields of the two cells and the stimulus. J, The cross-correlogram shows an oscillatory modulation at a frequency of 33 Hz, and this modulation remains after subtracting the shift predictor (K). L, Power spectrum of this interaction computed after subtracting the first-order shift predictor as shown in K. Where present, the black line superimposed to the correlograms represents the generalized Gabor function that was fitted to the data. ϕ, Phase shift of the Gabor function; f, oscillation frequency.
Figure 4 summarizes the statistics of collicular interactions for multiunit data. As described in Materials and Methods, the strength of the interactions was quantified by the RMA (central peak amplitude divided by offset) of the correlograms. The histogram of RMA values for the data sample is displayed in Figure4A. The mean RMA of the respective best modulated correlogram for each recording pair in which correlations occurred was 0.67; the RMA for all correlograms with significant modulation averaged 0.49. As indicated by significant satellite peaks, many of the cross-correlograms were oscillatory. Of the most strongly modulated correlograms for a given pair of recording sites, 44% showed an oscillatory modulation, and for all correlograms this fraction was 23%. The fact that in most cases the number of satellite peaks was confined to one or two indicates that the oscillatory patterning of the discharges was not strictly periodic. Oscillation frequencies covered a broad range from 5 to 100 Hz, albeit in most cases being in the range between 5 and 40 Hz (Fig. 4B). In most of the correlograms the central peak was located around zero phase lag (Fig.4C). Of the correlograms exhibiting the strongest modulation for a given recording pair, 64% had peak shifts of <5 msec. As summarized in Figure 4D, there was a strong positive correlation between the degree of receptive field overlap of the respective units and the incidence of significant correlations: the more the fields overlapped, the higher the probability of observing a significant interaction.
Fig. 4.

Statistics of multiunit cross-correlations. The data in A–C refer to the most strongly modulated correlogram for each recording pair. A, Distribution of relative modulation amplitudes (as defined in Fig. 1) for cross-correlograms with a significant center peak. B, Distribution of oscillation frequencies. C, Cumulative distribution of the absolute values of phase shifts (AbsPhase) for cross-correlograms with significant center peaks. Note that in 64% of the correlograms the phase shift is smaller <5 msec. D, Probability of synchronization as a function of RF overlap. These data were calculated only for a subset of our data (178 recording pairs). The incidence is higher for cells with overlapping receptive fields (p < 0.01).
Dynamic aspects of collicular correlations
To assess the development of collicular correlation patterns over time, we used a sliding window analysis in which a short (100–400 msec) analysis window was moved in small time steps along the responses. An example for such a time-resolved analysis of correlated oscillatory responses is shown in Figure5. In this case, synchronization started rapidly and was sustained throughout the response. In many cases studied in this way, synchronization could be observed within the first 100 msec of the responses. Another characteristic aspect of collicular cross-correlations was their variability across trials. As exemplified in Figure 6, both the strength of the interaction and the dominant oscillation frequency could vary, despite the fact that stimulus conditions were unchanged. The firing rates of the cell groups also exhibited a notable variability. Again, as for the autocorrelations (Fig. 2E–H), we did not observe any obvious relationship between firing rate and firing pattern.
Fig. 5.
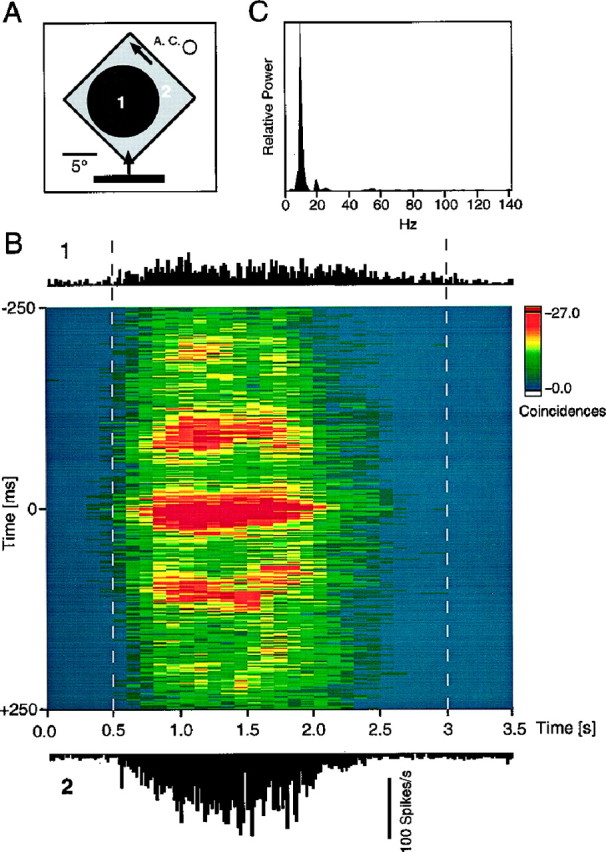
Sliding window analysis of a collicular cross-correlation pattern. A, The schematic plot (top) illustrates the receptive fields of the two recording sites (A. C., area centralis) and the stimulus. B, A 400-msec-long cross-correlation window was moved in steps of 100 msec over the stimulation period. Thex-axis denotes the time course of the responses, whereby each time displays the results of a 400-msec-long cross-correlation window centered on the respective time bin. The y-axis corresponds to the time shift of the stacked correlograms. The amplitude of the correlograms was normalized by the geometric mean of firing rates and displayed with a color code. Dashed gray lines indicate onset and end of the movement of the bar stimulus. The peristimulus time histograms of the two responses are shown above and below the sliding window plot. Data were recorded from two cell clusters in the stratum griseum superficiale. Note the rapid onset of the synchronous oscillation. C, Power spectrum of this interaction computed for the cross-correlogram (averaged over the whole stimulation period) after subtracting the first-order shift predictor.
Fig. 6.
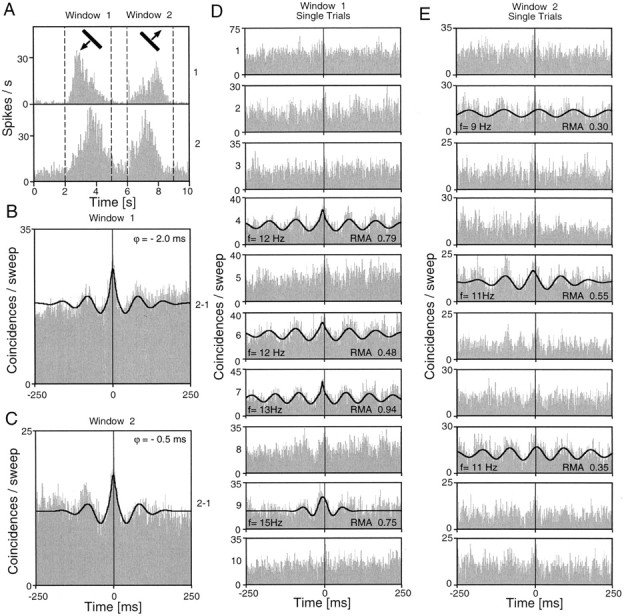
Intertrial variability of collicular cross-correlation patterns. The two recorded cell groups were located in the right SC, both in the stratum griseum superficiale. Ten successive trials were recorded with the same light bar stimulus.A, Peristimulus time histograms of the two recorded responses. Both cell groups responded vigorously to the forward (Window 1) and backward (Window 2) stimulus movement. B, C, Averaged cross-correlograms for the forward and backward responses, respectively. Both correlograms show a prominent center peak and significant oscillatory components with a frequency of ∼10 Hz. D, E, Variability of the temporal structure across the individual trials. Because of noise, only a few responses showed a significant modulation. In these cases, thecontinuous lines indicate the generalized Gabor function fitted to the data. f, Dominant frequency of oscillatory modulation.
Spatial organization of collicular synchronization
In all experiments synchronization probability depended critically on the horizontal separation of the recordings sites. For recording pairs with horizontal electrode separations of ≤1 mm, which constituted the majority of cases, the probability of observing a significant correlation was in the range of 40–60%, and in this fraction of cells correlations appeared in approximately half of the stimulation epochs. Although we studied 20 recording pairs with separations of ≥3 mm, we never observed correlations in the superficial layers beyond electrode separations of 2.5 mm. In the cat SC, receptive field size increases massively with depth (Meredith and Stein, 1990), leading to increasing overlap of fields recorded from sites with similar topographic separation. This permitted us to dissociate the effects of the variable “receptive field overlap” and the variable “topographic separation” on synchronization probability. As shown in Figure7B, for an experiment with three simultaneously advanced electrodes, the field overlap increases with depth, whereas the horizontal separation of the recording sites and the retinal position of the receptive field centers remains rather constant. In parallel with field overlap, the number of correlated cell pairs as well as the probability of synchronization for a given cell pair increased considerably with depth (Fig. 7A). In agreement with the data shown in Figure 4D, these results identify receptive field overlap as a critical variable in determining synchronization probability.
Fig. 7.

Incidence of synchronization as a function of recording depth in the SC. A, Histological reconstruction (in a parasagittal plane) of the penetrations of three microelectrodes. The electrodes were advanced simultaneously into the SC, whereby penetrations A and B reached the deeper collicular layers. Circles indicate recording sites, and lines are drawn between recording sites for which synchronization was observed, whereas cells at points not linked with lines were not synchronized. The thickness of thelines indicates the correlation probability, i.e., the percentage of stimulation epochs in which synchronization occurred. The incidence of synchronization increased with depth and was higher between the two less distant electrodes, B andC, than between electrodes A andB. No significant synchronization was seen between electrodes A and C. B, Receptive fields of selected recording sites. The dashedreceptive field borders indicate cells without clearly demarcated response zones. Note the increase of receptive field size with depth.AC, Area centralis.
To assess the contribution of direct retinal drive on intracollicular correlation patterns, we compared the distribution of synchronization patterns in the ipsilateral and the contralateral visual field representation. In the cat SC there is a substantial representation of the ipsilateral visual field. In this portion of the SC, visual responses are mediated mainly by corticotectal projections rather than by direct retinal input (Antonini et al., 1978). Comparing correlation patterns recorded in the ipsilateral and contralateral visual field representations should therefore provide indications of the influence of direct retinal input on collicular synchronization. Although we analyzed numerous recording pairs in both parts of the collicular visual map (for examples, see Fig. 3), we did not notice any systematic difference in the incidence or pattern of collicular correlations.
In addition to investigating tangential interactions, we wondered whether cells in the superficial and deep collicular layers would interact and show temporal correlations of their responses. Unfortunately, the visual responses of deep-layer cells were very poor in three of five experiments. In three experiments receptive fields could barely be mapped, and responses were sluggish. This made it difficult to collect a sufficient number of visually driven spikes for correlation analysis, and in the few instances in which we succeeded the correlograms were not modulated. However, in two experiments visual responses in the deep layers were vigorous and synchronized with responses in superficial layers. As documented in Figure 7, strong correlations were readily obtained between cells in the stratum griseum superficiale and stratum opticum on the one hand and stratum griseum intermediale on the other. The example shown in Figure8A–C illustrates that these correlations were robust. A statistical comparison of the 230 multiunit pairs recorded within the superficial layers and the 18 recording pairs recorded between superficial and deep collicular layers revealed that they occurred with a similar incidence (Fig.8D). We did not observe any systematic difference between intrasuperficial and superficial–deep correlation patterns. Specifically, there was no tendency for a phase lead of one of the layers. However, it must be emphasized that our data set for these comparisons is very small because of the technical difficulties described above.
Fig. 8.

Interlaminar interactions between superficial and deep SC. A–C, Example of an interlaminar correlation.A, The two cell groups were recorded in the right SC at a horizontal separation of ∼1 mm and located in the stratum opticum and stratum griseum intermediale, respectively. B, Schematic plot of the receptive fields of the two recording sites and the stimulus. The dashed RF borders of the deep-layer cell cluster indicate that the borders of the response zone of this cell group could not be clearly mapped. C, Correlogram of the interlaminar interaction. The shift of the center peak indicates that the deep-layer cell cluster fires on average shortly before the superficial layer cells. The black continuous linesuperimposed to the correlograms represents the generalized Gabor function that was fitted to the data. ϕ, Phase shift of the Gabor function. D, Comparison of the incidence of interlaminar synchronization (n = 18 pairs; data from two experiments) with the incidence of synchronization within the superficial layers (n = 230 pairs).
Stimulus specificity of collicular correlations
A central question of our study was whether collicular synchronization patterns demarcate assemblies of functionally related cells. To address this issue we activated spatially separate SC cells with either one coherent stimulus or two independent stimuli. Figures9 and 10show examples of such experiments. SC multiunits tended to synchronize their responses more strongly if activated with a single coherent stimulus compared with two independent stimuli. These effects occurred without changes of firing rate (compare Figs. 9D,F,10D,E). In the example displayed in Figure 10, the cell groups had completely nonoverlapping receptive fields. This latter example demonstrates that the synchronization observed in the long-bar condition cannot be attributed to common input from a visual field region shared by both cell groups. Such stimulus-specific changes in synchronization patterns were demonstrable not only in multiunit but also in single-unit recordings and occurred irrespective of whether the correlograms had broad or sharp peaks (data not shown). Figure11 summarizes the results of 16 such experiments. In 15 of 16 experiments synchronization was stronger in the long-bar as compared with the dual-bar conditions. Moreover, as illustrated in Figure 11, the decrease in synchronization strength for the transition from the long-bar to the two-bar condition was similar irrespective of whether the two bars moved in the same direction or opposite directions.
Fig. 9.

Stimulus dependence of collicular synchronization between multiunit clusters with partially overlapping receptive fields. Data are from the same case as that illustrated in Figure 5.A–C, Schematic plots of the receptive fields and the three different stimulation conditions. The cells were activated with a continuous moving light bar, two separate light bars moving in the same direction, or two light bars moving in antiphase across the receptive fields. A, inset, Position of the recording electrodes in the stratum griseum superficiale.D–F, Cross-correlograms computed for the responses obtained with the three stimulus paradigms. The synchronization seen with a continuous moving light bar (D) disappeared if the cells at the two recording sites were activated by two bars moving in the same direction (E) or opposite directions (F). The black continuous line superimposed to the correlogram inD represents the generalized Gabor function that was fitted to the data. ϕ, Phase shift of the Gabor function.
Fig. 10.

Stimulus dependence of synchronization between collicular cell clusters with nonoverlapping receptive fields.A–C, Schematic plots of the receptive fields and the three different stimulation conditions. Activity was recorded from two multiunit clusters in the stratum griseum superficiale. Conventions are as in Figure 9. The synchronization seen with a continuous moving light bar (D) disappears if the cells at the two recording sites were activated by two bars moving in the same direction (E) or opposite directions (F).
Fig. 11.

Statistics of stimulus dependence. The scatterplot compares the synchronization strength for different stimulation conditions in our data sample (n = 16). Note that we did not test all three stimulation conditions in all measurements. The parameter plotted is the relative modulation amplitude of the center peak (ratio of center peak amplitude over the offset of the correlogram modulation) for the long-bar condition (y-axis) versus the dual-bar conditions (x-axis). Note that in 15 of 16 cases, the strength of synchronization is consistently higher for spatially coherent stimulus configurations.
DISCUSSION
Evidence for correlated activity in the SC
The major result of our study is that correlated discharge is a prominent feature of single-unit and multiunit activity in the SC. Our sample of single-unit correlation patterns is small but in good agreement with our multiunit data. The analysis of multiunit activity enabled us to quantify collicular correlation patterns with high temporal and spatial resolution. The virtues of quantifying correlation patterns by fitting of Gabor functions are discussed elsewhere (König, 1994). Because it enables statistical assessment of confidence limits, it permits a reliable distinction between spurious, purely rate-dependent coincidences and additional excess correlations. Our finding that shift predictors were flat demonstrates further that collicular correlation patterns did not result from stimulus coordination of the respective responses but resulted from internal neuronal interactions. Spurious correlation peaks may also result if independently firing cells engage in oscillatory firing patterns with similar oscillation frequencies and if the number of stimulus repetitions is not large enough to provide sufficient averaging. However, the fact that the shift predictors were flat indicates that our averaging procedures were sufficient to eliminate this type of spurious correlation. Moreover, the correlation peaks described here cluster around zero phase lag, whereas correlation peaks of random origin would show a random distribution of peak shifts. Taken together, these observations permit the conclusion that the observed collicular correlation patterns are genuinely attributable to neuronal interactions.
Comparison with other correlation studies
Numerous electrophysiological studies have described discharge properties of cells in the vertebrate midbrain (Chalupa, 1984; Stein and Meredith, 1991), but only very few of these investigations have documented the fine temporal structure of collicular activity. Our results are in good agreement with the few data on temporal aspects of visual activity in the midbrain. Mandl (1993) has described oscillatory responses to moving stimuli in collicular neurons of cats. In anesthetized cats, Chabli et al. (1997) have observed correlation patterns similar to the ones reported here (also see Brecht et al., 1996), many of which showed an oscillatory modulation in the α- and β-frequency range. Neuenschwander et al. (1996) found correlation patterns in the optic tectum of awake pigeons that also resemble closely those described here. In this study, correlations were frequent, often exhibited an oscillatory pattern, were present over distances of several millimeters, and occurred most often with small phase lags (<5 msec). Correlated discharges have also been described in saccade-related activity recorded from the monkey SC (Istvan and Munoz, 1997). Finally, an oscillatory modulation of visual responses has been observed in the midbrain of several other species, such as rats (Fortin et al., 1997), mice (Masu et al., 1995), and toads (Schwippert et al., 1996). Taken together with our present results, these data provide evidence that oscillatory patterning and response synchronization are prominent features of visual midbrain activity in many vertebrate species.
The correlation patterns recorded in the SC of anesthetized cats compare in many respects with the interaction patterns that have been observed in visual cortical areas of cats and monkeys. Like the latter (Eckhorn et al., 1988; Gray et al., 1989; Engel et al., 1990; Kreiter and Singer, 1996; Livingstone, 1996), collicular correlations are often associated with a rhythmic modulation of neuronal firing, whereby synchronization strength and oscillation frequency can vary considerably from one stimulus presentation to the next. Moreover, synchronization probability depends critically on retinotopic proximity of the receptive fields and on stimulus configuration (see below). The fact that collicular and cortical synchronization share common properties agrees with the evidence that cortical and tectal neurons engage in tightly correlated discharges in response to visual stimuli. As discussed elsewhere (Brecht et al., 1998), it is likely that synchronized cortical activity contributes to the temporal patterning of collicular responses via the corticotectal projections. Still, there are noteworthy differences between cortical and tectal synchronization patterns, suggesting a certain autonomy of intracollicular synchronization phenomena. Collicular synchronization is characterized by broad correlation peaks and low oscillation frequencies in the α and β range, whereas cortical correlations tend to have sharp peaks and an oscillatory modulation in the γ range. Recent observations indicate, however, that these differences are less pronounced in the awake brain (M. Brecht, W. Singer, and A. K. Engel, unpublished observations). In the SC of awake cats high oscillation frequencies and sharp correlation peaks are common. The large variability of collicular correlation patterns is in line with considerable variability of collicular firing rates. Although the functional significance of correlation pattern variability or firing rate variability remains to be determined, we speculate that it does not represent noise in the classical sense. Rather, it may result from interactions of ongoing activity and stimulus-evoked components, as has been shown to be the case elsewhere (Arieli et al., 1996).
Relationship between correlation results and collicular physiology
Some of the cellular properties of collicular neurons might predetermine them for engaging in precisely timed and coordinated discharges. Intracellular recordings demonstrate that collicular neurons have brief time constants of 3–6 msec (Grantyn et al., 1983;Lopez-Barneo and Llinas, 1988). These time constants are three to five times shorter than those of hippocampal or cortical neurons (Koch et al., 1996). In addition, SC neurons possess an intrinsic tendency for a burst-like or rhythmic (“chattering”) firing (Grantyn et al., 1983;Lo et al., 1998).
As shown here, collicular neurons respond to visual stimuli not with random firing patterns but with precisely synchronized activity that sometimes shows an oscillatory temporal structure. These synchronization patterns are not locked to the stimulus; they appear very early in the response and are somewhat variable from one stimulus presentation to the next. Several observations suggest an intracollicular origin of this temporal patterning. First, it is unlikely that collicular correlations result from shared retinal input, because there were no differences between the correlation patterns recorded in the contralateral and ipsilateral visual field representation, the latter receiving visual input mainly via the retino-cortico-tectal loop involving the corpus callosum (Antonini et al., 1978). Synchronization via common retinal input is also unlikely, because stimulus-induced oscillations of retinal neurons have a much higher frequency than the oscillatory collicular interactions (Neuenschwander and Singer, 1996). Second, it is also unlikely that collicular synchronization results exclusively from common cortical input, because in the anesthetized preparation cortical oscillations tend to have higher frequencies than the collicular oscillations. Third, synchronization by a common external source cannot account for the fact that synchronization occurs between superficial and deep collicular layers, because superficial and deep SC receive their input from quite distinct sources (Edwards, 1980; Stein and Meredith, 1991). Complementary evidence for intracollicular synchronizing mechanisms has been provided by Fortin et al. (1997), who studied oscillatory field potentials recorded in the SC of rats.
Our observation that the probability of collicular synchronization decreases with increasing horizontal separation of recording sites goes well with a host of data indicating that both sensory and motor representations are mapped in coordinates tangential to the laminae (Feldon et al., 1970; Robinson, 1972; Rhoades et al., 1991). In addition, our data suggest a close correlation between synchronization probability and receptive field overlap. This agrees with the postulate that synchronization might serve as a signature of the relatedness of responses. Because receptive field size increases with increasing depth, correlations are seen over larger distances in the deep than in the superficial layers.
It is commonly held that the superficial and deep SC layers form two rather independent structures (Edwards, 1980; Stein and Meredith, 1991). However, numerous anatomical studies have demonstrated massive connections between the superficial and deep SC compartments (Moschovakis et al., 1988; Behan and Appell, 1992; Lee and Hall, 1995), and new concepts about the functional relation between collicular layers (Moschovakis, 1997) suggest cooperativity among different SC layers. The tight correlations between responses in superficial and deep layers described here support this notion and add to the still sparse physiological studies on interlaminar interactions in the SC (Sparks and Hartwich-Young, 1989; Lee et al., 1997). However, our data are somewhat preliminary because of the strong effects of anesthesia on the deep collicular layers.
Collicular synchronization and assembly coding
If response synchronization serves to disambiguate population codes, it should have the following properties: (1) correlations of discharges should occur with a precision in the millisecond range to define relations with high temporal resolution and a fast time scale; (2) these correlations should occur over physiologically relevant distances, i.e., between cells with overlapping or adjacent receptive fields; and (3) correlations should change dynamically such that only those subsets of simultaneously activated cells synchronize their responses, which represent a common object. The correlation patterns observed here meet these predictions. A large percentage of SC cells showed temporally precise synchronization. Synchronization occurred between nearby cells as well as across distances of 2.5 mm, i.e., half of the diameter of the SC. Collicular synchronization exhibited a dependence on stimulus coherence similar to that shown previously for cortical synchronization (Gray et al., 1989; Freiwald et al., 1995). Cells synchronize their responses if activated by the same stimulus but not if responding to different stimuli. In contrast to the results of the experiments in visual cortex, there was in the two-bar condition only a little effect of stimulus direction on synchronization strength. This might be related to the fact that the directional tuning of collicular cells is generally broader than that of cortical neurons (Sterling and Wickelgren, 1969). Nonetheless, our data show that synchronization contains information about the relatedness of stimuli that is not present in discharge rates and could be used to disambiguate stimulus response relations in the presence of multiple stimuli.
Admittedly, the congruence between the predictions listed above and the phenomenology of collicular synchronization does not prove that synchronization serves as a binding code. However, the importance of spike timing for SC function is suggested by microstimulation experiments in awake cats in which saccades were elicited by activating with electrical stimuli two or three sites of the SC simultaneously. When the trains of stimulation pulses were precisely synchronized (<5 msec phase lag between the pulses), the vectors of the resulting saccades were close to the average of saccades evoked from each stimulation site alone. On the other hand, when the simultaneously applied trains of stimulation pulses had phase lags of >5 msec, the vectors of the resulting saccades were close to the sum of the individual saccades, as if the stimulation trains had been applied in succession (Brecht et al., 1997). Thus, these experiments show that synchronous and asynchronous SC microstimulation lead to different motor outputs, suggesting that spike timing might be involved in collicular target selection.
Footnotes
This work was supported by the Max-Planck-Society, the Minna-James-Heineman Foundation, the Heisenberg Program of the Deutsche Forschungsgemeinschaft and the Institute for Advanced Study (Berlin, Germany), where A.K.E. received a Daimler-Benz fellowship in 1997–1998. We thank S. Neuenschwander for providing the analysis software package, R. Goebel for providing the visual stimulation software, C. Selignow, J. Klon-Lipok, U. Hörbelt, and P. Janson for excellent technical assistance, and R. Ruhl and S. Ruhl for help in preparing the figures.
Correspondence should be addressed to Michael Brecht, Max-Planck-Institut für Hirnforschung, Deutschordenstraße 46, 60528 Frankfurt, Germany.
REFERENCES
- 1.Antonini A, Berlucchi G, Marzi CA, Sprague JM. Indirect, across-the-midline projections and representation of ipsilateral visual field in superior colliculus of the cat. J Neurophysiol. 1978;41:285–304. doi: 10.1152/jn.1978.41.2.285. [DOI] [PubMed] [Google Scholar]
- 2.Arieli A, Sterkin A, Grinvald A, Aertsen A. Dynamics of ongoing activity: explanation of the large variability in evoked cortical responses. Science. 1996;273:1868–1871. doi: 10.1126/science.273.5283.1868. [DOI] [PubMed] [Google Scholar]
- 3.Bedenbaugh P, Gerstein GL. Multiunit normalized cross correlation differs from the average single-unit normalized correlation. Neural Comput. 1997;9:1265–1275. doi: 10.1162/neco.1997.9.6.1265. [DOI] [PubMed] [Google Scholar]
- 4.Behan M, Appell PP. Intrinsic circuitry of the cat superior colliculus: projections from the superficial layers. J Comp Neurol. 1992;314:230–243. doi: 10.1002/cne.903150209. [DOI] [PubMed] [Google Scholar]
- 5.Brecht M, Singer W, Engel AK. Temporal coding in the cat superior colliculus. Soc Neurosci Abstr. 1996;22:1446. [Google Scholar]
- 6.Brecht M, Singer W, Engel AK. Collicular saccade vectors defined by synchronization. Soc Neurosci Abstr. 1997;23:843. [Google Scholar]
- 7.Brecht M, Singer W, Engel AK. Correlation analysis of corticotectal interactions in the cat visual system. J Neurophysiol. 1998;79:2394–2407. doi: 10.1152/jn.1998.79.5.2394. [DOI] [PubMed] [Google Scholar]
- 8.Chabli A, Guitton D, Molotchnikoff S. Stimulus-dependent oscillations in visual responses of neurons in the superficial and deeper of the superior colliculus of cats. Soc Neurosci Abstr. 1997;23:451. [Google Scholar]
- 9.Chalupa LM. Visual physiology of the mammalian superior colliculus. In: Vanegas H, editor. Comparative neurology of the optic tectum. Plenum; New York: 1984. pp. 775–818. [Google Scholar]
- 10.Eckhorn R, Bauer R, Jordan W, Brosch M, Kruse W, Munk M, Reitboeck HJ. Coherent oscillations: a mechanism for feature linking in the visual cortex? Biol Cybern. 1988;60:121–130. doi: 10.1007/BF00202899. [DOI] [PubMed] [Google Scholar]
- 11.Edwards SB. Deep cell layers of the superior colliculus: their reticular characteristics and structural organization. In: Hobson JA, Brazier MA, editors. The reticular formation revisited. Raven; New York: 1980. pp. 193–209. [Google Scholar]
- 12.Engel AK, König P, Gray CM, Singer W. Stimulus-dependent neuronal oscillations in cat visual cortex: inter-columnar interaction as determined by crosscorrelation analysis. Eur J Neurosci. 1990;2:588–606. doi: 10.1111/j.1460-9568.1990.tb00449.x. [DOI] [PubMed] [Google Scholar]
- 13.Engel AK, Roelfsema PR, Fries P, Brecht M, Singer W. Role of the temporal domain for response selection and perceptual binding. Cereb Cortex. 1997;7:571–582. doi: 10.1093/cercor/7.6.571. [DOI] [PubMed] [Google Scholar]
- 14.Feldon S, Feldon P, Kruger L. Topography of the retinal projection upon the superior colliculus of the cat. Vision Res. 1970;10:135–143. doi: 10.1016/0042-6989(70)90111-2. [DOI] [PubMed] [Google Scholar]
- 15.Fortin S, Itaya S, Chemtob S, Molotchnikoff S. ON and OFF field potentials in the rat superior colliculus during development. Vision Res. 1997;37:3079–3087. doi: 10.1016/s0042-6989(97)00145-4. [DOI] [PubMed] [Google Scholar]
- 16.Freiwald WA, Kreiter AK, Singer W. Stimulus dependent intercolumnar synchronization of single unit responses in cat area 17. NeuroReport. 1995;6:2348–2352. doi: 10.1097/00001756-199511270-00018. [DOI] [PubMed] [Google Scholar]
- 17.Ghose GM, Freeman RD. Oscillatory discharge in the visual system: does it have a functional role? J Neurophysiol. 1992;68:1558–1574. doi: 10.1152/jn.1992.68.5.1558. [DOI] [PubMed] [Google Scholar]
- 18.Grantyn R, Grantyn A, Schierwagen A. Passive membrane properties, afterpotentials and repetitive firing of superior colliculus neurons studied in anesthetized cats. Exp Brain Res. 1983;50:377–391. doi: 10.1007/BF00239204. [DOI] [PubMed] [Google Scholar]
- 19.Gray CM, König P, Engel AK, Singer W. Oscillatory responses in cat visual cortex exhibit inter-columnar synchronization which reflects global stimulus properties. Nature. 1989;338:334–337. doi: 10.1038/338334a0. [DOI] [PubMed] [Google Scholar]
- 20.Huerta MF, Harting JK. The mammalian superior colliculus: studies of its morphology and connections. In: Vanegas H, editor. Comparative neurology of the optic tectum. Plenum; New York: 1984. pp. 687–773. [Google Scholar]
- 21.Istvan PJ, Munoz DP. Neuronal connectivity in monkey superior colliculus during saccades: evidence from multiple recordings and cross correlation analysis. Soc Neurosci Abstr. 1997;23:1296. [Google Scholar]
- 22.Kanaseki T, Sprague JM. Pretectal nuclei and tectal laminae in the cat. J Comp Neurol. 1974;158:319–338. doi: 10.1002/cne.901580307. [DOI] [PubMed] [Google Scholar]
- 23.Koch C, Rapp M, Segev I. A brief history of time (constants). Cereb Cortex. 1996;6:93–101. doi: 10.1093/cercor/6.2.93. [DOI] [PubMed] [Google Scholar]
- 24.König P. A method for the quantification of synchrony and oscillatory properties of neuronal activity. J Neurosci Methods. 1994;54:31–37. doi: 10.1016/0165-0270(94)90157-0. [DOI] [PubMed] [Google Scholar]
- 25.Kreiter AK, Singer W. Stimulus-dependent synchronization of neuronal responses in the visual cortex of the awake macaque monkey. J Neurosci. 1996;16:2381–2396. doi: 10.1523/JNEUROSCI.16-07-02381.1996. [DOI] [PMC free article] [PubMed] [Google Scholar]
- 26.Lee C, Rohrer WH, Sparks DL. Population coding of saccadic eye movements by neurons in the superior colliculus. Nature. 1988;332:357–360. doi: 10.1038/332357a0. [DOI] [PubMed] [Google Scholar]
- 27.Lee P, Hall WC. Interlaminar connections of the superior colliculus in the tree shrew. II. Projections from the superficial gray to the optic layer. Vis Neurosci. 1995;12:573–588. doi: 10.1017/s0952523800008464. [DOI] [PubMed] [Google Scholar]
- 28.Lee P, Helms M, Augustine GJ, Hall WC. Patch-clamp analysis of intrinsic synaptic circuitry of the superior colliculus. Soc Neurosci Abstr. 1997;23:1296. [Google Scholar]
- 29.Livingstone MS. Oscillatory firing and interneuronal correlations in squirrel monkey striate cortex. J Neurophysiol. 1996;75:2467–2485. doi: 10.1152/jn.1996.75.6.2467. [DOI] [PubMed] [Google Scholar]
- 30.Lo F, Cork RJ, Mize RR. Physiological properties of neurons in the optic layer of the rat’s superior colliculus. J Neurophysiol. 1998;80:331–343. doi: 10.1152/jn.1998.80.1.331. [DOI] [PubMed] [Google Scholar]
- 31.Lopez-Barneo J, Llinas R. Electrophysiology of mammalian tectal neurons in vitro. I. Transient ionic conductances. J Neurophysiol. 1988;60:853–868. doi: 10.1152/jn.1988.60.3.853. [DOI] [PubMed] [Google Scholar]
- 32.Mandl G. Coding for stimulus velocity by temporal patterning of spike discharges in visual cells of cat superior colliculus. Vision Res. 1993;33:1451–1475. doi: 10.1016/0042-6989(93)90139-n. [DOI] [PubMed] [Google Scholar]
- 33.Masu M, Iwakabe H, Tagawa Y, Miyoshi T, Yamashita M, Fukuda Y, Sasaki H, Hiroi K, Nakamura Y, Shigemoto R, Takada M, Nakamura K, Nakao K, Katsuki M, Nakanishi S. Specific deficit of the ON response in visual transmission by targeted disruption of the GluR6 gene. Cell. 1995;80:757–765. doi: 10.1016/0092-8674(95)90354-2. [DOI] [PubMed] [Google Scholar]
- 34.McIlwain JT. Distributed spatial coding in the superior colliculus: a review. Vis Neurosci. 1991;6:3–13. doi: 10.1017/s0952523800000857. [DOI] [PubMed] [Google Scholar]
- 35.Meredith AM, Stein BE. The visuotopic component of the multisensory map in the deep laminae of the cat superior colliculus. J Neurosci. 1990;10:3727–3742. doi: 10.1523/JNEUROSCI.10-11-03727.1990. [DOI] [PMC free article] [PubMed] [Google Scholar]
- 36.Moschovakis AK. The superior colliculus and eye movement control. Curr Opin Neurobiol. 1997;6:811–816. doi: 10.1016/s0959-4388(96)80032-8. [DOI] [PubMed] [Google Scholar]
- 37.Moschovakis AK, Karabelas AB, Highstein SM. Structure-function relationships in the primate superior colliculus: II. Morphological identity of presaccadic neurons. J Neurophysiol. 1988;60:263–300. doi: 10.1152/jn.1988.60.1.263. [DOI] [PubMed] [Google Scholar]
- 38.Neuenschwander S, Singer W. Long-range synchronization of oscillatory light responses in the cat retina and lateral geniculate nucleus. Nature. 1996;379:728–733. doi: 10.1038/379728a0. [DOI] [PubMed] [Google Scholar]
- 39.Neuenschwander S, Engel AK, König P, Singer W, Varela FA. Synchronization of neuronal responses in the optic tectum of awake pigeons. Vis Neurosci. 1996;13:575–584. doi: 10.1017/s0952523800008257. [DOI] [PubMed] [Google Scholar]
- 40.Perkel DH, Gerstein GL, Moore GP. Neuronal spike trains and stochastic point processes. II. Simultaneous spike trains. Biophys J. 1967;7:419–440. doi: 10.1016/S0006-3495(67)86597-4. [DOI] [PMC free article] [PubMed] [Google Scholar]
- 41.Rhoades RW, Mooney RD, Fish SE. Retinotopic and visuotopic representations in the mammalian superior colliculus. In: Dreher B, Robinson SR, editors. Vision and visual dysfunction, Vol 3, Neuroanatomy of the visual pathways and their development. Macmillan; London: 1991. pp. 150–175. [Google Scholar]
- 42.Robinson DA. Eye movements evoked by collicular stimulation in the alert monkey. Vision Res. 1972;12:1795–1807. doi: 10.1016/0042-6989(72)90070-3. [DOI] [PubMed] [Google Scholar]
- 43.Schwippert WW, Beneke T, Ewert JP. Disproportionate distribution of field potentials across the toad’s tectal visual field map in response to diffuse light ON and OFF stimulations. Vision Res. 1996;36:19–26. doi: 10.1016/0042-6989(95)00116-h. [DOI] [PubMed] [Google Scholar]
- 44.Singer W, Gray CM. Visual feature integration and the temporal correlation hypothesis. Annu Rev Neurosci. 1995;18:555–586. doi: 10.1146/annurev.ne.18.030195.003011. [DOI] [PubMed] [Google Scholar]
- 45.Singer W, Engel AK, Kreiter AK, Munk MHJ, Neuenschwander S, Roelfsema PR. Neuronal assemblies: necessity, significance, and detectability. Trends Cognit Sci. 1997;1:252–261. doi: 10.1016/S1364-6613(97)01079-6. [DOI] [PubMed] [Google Scholar]
- 46.Sparks DL, Hartwich-Young R. The deep layers of the superior colliculus. In: Wurtz RH, Goldberg ME, editors. The neurobiology of saccadic eye movements. Elsevier; New York: 1989. pp. 213–255. [PubMed] [Google Scholar]
- 47.Stein BE, Meredith AM. Functional organization of the superior colliculus. In: Leventhal AG, editor. Vision and visual dysfunction, Vol 2, The neural basis of visual function. Macmillan; London: 1991. pp. 85–110. [Google Scholar]
- 48.Sterling P, Wickelgren BG. Visual receptive fields in the superior colliculus of the cat. J Neurophysiol. 1969;32:1–15. doi: 10.1152/jn.1969.32.1.1. [DOI] [PubMed] [Google Scholar]
- 49.von der Malsburg C. Am I thinking assemblies? In: Palm G, Aertsen A, editors. Brain theory. Springer; Berlin: 1986. pp. 161–176. [Google Scholar]
- 50.von der Malsburg C. The correlation theory of brain function. Internal report 81-2. Göttingen: Max-Planck-Institute for Biophysical Chemistry (1981). In: Domany E, van Hemmen JL, Schulten K, editors. Models of neural networks II. Springer; Berlin: 1994. pp. 95–119. [Google Scholar]
- 51.Young MP, Tanaka K, Yamane S. On oscillating neuronal responses in the visual cortex of the monkey. J Neurophysiol. 1992;67:1464–1474. doi: 10.1152/jn.1992.67.6.1464. [DOI] [PubMed] [Google Scholar]