Abstract
The differences in path length of axons from the anteroventral cochlear nuclei (AVCN) to the medial superior olive (MSO) are thought to provide the anatomical substrate for the computation of interaural time differences (ITD). We made small injections of biotinylated dextran into the AVCN that produced intracellular-like filling of axons. This permitted three-dimensional reconstructions of individual axons and measurements of axonal length to individual terminals in MSO. Some axons that innervated the contralateral MSO had collaterals with lengths that were graded in the rostrocaudal direction with shorter collaterals innervating more rostral parts of MSO and longer collaterals innervating more caudal parts of MSO. These could innervate all or part of the length of the MSO. Other axons had restricted terminal fields comparable to the size of a single dendritic tree in the MSO. In the ipsilateral MSO, some axons had a reverse, but less steep, gradient in axonal length with greater axonal length associated with more rostral locations; others had restricted terminal fields. Thus, the computation of ITDs is based on gradients of axonal length in both the contralateral and ipsilateral MSO, and these gradients may account for a large part of the range of ITDs encoded by the MSO. Other factors may be involved in the computation of ITDs to compensate for differences between axons.
Keywords: auditory pathways, interaural timing differences, binaural hearing, cat, conduction velocity, superior olivary complex
The initial processing of interaural time difference (ITD), an important cue for sound localization, occurs in the medial superior olive (MSO). The MSO receives bilateral inputs from the spherical bushy cells of the anteroventral cochlear nucleus (AVCN) (Cant, 1992; Ryugo, 1992). The MSO is the primary binaural comparator in many species that hear chiefly at low frequencies (Schwartz, 1992; Echteler et al., 1994). Most MSO neurons are tuned to low-frequency sounds (Guinan et al., 1972), sensitive to ITDs, and discharge maximally at ITDs corresponding to sound locations in the contralateral sound field (Goldberg and Brown, 1969; Moushegian et al., 1975; Yin and Chan, 1990; Spitzer and Semple, 1995; Batra et al., 1997a). A crude topographical arrangement of best ITDs is present in the MSO (Yin and Chan, 1990).
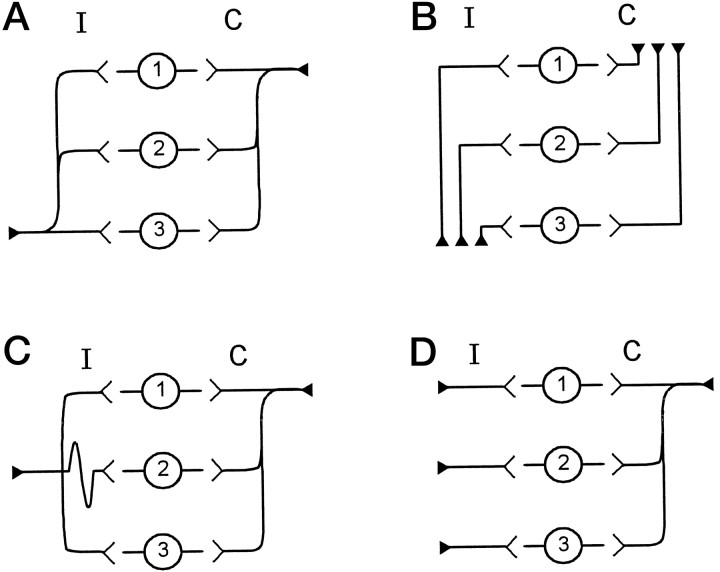
The structure of the MSO is conceived as an array of neurons that act as detectors for different ITDs. Jeffress (1948) proposed that neurons encoding ITDs, such as those in the MSO, receive inputs via axon collaterals from either side (Fig.1A). In his scheme, a neuron discharged maximally when action potentials from the two sides arrived simultaneously, and the ITD was exactly compensated by the difference in the conduction time from the two sides. Individual axons innervated the entire array of MSO neurons, and different neurons were sensitive to different ITDs because of a systematic variation in the lengths of the collaterals along the array (Jeffress, 1948). In a later version of this model, Goldberg and Brown (1969) (Fig.1B) suggested that each axon had a restricted terminal field in MSO and that the gradation in delays arose from axons of different length rather than from collaterals. A third pattern was suggested by studies in the chick (Young and Rubel, 1983; Overholt et al., 1992) in which a gradation of axon collateral length, and consequently delay, occurs on only one side (Fig. 1C). Other alternatives may combine the above schemes (Fig. 1D) or use factors other than axonal length to create the gradation in neural delay (Carr and Konishi, 1990).
Fig. 1.
Theoretical wiring diagrams for the medial superior olive. In each panel, cells in location 1 are rostral, and cells in location 3 are caudal. Innervating axons come from either the ipsilateral (I) or contralateral (C) side. A, The wiring pattern proposed by Jeffress (1948). The ipsilateral and contralateral axons both innervate the entire length of MSO by giving rise to successive collateral branches. However, the ipsilateral axon has shorter branches caudally, whereas the contralateral axon has shorter branches rostrally. B, The Goldberg scheme (Goldberg and Brown, 1969) has different axons that innervate different rostrocaudal locations within the MSO. Different axons have different lengths.C, The avian model in which contralateral axons follow the Jeffress scheme, but the ipsilateral axon innervates the full extent of MSO with collaterals of equal length. D, A fourth wiring scheme that is a combination of the previous three models. Here, individual axons of equal length innervate the MSO from the ipsilateral side. The shortest collateral branch of a single contralateral axon innervates the rostral end of MSO before successive branches innervate central and caudal MSO. All of these schemes can create a topographical organization of ITD along the rostrocaudal dimension of MSO.
Which system is present in mammals is unclear. Only a small number of axons innervating MSO have been studied (Smith et al., 1993). This limited sample suggested that the innervation pattern was similar to that in Figure 1C. However, the axons may have been incompletely filled because of methodological limitations, and quantitative data are lacking on the total length, diameter, and branching pattern of these axons. In this study, we used intracellular-like filling with dextran to make complete reconstructions of AVCN axons in three dimensions (3D). We examined the contributions of the axonal length, branching, and diameter to the creation of conduction delays and their relation to the encoding of ITD.
MATERIALS AND METHODS
Surgery and histology. Experiments were performed on six adult cats (Liberty Laboratories, Waverly, NY), and all procedures conformed to National Institutes of Health guidelines and protocols approved by the Animal Care Committee of the University of Connecticut Health Center. Each cat was anesthetized with a mixture of ketamine (33 mg/kg) and xylazine (1 mg/kg) and then maintained in an areflexive state with sodium pentobarbital (Nembutal, intravenous) delivered to effect. Animals were intubated, placed in an intracellular stereotaxic device, monitored for breathing rate and reflexive state, maintained at 37°C with a water blanket, and they received intravenous saline during the procedure. A craniotomy was performed over the right cerebellum, and the cochlear nucleus was exposed by aspirating the flocculus and part of the lateral posterior lobe of the cerebellum.
Extracellular responses to acoustic stimulation allowed us to make injections in the right AVCN at specific characteristic frequencies. Animals were placed in a single- or double-wall sound attenuation chamber. Pure tones or sinusoidally amplitude-modulated tones were produced by a digital stimulus system (Rhode, 1976) under the control of an LSI-11/73 (Digital Equipment Corporation, Nashua, NH) computer system and were delivered through Beyer (Hicksville, NY) earphones (model DT-48) in sealed enclosures coupled to the trocar ear bars of the stereotaxic device. The level of the acoustic stimuli was calibrated (60–40,000 Hz in 20 Hz steps) with a inch microphone coupled by tubing to the insertion end of the hollow ear bars of the stereotaxic device. Pinnae were not removed because the animals recovered from surgery and survived for several days after injections of tracer were made. Recordings were made with glass micropipettes (18–30 μm opening) filled with dextrans (10% tetramethylrhodamine dextran, D-1817; 10% biotin-dextran, D-1956; Molecular Probes, Eugene, OR) mixed in normal saline. Electrodes were advanced in a caudal-to-rostral direction with a microdrive (Burleigh inchworm, Fishers, NY) mounted on the stereotaxic manipulator. The angle of penetration to the AVCN was oblique to the rostrocaudal axis by 30–60° caudolateral-to-rostromedial and ∼30° caudodorsal-to-rostroventral. Responses of single or multiple units to tone burst just above threshold were monitored by ear or recorded using a unit event timer connected to the computer. These responses were used to map the best frequency during the penetration. Once the desired site was found, small volumes (200–300 nl) were pressure-injected with a Picospritzer (General Valve, Fairfield, NJ) into the rostral right AVCN. Postoperative recovery was uneventful, and only a transient ataxia of the ipsilateral hind limb accompanied the small cerebellar lesion. Postoperative analgesic (Nubain, intravenous or subcutaneous) was routinely administered immediately postoperatively and also during the survival period if indicated.
After 7–10 d survival, animals were deeply anesthetized (Nembutal, intravenous) and euthanized by cardiac perfusion with 25–50 ml of washout (2% sucrose and 0.05% lidocaine in 0.12 mphosphate buffer, pH 7.3–7.4) and 1000 ml of fixative (4% paraformaldehyde and 0.2% glutaraldehyde in 0.12 mphosphate buffer). The brains were blocked with a Rasmussen macrotome (in the anatomical transverse plane) or with the stereotaxic device (20° caudal to the Horsley–Clarke frontal plane). The plane of cut was perpendicular to the blocking plane and was, therefore, near horizontal. The tissue containing the cochlear nucleus and the superior olivary complex was cut into 100-μm-thick sections. All sections were collected in 0.12 m phosphate buffer. Sections were cryoprotected in 5, 10, and 20% dimethyl sulfoxide for 10 min each before freeze-thawing the tissue four times (Oliver et al., 1994). After rinsing the sections in 0.12 m phosphate buffer, the tissue was processed for avidin–biotin histochemistry (PK4000; Vector Laboratories, Burlingame, CA) following the method of Oliver et al. (1994). One modification for the present experiments was to extend the incubation time of the avidin–biotin reaction to 40 hr at 4°C in all but two cases. Sections were mounted onto clean glass microscope slides from alpha terpineol (T31–1; Fisher Scientific, Springfield, NJ) and sealed under coverslips. Slides were dried in the horizontal position for at least 1 week before viewing under oil immersion.
Analysis. Microscopic analysis used low-magnification drawings and high-magnification 3D reconstructions. Low-magnification, camera lucida drawings (×20) were made with a Zeiss Axioskop microscope to show injection sites and dextran-filled axons. Most axons were completely filled at their distal ends and somewhat less intensely labeled proximally. Even when labeling was less intense, it was readily visible at the axonal membrane and permitted accurate estimates of axonal diameter. Detailed analysis and 3D reconstructions were made with a Neurolucida system (Microbrightfield, Inc., Colchester, VT) that included a Zeiss Axioskop light microscope, a video camera (CCD-72; Dage MTI, Michigan City, IN), a motorized stage controller (MC2000; Ludl Electronics Products, Hawthorne, NY), a digitizing tablet (SummaSketch III; Calcomp Technology, Anaheim, CA), and a personal computer. No corrections were made for shrinkage. Axons were selected initially at random. Later axons were chosen based on the location of their terminal fields in the MSO.
In earlier 3D reconstructions (case 94–69), individual axons were drawn first at 600× with a camera lucida and a Plan-Neofluar 63×, 1.25 NA lens. Later, the drawings were entered into the Neurolucida system with the digitizing tablet where the XY data points were collected every 2 μm on average (487 points/mm of axon). Axonal diameter was measured with a ruler every 30 cm on the drawing (500 μm of axon), and this value was entered with subsequent XY data points until the next measurement. The depth coordinates for portions of the axon within the interior of each section were linearly interpolated.
Most other axons (including all from case 94–89) were digitized directly on the microscope using a Plan-Apochromat 40×, 1.0 NA oil lens and the video camera. The XYZ data points were collected every 3.75 μm on average (267 points/mm). Although reconstructions for axons 6 and 7 were extensive in the MSO, they could not be followed proximally into the cochlear nucleus. For our numerical analyses, we substituted a portion from nearby axon 4 for the missing segment based on the most proximal section in which each axon could be traced. The length of the substituted segment was 2.2 mm for axon 6 and 2.8 mm for axon 7.
The rostrocaudal location of the endings of reconstructed axons and the length of axon leading to them was determined. The length from the end of the axon at the injection site to each terminal was calculated as the sum of the distances between adjacent XYZ coordinates in route to the terminal. To calculate the rostrocaudal location of the ending in MSO, axons were aligned based on low-magnification drawing of the axons in case 94–69 in which axons were drawn using a conventional camera lucida. In the second case (94–89), reconstructed using the Neurolucida microscope, the relative locations were determined based on the location of each axon near the midline. The distance of each ending from the rostral pole of the MSO was calculated in the parasagittal plane (omitting the mediolateral coordinate), and this distance was correlated to the length of the axon by a linear regression analysis.
Statistical analyses were used to compare axon diameters within and between cases and to compare different data collection methods. To test similarities between animals, separate samples of axons that crossed the midline were measured with the video-based system. Still other partially reconstructed axons were drawn to compare the morphology of axons in different parts of MSO. In each instance, a Student’st test for two independent samples was used to determine whether samples were statistically different. Independent samples of partially reconstructed axons were drawn with our video-based Neurolucida system to determine whether the Plan-Apochromat 40×, 1.0 NA oil and Plan-Neofluar 63×, 1.25 NA lenses would produce the same measurements. Four axonal segments were measured with both lenses. Measures of diameter and length were not significantly different for these two lenses.
Model of travel times. The travel time from the AVCN to the MSO terminals was estimated and took into account the axon diameter, which we could visualize in our intracellular-like filling. Waxman and Bennett (1972) showed that the ratio (RV) of the velocity of the action potential to the diameter of the axon without the myelin was 9.167 mm · msec−1 · μm−1 in mammalian axons. For example, an axon of 1 μm diameter (without myelin) conducts an action potential at 9.167 mm/msec. This rate was similar to that determined previously in the peripheral nervous system [8.7 mm/msec (Gasser and Grundfest, 1939)]. In the present discussion, we estimated conduction time (CT, msec) between two pairs of XYZ coordinates of our axons according to the formula:CT = L / (d × RV) where L(in millimeters) represents length of the axon between two XYZ coordinates, and d (in micrometers) is the axonal diameter between these two points. To estimate the total travel time, we summed the conduction times between each pair of XYZ coordinates from the injection site to each terminal bouton in the MSO. Travel times were correlated with the position of the terminals in the MSO by use of a linear regression analysis.
Modeling of ITD tuning and the effect of variation of travel time. We mathematically modeled the hypothetical tuning to ITDs of a neuron in the MSO that receives inputs with fixed travel times from the ipsilateral and contralateral sides. The input from each side was assumed to be a half-wave rectified, then squared, sinusoid at the frequency of stimulation (Bernstein and Trahiotis, 1996), a function that closely approximates auditory nerve responses (Johnson, 1980). The response of the MSO neuron as a function of ITD was taken to be the convolution of the ipsilateral and contralateral inputs. Such a model assumes that the temporal window over which coincidence is detected is brief compared with the period of the sinusoid. The tuning of the model neuron to ITDs was calculated as the range of ITDs (Wth) over which the response was >50% of the maximum.
The effect of variation in travel time (caused by conduction along axonal branches of different length) on the theoretical tuning of the model neuron was estimated from the average residual errors of the linear regression of the travel times. First, the individual average ipsilateral residual variances,sij2, was calculated for each axon:
| Equation 1 |
where xijk is the distance of the kth ending in the jth axon from the rostral pole of the ipsilateral MSO, Tijk is the calculated travel time for action potentials to these endings, nijis the number of endings the axon makes in the ipsilateral MSO, andfij() is the linear fit (see Fig. 13). The individual average residual contralateral variances,scj2, were calculated similarly. The individual average ipsilateral residual variances of axons were averaged together to yield an average ipsilateral residual variance,si2:
| Equation 2 |
where Ni is the number of axons with endings in the ipsilateral MSO that did not have restricted termination fields. The average contralateral residual variancesc2 was calculated similarly. The average ipsilateral and contralateral variances were then combined and converted to an effective tuning widthWeff:
| Equation 3 |
which assumes that the error was normally distributed. Finally, the effect on the hypothetical tuning width Wth(see above) was assessed by estimating the tuning width that would result if the effect of the residual error were included:
| Equation 4 |
Fig. 13.
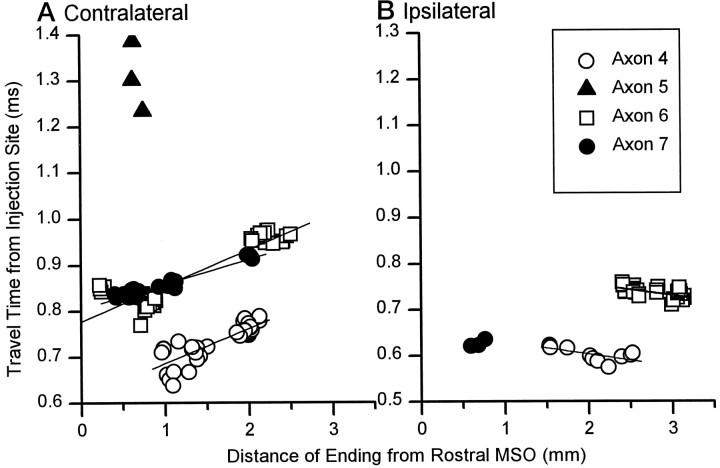
The travel time from injection site to each ending in MSO is plotted against the distance of that ending from the rostral MSO for case 94–89. Slopes were calculated for individual axons with terminals that were distributed >0.2 mm along the rostrocaudal extent of MSO. Terminals at the entry point on the ipsilateral side at 1.5 mm were also not included in the calculations.
RESULTS
Axons from two cases provided the best material to analyze the features related to a delay line for binaural processing. Cases 94–69 and 94–89 had superior axonal filling and a continuous histochemical reaction through the middle of the 100-μm-thick sections. We studied the axons from these two cases in detail, and they provided all of the 3D reconstructions in the present analysis. We first describe the injection sites in the AVCN and then present a qualitative analysis of the axonal branching patterns in the MSO. Next, the axonal diameters and terminals fields are analyzed. Finally, we present the measurements of the lengths of the axons as they pertain to construction of a delay line.
AVCN injection sites and MSO projections
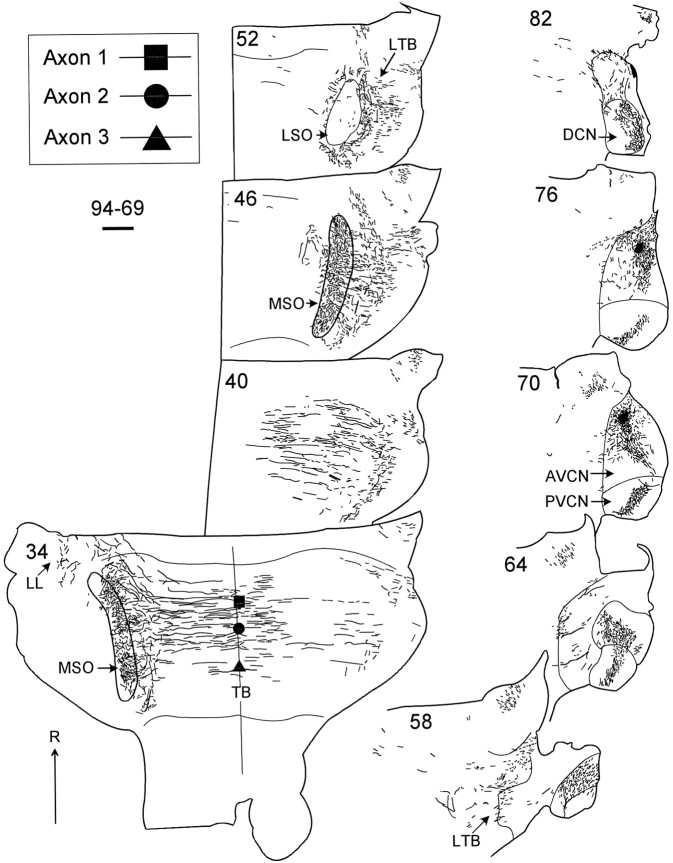
Both cases had small injections of dextran in rostral AVCN at best frequencies of ∼1.5–1.75 kHz. In case 94–69, the injection site was in the rostral AVCN (Fig. 2, sections70, 76), and units had a best frequency of 1.75 kHz. The injection center was small (∼250 μm in diameter) but extended ∼600 μm parallel to the electrode track. Within the cochlear nucleus, dextran-labeled axons were primarily in a single lamina in the AVCN. This lamina joined a similar lamina in the posteroventral cochlear nucleus that traveled dorsally into the dorsal cochlear nucleus (Fig. 2, sections 64–82). This intranuclear labeling probably included both local axons and retrograde labeling of primary afferents from the eighth nerve. Projections from AVCN traveled to the superior olive via the lateral trapezoid body (Fig. 2, sections 58, 52). The horizontal sections in Figure 2 show that the labeled axons were well distributed along the rostrocaudal extent of the ipsilateral (Fig. 2, section46) and contralateral MSO (Fig. 2, section34) and the intervening trapezoid body. Most axons terminated in a horizontal layer at least 500-μm-thick in the dorsoventral plane. Because the plane of section in this case was rolled ∼17° relative to the anatomical horizontal plane (see Materials and Methods), the layer of axons in the right and left MSO are in different sections, and the MSO has a different shape on the two sides. The left MSO is seen in more ventral sections. Labeled axons from AVCN also projected to the lateral limb of the lateral superior olive (LSO) ipsilateral to the injection (data not shown) and to periolivary regions lateral to the ipsilateral MSO and medial to the contralateral MSO. A smaller number of axons continued rostrodorsally into the contralateral lateral lemniscus (Fig. 2, section34, LL).
Fig. 2.
Lower section numbers are more ventral. The injection site was located in the 1.75 kHz area of the rostral AVCN (sections 70, 76).Symbols in section 34 indicate the locations of three reconstructed axons where they cross the midline (filled square, axon 1 in Fig.4A; filled circle, axon 2 in Fig.4B; filled triangle, axon 3 in Fig. 6A). Scale bar, 1 mm. DCN, Dorsal cochlear nucleus; LTB, Lateral trapezoid body;PVCN, posteroventral cochlear nucleus; R, rostral.
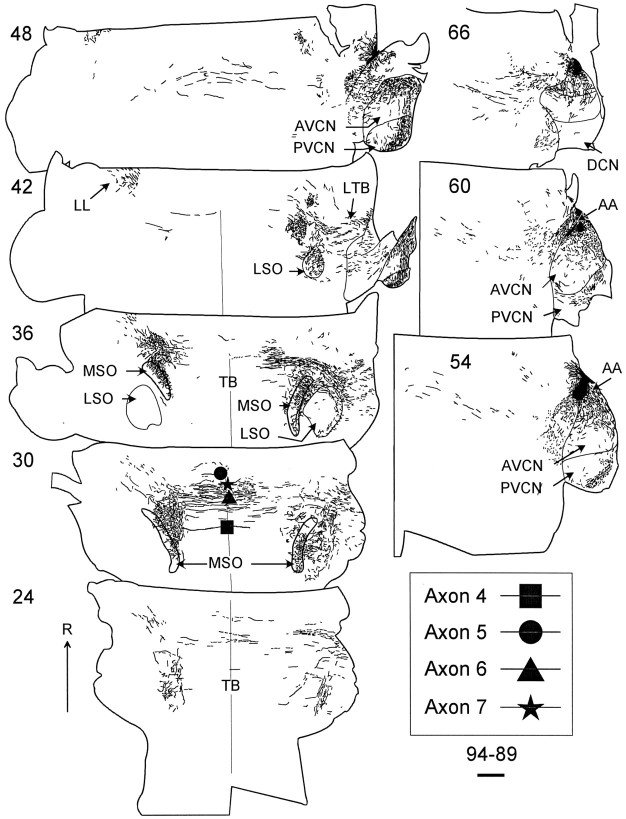
In case 94–89, the injection site was located at the rostromedial border of AVCN, and the best frequency at the injection site was 1.5 kHz. This case had a slightly bigger, somewhat more rostral injection site than the other case, but still showed a similar pattern of labeling (Fig. 3). The injection was more spherical (500–600 μm in diameter), and it extended to the lateral surface. Labeled axons projecting within the cochlear nucleus and lateral trapezoid body were similar to those in 94–69. Case 94–89 was cut in the Horsley–Clark horizontal plane where the rostral parts of the MSO are encountered in more dorsal sections. Labeled fibers projected bilaterally along the entire rostrocaudal extent of MSO (Fig.3, sections 30, 36). However, most fibers tended to cross in the rostral half of the trapezoid body. Additional projections were seen in the low-frequency LSO (Fig. 3, sections36, 42) and periolivary nuclei. Axons continued into the contralateral lateral lemniscus (Fig. 3, sections42, 48).
Fig. 3.
Low-magnification drawings of case 94–89 that show the location of the dextran-filled axons in the 100-μm-thick horizontal sections. Here, the more dorsal sections contain the most rostral parts of MSO. A few axons crossed the midline near the center of the rostrocaudal extent of the trapezoid body (TB), whereas none crossed caudally. Symbols in section30 show four reconstructed axons where they cross the midline (filled square, axon 4 in Fig.4C; filled circle, axon 5 in Fig.6B; filled triangle, axon 6 in Fig. 5B; filled star, axon 7 in Fig.5A). Scale bar, 1 mm. AA, Anterior part of AVCN.
Branching patterns of AVCN axons
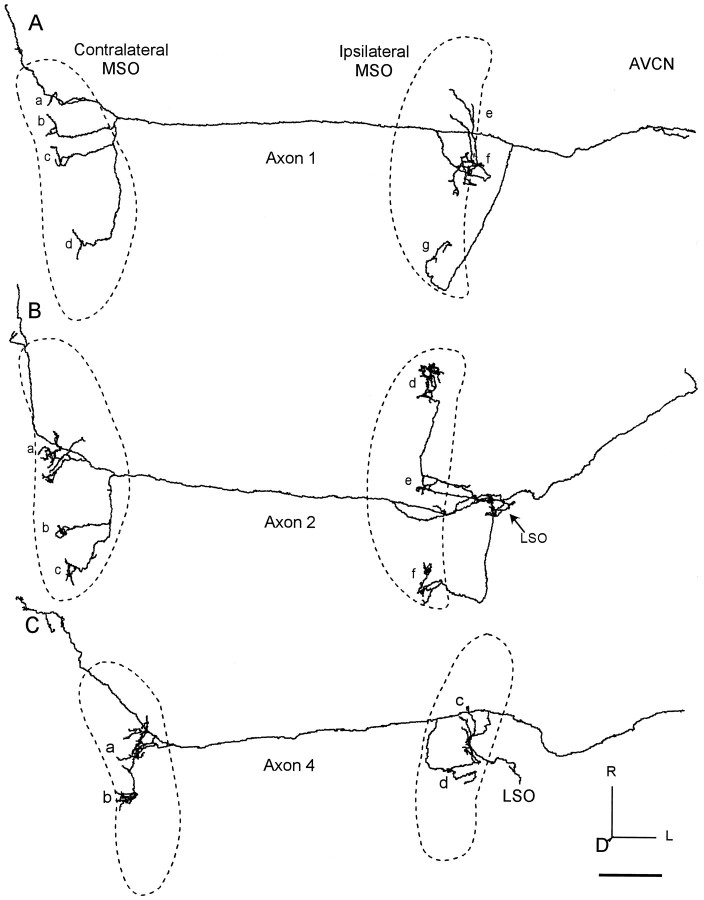
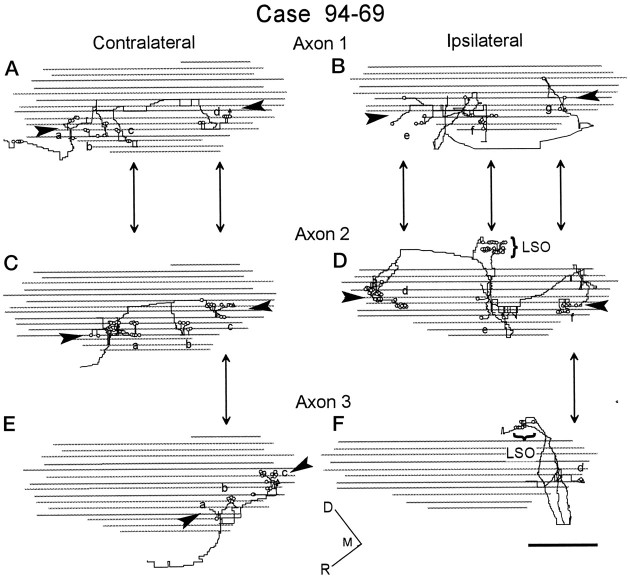
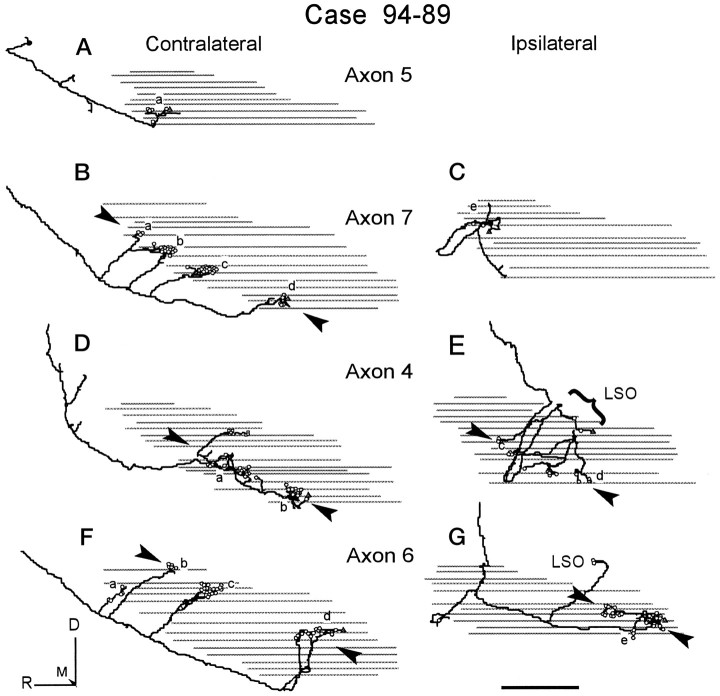
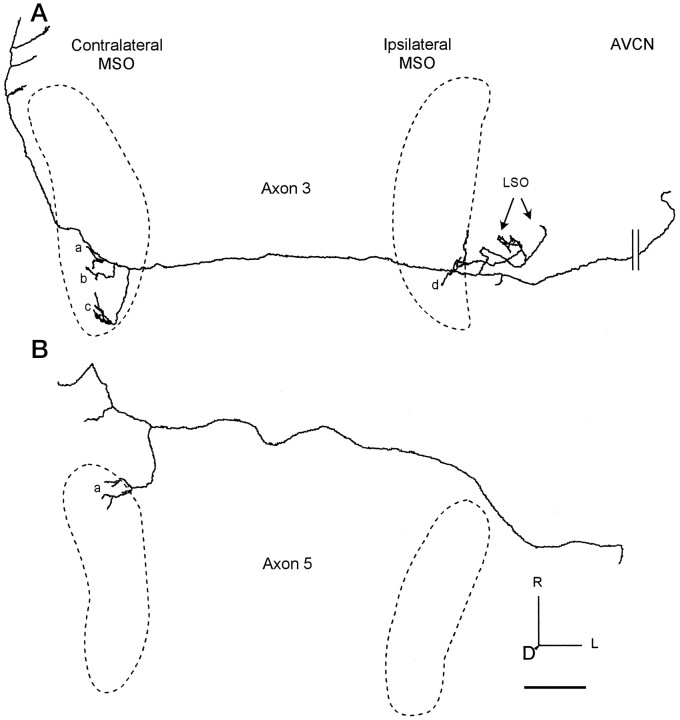
Reconstructions were made of 17 axons, and the seven most completely reconstructed axons are shown in Figures4-6 (horizontal view) and Figures 9 and 10 (sagittal view). These images are sufficient to represent the general, qualitative features of the branching pattern, but estimates of actual length required quantitative analysis (presented below). Each 3D reconstruction contained from 5010 to 9880 data points. The location of each reconstructed axon as it crossed the midline in the trapezoid body is shown in Figures 2 and 3(symbols).
Fig. 4.
Three reconstructed axons with ladder-like branching pattern on the contralateral side and extensive branching on the ipsilateral side. The location of each MSO is indicated by thedashed line. A, Axon 1 terminated over the entire rostrocaudal length in the contralateral MSO (clusters of terminals a–d) and most of the ipsilateral side (clusters of terminalse–g). B, Axon 2 went to the central (a) and caudal parts (b, c) of contralateral MSO. Ipsilateral branches terminated in LSO (arrow) and MSO (d–f). C, Axon 4 terminated in the middle MSO on the contralateral side (a, b) and a similar area on the ipsilateral side (c, d). Scale bar, 1 mm.D, Dorsal; L, lateral.
Fig. 9.
Sagittal views of each half of the three reconstructed axons in case 94–69. Open circles show axonal endings, whereas the open triangle indicates the most caudal ending in each MSO. Arrowheads show layers of terminals. Corresponding locations where the axons may overlap are indicated with double-headed arrows. Boutons in the ipsilateral LSO are marked by a bracket. Terminal fields of axonal endings on collateral branches (a–g) are labeled as in Figures 4-6.A, B, Axon 1 (Fig.4A). C, D, Axon 2 (Fig. 4B). E, F, Axon 3 (Fig. 6A). The gray linesindicate the digitized outline of MSO from each horizontal section, as now seen in this sagittal view. Large steps (equal to section thickness) are a consequence of interpolation of depth coordinates, whereas small steps are an aliasing artifact and are not present in the data. Scale bar, 1 mm. M, Medial.
Fig. 10.
Sagittal view of each half of the four reconstructed axons in case 94–89. Symbols, gray lines, arrowheads, and arrows as in Figure 9. A, Axon 5 (Fig. 6B).B, C, Axon 7 (Fig. 5A).D, E, Axon 4 (Fig. 4C).F, G, Axon 6 (Fig. 5B). Small steps are an aliasing artifact and are not present in the data. Scale bar, 1 mm.
Reconstructed axons had different branching patterns in the contralateral and ipsilateral MSO. All of the axons reconstructed continued into the contralateral lateral lemniscus after the branches to the superior olive and often made a series of collateral side branches in the ventral nucleus of the lateral lemniscus (Figs.4B,C,6A,B). Many of the axons also terminated in the ipsilateral LSO (Figs.4B,C, 5B,6A).
Fig. 6.
Axons with restricted branching patterns. The location of each MSO is indicated by the dashed line.A, Axon 3 terminated in caudal MSO contralaterally (clusters of terminals a–c) and ipsilaterally (e). It also terminated in LSO (arrows). B, Axon 5 terminated only in the contralateral, rostral MSO (a). The axon continued to the ventral nucleus of the lateral lemniscus, where it gave off collaterals. Scale bar, 1 mm.
Fig. 5.
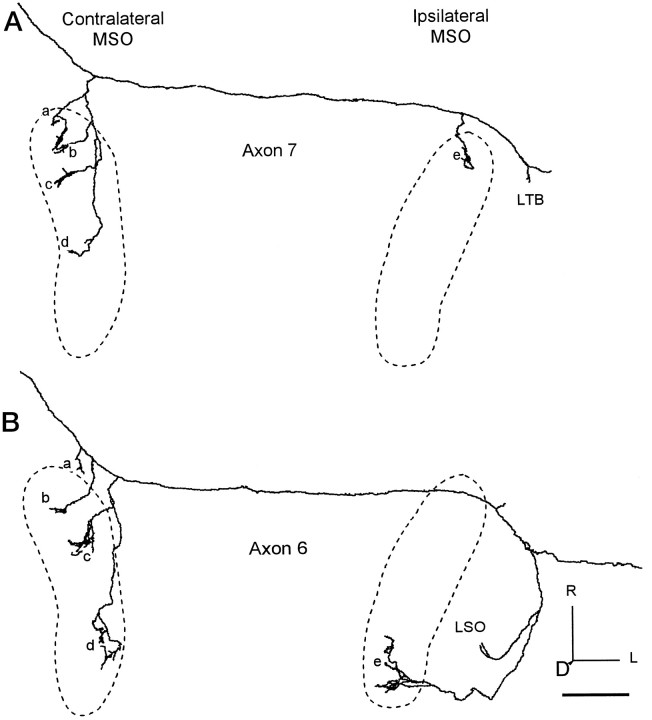
Axons with limited ipsilateral branches and relatively more extensive contralateral branches. The location of each MSO is indicated by the dashed line. A, Axon 7 in the contralateral MSO has successively longer branches extending caudally (clusters of terminalsa–d), whereas on the ipsilateral side, terminals only were in rostral MSO (e). One collateral branch ended in the area of the lateral trapezoid body (LTB). B, Axon 6 terminated over the length of MSO on the contralateral side (b–d). Branch a was in the medial periolivary area. On the ipsilateral side, one branch terminated in LSO, whereas the other went to the caudal MSO (e). Scale bar, 1 mm.
Contralateral MSO
Some axons terminated throughout the rostrocaudal length of the nucleus with branches that systematically increased in length caudally. This pattern resembled Jeffress’ original scheme for contralateral axons (Fig. 1A). The best example was axon 1 (Fig.4A, left). It had branches that terminated over the entire rostrocaudal length of the contralateral MSO. The branches in the rostral MSO were the shortest (Fig.4Aa) with successively longer branches reaching the central (Fig. 4Ab,c) and caudal parts (Fig.4Ad) of the nucleus. This axon crossed the midline as one of the most rostral labeled axons in this case (Fig. 2,filled square).
Axons 7 (Fig. 5A) and 6 (Fig. 5B) also had an obvious, ladder-like, gradation in axonal collateral length in the contralateral MSO. Axon 7 crossed the midline as one of the most rostral axons in case 94–89 (Fig. 3, filled star). On the contralateral side, a single branch gave rise to four subbranches, each of which extended further caudally. The third of these major branches (Fig. 5Ac) made terminals in the central MSO, and the fourth (Fig. 5Ad) terminated more caudally but did not extend to the caudal pole of the MSO. Axon 6 (Fig. 5B) crossed the midline in a central location along with many other axons (Fig. 3, filled triangle). Its three major contralateral branches terminated in the rostral, central, and caudal extremes of the MSO (Fig. 5Bb–d). A smaller branch terminated medial to MSO (Fig. 5Ba).
Still other axons displayed a similar branching pattern but did not extend the full rostrocaudal length of the nucleus. Axon 2 projected to only the central and caudal MSO on the contralateral side (Fig.4B, left). It crossed the trapezoid body centrally (Fig. 2, filled circle). The shortest main branch terminated directly in the central third of MSO with multiple boutons (Fig. 4Ba). A longer branch (Fig.4Bb,c) extended into the caudal third of the nucleus. Axon 4 also had a restricted termination pattern in the contralateral MSO (Fig. 4C). It crossed the midline most caudally of the axons reconstructed in case 94–89 (Fig. 3, filled square) and terminated primarily in the central part of the MSO. The innervation pattern of these axons did not precisely fit any of the schemes outlined in Figure 1, but instead it appeared intermediate between those involving innervation of the full MSO (Fig.1A) and those involving a restricted rostrocaudal innervation (Fig. 1B).
Some axons innervated an even more limited rostrocaudal extent of the contralateral MSO (Fig. 6). Axon 3 crossed the midline as the most caudal completely filled labeled axon in case 94–69 (Fig. 2,filled triangle). Of its three, short, daughter branches in the contralateral MSO, the caudal-most helped define the most caudal pole of the nucleus (Fig. 6Ac). The most restricted branching pattern seen was that of axon 5 (Fig.6B). It crossed the midline as the most rostral completely filled labeled axon in this case (Fig. 3, filled circle). The first branch of the axon occurred rostromedial to the contralateral MSO and entered the rostral end of the nucleus. All of the endings were restricted to the rostral third of the MSO (Fig. 6Ba). This pattern seems consonant with the pattern in Figure 1B.
Ipsilateral MSO
Most axons in the ipsilateral MSO had multiple collaterals, but it was not immediately evident that collaterals had graduated lengths along the rostrocaudal axis. Thus, in the qualitative analysis of the 3D reconstructions, the ipsilateral innervation pattern did not appear to conform to Jeffress’ original scheme (Fig. 1A). Some axons, such as axons 1 (Fig. 4A) and 2 (Fig.4B) innervated most of the rostrocaudal extent of MSO. For axon 1, the most direct route was to the caudal MSO (Fig.4Ag) via a branch point lateral to the MSO. Another branch point occurred after the main axon crossed over the ipsilateral MSO to the medial side. This branch turned and made several convoluted loops in the central MSO (Fig. 4Af) before terminating or continuing rostrally to the anterior part of the nucleus (Fig. 4Ae). Axon 2 crossed over the ipsilateral MSO to the medial side and made a recurrent, looping branch with a few endings in the central MSO (Fig. 4Be) and more endings in the LSO. A long branch projected to the caudal MSO (Fig.4Bf) and a still longer branch to the rostral MSO (Fig. 4Bd).
Other axons did not extend the full length of MSO or had restricted terminal fields. Axon 4 (Fig. 4C) terminated primarily in the central part of the ipsilateral MSO. Most endings came from the branch point medial to MSO with more rostrally located endings on longer collaterals (Fig. 4Cc). Axon 6 (Fig. 5B) gave off only a single major branch on the ipsilateral side that terminated caudally (Fig. 5Be). It began lateral to the superior olivary complex and looped around the LSO where it branched. One branch terminated in LSO, and the other branch continued ventrally into the caudal MSO and terminated more caudally than the most caudal branches on the contralateral side in this case. Axons 3 (Fig.6A) and 7 (Fig. 5A) showed the most restricted pattern of innervation, consistent with the pattern in Figure 1B or 1D. Axon 3 projected only to the caudal part of MSO ipsilaterally (Fig.6Ad). Axon 7 had only a single terminal site at the rostral end of the ipsilateral MSO (Fig. 5Ae) that matched the rostral location of the most rostral contralateral terminals (Fig.5Aa). One axon (5; Fig. 6B) bypassed the ipsilateral superior olive altogether.
The rostrocaudal extent of innervation on the two sides could be similar or different. For example, axon 1 (Fig. 4A) innervated the entire extent of MSO on both sides, and axon 4 (Fig.4C) innervated the central third bilaterally. On the other hand, axons 7 (Fig. 5A) and 6 (Fig. 5B) innervated smaller regions on the ipsilateral side than on the contralateral side.
Axonal diameter
Axonal diameter influences conduction velocity and, therefore, might be an important factor for the construction of a delay line. Each axon from the AVCN had a substantial main trunk that branched successively to form relatively simple terminal arbors. In both the lateral and medial trapezoid body, the axons had fairly uniform diameters. At the midline, axons from both cases were ∼2 μm in diameter, not including the unstained compact myelin (94–69: 2.09 μm ± 0.33 SD, n = 76; 94–89: 2.21 μm ± 0.44 SD, n = 82). There was no statistical difference between the cases.
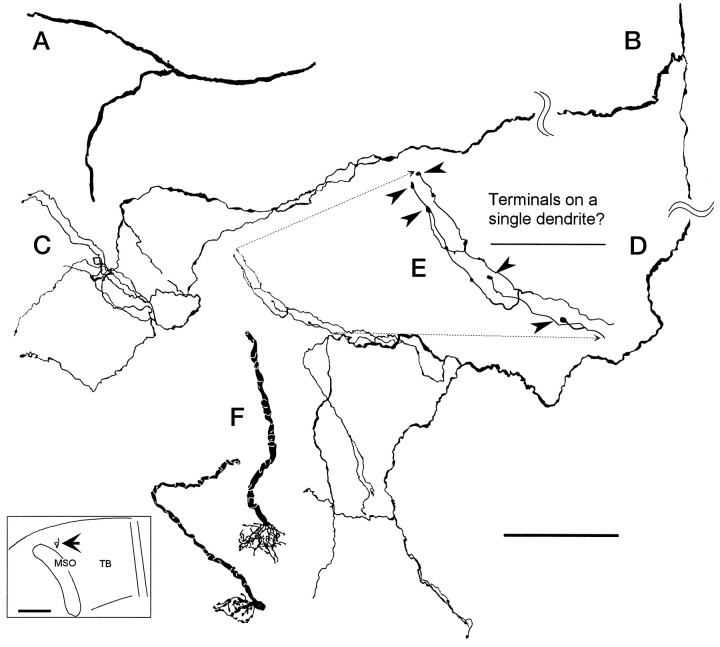
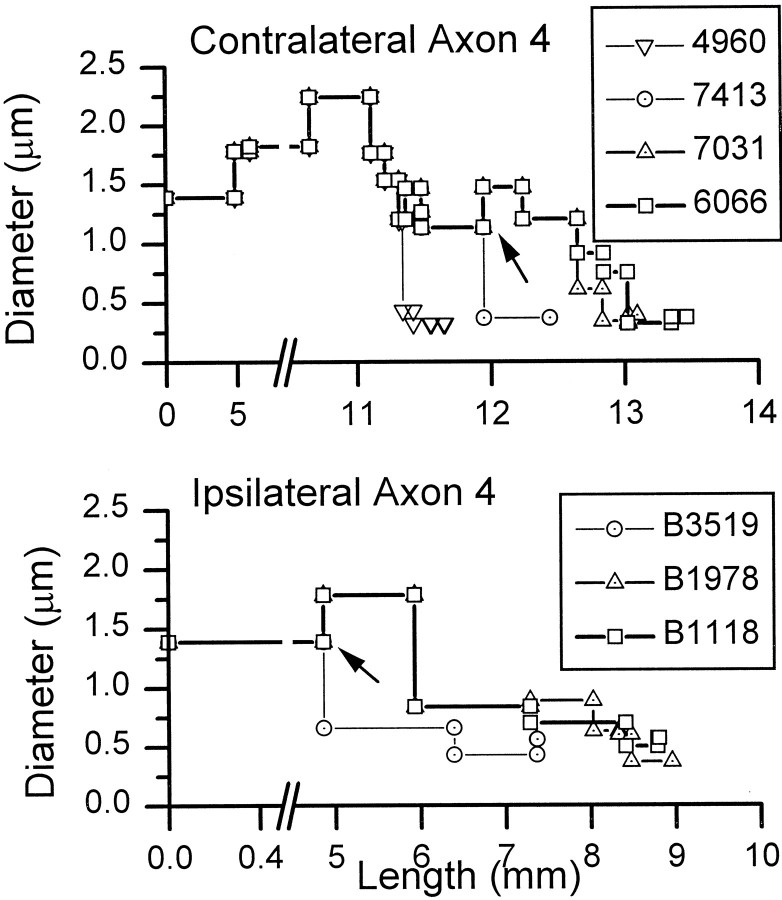
After reaching the MSO on one side or the other, the axons usually branched into daughter branches of unequal size. Figure7A shows an axon branching to enter the contralateral MSO. More distal branches were usually smaller than the parent branch (Fig. 7B–D). Measurements of axon diameter in case 94–89 allowed us to calculate the average diameter of the axon between branch points. Figure8 shows examples from axon 4. On both the contralateral and ipsilateral sides, the average diameter after a branch point usually decreased sharply for the shorter branch, whereas the longer continuing branch maintained or increased its diameter briefly (Fig. 8, arrows). Terminal fields in the MSO contained the distal branches with thin diameters (Fig.7C,D). Figure 8 shows how the axonal diameter in a distal branch drops abruptly to <0.5 μm and then remains constant until the branch terminates.
Fig. 7.
Camera lucida drawings of axon 2 in the contralateral MSO. A, First branch on contralateral side after crossing the midline trapezoid body. B, Second branch on contralateral side. C, Details of the middle terminals (Fig. 4B,b).D, Details of caudal terminals; see c in Figure 4B. E, The enlarged area ofD shows the location of five terminal boutons (arrowheads). These boutons could terminate on a single dendrite. F, Two calyceal endings in the medial trapezoid body in the superior olive contralateral to the cochlear nucleus injection. Both endings were seen in the same section of case 94–89. Both pieces were well filled at their terminals but could not be traced over any appreciable distance. Insert shows the position of calyceal endings (arrow) located medial to the rostral end of MSO. Scale bars:A–D, 100 μm; E, 50 μm; insert, 1 mm.
Fig. 8.
Average diameter of axon 4 between branch points plotted as a function of length from injection site. Each branch point is indicated by a symbol. Top, The portion of the axon leading to four terminal boutons on different branches of the axon. Bottom, The branches leading to three terminals. Arrows indicate branches where one branch decreases in diameter while the other increases.
Axonal terminals
Distal branches of axons in the MSO terminated with a single bouton or several boutons en passant. The density of terminals from single AVCN axons was low. Typical terminal fields are shown in Figure 7, C and D. The field in Figure7C is at least 100 μm in diameter and contains only five terminal boutons. The field in Figure 7D is larger and contains ∼11 terminals. Some of these cluster in a tighter arrangement shown in an enlargement (Fig. 7E) and possibly are along a dendrite of a MSO neuron. The morphology and density of terminal fields in MSO differs from that of calyceal endings in the medial nucleus of the trapezoid body (Fig. 7F,inset). Figure 7F shows the only two calyceal endings labeled in our experiments. Most calyceal endings arise from globular bushy cells in the posterior AVCN (Tolbert et al., 1982). In contrast to the terminal fields in the MSO, shown at the same magnification, the calyceal endings had a relatively higher-density terminal field with many bouton-like swellings within an area 30–40 μm in diameter.
Laminar arrangement of terminals
Sagittal views of the reconstructed axons showed clusters of terminal boutons arranged in broad horizontal layers (Figs.9, 10). This view is 90° to the horizontal view in the previous figures. On the contralateral side, the three axons in case 94–69 show terminal boutons arranged in a single laminar plane, ∼1 mm at its thickest dorsoventral extent (Fig.9A,C,E,arrowheads). Axonal boutons are indicated with open circles in the figure, and the groups of terminals are indicated by the letters used in Figures 4-6. The caudal terminal fields of all three axons overlapped (Fig. 9Ad,Cc,Eb,double arrows), and the central terminal fields of two of the axons overlapped as well (Fig. 9Ac,Ca). On the ipsilateral side (Fig. 9B,D,arrowheads), terminals also were restricted to a laminar plane, but this layer was less tightly defined than on the contralateral side. Groups of terminals also overlapped on the ipsilateral side (e.g., Fig. 9Be overlaps withDd). The two clusters of boutons that innervate the ipsilateral LSO in axons 2 and 3 (Fig.9D,F, LSO) are actually lateral.
In case 94–89, some axons terminated in only one layer, whereas others terminated in two. The multiple branches of a single axon were typically arranged in a single laminar plane on the contralateral side. For example, axon 7 terminated in a layer in the ventral half of the MSO (Fig. 8B, arrowheads). The terminal fields of this axon overlapped with that of axon 5 (Fig.8A) and most of axon 4 (Fig. 10D). Other axons also had terminals in a second, more dorsal location. Axon 6 (Fig. 10F) had most of its terminals dorsally in a laminar plane. Axon 4 had only a few terminals in this same dorsal location (Fig. 10D). On the ipsilateral side, there was also evidence for two planes of termination, although the rostrocaudal extent of the terminals was limited. Most of the terminals on the ipsilateral side were located in the plane that corresponded to the ventral layer on the contralateral side (e.g., Fig.10E, Axon 4). Axon 6 had terminals in two laminar planes in the ipsilateral MSO (Fig.10G). Most terminals were located dorsally, whereas a few terminals (Fig. 10Ge) were at the more ventral level seen in the other reconstructed axons in this case.
Quantitative analysis of terminal density
Because the qualitative analysis of the axons on the ipsilateral side did not suggest a gradient of axonal length, details of the axonal terminals were examined to see if they might contribute to a gradient in neural delay. Irregularities in the axon, such as boutons in passage, might slow an action potential (Carr and Konishi, 1988; Manor et al., 1991) and could contribute to conduction delays in the ipsilateral MSO. For example, action potentials in the rostral part of the ipsilateral MSO could be delayed relative to those to the caudal part. We examined the axons in the MSO of both sides to determine whether more boutons in passage were seen in the rostral MSO than in the caudal MSO. We examined the last branch of each axon and categorized them by the presence or absence of boutons en passant (Table 1). On both the contralateral and ipsilateral sides of both cases, the caudal MSO had more terminal branches with en passant boutons. Although there is a rostrocaudal gradient in the prevalence of en passant boutons, it is unlikely to contribute to a differential gradient of neural delay because it is in the same direction on both sides.
Table 1.
Percentage of axonal branches with boutons in passage analyzed in terminal axonal branches (after the last branch point)
| Rostral | Caudal | |||
|---|---|---|---|---|
| N branches | Boutons in passage (%) | N branches | Boutons in passage (%) | |
| Contralateral MSO | ||||
| 94–69 | 95 | 44 | 71 | 51 |
| 94–89 | 96 | 46 | 93 | 55 |
| Ipsilateral MSO | ||||
| 94–69 | 41 | 32 | 36 | 50 |
| 94–89 | 22 | 50 | 54 | 67 |
Axon length as a feature of the delay line
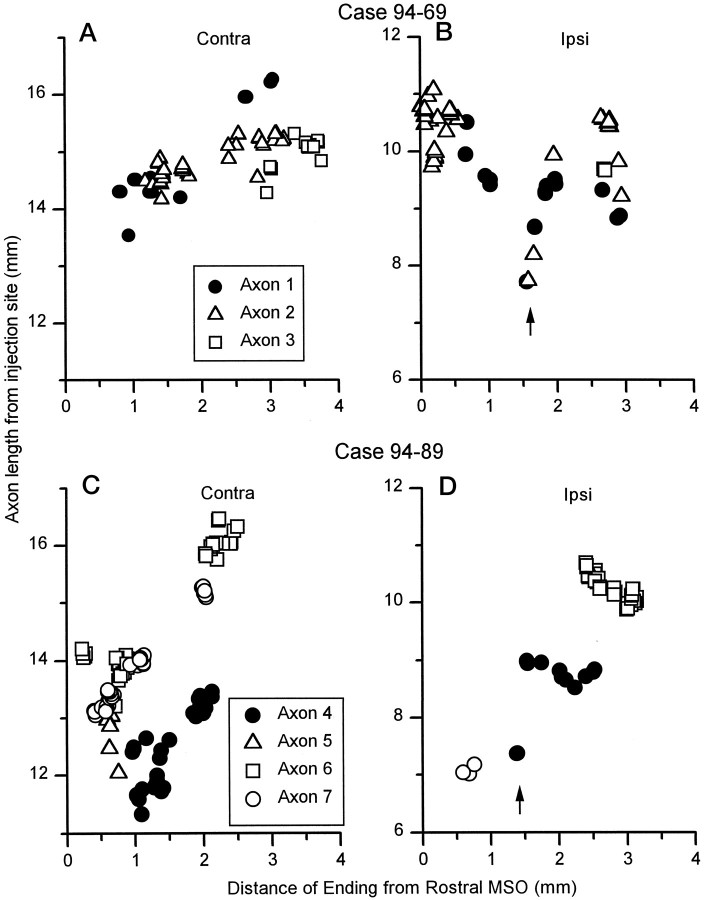
To quantitatively examine the influence of axonal length in creating a gradient of neural delays along the MSO, we calculated the length of the axon from the injection site in AVCN to each terminal in the ipsilateral and contralateral MSO. In the contralateral MSO (Fig.11A,C), six of seven axons terminated over a rostrocaudal extent of half a millimeter or longer. The seventh axon (Fig. 11C, Axon 5) had only six boutons, and the terminal field covered 150 μm. In the six axons that did not have such a highly restricted terminal field, a rostrocaudal gradient was evident (Fig.11A,C). The axonal length to the more rostral terminals was shorter than the length to more caudal terminals. This gradient was evident even in axons that did not innervate the entire length of the MSO. For example, axons 3 (Fig.11A, squares) and 4 (Fig. 11C,filled circles) had terminal fields 0.8 and 1.2 mm long, respectively. Yet, within these terminal fields, the more rostral terminals had relatively shorter axonal lengths. The seventh axon, which had a terminal field of only 150 μm, showed an extremely steep gradient in the opposite direction.
Fig. 11.
Length of axon from the injection site to each individual axonal ending is plotted as a function of the distance of the ending from the rostral MSO. These plots were made for the seven completely reconstructed axons in this study. Ipsilaterally, some axons from both cases (axons 1, 2, 4) gave off short daughter branches with terminal boutons immediately after branching to the ipsilateral MSO. These terminals produced a “dip” in the plot (arrows).
In the ipsilateral MSO, the length of the axon from the injection site in AVCN to each terminal was shorter than to terminals in the contralateral MSO (Fig. 11B,D). Four of six axons had terminal fields with a rostrocaudal extent of half a millimeter or longer. As on the contralateral side, two axons (Fig. 11B,D, axons 3, 7) had restricted termination fields <150 μm (axon 3, 20 μm; axon 7, 90 μm). The terminal field of these axons each had only three terminal boutons. In the four axons with more extensive terminal fields, a reversed but more complex pattern was seen. In general, the more rostral terminals had longer axonal lengths than the more caudal terminals. However, there was a “dip” region ∼1.5 mm from the rostral pole (Fig.11B,D, arrows; see also Fig. 4Af,Be,Cc) where axonal lengths to a few terminals were shorter in three axons. In these axons, the main trunk gave off short collaterals with only two or three terminals (Table 2) as it crossed over the MSO in this region (Fig. 11B,D,arrows). In the two axons with terminal fields <150 μm, gradients in opposite directions were observed.
Table 2.
Gradients of axonal length from AVCN to individual boutons along the rostrocaudal axis of MSO
| Axon | Slope | Slope with dip | N | N with dip |
|---|---|---|---|---|
| Contralateral boutons | ||||
| 1 | 0.97 | 22 | ||
| 2 | 0.41 | 39 | ||
| 3 | 0.71 | 19 | ||
| 4 | 1.21 | 38 | ||
| 6 | 1.28 | 42 | ||
| 7 | 1.33 | 42 | ||
| Ipsilateral boutons | ||||
| 1 | −0.44 | −0.39 | 16 | 19 |
| 2 | −0.06 | −0.11 | 43 | 45 |
| 4 | −0.26 | 0.55 | 12 | 14 |
| 6 | −0.71 | 38 | ||
We next calculated gradients of axonal length along the rostrocaudal dimension of the MSO using linear regression. The axons with small terminal fields had few boutons. Such small terminal fields are smaller than a dendritic tree of a MSO neuron (Smith, 1995) and are unlikely to contribute to a gradient along a 4-mm-long structure. So, we did not calculate the gradients for these axons. In some axons on the ipsilateral side, the complex pattern created by the boutons in the dip region posed another problem. Application of linear regression is inappropriate when there is a strong nonlinearity present (Harris, 1975). The nonlinearity was confirmed with a modified version of a one-sample runs test (Siegel, 1956; Batra et al., 1997a) (p < 0.05). Thus, we excluded the two or three terminals in the dip region to reduce the nonlinearity and permit the calculation of the overall gradient of axonal length.
Calculation of the gradients in axonal length confirmed that the gradients in the contralateral and ipsilateral MSO were in opposite directions and also suggested that the gradient was stronger in the contralateral MSO. For individual axons (Table 2), the contralateral gradient ranged from 0.41–1.33 mm of axon length per millimeter of distance from the rostral end of MSO (mean, 0.98 ± 0.36 SD;n = 6). The ipsilateral gradient ranged from −0.06 to −0.71 mm of axon length per millimeter of distance (−0.37 ± 0.28; n = 4) (Table 2). We note that direction of the slope was changed in only one axon by the exclusion of these boutons (axon 4, Table 2), the axon with the fewest boutons.
There were differences between the two cases. Comparison of the axons in case 94–69 with each other showed that the axon length to the terminals was similar for terminals in the same rostrocaudal location. This was true for both ipsilateral and contralateral branches. In contrast, comparison of the axons in case 94–89 with each other showed that the length to the terminals could be substantially different for different axons. Again, this was true on both the contralateral and ipsilateral sides. The two cases also differed in the gradient of axonal length to terminals at different rostrocaudal locations on the contralateral side. In case 94–69, the slopes of individual axons on this side ranged from 0.41–0.97 mm of axon length per millimeter of distance from the rostral end of MSO (millimeter per millimeter) (mean, 0.70 ± 0.16; n = 3). On the contralateral side of 94–89, the slopes were much steeper (range, 1.20–1.33 mm/mm; mean, 1.27 ± 0.04; n = 3). On the ipsilateral side, the slopes were similar in the two cases (Table 2). Thus, it appears that the gradients in axonal length may differ in different animals, at least on the contralateral side.
DISCUSSION
The present study provides the most complete 3D reconstructions to date of axons that project from the AVCN to the MSO. It is also the first to measure the length of axon from the AVCN to terminals in the MSO. Axons innervated a varying rostrocaudal extent of the MSO. In the contralateral MSO, all axons, except those with restricted fields, had collaterals with lengths that systematically varied in the rostrocaudal direction with shorter collaterals innervating more rostral parts of MSO and longer collaterals innervating more caudal parts of MSO. In the ipsilateral MSO, there was often a reverse, but less steep, gradient in axonal length with greater axonal length associated with more rostral locations.
Axonal branching pattern
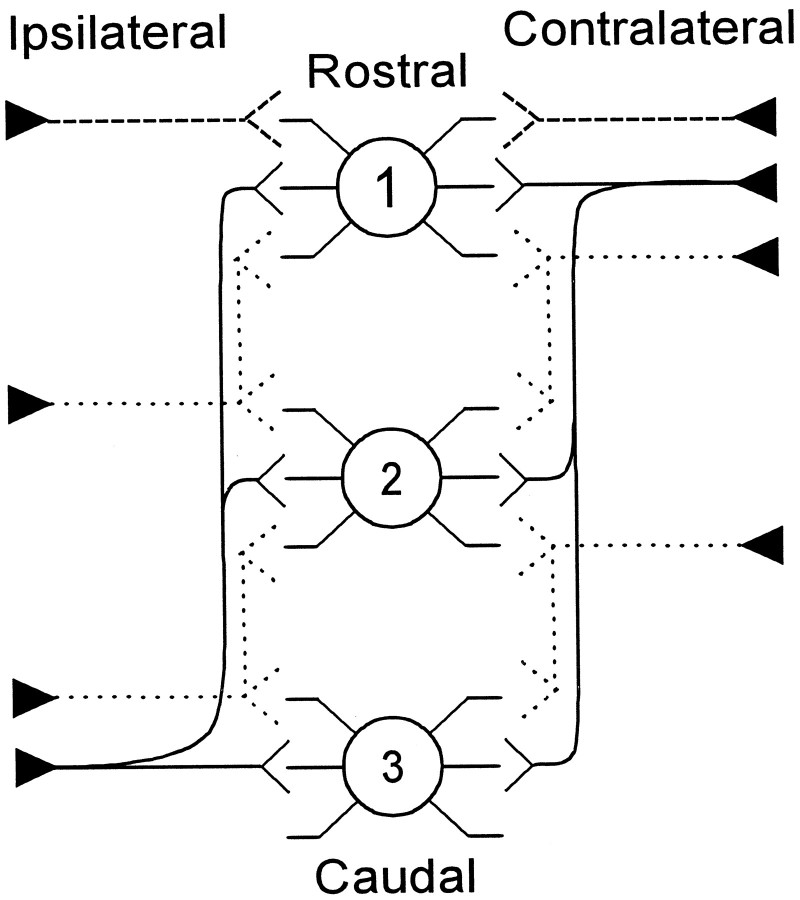
The present quantitative measurements of AVCN axons suggest that axon length is a necessary mechanism for ITD encoding in the MSO. We suggest that there are three types of axons that innervate any point in the MSO: (1) those with long gradients in the lengths of their collaterals (Fig. 12, solid line), (2) those with short gradients (Fig. 12, dotted line), and (3) those with restricted terminal fields and no gradient (Fig. 12, long dashed line). Thus, the mammal employs a combination of the schemes depicted in Figure 1 to generate gradients in conduction time. Gradients of collateral length appear to be present on both the ipsilateral and contralateral sides (Fig. 1A). In addition, axons with restricted fields must also contribute to the generation of ITD coding (Fig.1B).
Fig. 12.
Schematic summary of the innervation patterns of the reconstructed axons from low-frequency rostral AVCN to the MSO. In a pattern similar to the Jeffress model (solid line), on the contralateral side the shortest branch terminated in the rostral end of MSO (1). Successively longer branches went to the middle (2) and caudal (3) ends of MSO. On the ipsilateral side, the shortest branch went to the caudal end of MSO with successively longer branches to central and rostral MSO, respectively. A second pattern was evident in axons with more limited termination pattern (short dashed line). Still, a third pattern was evident where individual axons terminated in restricted field (long dashed lines).
The branching pattern of axons in the contralateral MSO that did not have restricted terminal fields is similar to that described by Smith et al. (1993). They estimated that axons had longer caudal branches and shorter rostral branches from the point at which the first collateral leaves the axon. Our measurements show that individual axons exhibit a gradient in axonal length to their terminals in the contralateral MSO, and this gradient is similar across axons in the same animal. Although the number of axons in both studies were small (nine in Smith et al., 1993; seven in the present paper), the two studies provide consistent evidence that a contralateral gradient in axonal length contributes to ITD coding.
In the ipsilateral MSO, our data indicate that a reversed gradient in axonal length is present in those axons that did not have restricted terminal fields. This pattern was complicated by a region 1.5 mm from the rostral pole that received a few terminals with shorter axonal lengths. Our qualitative observations, including the recurrent trajectory of some axon collaterals, are similar to the seven ipsilateral axons previously reported (Smith et al., 1993). However, the, previous report concluded that the lengths of the axons leading to the ipsilateral terminals were similar, irrespective of terminal location. The measurements in the present analysis demonstrate gradients in all four axons that did not have a restricted terminal field.
A Jeffress-like pattern was also shown in the contralateral projection to the nucleus laminaris, the avian homolog of MSO (Young and Rubel, 1983; Carr and Konishi, 1988, 1990). The avian system differs from that of mammals in that no gradient of axonal length appears to be present in the ipsilateral projection (Fig. 1C). This observation is supported by the absence of any gradient in latency across nucleus laminaris to ipsilateral, electric stimulation (Overholt et al., 1992). The innervation of nucleus laminaris differs from that of the MSO in another way as well. Axons with restricted fields are present only in the embryonic nucleus laminaris and do not appear to play a role in ITD computation in the adult (Young and Rubel, 1986). This difference suggests that the axonal geometry underlying computation of ITD in mammals is more varied than in avians. On the other hand, different species of birds may use different neural mechanisms. In the barn owl, there is evidence that neural delays are controlled by the interval between the nodes of Ranvier within nucleus laminaris and not by the axonal lengths (Carr and Konishi, 1990).
Is axonal length sufficient to account for ITD encoding?
The general features of the termination patterns of AVCN axons are largely consistent with the mechanisms believed to subserve ITD coding. The axonal lengths to terminals in the ipsilateral MSO are shorter than to those in the contralateral MSO. This should lead to a bias in the MSO for ITDs associated with the opposite sound field. Such a bias has been observed (Yin and Chan, 1990; Spitzer and Semple, 1995; Batra et al., 1997a). The gradients in axonal length along the rostrocaudal extent of the MSO suggest that ITDs are organized topographically along this axis, with ITDs corresponding to more lateral sound locations represented caudally.
Two observations do, however, raise the question whether a gradient in axonal length is the only mechanism involved in generating a gradient of sensitivity to ITD along the rostrocaudal extent of the MSO. First, some axons were longer than others, although they terminated at a similar rostrocaudal location. Some of this difference may be attributed to our inability to follow some axons into the cochlear nucleus (see Materials and Methods). However, the differences between axons are too large to be dismissed. A second observation is the difference in the slope of the gradient in the two cases. The gradients for the contralateral innervation were steeper in case 94–89. Thus, either the MSO of cat 94–89 encodes a wider range of ITDs, or some other factor compensates for the greater gradient.
We assessed the contribution of axonal diameter to ITD coding by calculating the time required for action potentials to travel from the AVCN to each terminal in the MSO based on our measurements of the lengths and diameters of the axons (see Materials and Methods). Our results showed that daughter branches often had different diameters from each other and from the parent axon. We wanted to determine whether the gradients in axonal length resulted in a net gradient in neural delays and whether axonal diameter compensated for the differences in length between axons. In case 94–69, the calculated travel times had considerable variance that precluded estimation of the gradients. This large variance was presumably a consequence of the crude measurements of axonal diameter in this case (see Materials and Methods).
Gradients in the travel time from the injection site were found in terminal fields that innervated >0.15 mm of the MSO (Fig.13). The gradients from case 94–89 paralleled the gradients in axonal length observed in these axons. The net gradient in the difference in neural delays was 95 μsec/mm, which is similar to the gradient in the best ITD of MSO neurons (131 μsec/mm) reported by Yin and Chan (1990). Thus, the gradient in travel time suggested by this model can account for a large part of the physiological range of ITDs encoded by a cat. Nevertheless, axon diameter did not compensate for differences in length between axons.
Does scatter in the travel times contribute to the width of ITD curves?
The present model of case 94–89 shows large differences in travel time (up to 700 μsec) between different axons terminating near the same rostrocaudal location (Fig. 13). To inquire whether such large differences in travel time could actually be present, we examined their theoretical influence on the tuning of neurons in the MSO to a particular ITD.
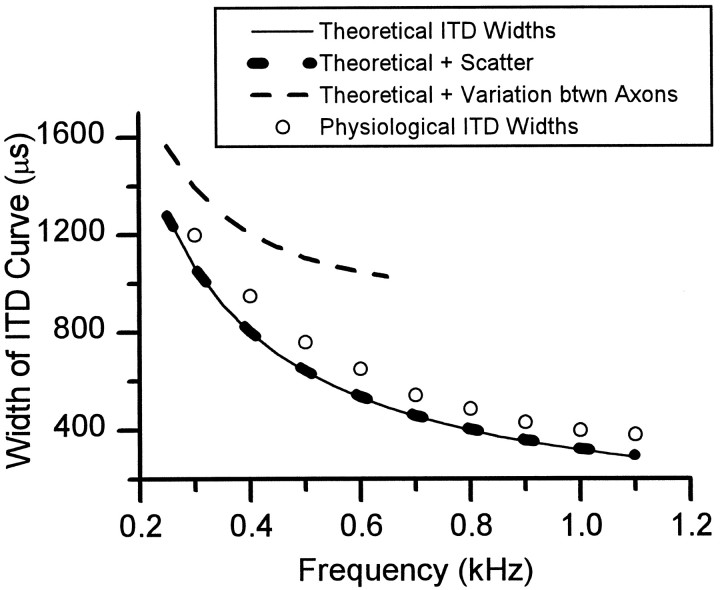
The scatter in the travel times to terminals innervating a particular rostrocaudal location in the MSO should degrade the tuning of neurons to a particular ITD. That is, it should broaden the width of an ITD tuning curve. We first estimated the theoretical width of an ITD curve in the absence of any scatter of conduction times (Fig.14, solid line; see Materials and Methods). These widths decline as a function of frequency. This estimate was less than the reported widths of delay curves in the superior olivary complex (Fig. 14, open circles) (Fitzpatrick et al., 1997). The scatter in travel times along collaterals of the same axon only slightly degraded the theoretical widths of the ITD curves (Fig. 14, bottom,thick dotted line). In contrast, the differences in travel time between different axons estimated from our measurements considerably degraded the theoretical widths (Fig. 14, top,dashed line). At low frequencies, the degraded widths were much greater than the reported physiological widths (circles), and at higher frequencies, they were degraded beyond the width of one cycle of the stimulus. We conclude that other factors must compensate for the differences in length between axons to maintain the ITD tuning of neurons in the MSO.
Fig. 14.
Measured and predicted widths of interaural delay curves in the MSO. Open circles are widths measured at 50% of maximum response (Fitzpatrick et al., 1997). Solid line denotes theoretical widths at each frequency (see Materials and Methods). Bottom, thick dotted line indicates the effect of scatter within individual axons caused by variation of axon collateral length. For the contralateral MSO of case 94–89, the average residual error for the linear regression between conduction time and MSO location was ±23 μsec (n = 3). For the ipsilateral MSO, it was ±10 μsec (n = 2). These times represent the increase in the variability of travel times from the AVCN of either side to the MSO. This increase in variability corresponds to an increase in tuning width of 59 μsec. The top, dashed lineindicates the effect of variation in length between axons. The average difference in travel time between axons was estimated as ∼400 μsec, and the corresponding increase in tuning width was estimated as ∼900 μsec.
Factors that influence travel time include internodal spacing (Carr and Konishi, 1990) and branch-point delays. The inhibitory inputs to the MSO (Grothe and Sanes, 1993, 1994; Smith, 1995) from the medial and lateral nuclei of the trapezoid body (Cant and Hyson, 1992) could also play a role. Alternatively, these differences in length may not be apparent during the encoding of ongoing ITDs. There is evidence that different neurons in the MSO can respond with widely disparate delays; however, the delays from the two sides to any one neuron appear to be very well matched (Batra et al., 1997b). Thus, it is possible that individual neurons in the MSO receive ipsilateral and contralateral inputs that are matched in length and, therefore, have matched delays.
Footnotes
This work was supported by National Institute of Health Grant R01-DC00189. Support for R. Batra was provided by P01-DC01366. We thank Steve Kempe of the Center for Neurological Sciences, University of Connecticut Health Center, and Jack Glaser of Microbrightfield, Inc. for their help with the three-dimensional reconstruction and modeling software. We thank Shig Kuwada and Douglas Fitzpatrick for helpful comments on this manuscript.
Correspondence should be addressed to Douglas L. Oliver, Department of Anatomy, University of Connecticut Health Center, Farmington, CT 06030-3405.
REFERENCES
- 1.Batra R, Kuwada S, Fitzpatrick DC. Sensitivity to interaural temporal disparities of low- and high-frequency neurons in the superior olivary complex: I. Heterogeneity of responses. J Neurophysiol. 1997a;78:1222–1236. doi: 10.1152/jn.1997.78.3.1222. [DOI] [PubMed] [Google Scholar]
- 2.Batra R, Kuwada S, Fitzpatrick DC. Sensitivity to interaural temporal disparities of low- and high-frequency neurons in the superior olivary complex: II. Coincidence detection. J Neurophysiol. 1997b;78:1237–1247. doi: 10.1152/jn.1997.78.3.1237. [DOI] [PubMed] [Google Scholar]
- 3.Bernstein LR, Trahiotis C. The normalized correlation: Accounting for binaural detection across center frequency. J Acoust Soc Am. 1996;100:3774–3784. doi: 10.1121/1.417237. [DOI] [PubMed] [Google Scholar]
- 4.Cant NB. The cochlear nucleus: neuronal types and their synaptic organization. In: Webster DB, Popper AN, Ray RR, editors. The Mammalian auditory pathway: neuroanatomy, Vol 1. Springer; New York: 1992. pp. 66–116. [Google Scholar]
- 5.Cant NB, Hyson RL. Projections from the lateral nucleus of the trapezoid body to the medial superior olivary nucleus in the gerbil. Hear Res. 1992;58:26–34. doi: 10.1016/0378-5955(92)90005-8. [DOI] [PubMed] [Google Scholar]
- 6.Carr CE, Konishi M. Axonal delay lines for time sensitive measurement in the owl’s brainstem. Proc Natl Acad Sci USA. 1988;85:8311–8315. doi: 10.1073/pnas.85.21.8311. [DOI] [PMC free article] [PubMed] [Google Scholar]
- 7.Carr CE, Konishi M. A circuit for detection of interaural time differences in the brain stem of the barn owl. J Neurosci. 1990;10:3227–3246. doi: 10.1523/JNEUROSCI.10-10-03227.1990. [DOI] [PMC free article] [PubMed] [Google Scholar]
- 8.Echteler SM, Fay RR, Popper AN. Structure of the mammalian cochlea. In: Fay RR, Popper AN, editors. Comparative hearing: mammals, Ed 1, Vol 4. Springer; New York: 1994. pp. 134–171. [Google Scholar]
- 9.Fitzpatrick DC, Batra R, Stanford TR, Kuwada S. A neuronal population code for sound localization. Nature. 1997;388:871–874. doi: 10.1038/42246. [DOI] [PubMed] [Google Scholar]
- 10.Gasser HS, Grundfest H. Axon diameter in relation to the spike dimensions and the conduction velocity in mammalian fibers. Am J Physiol. 1939;127:393–414. [Google Scholar]
- 11.Goldberg JM, Brown PB. Response properties of binaural neurons of dog superior olivary complex to dichotic tonal stimuli: some physiological mechanisms of sound localization. J Neurophysiol. 1969;32:613–636. doi: 10.1152/jn.1969.32.4.613. [DOI] [PubMed] [Google Scholar]
- 12.Grothe B, Sanes DH. Bilateral inhibition by glycinergic afferents in the medial superior olive. J Neurophysiol. 1993;69:1192–1196. doi: 10.1152/jn.1993.69.4.1192. [DOI] [PubMed] [Google Scholar]
- 13.Grothe B, Sanes DH. Synaptic inhibition influences the temporal coding properties of medial superior olivary neurons: an in vitro study. J Neurosci. 1994;14:1701–1709. doi: 10.1523/JNEUROSCI.14-03-01701.1994. [DOI] [PMC free article] [PubMed] [Google Scholar]
- 14.Guinan JJ, Norris BE, Guinan SS. Single auditory units in the superior olivary complex II: Locations of unit categories and tonotopic organization. Int J Neurosci. 1972;4:147–166. [Google Scholar]
- 15.Harris RJ. A primer of multivariate statistics. Academic; New York: 1975. [Google Scholar]
- 16.Jeffress LA. A place code theory of sound localization. J Comp Physiol Psych. 1948;41:35–39. doi: 10.1037/h0061495. [DOI] [PubMed] [Google Scholar]
- 17.Johnson DH. The relationship between spike rate and synchrony in responses of auditory-nerve fibers to single tones. J Acoust Soc Am. 1980;68:1115–1122. doi: 10.1121/1.384982. [DOI] [PubMed] [Google Scholar]
- 18.Manor Y, Koch C, Segev I. Effects of geometrical irregularities on propogation delay in axonal trees. Biophys J. 1991;60:1424–1437. doi: 10.1016/S0006-3495(91)82179-8. [DOI] [PMC free article] [PubMed] [Google Scholar]
- 19.Moushegian G, Rupert AL, Gidda JS. Functional characteristics of superior olivary neurons to binaural stimuli. J Neurophysiol. 1975;38:1037–1048. doi: 10.1152/jn.1975.38.5.1037. [DOI] [PubMed] [Google Scholar]
- 20.Oliver DL, Beckius GE, Ostapoff E-M. Connectivity of neurons in identified auditory circuits studied with transport of dextran and microspheres plus intracellular injection of Lucifer Yellow. J Neurosci Methods. 1994;53:23–27. doi: 10.1016/0165-0270(94)90140-6. [DOI] [PubMed] [Google Scholar]
- 21.Overholt EM, Rubel EW, Hyson RL. A circuit for coding interaural time differences in the chick brainstem. J Neurosci. 1992;12:1698–1708. doi: 10.1523/JNEUROSCI.12-05-01698.1992. [DOI] [PMC free article] [PubMed] [Google Scholar]
- 22.Rhode WS. A digital system for auditory neurophysiological research. In: Brown P, editor. Current computer technology in neurobiology. Hemisphere; Washington, DC: 1976. pp. 543–567. [Google Scholar]
- 23.Ryugo DK. The auditory nerve: peripheral innervation, cell body morphology, and central projections. In: Webster DB, Popper AN, Fay RR, editors. The mammalian auditory pathway: neuroanatomy, Vol 1. Springer; New York: 1992. pp. 23–65. [Google Scholar]
- 24.Schwartz IR. The superior olivary complex and lateral lemniscal nuclei. In: Webster DB, Popper AN, Fay RR, editors. The mammalian auditory pathway: neuroanatomy, Vol 1. Springer; New York: 1992. pp. 117–167. [Google Scholar]
- 25.Siegel S. Nonparametric statistics for the behavioral sciences. McGraw-Hill; New York: 1956. [Google Scholar]
- 26.Smith PH. Structural and functional differences distinguish principal from nonprincipal cells in the guinea pig MSO slice. J Neurophysiol. 1995;73:1653–1667. doi: 10.1152/jn.1995.73.4.1653. [DOI] [PubMed] [Google Scholar]
- 27.Smith PH, Joris PX, Yin TCT. Projections of physiologically characterized spherical bushy cell axons from the cochlear nucleus of the cat: evidence for delay lines to the medial superior olive. J Comp Neurol. 1993;331:245–260. doi: 10.1002/cne.903310208. [DOI] [PubMed] [Google Scholar]
- 28.Spitzer MW, Semple MN. Neurons sensitive to interaural phase disparity in gerbil superior olive: diverse monaural and temporal response properties. J Neurophysiol. 1995;73:1668–1690. doi: 10.1152/jn.1995.73.4.1668. [DOI] [PubMed] [Google Scholar]
- 29.Tolbert LP, Morest DK, Yurgelun-Todd DA. The neuronal architecture of the anteroventral cochlear nucleus of the cat in the region of the cochlear nerve root: horseradish peroxidase labelling of identified cell types. Neuroscience. 1982;7:3031–3052. doi: 10.1016/0306-4522(82)90228-7. [DOI] [PubMed] [Google Scholar]
- 30.Waxman SG, Bennett MVL. Relative conduction velocities of small myelinated and non-myelinated fibres in the central nervous system. Nat New Biol. 1972;238:217–219. doi: 10.1038/newbio238217a0. [DOI] [PubMed] [Google Scholar]
- 31.Yin TC, Chan JC. Interaural time sensitivity in medial superior olive of cat. J Neurophysiol. 1990;64:465–488. doi: 10.1152/jn.1990.64.2.465. [DOI] [PubMed] [Google Scholar]
- 32.Young SR, Rubel EW. Frequency-specific projections of individual neurons in the chick brainstem auditory nuclei. J Neurosci. 1983;7:1373–1378. doi: 10.1523/JNEUROSCI.03-07-01373.1983. [DOI] [PMC free article] [PubMed] [Google Scholar]
- 33.Young SR, Rubel EW. Embryogenesis of arborization pattern and topography of individual axons in N. Laminaris of the chicken brain stem. J Comp Neurol. 1986;254:425–459. doi: 10.1002/cne.902540402. [DOI] [PubMed] [Google Scholar]


