

Abstract
Male Bengalese finches do not normally change their vocal patterns in adulthood; song is stereotyped and stable over time. Adult song maintenance requires auditory feedback. If adults are deafened, song will degrade within 1 week. We tested whether feedback of all sound frequencies is required for song maintenance. The avian basilar papilla is tonotopically organized; hair cells in the basal region encode high frequencies, and low frequencies are encoded in progressively apical regions. We restricted the spectral range of feedback available to a bird by killing either auditory hair cells encoding higher frequencies or those encoding both high and low frequencies and documented resultant changes in song. Birds were treated with either Amikacin alone to kill high-frequency hair cells or Amikacin and sound exposure to target hair cells across the entire papilla. During treatment, song was recorded from all birds weekly. After treatment and song recording, evoked-potential audiograms were evaluated on each bird, and papillas were evaluated by scanning electron microscopy. Results showed that hair cell damage over 46–63% of the basal papilla and the corresponding high-frequency hearing loss had no effect on song structure. In birds with hair cell damage extending further into the apical region of the papilla and corresponding low-frequency and high-frequency hearing loss, song degradation occurred within 1 week of beginning treatment and was comparable with degradation after surgical deafening. We conclude that either low-frequency spectral cues or temporal cues via feedback of the song amplitude envelope are sufficient for song maintenance in adult Bengalese finches.
Keywords: song, auditory feedback, hair cell, sound frequencies, finch, hearing, auditory, deprivation
Experiments on many oscine songbirds have shown that auditory feedback is necessary for song development (for review, see Marler, 1987, 1991; Konishi, 1994). Juvenile males typically copy songs from adults by listening to adults sing, forming memories of song, and practicing their own vocalizations to match those memories (Konishi, 1965; Dittus and Lemon, 1969; Marler and Waser, 1977; Price, 1979; Eales, 1985; Marler and Peters, 1987). It is clear that both frequency-specific (spectral) content and temporal organization of song are encoded by juveniles while listening to adults sing; song learning results in excellent copies of both of these vocal parameters. This information is presumably stored in the brain and then used to shape each individual’s own vocalizations until adulthood, when song becomes highly stereotyped. In adulthood, age-limited song learners normally do not change song (Dietrich, 1980; Clayton, 1987,1988, 1989). For example, each adult male Bengalese finch sings one stereotyped, stable song that is repeated several times in a singing bout (Immelmann, 1969; Dietrich, 1980; Clayton, 1987; Woolley and Rubel, 1997).
In some age-limited song learners, auditory feedback is also necessary for adult song maintenance. Recent studies have shown that song in adult zebra finches and Bengalese finches degrades after surgical deafening (Nordeen and Nordeen, 1992; Okanoya and Yamaguchi, 1997;Woolley and Rubel, 1997). In Bengalese finches, song degrades significantly within 1 week of deafening (Okanoya and Yamaguchi, 1997;Woolley and Rubel, 1997). The parameters of acoustic feedback from the cochlea and central auditory pathways that are required to maintain stereotyped song are not known. Song maintenance could require feedback of the full spectral content and temporal organization of the song. Alternatively, it is possible that any stimulation of eighth nerve afferents could provide enough feedback to keep the motor circuitry for song stable, after the circuitry is established.
In this study, we examined whether feedback encoding the entire spectral range of a bird’s song is required for song maintenance in Bengalese finches. This was accomplished by manipulating the frequency range of feedback available to a bird while singing.
The basilar papilla is tonotopically organized (von Békésy, 1960; Ryals and Rubel, 1982; Lippe and Rubel, 1983; Rubel et al., 1984;Manley et al., 1987; Jones and Jones, 1995). The basal half of the basilar papilla encodes higher frequencies comprising song (>2.0 kHz). Because the basal half is selectively sensitive to ototoxic drugs, we were able to selectively restrict the frequency range of auditory feedback by selectively killing or damaging hair cells encoding frequencies above ∼2 kHz. Selectively damaging only hair cells encoding lower frequencies is not currently possible. The spectral envelope of song in Bengalese finches extends from 0.2 to >8 kHz. We documented the presence or absence of song degradation in birds with hair cell damage in the basal half of the papilla and compared that with song in birds with hair cell damage across the entire papilla and in birds with no hair cell damage. After treatment and song recording, evoked-potential audiograms were acquired on each bird to assess hearing loss, and the extent of hair cell damage to papillas was evaluated by scanning electron microscopy (EM). Results indicate that Bengalese finches do not need to hear all of the spectral information in song to maintain stereotyped song behavior. Rather, it seems that only lower frequency spectral information or temporal cues are required for maintenance of normal adult song.
MATERIALS AND METHODS
Animals. We used 30 adult male Bengalese finches that were aviary raised (Magnolia Bird Farm, Anaheim, CA) with adults of both sexes. Birds were sent to our laboratory at 4 months of age, housed in groups of 5–10 individuals, and maintained on a 14:10 hr light/dark cycle. Each male was between 5 and 6 months of age at the beginning of this study. All animal husbandry procedures were approved by the University of Washington Animal Care Committee.
Experimental design. A schematic diagram of the experimental procedure is shown (see Fig. 1). Song from all birds was recorded twice before the initiation of treatment. Recordings from each bird were made 6 weeks apart. After these initial baseline recordings, birds were divided into three treatment groups. Eighteen experimental birds began one of two different treatments to kill auditory hair cells. Six birds received daily injections of the aminoglycoside Amikacin. This treatment was designed to kill only high-frequency hair cells. Aminoglycosides are commonly used in studies examining hair cell damage and regeneration. In birds, systemic administration of ototoxic aminoglycosides results in the dose-dependent destruction of hair cells located only in the basal (high-frequency) region of the basilar papilla and the sparing of hair cells in the apex (Tucci and Rubel, 1990; Hashino et al., 1992; Marean et al., 1993; Salvi et al., 1994; S. M. N. Woolley, unpublished observations). Amikacin was chosen for this study because it is highly toxic to auditory hair cells and less toxic to renal function than are other aminoglycosides (Lenoir and Puel, 1987; Kitasato et al., 1990; Beaubien et al., 1995; Vago et al., 1998). The remaining 12 birds received daily Amikacin injections and nightly low-frequency sound exposures (see below). This treatment was designed to extend the hair cell damage as far as possible into the apical (low-frequency) region. Previous studies have shown that treatment with a combination of ototoxic drugs and intense sound exposure causes larger hair cell lesions than either drugs or sound presentation alone (Bone and Ryan, 1978; Collins, 1988; Brummett et al., 1990, 1992; Pye and Collins, 1991). Treatment with only low-frequency sound exposure does not result in hair cell damage localized to the apical end of the basilar papilla (Ryals and Rubel, 1982, 1985; Cotanche et al., 1994; Woolley, unpublished observations). Instead, lesions are spread out along the length of the papilla or occur in patches. Thus, in this study, we were not able to include a treatment group receiving only low-frequency sound exposures to kill only apical (low-frequency) hair cells. Six control birds received no treatment. An additional six birds were unmanipulated and used only to determine the normal evoked-potential threshold function for the Bengalese finch.
Fig. 1.

A schematic diagram of the experimental procedure shows two experimental groups and one control group. Experimental birds were treated with either Amikacin alone or Amikacin plus sound exposure for between 1 and 4 weeks. During treatment, song was recorded from all experimental birds weekly. One subgroup of birds treated with Amikacin plus sound showed degraded song resulting from treatment. Birds in the remaining (sub)groups maintained stereotyped song during and after treatment. All birds were assessed for hearing loss and for the extent and location of hair cell damage after treatment.
During treatment, song was recorded from each bird at weekly intervals. The design of this experiment was such that if and when any individual bird sang degraded song, it was immediately assessed for hearing loss by electrophysiological recordings of brainstem evoked potentials. After determination of response thresholds, birds were killed, and their basilar papillas were processed for scanning EM. At the same time that birds singing degraded song were assessed for hearing loss and processed for scanning EM, some birds maintaining stable song were also assessed for hearing loss and processed for scanning EM. This was done to compare hearing thresholds and hair cell damage between birds singing degraded song and birds maintaining stable song. The remaining experimental birds not showing any song degradation continued to be treated to determine whether song would degrade with longer treatment.
Birds treated with Amikacin alone received daily treatment for a total of 4 weeks. Birds treated with Amikacin and sound exposure received daily treatment for a total of 1 or 3 weeks. Song was recorded from control birds at weekly intervals for a total of 4 weeks.
Song recordings. “Undirected” (not in the presence of a female) song was recorded while each male was alone in an 8 inch × 8 inch × 8 inch wire mesh cage within a sound-isolated booth (Industrial Acoustic). A low-impedance microphone (F-98; Sony, Tokyo, Japan) was placed 25 cm above the bird’s perch. The microphone was connected through a voice-activated circuit with a 2 sec signal delay to a cassette tape recorder (Marantz PMD 201). For each recording date, at least 10 singing bouts composed of several repetitions of a song were recorded. Song bouts were defined as episodes of continuous singing surrounded by 2 or more seconds of silence. The time required to collect 10 bouts from an individual on any particular date ranged between 30 min and 6 hr.
Song analysis. All song records were played into a Power Macintosh 9500 and digitized at 22 kHz using the canary (v.1.2) sound analysis program (Cornell Laboratory of Ornithology, Ithaca, NY). Spectrographs and amplitude waveforms from the first recordings made 6 weeks before beginning treatment with Amikacin or Amikacin plus sound exposure were used to identify each bird’s song. For each bird, the two initial recordings of stable song (6 and 0 weeks before treatment) and weekly recordings made during the treatment period were analyzed. Of the 10 singing bouts recorded from each bird at each time point, the three longest bouts were chosen for analysis.
Song analysis used methods identical to those described in our recent paper on the effects of deafening on song production in Bengalese finches (Woolley and Rubel, 1997). These methods will be summarized here, and more detail can be found in that publication. From song recordings made 6 weeks before the beginning of treatment, each bird’s normal syllable structure and sequence within a song were identified by determining the sequences of sounds that were sung in stable units and repeated several times within a bout. These records, which were used to identify each individual’s song, served as a template for that individual. Hard copies of song spectrographs and amplitude waveforms were made for the three analysis bouts from each recording date. The records from each bird were then coded and randomized so that, during the analysis, we did not know from which recording time a particular set of spectrographs and waveforms came. Songs, syllables, and transitions between syllables were labeled on each spectrograph and waveform. Syllables were given identifying numbers in their corresponding order of appearance.
The song spectrographs from each bird at each recording time were analyzed for changes in sequence stereotypy (i.e. syllable order) over time by methods described previously (Woolley and Rubel, 1997). Briefly, we used a method modified from that used by Scharff and Nottebohm (1991). This method is the calculation of a final “sequence stereotypy” score for each singing bout by taking the average of two stereotypy ratios, a “sequence linearity” score and a “sequence consistency” score. The maximum value for each of these scores is 1. The calculations are expressed as:
Sequence linearity measures how many different ways syllables are ordered. Sequence consistency measures how often a particular sequence of syllables is produced.
Sequence stereotypy scores were calculated for each of the three song bouts analyzed per recording date per bird and were averaged to give one final score for each bird at each recording date. Those scores were then averaged over all experimental birds and all control birds separately for each recording time and statistically analyzed for changes in sequence stereotypy over time.
A change in sequence stereotypy (syllable order) is the first type of song degradation that occurs after surgical deafening. This type of change in song after deafening occurs within 1 week, before significant changes in syllable phonology (spectral content) are observed (Woolley and Rubel, 1997). The experimental design was such that, at the first indication of song degradation, birds were assessed for hearing loss and their papillas were taken for anatomical analysis of hair cell damage. At this time in the process of song degradation, spectral changes in song would not be expected. Therefore, our analysis of changes in song was limited to measuring changes in syllable sequence stereotypy, and no measures of syllable spectral content were made.
Aminoglycoside treatment and sound exposure. We used the ototoxic aminoglycoside Amikacin to induce hair cell damage in the basal (high-frequency) region of the basilar papilla. Eighteen experimental birds were given daily intramuscular injections of Amikacin (Faulding Puerto Rico). Six of these birds, receiving only Amikacin treatment, were given alternating doses of 250 mg/kg per day and 200 mg/kg per day for 4 weeks. This dosing schedule had been determined in our pilot experiments to be optimum for consistently killing only high-frequency hair cells without compromising a bird’s health.
The 12 remaining birds received treatment with Amikacin and sound exposure. These animals were given alternating doses of 150 mg/kg per day and 300 mg/kg per day and were exposed nightly to low-pass–filtered white noise for 12 hr at an intensity of 126 dB sound pressure level (SPL). This treatment schedule was determined in our pilot experiments to be optimum for consistently killing as many hair cells as possible without compromising a bird’s health. The white noise stimulus was filtered at 60 dB/octave above 1.0 kHz. For sound exposures, birds were placed in a cylindrical wire mesh cage with food and water available. The cage was then placed inside a sound-attenuated chamber, and a low-frequency loudspeaker (JBL 2206H) was placed 8 cm above the wire cage. The chamber and the speaker were housed inside a sound attenuation booth (Industrial Acoustic). Calibration of stimulus intensity and analysis of the harmonic content of the sound were performed using a dynamic signal analyzer (Hewlett-Packard) at the beginning and end of each exposure.
An additional six age-matched control birds received no treatment.
Electrophysiological recordings from auditory brainstem.Evoked-potential thresholds were determined by recording from auditory brainstem nuclei during presentation of sound stimuli at the following test frequencies: 0.25, 0.5, 1.0, 1.5, 2.0, 3.0, 4.0, 5.0, and 6.0 kHz. Tone bursts with 1 msec of rise/fall and 10 msec of total duration were delivered at a rate of nine per second. Stimuli were delivered with a free field speaker (Realistic Minimus-7) placed at a 90° angle to the midline of the head and at a distance of 7 cm from the head. The stimuli delivery system was calibrated at the beginning of each experiment using an ER-10 microphone (Etymotic Research) placed at the ear, and custom software was used to acquire and analyze evoked-potential traces. All threshold data were recorded in dB SPL.
Animals were anesthetized with urethane (0.002 mg/kg). Body temperature was maintained at 39°C. Birds were placed on a flat platform, and their heads were stabilized in a specially designed holder. Two pin electrodes (Grass Instruments Company, Quincy, MA) were implanted bilaterally through the cranium into the cerebellum just above the auditory brainstem nuclei (active electrodes), and one electrode was inserted into leg muscle (ground electrode). Responses were amplified, filtered (0.03–3.0 kHz bandpass), and digitized at a rate of 200 kHz. Responses were averaged over 200 stimulus presentations above threshold and 500 presentations at and around threshold. Stimulus presentations for each frequency were begun at 90 dB and decreased or increased in intensity by 10 dB steps to threshold and by 5 dB steps around threshold. Threshold was defined as the intensity at which the averaged response was at least twice the amplitude of baseline variation.
Scanning EM. Birds were killed by an intramuscular injection of sodium pentobarbital (Anpro Pharmaceuticals) and then decapitated. Under a dissecting microscope, the external auditory meatus, tympanic membrane, and columella were removed, exposing the basilar papilla through the oval window. The opposite end of the cochlear duct was exposed by creating a small hole in the bone overlying the lagena with a scalpel tip. Papillas were then perfused via the oval window with 2.5% glutaraldehyde and 2.0% paraformaldehyde in 0.1 m PBS. Heads were post-fixed in the same fixative overnight. Temporal bones were then dissected out of the head, and papillas were completely exposed by removing the roofs of their bony encasements. Specimens were placed in 1% osmium tetroxide for 1 hr and washed in PBS. Specimens were then dehydrated in a graded ethanol series to 70% ethanol, the tectorial membrane was removed in a final dissection, and specimens were dehydrated to 100% ethanol. After critical point drying, specimens were mounted on aluminum stubs with graphite glue and sputter coated with gold palladium. Scanning EM was performed with a JEOL 63005 electron microscope (accelerating voltage of 15 kV) to document the extent and location of hair cell damage, loss, and regeneration in each animal.
Quantification of hair cell damage was done by digitally acquiring images of each papilla onto a Power Macintosh 8100/80 and by measuring the total papilla area and the area of damaged papilla using image analysis software (National Institutes of Health Image v.1.61b7). The area of damaged papilla was defined as the region showing hair cells with expanded surfaces that were missing stereocilia, showing no hair cells, or regenerating hair cells. Regenerating hair cells and original hair cells were distinguished by their marked morphological differences. Regenerating hair cells are identified by their smaller luminal surfaces, smaller stereocilia, the presence of microvilli beside the stereocilia on their luminal surfaces, and the presence of kinocilia (see Duckert and Rubel, 1990, 1993; Marean et al., 1993).
Statistical analyses. Statistical analyses on sequence stereotypy scores were performed using repeated-measures, one-factor ANOVAs. Post hoc comparisons were made with the Scheffe F test. Student’s t tests (two-tailed) were used to compare stereotypy scores between control and experimental birds.
RESULTS
Song behavior
Previous work has shown that the first feature of Bengalese finch song structure to degrade after the removal of auditory feedback is syllable order, sequence stereotypy (Okanoya and Yamaguchi, 1997;Woolley and Rubel, 1997). For example, within a singing bout, syllables are normally sung in a stereotyped and stable order; syllables are sung in sequences such as 1,2,3,4,1,2,3,4,1,2,3,4. After surgical deafening, syllable sequences become disordered; e.g., sequences are sung in an order such as 1,3,4,3,3,3,4,4,1,2,4,3. This change in song behavior occurs within 1–7 d after deafening (Okanoya and Yamaguchi, 1997; Woolley and Rubel, 1997), and the order is not different from random by 6 weeks after deafening (Woolley and Rubel, 1997). The spectral content of syllables also changes, but this effect is not significant until 2 weeks after deafening (Woolley and Rubel, 1997). In this study, we used changes in syllable order as a behavioral assay for the onset of song degradation.
By the time of the first weekly song recordings after the beginning of treatment with both Amikacin and sound exposure, listening to the songs revealed that, of the 12 birds, 5 birds appeared to be singing degraded song and 6 birds appeared to be maintaining stereotyped song. One bird would not sing and had to be eliminated from the study. Those birds singing degraded song were assessed for evoked-potential thresholds, and their papillas were processed for scanning EM (Fig.1). Three of the remaining six birds receiving Amikacin plus sound exposures (those maintaining stereotyped song) were also assessed for evoked-potential thresholds after only 1 week of treatment, and their papillas were processed for scanning EM. Three of the remaining six birds receiving Amikacin plus sound exposures continued treatment and weekly song recordings for an additional 2 weeks to determine whether song would degrade. After a total of 3 weeks of treatment, these birds were assessed for hearing thresholds, and their papillas were processed for scanning EM. All birds receiving Amikacin injections only appeared to be singing normally and were thus treated for a total of 4 weeks while song was recorded weekly. Song from control birds was also recorded weekly for 4 weeks. At the end of these 4 weeks, all remaining birds (six experimental and six control) were assessed for hearing thresholds, and their papillas were processed for scanning EM. Six additional unmanipulated birds were assessed for normal hearing thresholds. By this experimental design, changes in behavior, hearing thresholds, and the extent and location of hair cell damage could all be evaluated within each bird.
Analysis of song from control birds showed that normal song was stereotyped and stable over the 10 weeks of the experiment. Figure2, A and B, shows spectrographs of the song sung by a control bird from two recordings made 10 weeks apart. The acoustic structure and stability of normal adult Bengalese finch song are readily seen and have been quantitatively described previously (Woolley and Rubel, 1997). Birds treated with Amikacin alone also sang stereotyped syllable sequences characteristic of normal song. After 4 weeks of daily treatment with Amikacin, song behavior was maintained so that recordings made at the end of treatment were extremely similar to those made before treatment began. An example of this stable behavior is shown in Figure 2,C and D.
Fig. 2.
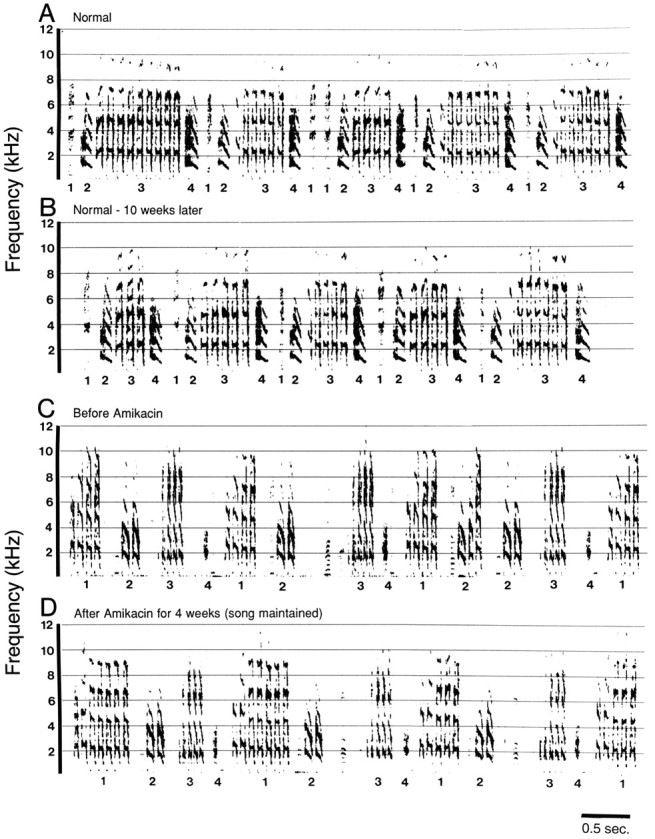
Adult male Bengalese finch song was stereotyped and stable in controls over 10 weeks and in birds treated with Amikacin for 4 weeks. A, Sound spectrograph of five song repetitions recorded from a normal untreated bird. B, Spectrograph of the same duration from the same bird shown inA recorded 10 weeks after the recording shown inA. C, Sound spectrograph of three song repetitions recorded from an experimental bird before beginning treatment. D, Spectrograph of song from the same bird shown in C recorded after 4 weeks of daily Amikacin treatment. Hair cell damage caused by Amikacin treatment did not result in song degradation. Syllable structure and sequence order are preserved over time in both of these examples. Syllable identities are labeled with numbers below the time axis.
The behavior of birds treated with both daily Amikacin injections and daily sound exposure was more variable than was that of control birds and Amikacin-treated birds. Figure 3shows representative examples of song spectrographs from two birds in this treatment group. Figure 3, A and B, shows song repetitions from the same bird, recorded before and after 3 weeks of treatment. Figure 3, C and D, shows song repetitions from a different bird, before and after 1 week of treatment. Six out of the 11 birds in this group showed song behavior similar to that of the animal shown in Figure 3, A andB. Their song was stable before and after either 1 or 3 weeks of treatment. The remaining 5 out of 11 birds treated with Amikacin and sound exposure showed dramatic changes in syllable sequences between songs recorded before treatment and those recorded after 1 week of treatment. A representative example of this degraded song behavior is shown in Figure 3, C and D. Syllable sequences were both disordered and unstable when compared with that of pretreatment recordings. These changes in song behavior could be clearly detected by us while listening to these birds singing. The lack of song stereotypy seen in 5 of 11 birds in the Amikacin plus sound exposure group was qualitatively similar to the syllable disorder observed in song from Bengalese finches recorded 1 week after surgical deafening (Woolley and Rubel, 1997). Additionally, degraded song from these birds was usually sung at a lower intensity than was either normal song or stereotyped song recorded from our other experimental birds (Fig. 3D).
Fig. 3.
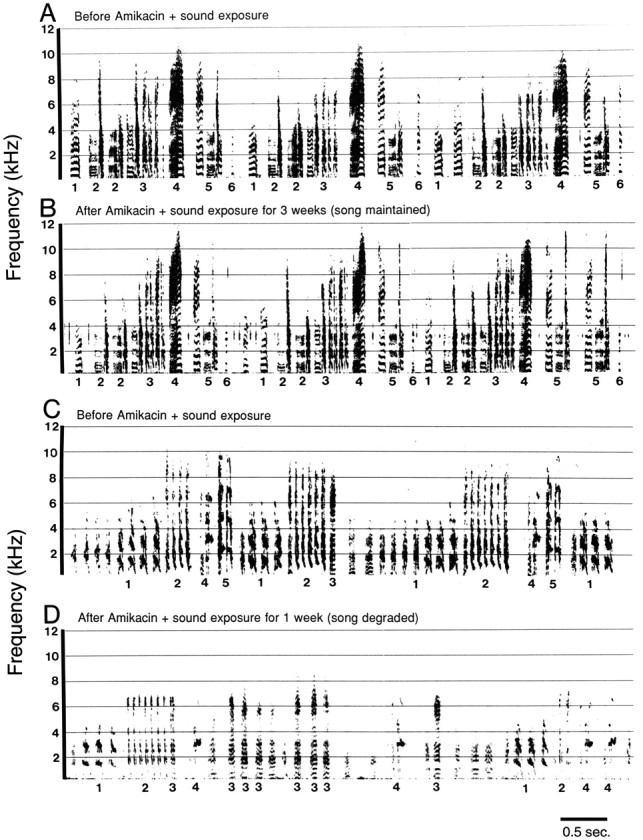
In 6 out of 11 birds treated with both Amikacin plus sound exposure, song was maintained; syllable sequences were stereotyped and stable between recordings made before and after treatment. A, Sound spectrograph of three song repetitions recorded before treatment. B, Spectrograph of three song repetitions from the same bird shown in Arecorded after 3 weeks of treatment with Amikacin plus sound exposure. In 5 out of 11 birds treated with both Amikacin and sound exposure, song degraded; syllable sequences were disordered and unstable in recordings made after treatment compared with that in pretreatment recordings. C, Spectrograph of song recorded before treatment. D, Spectrograph of song from the same bird shown in C recorded after 1 week of treatment with Amikacin and sound exposure. In this bird, hair cell damage caused by treatment with Amikacin and sound exposure resulted in song degradation. Syllable identities are labeled with numbers below the time axis.
Figure 4 shows syllable sequence stereotypy scores (mean ± SD) over time for control and treated birds. SDs were plotted to show the true population variability. The stereotypy scores for control birds were high and stable over 10 weeks (Fig. 4A). Scores for recordings made 6 weeks before the treatment of experimental birds [0.74 ± 0.05 (mean ± SD)] were not different from scores for recordings made 10 weeks later [0.78 ± 0.06 (p > 0.05)]. These results are essentially identical to those reported previously for surgically deafened birds (Woolley and Rubel, 1997). Birds treated with Amikacin alone for 4 weeks had stereotypy scores that were also not different before and after treatment (0.74 ± 0.05 and 0.74 ± 0.04, respectively; Fig. 4A). These scores were also virtually identical to those of controls (p > 0.05).
Fig. 4.
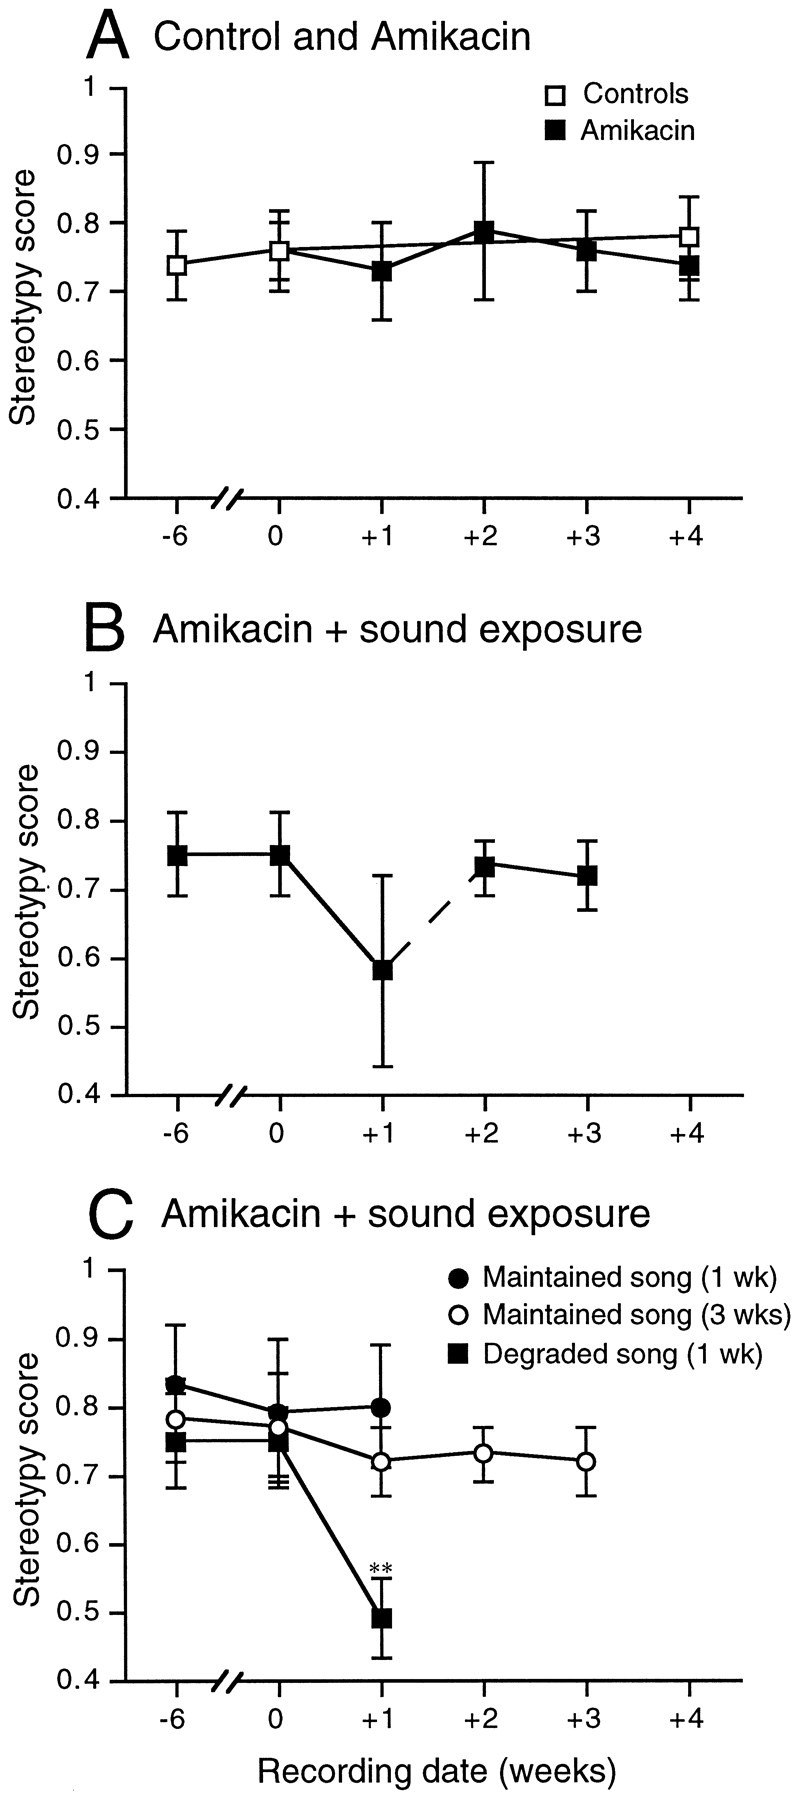
Sequence stereotypy scores at each recording time were averaged for control and experimental birds. Mean ± SD is presented for each group shown. A, Scores for control birds were similarly high and stable over 10 weeks (open squares). Scores for birds treated with Amikacin alone were also similarly high and consistent before, during, and after treatment (filled squares). B, Scores for birds treated with Amikacin plus sound exposure were high and stable before treatment but were variable and bimodally distributed after 1 week of treatment. Six out of 11 birds in this group maintained high and stable stereotypy scores, whereas scores for 5 out of 11 birds decreased significantly after 1 week of treatment. Stereotypy scores for all birds in this treatment group are plotted together. Note the increased variance in scores for the 1 week recording date. The dashed portion of theline indicates that the scores at 2 and 3 weeks were calculated without scores from the five birds with degraded song and without scores from three of the six birds maintaining stable song (refer to Fig. 1). C, Scores for the three subgroups of birds treated with Amikacin plus sound are plotted separately. Three birds maintained high and stable scores after 1 week of treatment (filled circles). Three birds maintained high and stable scores during and after 3 weeks of treatment (open circles), and five birds had significantly decreased scores after 1 week of treatment (filled squares). Numbers below thex-axis indicate the number of weeks before or after the beginning of treatment. Error bars represent ± SD; **p < 0.005, compared with pretreatment scores.
Birds treated with both Amikacin and sound exposure showed highly variable sequence stereotypy scores after the first week of treatment (0.64 ± 0.16). Figure 4B shows sequence stereotypy scores over time for all birds treated with Amikacin plus sound exposure. Note the high variability after 1 week. Further analysis revealed that stereotypy scores for song recordings made after 1 week of treatment were bimodally distributed. Six out of the 11 birds treated with both Amikacin and sound exposure maintained high and stable stereotypy scores after 1 week of treatment (0.76 ± 0.07), and scores for song from the remaining 5 out of 11 birds were significantly decreased compared with pretreatment scores after 1 week (0.49 ± 0.06). Figure 4C shows sequence stereotypy scores over time for each subgroup of this treatment group plotted separately. Song bouts from the birds selected as singing degraded song showed dramatically decreased stereotypy scores between recordings made before and during treatment (p < 0.005) compared with that of the remaining birds that received the same treatment. Scores decreased from 0.75 ± 0.07 before treatment to 0.49 ± 0.06 after 1 week of treatment. Scores for birds with degraded song after 1 week of treatment with Amikacin plus sound exposure were similar to those for surgically deafened birds at 1 week after cochlea removal (Woolley and Rubel, 1997). Birds singing degraded song were assessed for hearing loss and hair cell damage after 1 week of treatment.
Three out of the six birds with stable song after 1 week of treatment with Amikacin plus sound exposure were also assessed for hearing loss and hair cell damage immediately after the first weekly song recordings (to match the birds with degraded song). In these birds, stereotypy scores were not different before and after treatment (0.83 ± 0.09 and 0.80 ± 0.09, respectively; Fig. 4C). The remaining three out of six birds with stable song after 1 week of treatment received continued Amikacin and sound exposure treatment daily for an additional 2 weeks to see whether song would degrade over time. These birds continued to demonstrate high and stable stereotypy scores over the entire treatment period (Fig. 4C). Scores for recordings made before treatment (0.78 ± 0.06) and scores for recordings made after the entire 3 weeks of treatment (0.72 ± 0.05) were not significantly different (p > 0.05).
Extent and location of hair cell damage
The extent and patterns of hair cell damage in birds from each group (and subgroup) are shown in Figures5, 6, and7 and are summarized on theright of Figure 8. Figure5A shows a surface scanning EM view of the left papilla from a control bird. The Bengalese finch basilar papilla is a curvilinear sheet of hair cells and supporting cells that is ∼1450 μm in length. An example of normal hair cell surface morphology from a control bird is shown at higher magnification in Figure 7A. The hair cell surface is composed of a smooth hexagonally shaped cuticular plate with a stereocilia bundle projecting from the abneural (inferior) half of the luminal surface. Stereocilia bundles are oriented similarly among contiguous hair cells in a normal basilar papilla. In surface view, the microvillous supporting cells can be seen as borders between hair cells. A characteristic hexagonal array of hair cells is evident across the entire length of the structure. Hair cells encoding high frequencies lie in the basal (thinner) end, and cells encoding progressively lower frequencies are progressively toward the apical (wider) end.
Fig. 5.
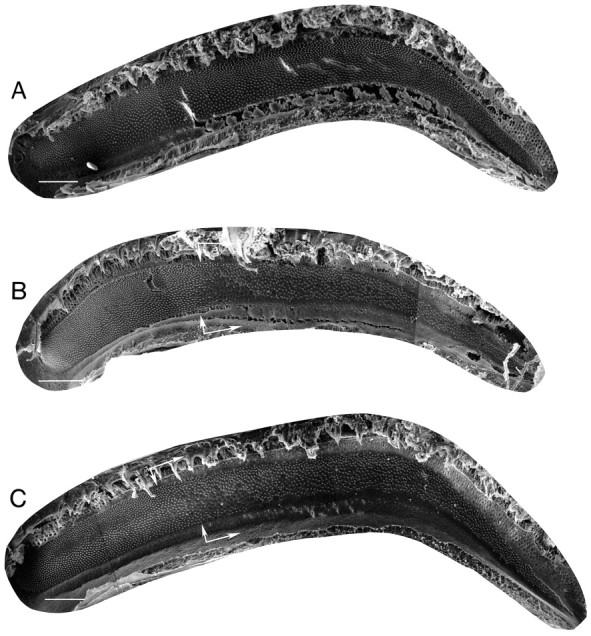
Scanning EM of control and experimental birds’ basilar papillas was used to determine extent and location of hair cell damage. A, Scanning electron micrograph of a basilar papilla from a control group bird showing the full complement of normal hair cells. B, Micrograph of a basilar papilla from a bird treated with Amikacin alone for 4 weeks. In this bird, hair cells were killed or damaged over 51% of the total papilla area. Damage occurred in the basal portion of the epithelium. C, Micrograph of a papilla from a bird that was treated with Amikacin plus sound exposure for 3 weeks and that maintained stable song structure. In this bird, 61% of the total papilla area had missing or damaged hair cells. White arrows delineate the border between the region containing original hair cells and the region with original hair cells missing or damaged. Cells visible in damaged regions of the papilla are regenerating hair cells. Scale bars, 100 μm.
Fig. 6.

Scanning EM was used to determine the extent and location of hair cell damage in the two subgroups of birds treated with Amikacin plus sound exposure for 1 week. A, Micrograph of a papilla from a bird that maintained stable song after treatment. In this bird, 67% of the total papilla area had missing or damaged hair cells. The papilla shows hair cell damage over all but the apical 400 μm of the epithelium. B, Micrograph of a papilla from a bird that sang degraded song after treatment. The papilla shows extensive hair cell damage over virtually the entire epithelium. The remaining original hair cells were located along the superior edge of the apical end. In this bird, 84% of the total papilla area had missing or damaged hair cells. White arrows delineate the border between the region containing original hair cells and the region with original hair cells missing or damaged. Scale bars, 100 μm.
Fig. 7.
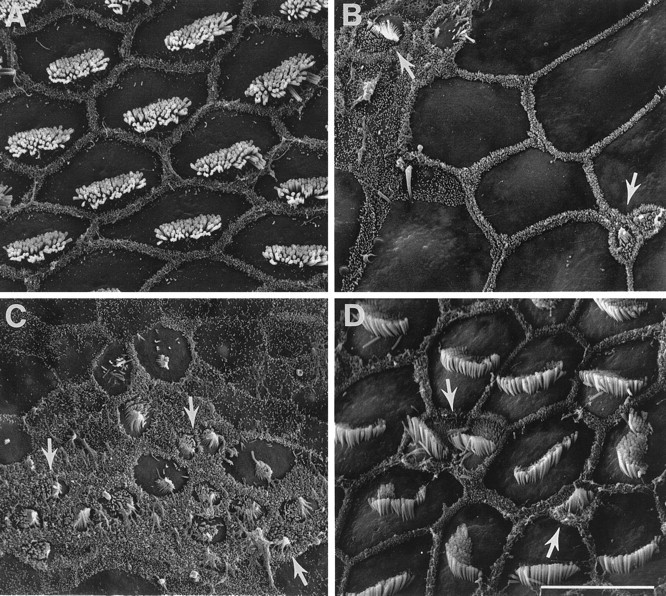
Normal, dying, and regenerating hair cells were distinguished by their differences in surface morphology. Hair cells shown here are all located in the mid region of the basilar papilla.A, High-magnification scanning electron micrograph of normal hair cells in the mid region of the basilar papilla shown in Figure 5A. Original hair cells are uniform in size and show the organized hexagonal array characteristic of all avian basilar papillas. Cells show smooth cuticular plates surrounding stereocilia bundles. B, High-magnification scanning electron micrograph of damaged and regenerating hair cells in the mid region (transition zone) of the papilla shown in Figure6A. After 1 week of treatment with Amikacin plus sound exposure, dying and regenerating cells were commingled with expanded surfaces of supporting cells within the damaged epithelium.C, Regenerating hair cells also in the mid region of the basilar papilla shown in Figure 6A, after 1 week of treatment. Cells exhibited immature morphological features such as small diameter cuticular plates, small stereocilia bundles, and the presence of surface microvilli and kinocilia. D, Regenerating hair cells in the mid region of the basilar papilla shown in Figure 5C. Regenerating hair cells were varied in surface size and disorganized. Stereocilia bundles were disoriented across the regenerating epithelium. Cells also varied greatly in maturity. White arrows indicate small, immature regenerating hair cells. Scale bar, 10 μm.
Fig. 8.

Hearing thresholds for control and experimental birds were determined to assess hearing losses resulting from treatment for each group of birds. Thresholds were determined by recording evoked-potential averages from auditory brainstem in response to pure tone stimuli. A, Threshold curve for normal adult male Bengalese finches (open squares) and for birds treated with Amikacin alone for 4 weeks (filled squares).B, Threshold curve for birds that were treated with Amikacin plus sound exposure for 1 week and that maintained stereotyped and stable song (filled circles). Also plotted is the threshold curve for birds that were treated with Amikacin plus sound exposure for 3 weeks and that maintained stable song (open circles). Thresholds for normal birds are plotted inopen squares. C, Threshold curve for birds that were treated with Amikacin plus sound exposure for 1 week and that sang degraded song (filled squares). Thresholds for normal birds are plotted in open squares. To the right of each threshold plot is a schematic showing the average extent and location of hair cell damage for that/those group(s). Shaded areas show regions of hair cell damage; mean percent area of damage and ranges are provided. Error bars represent ± SEM.
Scanning EM analysis of basilar papillas was used to determine the extent and location of hair cell damage for each experimental bird. Regions of the basilar papilla were considered damaged if they contained hair cells with expanded surfaces that were missing stereocilia, no hair cells, or regenerating hair cells. Regenerating hair cells can be distinguished from original hair cells by their small and/or misshapen luminal surfaces, smaller and disoriented stereocilia bundles, and the presence of surface microvilli and/or kinocilia (Fig.7B–D).
Hair cell damage resulting from treatment with aminoglycosides such as Amikacin occurs only in the basal half of the basilar papilla. Damage patterns resulting from this type of treatment range from killing only the hair cells in the basal tip, using lower drug doses, to killing all hair cells located in the basal (high-frequency) half of the papilla, using maximum doses (Tucci and Rubel, 1990; Girod et al., 1991; Marean et al., 1993, 1995). Analysis of papillas from birds treated with Amikacin daily for 4 weeks showed that hair cell damage and loss were present throughout the basal half of the papilla; an average of 46% of the total papilla area was missing original hair cells. The range of damaged area in this group was 27–56% (Figs. 5B,8A). During the 4 weeks of treatment, the original hair cells were being replaced by regenerating hair cells in the damaged region. It has been established in another avian species that new hair cells can proliferate and differentiate during ongoing damage treatment (Duckert and Rubel, 1990, 1993).
Scanning EM analysis of basilar papillas from those birds treated with Amikacin plus sound exposure correlated well with their behavior. Birds treated with Amikacin plus sound exposure for 1 week that maintained stable song behavior had hair cell damage patterns similar to those of birds treated with Amikacin plus sound exposure for 3 weeks, except for the extent of regeneration (see below). Basilar papillas from each subgroup showed that hair cells had been damaged over an average of 63% of the total papilla area. Because damage patterns were similar and the area of papilla damaged was 63% in each of these two subgroups, their papillas were pooled for the calculation of the range of damaged area (Fig. 8B). The range of damaged area in these two subgroups was 59–67%. Examples are shown in Figures5C and 6A. Amikacin treatment targeted cells encoding high-frequency sound on the basal end of the papilla, whereas the low-frequency sound exposure targeted hair cells encoding lower frequencies toward the apical region of the papilla. Original hair cells still present in the transition zone, the border between epithelium with undamaged cells and the region missing cells, were not normal. Hair cells had expanded surfaces and irregular shapes and were missing stereocilia (see Fig. 7B for example). Regenerating hair cells were present in the damaged regions (see Fig.7B–D for example). With this damage pattern, only the area encoding low frequencies appeared normal. In papillas from birds treated for 1 week, regenerating hair cells were immature and presumably not functioning (Fig. 7C). In birds treated for 3 weeks, some regenerating hair cells were more mature than others. The most mature regenerating hair cells had smooth cuticular plates of normal size and adult-like stereocilia bundles, having attained the adult size and staircase structure (Fig. 7D). The orientation of stereocilia bundles among contiguous regenerating hair cells remained disorganized.
Scanning EM analysis of basilar papillas from those birds that were treated with Amikacin plus sound exposure and sang degraded song after 1 week of treatment showed a consistently greater degree and area of hair cell damage than did that from birds that received the same treatment but maintained stereotyped song. Birds singing degraded song showed missing or damaged hair cells over an average of 78% of the total epithelial surface (range, 72–85%). An example is shown in Figure 6B. The only remaining original hair cells on these papillas were located along the superior edge, in the extreme apical end of the papilla (Fig. 6B). Immature regenerating hair cells were present in the basal halves of the papillas (see Fig. 7C for example). In these birds, it appeared that the sound exposure had a greater damaging effect. The pattern of hair cell damage covered the entire length of the papilla.
Hearing losses resulting from hair cell damage
Normal and experimentally manipulated Bengalese finches were tested for evoked-potential detection thresholds between 0.25 and 6.0 kHz by recording averaged brainstem responses to free field tone-burst stimuli. These data are presented in Figure 8 (left) along with papilla schematics showing the extent of hair cell damage for each group (right). Figure 8A shows evoked-potential threshold means (± SEM) for six control birds, six additional normal birds, and the birds treated with Amikacin daily for 4 weeks. In normal birds, thresholds were high at 0.25 kHz (80 ± 2.8 dB SPL), were most sensitive between 1.5 and 3.0 kHz (46 ± 1.4 and 47 ± 1.7 dB SPL, respectively), and increased above 4.0 kHz with 98 ± 1.9 dB SPL thresholds at 6.0 kHz. The threshold curve determined for normal hearing in Bengalese finches is similar to that determined for other songbirds previously (Okanoya and Dooling, 1987).
Birds that were treated with Amikacin daily for 4 weeks maintained normal song but showed hearing losses at frequencies above 2 kHz (Fig.8A). Hearing thresholds for frequencies between 0.25 and 1.5 kHz were not different from normal. At 3.0 kHz, thresholds in these birds were an average of 25 dB higher than that in normal birds. Above 3.0 kHz, larger threshold shifts (between 25 and 40 dB) were measured, with the largest threshold shift occurring at 4.0 kHz.
Hearing thresholds were analyzed separately for Amikacin plus sound exposure birds depending on whether or not they displayed changes in song behavior (Fig. 1). One subgroup of birds continued to sing stereotyped song after 1 week of treatment, and treatment was continued for an additional 2 weeks. Another subgroup was singing stereotyped song after 1 week of treatment, and hearing thresholds were determined at that time. A third subgroup showed degraded song after 1 week of treatment and was recorded from at that time. Birds that were treated for a total of 3 weeks and that maintained stereotyped song had hearing losses at and above 1.5 kHz (Fig. 8B). At 0.25 kHz, thresholds were not different from normal (82 ± 4.4 dB SPL). Thresholds at 1.5 kHz (65 ± 7.6 dB SPL) were an average of 17 dB higher than normal. For these birds, threshold shifts increased with increasing frequency except at 6.0 kHz at which thresholds (112 ± 4.4 dB SPL) were 15 dB higher than normal. For example, at 3.0 kHz, thresholds were 78 ± 1.6 dB SPL, 30 dB higher than normal. Three of the six birds that maintained stable song after 1 week of treatment with both Amikacin plus sound exposure were recorded from at 1 week. These birds had slightly elevated thresholds between 0.25 and 1.0 kHz (Fig. 8B). For example, thresholds at 0.5 kHz (78 ± 1.7 dB SPL) were 5 dB higher than normal. Above 1 kHz, threshold shifts dramatically increased with increasing frequency. At 3 kHz, thresholds (112 ± 4.4 dB SPL) were 64 dB higher than normal. In two out of three of these birds, no evoked potentials could be recorded during presentation of the 4.0 kHz stimulus, and responses to a 6.0 kHz stimulus could not be recorded in any of these birds. The maximum undistorted sound levels for our stimulus presentation system are between 107 and 118 dB SPL at 4.0–6.0 kHz. In the cases in which no response could be elicited at that frequency, a threshold value of 120 dB SPL was recorded for default purposes.
Birds treated for 3 weeks had less hearing loss than did birds treated for 1 week (Fig. 8B). The extent and location of the loss of original hair cells in these birds is similar to that of birds that were treated with Amikacin and sound exposure for 1 week and that also maintained stable song behavior. It appears that the lower thresholds in birds treated for 3 weeks compared with that in birds treated for only 1 week most likely resulted from the partial return of hearing levels because of functioning of the mature regenerating hair cells in the birds treated for 3 weeks (Fig. 7D). Regenerating hair cells in birds treated for only 1 week were still quite immature and probably not functional (Fig. 7C).
The five birds that sang degraded song after treatment with Amikacin plus sound exposure showed marked hearing losses that were even greater than those of birds given the exact same treatment. These birds had hearing losses at all frequencies tested (Fig. 8C). Thresholds at 0.25 kHz (93 ± 4.6 dB SPL) were 16 dB higher than normal. Threshold shifts for birds in this group were an average of 55 dB at 2 kHz. In these birds, no evoked potentials could be recorded for sound frequencies of 5.0 and 6.0 kHz. Additionally, in four out of five of these birds, no evoked potentials could be recorded during presentation of the 4.0 kHz stimulus. The basilar papilla summary diagram in Figure 8C clearly shows that the damage to hair cells in these birds extended further apically than in any of the other groups.
Figure 9 shows hearing-threshold shifts for the two different subgroups of birds treated with Amikacin and sound exposure for 1 week. Some birds sang degraded song after treatment for 1 week, whereas other birds maintained stable song after 1 week of the same treatment. The mean threshold shifts for these two subgroups were within 10 dB at 2 kHz and virtually identical at 3 kHz and above (Fig. 9). Threshold shifts below 2 kHz were 15–20 dB greater in the birds that sang degraded song. Thus, the ability of the birds in one subgroup to hear frequencies below 3 kHz at lower intensity than birds in the other subgroup represents the difference in hearing between birds maintaining stable song and birds with degraded song.
Fig. 9.

The threshold shifts (mean difference between experimental birds and controls at each frequency) for birds treated with Amikacin plus sound exposure for 1 week are plotted. Birds that sang degraded song after 1 week of treatment had more severe hearing losses below 3 kHz than did birds that maintained stereotyped song. Hearing losses at 3 kHz and above were the same for all birds treated for 1 week.
DISCUSSION
Our results indicate that Bengalese finches do not depend on auditory feedback over the entire spectral range of their songs to maintain stable song behavior over time. Birds missing hair cells in up to 63% of the hearing organ exhibited marked hearing losses at all frequencies above 1 kHz. Most significantly, these birds showed severe (up to 65 dB) threshold shifts at 3 kHz and above and were nevertheless able to sing stereotyped syllable sequences that were not different from those sung before hair cell damage. These results are striking considering that Bengalese finch song contains spectral information up to 10 kHz (see spectrographs in Figs. 2, 3). It appears that auditory feedback of the spectral information of a song between 3 and 10 kHz is not required for maintenance of stable song behavior. In contrast, birds with significant hearing losses at hearing frequencies below 3 kHz and the same hearing losses at 3 kHz and above did not maintain stereotyped and stable song behavior. These birds sang degraded song, showing disordered syllable sequences like those sung by surgically deafened Bengalese finches (Woolley and Rubel, 1997). These results suggest that maintenance of a stable song depends on the low-frequency range of auditory feedback. If an adult hears normally, song is stereotyped and stable over time. If a bird can hear frequencies below 3 kHz (near normal thresholds at 1 kHz and below), song appears to be maintained indefinitely. However, if an adult has significant hearing loss at all frequencies above 0.25 kHz, song degrades rapidly and markedly. Because the spectral information in song ranges up to 10 kHz, a bird hearing only sounds below 3 kHz is most likely detecting relatively little of the spectral content of song compared with the spectral information that is available to a bird with normal hearing.
There are two possible explanations for these results. First, adult Bengalese finches could depend on low-frequency spectral cues for song maintenance. Second, these birds could depend on the temporal cues provided by feedback of the song amplitude envelope to maintain song. The use of auditory feedback during song development and maintenance as well as these two hypotheses are discussed below.
Auditory feedback in song development and maintenance
Our results indicate that the frequency range of auditory feedback required for song learning during development and that required for adult song maintenance may be different. It is likely that, during learning, auditory feedback over the full frequency range of song is needed for a bird to accurately match its own vocal output to the acquired sensory memory. In contrast, it appears that only a restricted spectral range of feedback (∼0.5–3.0 kHz) is required for keeping song stereotyped and stable in adulthood. These results suggest that the sensory feedback required to assemble the motor circuitry for song during learning and the sensory feedback required to keep that circuitry stable during song maintenance are different in both content and amount. Whether or not juvenile songbirds depend on the entire spectral range of song feedback to shape their own vocalizations has never been tested. It is possible that only low frequencies are needed for song development in species with syllables that are primarily composed of harmonics. Juveniles could learn to produce only the fundamental or dominant frequencies for syllables, and harmonics in the higher frequencies could result from the physical mechanism of sound production by the syrinx. Similarly, birds could attend only to fundamental or dominant frequencies to recognize syllables, making the lower frequencies of song the critical feedback for recognition by birds of their own syllables. Our measurements of normal hearing thresholds for Bengalese finches show that these birds probably never hear the entire spectral range of their own songs. The spectral range of song output is between ∼0.5 and 10.0 kHz, whereas normal hearing only ranges between 0.25 and 6.0 kHz. Thus, the acoustic portions of syllables that occur between 6.0 and 10.0 kHz are probably not perceived by the birds themselves and could likely be functionally irrelevant harmonics.
Spectral cues and song maintenance
A potential explanation for these results is that, in Bengalese finches, low-frequency auditory feedback is the critical information for song maintenance, and the higher frequencies are not necessary for song maintenance. If this is the case, birds must hear feedback of their own singing only at frequencies of ∼0.5–3 kHz to maintain song. We have hypothesized that the stereotyped ordering of syllables in normal singing is dependent on the bird’s ability to perceive and recognize feedback of the previously sung syllable(s) to know which syllable to sing next (Woolley and Rubel, 1997). For example, the singing and feedback of syllable 1 is the stimulus for the singing of syllable 2, etc. This idea suggests that the disordered sequencing of syllables after elimination or restriction of crucial auditory feedback occurs because birds cannot recognize the syllables of their own song output and, consequently, are missing the cues for the next appropriate syllables. In deafened Bengalese finches, syllables are sung in nearly random order within 1 week of cochlea removal (Woolley and Rubel, 1997).
In songbirds, dependence specifically on low-frequency auditory feedback for song development and maintenance could be adaptive for two reasons. First, it is known that in birds, as in mammals, low-frequency hearing develops before high-frequency hearing (Jackson and Rubel, 1978; Rebillard and Rubel, 1981; Lippe and Rubel, 1983; Rubel et al., 1984; Khayutin and Dmitrieva, 1987; Dmitrieva and Khayutin, 1989;Alexandrov and Dmitrieva, 1991; Gray, 1992; Golubeva, 1996). Thus, songbirds attending specifically to low-frequency information in song could receive and process the sensory stimuli important for song learning at an earlier age. Second, low-frequency sounds are known to travel farther and more reliably in acoustically complex environments (for review, see Wiley and Richards, 1978). Thus, if low frequencies were the crucial stimuli for song development and the recognition of songs or syllables, the reliability of learning song and using song for communication would be increased.
Temporal cues and song maintenance
A second possible explanation for the spectrally restricted feedback required for song maintenance is that Bengalese finches need the temporal envelope of auditory feedback for song maintenance. This hypothesis suggests that the specific frequencies of feedback are not important. Rather, any feedback that is sufficient for perception of the amplitude envelope of song or a syllable within a song would be both necessary and sufficient for song maintenance. It is possible that the difference between a high degree of hearing loss at all frequencies and hearing sound below 3 kHz (near normal levels below 1.5 kHz) means a difference between not hearing syllables at all and hearing only enough information to derive the temporal cues within song. The fundamental frequencies of most song syllables in Bengalese finches fall between 0.5 and 2.0 kHz. Birds with hearing loss above 2.0 kHz may hear the fundamental frequencies of syllables but not the harmonics. Hearing only fundamental frequencies for syllables essentially provides the same temporal information as hearing the entire song. This mechanism for song maintenance would explain the narrow range of difference in hearing loss that means the difference between maintained and degraded adult song.
Theunissen and Doupe (1998) have recently shown that “song-selective” neurons in the forebrain nucleus called the high vocal center are more sensitive to degraded temporal structure within a song than to degradation of the spectral composition of the song. Neural responses to synthetic songs were strong only when the amplitude-modulated components of song were primarily preserved. In contrast, selective neural responses persisted when song with substantial spectral degradation or altered frequency modulation was presented. In these experiments, the frequency components of song were not altered differentially. Therefore, the relative importance of certain frequency ranges within song for neural responsivity was not tested. However, these findings do indicate, as we suggest, that the preservation of temporal cues within song seems to be important for effective processing of song stimuli.
There is evidence that perception of other learned vocal signals depends mostly on temporal cues. Gottlieb (1979, 1980) showed that Peking ducklings depend on hearing their own embryonic contact-contentment calls to entrain a preference for the Peking maternal call over that of other species. The development of this preference was based entirely on the repetition rate of the call; the repetition rate of their own embryonic call matched that of the maternal call. When devocalized in ovo, a duckling will hatch without a preference for the repetition rate of the Peking maternal call and will respond equally to maternal calls of other species. In some songbirds, species recognition by individuals seems to depend on temporal structure such as pulse or syllable repetition rate (Emlen, 1972; Brenowitz, 1983). Additionally, the temporal organization of human speech rather than a full complement of spectral cues seems to be sufficient for speech perception in adults. Shannon et al. (1995)found that speech perception was near perfect for subjects listening to speech with severely diminished spectral information. The temporal envelopes of phrases presented to subjects were conserved, whereas the spectral information was filtered into broad frequency bands. Under these conditions, subjects were able to understand words and sentences with three time-varying noise bands as the only spectral content. This finding indicates that speech can be recognized with most spectral information missing and temporal cues preserved. It is possible that songbirds also rely most heavily on temporal cues for recognizing their own vocalizations, as well as those of other conspecifics with which they communicate.
Footnotes
This work was supported by National Institutes of Health Grants DC00520 and GM07108. We thank Eliot Brenowitz and Dexter Irvine for their valuable contributions to this work.
Correspondence should be addressed to Dr. Edwin W Rubel at Virginia Merrill Bloedel Hearing Research Center, Box 357923, University of Washington, Seattle, WA 98195.
REFERENCES
- 1.Alexandrov LI, Dmitrieva LP. Hearing development in altricial birds: absolute evoked potentials thresholds. Zhurnal Vysshei Nervnoi Deyatel’Nosti. 1991;41:384–390. [PubMed] [Google Scholar]
- 2.Beaubien AR, Karpinski K, Ormsby E. Toxicodynamics and toxicokinetics of Amikacin in the guinea pig cochlea. Hear Res. 1995;83:62–79. doi: 10.1016/0378-5955(94)00192-s. [DOI] [PubMed] [Google Scholar]
- 3.Bone RC, Ryan AF. Audiometric and histologic correlates of the interaction between kanamycin and subtraumatic levels of noise in the chinchilla. Otolaryngology. 1978;86:400–404. doi: 10.1177/019459987808600305. [DOI] [PubMed] [Google Scholar]
- 4.Brenowitz EA. The contribution of temporal song cues to species recognition in the red-winged blackbird. Anim Behav. 1983;31:1116–1127. [Google Scholar]
- 5.Brummett RE, Fox KE, Jacobs F, Kempton JB, Stokes Z, Richmond AB. Augmented gentamicin ototoxicity induced by vancomycin in guinea pigs. Arch Otolaryngol Head Neck Surg. 1990;116:61–64. doi: 10.1001/archotol.1990.01870010065019. [DOI] [PubMed] [Google Scholar]
- 6.Brummett RE, Fox KE, Kempton JB. Quantitative relationships of the interaction between sound and kanamycin. Arch Otolaryngol Head Neck Surg. 1992;118:498–500. doi: 10.1001/archotol.1992.01880050044011. [DOI] [PubMed] [Google Scholar]
- 7.Clayton NS. Song learning in Bengalese finches: a comparison with zebra finches. Ethology. 1987;76:247–255. [Google Scholar]
- 8.Clayton NS. Song tutor choice in zebra finches and Bengalese finches: the relative importance of visual and vocal cues. Behaviour. 1988;104:281–299. [Google Scholar]
- 9.Clayton NS. The effects of cross-fostering on selective song learning in estrildid finches. Behaviour. 1989;109:163–175. [Google Scholar]
- 10.Collins PW. Synergistic interactions of gentamicin and pure tones causing cochlear hair cell loss in pigmented guinea pigs. Hear Res. 1988;36:249–259. doi: 10.1016/0378-5955(88)90066-4. [DOI] [PubMed] [Google Scholar]
- 11.Cotanche DA, Lee KH, Stone JS, Picard DA. Hair cell regeneration in the bird cochlea following noise damage or ototoxic drug damage. Anat Embryol (Berl) 1994;189:1–18. doi: 10.1007/BF00193125. [DOI] [PubMed] [Google Scholar]
- 12.Dietrich K. Model choice in the song development of young male Bengalese finches. Z Tierpsychol. 1980;52:57–76. [Google Scholar]
- 13.Dittus WP, Lemon RE. Effects of song tutoring and acoustic isolation on the song repertoires of cardinals. Anim Behav. 1969;17:523–533. [Google Scholar]
- 14.Dmitrieva LP, Khayutin SN. Hearing mechanisms in birds. Their structure, function and ontogeny. Usp Fiziol Nauk. 1989;20:46–67. [PubMed] [Google Scholar]
- 15.Duckert LG, Rubel EW. Ultrastructural observations on regenerating hair cells in the chick basilar papilla. Hear Res. 1990;48:161–182. doi: 10.1016/0378-5955(90)90206-5. [DOI] [PubMed] [Google Scholar]
- 16.Duckert LG, Rubel EW. Morphological correlates of functional recovery in the chicken inner ear after gentamycin treatment. J Comp Neurol. 1993;331:75–96. doi: 10.1002/cne.903310105. [DOI] [PubMed] [Google Scholar]
- 17.Eales LA. Song learning in zebra finches: some effects of song model availability on what is learnt and when. Anim Behav. 1985;33:1293–1300. [Google Scholar]
- 18.Emlen ST. An experimental analysis of the parameters of bird song eliciting species recognition. Behaviour. 1972;41:130–171. [Google Scholar]
- 19.Girod DA, Tucci DL, Rubel EW. Anatomical correlates of functional recovery in the avian inner ear following aminoglycoside ototoxicity. Laryngoscope. 1991;101:1139–1149. doi: 10.1288/00005537-199111000-00001. [DOI] [PubMed] [Google Scholar]
- 20.Golubeva TV. Acoustically guided behavior in the early ontogeny of the long-eared owl: the development of hearing sensitivity. Zhurnal Vysshei Nervnoi Deyatel’Nosti. 1996;46:317–327. [PubMed] [Google Scholar]
- 21.Gottlieb G. Development of species identification in ducklings. V. Perceptual differentiation in the embryo. J Comp Physiol Psychol. 1979;93:831–854. [Google Scholar]
- 22.Gottlieb G. Development of species identification in ducklings. VI. Specific embryonic experience required to maintain species-typical perception in Peking ducklings. J Comp Physiol Psychol. 1980;94:579–587. doi: 10.1037/h0077691. [DOI] [PubMed] [Google Scholar]
- 23.Gray L. An auditory psychometric function from newborn chicks. J Acoust Soc Am. 1992;91:1608–1615. doi: 10.1121/1.402441. [DOI] [PubMed] [Google Scholar]
- 24.Hashino E, Tanaka Y, Salvi RJ, Sokabe M. Hair cell regeneration in the adult budgerigar after kanamycin ototoxicity. Hear Res. 1992;59:46–58. doi: 10.1016/0378-5955(92)90101-r. [DOI] [PubMed] [Google Scholar]
- 25.Immelmann K. Song development in the zebra finch and other estrildid finches. In: Hinde RA, editor. Bird vocalizations. Cambridge UP; Cambridge, UK: 1969. pp. 61–77. [Google Scholar]
- 26.Jackson H, Rubel EW. Ontogeny of behavioral responsiveness to sound in the chick embryo as indicated by electrical recordings of motility. J Comp Physiol Psychol. 1978;92:682–696. doi: 10.1037/h0077496. [DOI] [PubMed] [Google Scholar]
- 27.Jones SM, Jones TA. The tonotopic map in the embryonic chicken cochlea. Hear Res. 1995;82:149–157. doi: 10.1016/0378-5955(94)00173-n. [DOI] [PubMed] [Google Scholar]
- 28.Khayutin SN, Dmitrieva LP. Functional characteristics of development of hearing in altricial birds: association with natural behavior. Sensory Systems. 1987;1:233–240. [Google Scholar]
- 29.Kitasato I, Yokota M, Inouye S, Igarashi M. Comparative ototoxicity of ribostamycin, doactimicin, kanamycin, amikacin, tobramycin, gentamicin, sisomicin and netilmicin in the inner ear of guinea pigs. Chemotherapy. 1990;36:155–168. doi: 10.1159/000238762. [DOI] [PubMed] [Google Scholar]
- 30.Konishi M. The role of auditory feedback in the control of vocalization in the white-crowned sparrow. Z Tierpsychol. 1965;22:770–783. [PubMed] [Google Scholar]
- 31.Konishi M. An outline of recent advances in birdsong neurobiology. Brain Behav Evol. 1994;44:279–285. doi: 10.1159/000113582. [DOI] [PubMed] [Google Scholar]
- 32.Lenoir M, Puel JL. Dose-dependent changes in the rat cochlea following aminoglycoside intoxication. II. Histological study. Hear Res. 1987;26:199–209. doi: 10.1016/0378-5955(87)90112-2. [DOI] [PubMed] [Google Scholar]
- 33.Lippe W, Rubel EW. Development of the place principle: tonotopic organization. Science. 1983;219:514–516. doi: 10.1126/science.6823550. [DOI] [PubMed] [Google Scholar]
- 34.Manley GA, Brix J, Kaiser A. Developmental stability of the tonotopic organization of the chick’s basilar papilla. Science. 1987;237:655–666. doi: 10.1126/science.3603046. [DOI] [PubMed] [Google Scholar]
- 35.Marean GC, Burt JM, Beecher MD, Rubel EW. Hair cell regeneration in the European starling (Sturnus vulgaris): recovery of pure-tone detection thresholds. Hear Res. 1993;71:125–126. doi: 10.1016/0378-5955(93)90028-y. [DOI] [PubMed] [Google Scholar]
- 36.Marean GC, Cunningham D, Burt JM, Beecher MD, Rubel EW. Regenerated hair cells in the European starling: are they more resistant to kanamycin ototoxicity than original hair cells? Hear Res. 1995;82:267–276. doi: 10.1016/0378-5955(94)00183-q. [DOI] [PubMed] [Google Scholar]
- 37.Marler P. Sensitive periods and the roles of specific and general sensory stimulation in birdsong learning. In: Rauschecker JP, Marler P, editors. Imprinting and cortical plasticity: comparative aspects of sensitive periods. Wiley; New York: 1987. pp. 99–135. [Google Scholar]
- 38.Marler P. Song-learning behavior: the interface with neuroethology. Trends Neurosci. 1991;14:199–206. doi: 10.1016/0166-2236(91)90106-5. [DOI] [PubMed] [Google Scholar]
- 39.Marler P, Peters S. A sensitive period for song acquisition in the song sparrow, Melospiza melodia: a case of age-limited learning. Ethology. 1987;76:89–100. [Google Scholar]
- 40.Marler P, Waser MS. Role of auditory feedback in canary song development. J Comp Physiol Psychol. 1977;91:8–16. doi: 10.1037/h0077303. [DOI] [PubMed] [Google Scholar]
- 41.Nordeen KW, Nordeen EJ. Auditory feedback is necessary for the maintenance of stereotyped song in adult zebra finches. Behav Neural Biol. 1992;57:58–66. doi: 10.1016/0163-1047(92)90757-u. [DOI] [PubMed] [Google Scholar]
- 42.Okanoya K, Dooling RJ. Hearing in passerine and psittacine birds: a comparative study of absolute and masked auditory thresholds. J Comp Psychol. 1987;101:7–15. [PubMed] [Google Scholar]
- 43.Okanoya K, Yamaguchi A. Adult Bengalese finches (Lonchura striata var. domestica) require real-time auditory feedback to produce normal song syntax. J Neurobiol. 1997;33:343–356. [PubMed] [Google Scholar]
- 44.Price PH. Developmental determinants of structure in zebra finch song. J Comp Physiol Psychol. 1979;93:268–277. [Google Scholar]
- 45.Pye A, Collins P. Interaction between sound and gentamicin: immediate threshold and stereociliary changes. Hear Res. 1991;25:381–390. doi: 10.3109/03005369109076613. [DOI] [PubMed] [Google Scholar]
- 46.Rebillard G, Rubel EW. Electrophysiological study of the maturation of auditory responses from the inner ear of the chick. Brain Res. 1981;229:15–23. doi: 10.1016/0006-8993(81)90741-1. [DOI] [PubMed] [Google Scholar]
- 47.Rubel EW, Lippe W, Ryals BM. Development of the place principle. Ann Otol Rhinol Laryngol. 1984;93:609–615. doi: 10.1177/000348948409300614. [DOI] [PubMed] [Google Scholar]
- 48.Ryals BM, Rubel EW. Patterns of hair cell loss in chick basilar papilla after intense auditory stimulation. Frequency organization. Acta Otolarnygol. 1982;93:205–210. doi: 10.3109/00016488209130873. [DOI] [PubMed] [Google Scholar]
- 49.Ryals BM, Rubel EW. Differential susceptibility of avian hair cells to acoustic trauma. Hear Res. 1985;19:73–84. doi: 10.1016/0378-5955(85)90099-1. [DOI] [PubMed] [Google Scholar]
- 50.Salvi RJ, Saunders SS, Hashino E, Chen L. Discharge patterns of chicken cochlear ganglion neurons following kanamycin-induced hair cell loss and regeneration. J Comp Physiol [A] 1994;174:351–369. doi: 10.1007/BF00240217. [DOI] [PubMed] [Google Scholar]
- 51.Scharff C, Nottebohm F. A comparative study of the behavioral deficits following lesions of various parts of the zebra finch song system: implications for vocal learning. J Neurosci. 1991;11:2896–2913. doi: 10.1523/JNEUROSCI.11-09-02896.1991. [DOI] [PMC free article] [PubMed] [Google Scholar]
- 52.Shannon RV, Zeng FG, Kamath V, Wygonski J, Ekelid M. Speech recognition with primarily temporal cues. Science. 1995;270:303–304. doi: 10.1126/science.270.5234.303. [DOI] [PubMed] [Google Scholar]
- 53.Theunissen FE, Doupe AJ. Temporal and spectral sensitivity of complex auditory neurons in the nucleus HVc of male zebra finches. J Neurosci. 1998;18:3786–3802. doi: 10.1523/JNEUROSCI.18-10-03786.1998. [DOI] [PMC free article] [PubMed] [Google Scholar]
- 54.Tucci DL, Rubel EW. Physiologic status of regenerated hair cells in the avian inner ear following aminoglycoside ototoxicity. Otolaryngol Head Neck Surg. 1990;103:443–450. doi: 10.1177/019459989010300317. [DOI] [PubMed] [Google Scholar]
- 55.Vago P, Humbert G, Lenoir M. Amikacin intoxication induces apoptosis and cell proliferation in rat organ of Corti. NeuroReport. 1998;9:431–436. doi: 10.1097/00001756-199802160-00014. [DOI] [PubMed] [Google Scholar]
- 56.von Békésy G. Experiments in hearing (Wever EG, translator). Mcgraw Hill; New York: 1960. [Google Scholar]
- 57.Wiley RH, Richards DG. Physical constraints on acoustic communication in the atmosphere: implications for the evolution of animal vocalizations. Behav Ecol Sociobiol. 1978;3:69–94. [Google Scholar]
- 58.Woolley SMN, Rubel EW. Bengalese finches Lonchura Striata Domestica depend upon auditory feedback for the maintenance of adult song. J Neurosci. 1997;17:6380–6390. doi: 10.1523/JNEUROSCI.17-16-06380.1997. [DOI] [PMC free article] [PubMed] [Google Scholar]