

Abstract
Disruption of mitochondrial respiration has been proposed as an action of nitric oxide (NO) responsible for its toxicity, but the effects of NO on the energetics of intact central neurons have not been reported. We examined the effects of NO on mitochondrial function and energy metabolism in cultured hippocampal neurons. The application of NO from NO donors or from dissolved gas produced a rapid, reversible depolarization of mitochondrial membrane potential, as detected by rhodamine-123 fluorescence. NO also produced a progressive concentration-dependent depletion of cellular ATP over 20 min exposures. The energy depletion produced by higher levels of NO (2 μm or more) was profound and irreversible and proceeded to subsequent neuronal death.
In contrast to the effects of NO, mitochondrial protonophores produced complete depolarizations of mitochondrial membrane potential but depleted the neuronal ATP stores only partially. Inhibitors of mitochondrial oxidative phosphorylation (rotenone or 3-nitropropionic acid) or of glycolysis (iodoacetate plus pyruvate) also produced only partial ATP depletion, suggesting that either process alone could partially maintain ATP stores. Only by combining the inhibition of glycolytic energy production with the inhibition of mitochondria could the effects of NO in depleting energy and inducing delayed toxicity be duplicated.
These results show that NO has rapid inhibitory actions on mitochondrial metabolism in living neurons. However, the severe ATP-depleting effects of high concentrations of NO are not fully explained by the direct effects on mitochondrial activity alone but must involve the inhibition of glycolysis as well. These inhibitory effects on energy production may contribute to the delayed toxicity of NO in vitro and in ischemic stroke.
Keywords: nitric oxide, ischemia, peroxynitrite, poly-(ADP ribose) polymerase, mitochondria, glycolysis
The marked toxicity of nitric oxide (NO) to neurons is not fully explained. NO is known to have a number of cellular effects of possible pathophysiological significance (Gross and Wolin, 1995; Iadecola, 1997). Although it is not intrinsically unstable, NO avidly combines with the superoxide anion (O2•−) to form peroxynitrite (ONOO−), which is a highly reactive free radical, and has been shown to mediate much of the neurotoxicity of NO (Lipton et al., 1993; Bolaños et al., 1995). The cellular targets of NO or ONOO− responsible for subsequent neuronal death are not fully defined. One action linked to toxicity is the prolonged activation of poly-(ADP ribose) polymerase (PARP) (Zhang et al., 1994), leading to energy depletion. Inhibiting PARP prevents much of the delayed neurotoxicity of NO. However, multiple toxic effects of NO or ONOO− may interact to initiate neuronal death. For example, a disruption of Ca2+ homeostasis, which persists for hours after toxic exposure to NO (Brorson et al., 1997), also can be shown to contribute to its delayed neuronal toxicity (Brorson and Zhang, 1997). The final demise after NO exposure can be either apoptotic or necrotic cell death, depending on the intensity of the injury (Bonfoco et al., 1995).
NO impairs mitochondrial respiration in isolated mitochondria (Stadler et al., 1991; Radi et al., 1994; Lizasoain et al., 1996). The relevance of this action to toxicity in central neurons has not been demonstrated clearly. After 24 hr of ONOO− exposure (Bolaños et al., 1995) or 24 hr after brief glutamate exposure (Almeida et al., 1998), decreased activities of mitochondrial electron transport chain complexes have been described in neurons, but it is not clear whether these caused or rather resulted from ONOO− or glutamate-induced toxicity. A recent report has described acute compromise of mitochondrial complex activities after 5 min of asphyxia in perinatal rats (Bolaños et al., 1998). This effect was blocked by a nitric oxide synthase (NOS) inhibitor, suggesting a role for NO production. Nevertheless, the possibility remains that other effects of anoxia, such as reactive oxygen species production or transmembrane ion fluxes, may have combined with NO generation to affect mitochondria. Only by the application of NO from exogenous sources can its mitochondrial effects be isolated from multiple other effects of anoxia or glutamate exposure.
Neurons are particularly dependent on mitochondrial energy production. If neuronal mitochondria are inhibited by NO, energy depletion could result, possibly leading to either necrosis or apoptosis (Pang and Geddes, 1997). Ca2+ homeostasis also depends on ATP, and the observed disruption by NO of neuronal Ca2+homeostasis appears to be attributable to energy depletion, because it could be prevented by provision of an ATP supply via a patch pipette (Brorson et al., 1997). The effect of NO on cellular energy might be ascribed to the inhibition of the respiratory enzymes of mitochondria, to the inhibition of glycolysis, or to the induction of increased energy consumption. Whatever the cause, energy depletion might explain the early pathophysiological actions of NO. In the present studies we have examined directly the effects of toxic exposures to NO on mitochondria, energy supply, and survival in cultured neurons.
MATERIALS AND METHODS
Neuronal cultures. Dissociated cultures of hippocampal neurons were prepared from day 18 embryonic Sprague Dawley or Holtzman rats (with the sperm-positive day numbered as day 1), as previously described in detail (Brorson et al., 1997). The procedures that were followed were in accordance with a protocol approved by the University of Chicago Institutional Animal Care and Use Committee. Trypsin-dissociated neurons were plated on 15-mm-round glass coverslips and suspended over a feeding glial layer in a serum-free defined medium (N2.1, with 15 mm HEPES added). Hippocampal neurons for [Ca2+]i fluorimetric studies were of age 11–25 d in vitro (DIV), for ATP assays of age 11–19 DIV, and for toxicity studies of age 11–17 DIV.
Generation of solutions of NO. Most experiments used NO donors (see below) freshly dissolved from stock solutions in saline buffer immediately before application. Some experiments were performed with gaseous NO. NO gas (5% NO in N2), applied in different proportions with an excess of 20% O2/80% N2, was bubbled in stirred saline buffer at 22°C. During NO application the pH in the buffer was monitored. At higher rates of NO gas application the pH of the solution was found to decrease, presumably as a result of nitrous acid formation (Butler et al., 1995). To maintain neutral pH, we continuously replaced the buffer as it flowed from the chamber with alkaline buffer, pH 7.8. In contrast, by using NO donors, the pH changes during 20 min exposures were generally small (<0.1 pH units over 20 min periods). The only exception was 1 mm SNAP, which caused a drop in pH of 0.16 ± 0.03 at 5 min (mean ± SD) and no further pH drop thereafter.
Measurement of NO. To make approximate measurements of the NO concentrations generated by the NO donors or by gaseous NO, we used a NO-selective electrode (IsoNO, World Precision Instruments, Sarasota, FL). Calibration was performed according to instructions by using injections of defined amounts of NaNO2 in stirred deoxygenated solutions of KI and acetic acid, generating stoichiometric amounts of NO. Highly linear responses resulted and were used to convert the electrode current to [NO]. Measurements were made in 50 ml plastic tubes placed in a constant temperature water bath at 22–23°C. Immediately after the NO donor was mixed in buffer and at 5 min intervals thereafter, the tip of the NO electrode was placed in the NO solution and gently stirred for 1 min to achieve a stable reading and then was removed to control the buffer between readings. Separate [NO] measures also were made with the tip of the NO electrode in the well of the Plexiglas perfusion chamber used in physiological experiments during 5 min superfusions with NO donor-containing (or dissolved NO gas-containing) solutions.
Fluorescence imaging with rhodamine-123. Fluorimetric digital imaging of rhodamine-123 fluorescence was used to detect the effects on mitochondrial membrane potential. Hippocampal neurons were loaded by incubation for 10 min in 10 μg/ml rhodamine-123, followed by a 5 min wash, both at room temperature (22°C) in the standard saline buffer containing (in mm): NaCl 145, KCl 3, CaCl2 2, MgCl2 1, HEPES 10, and glucose 10, pH-adjusted to 7.4 with NaOH. The coverslips were mounted on a Plexiglas superfusion chamber, placed in a Nikon Diaphot fluorescence microscope, and continuously superfused with 0.5 μmtetrodotoxin-containing buffer to which various compounds were added. For digital imaging, excitation used a 495 nm light with a 505 nm dichroic mirror and a 515 nm long-pass barrier filter, plus a 40× fluorescence objective. Image acquisition and analysis were performed by commercial image-processing hardware and software (MetaFluor, Universal Imaging, West Chester, PA). A field of healthy-appearing neurons from the central region of a coverslip was selected, and the neurons were identified by typical morphology. Areas of interest were outlined over the soma of each neuron, including nuclear areas, and over a blank area of the coverslip for background. The average fluorescence was recorded digitally for each indicated area at 2 Hz for the duration of each experiment. Neurons were rejected if the baseline fluorescence was highly unstable or if significant digital saturation occurred during the experiment. Background traces were subtracted from the records for each neuron. Quantitative analysis was performed by comparing average background-corrected fluorescence at certain time points as a fraction of the difference between the baseline value and the peak carbonyl cyanide m-chlorophenylhydrazone-evoked (CCCP) fluorescence in the same cell. The relative fluorescence values were averaged over all imaged cells, usually 5–12 neurons for each experiment. Every condition was evaluated in four or more experiments.
ATP-luciferase assays. Cellular ATP and ADP assays in cultured neurons were performed with a firefly luciferase chemiluminescence assay essentially as described by Budd and Nicholls (1996). Coverslips were washed and exposed in the standard saline buffer at 37°C to various donors or at 22°C to NO dissolved from bubbled 5% NO gas (see above). Then the coverslips were washed, and the cells either immediately were taken up in 100 μl of lysis buffer (0.5 m KH2PO4, 1% Triton X-100, 2 mm EDTA, and 1 mm DTT, pH 7.8) or were returned to incubation in glia-conditioned serum-free medium for lysis at later time points. The extracted samples were centrifuged and stored at −20°C until an assay could be performed on all samples in parallel. Reagents were obtained from Analytical Luminescence Laboratory (Ann Arbor, MI). The low background reagent (Firelight LB) was used in 20 μl amounts with 100 μl of reaction buffer. Luminescence was measured by the Monolight 1500 luminometer (Analytical Luminescence Laboratory), made available via the generosity of Dr. Harinda Singh of the Howard Hughes Medical Institute of the University of Chicago (Chicago, IL). After a determination of the luciferase signal corresponding to the ATP concentration, pyruvate kinase (2 U) and phosphoenol pyruvate (0.5 mm) were added and a second measurement of luminescence was taken, the additional signal reflecting the conversion of ADP to ATP (driven to near-completion by an excess of phosphoenol pyruvate). The signal difference gave an estimate of ADP concentration for the calculation of ATP/ADP ratios.
Total protein was measured with the Bio-Rad DC Protein Assay kit (Bio-Rad Laboratories, Hercules, CA), according to the instructions supplied for the microplate assay protocol, and, through the generosity of Dr. Anthony Reder (Department of Neurology, University of Chicago), a Molecular Devices Thermomax microplate reader (Palo Alto, CA) at a wavelength of 650 nm. Because the buffer used for luciferase assays was incompatible with any of the available colorimetric protein assays, we were unable to normalize ATP values to concurrent measures of the total cellular protein. Instead, the total ATP signal per coverslip of cultured neurons exposed to various treatments was normalized to the total ATP signal from parallel control coverslips. Figures show the mean ± SD of normalized ATP or of the ATP/ADP ratio for each condition. An estimation of ATP per unit of protein also was performed by measures from coverslips treated in parallel, with quantities calculated by using linear regression of calibration data generated with known amounts of ATP and of ovalbumin. The ATP per total protein from cultured neurons was found to be 8.7 ± 1.6 pmol/mg (mean ± SD) in controls versus 0.7 ± 0.1 pmol/mg after exposure to 30 μm SNOC.
Survival assays. Cell death and survival were assayed by using the fluorescent markers fluorescein diacetate and propidium iodide as previously described (Brorson and Zhang, 1997). Drug exposure was at 37°C in the standard physiological buffer described above. After 20 min exposures the coverslips were washed and returned to incubation in glia-conditioned serum-free medium. After 24 hr the living neurons and dead cells were counted in a blinded manner in each experiment, and the percentage of survival was calculated.
Data analysis. Statistical evaluations of rhodamine fluorescence changes and of survival were by ANOVA on ranks and of normalized ATP values by repeated measures ANOVA on ranks, followed by Dunn’s test of pairwise comparisons to control values (SigmaStat, Jandel Scientific, San Rafael, CA).
Materials. A 100 mm stock ofS-nitrosocysteine (SNOC) was produced immediately before each use from a mixture of 100 mml-cysteine and 100 mm NaNO2 by acidification with 5% (v/v) with 10N HCl. SNOC was added to saline buffer at room temperature, and the pH was brought back to 7.4 with 1N NaOH. It was applied within minutes of its synthesis, and no additional fresh SNOC was added subsequently during the 20 min exposures. After synthesis, stocks of SNOC were left at room temperature for several days to degrade fully to “old SNOC” for use as a control.S-nitroso-N-acetylpenicillamine (SNAP), stored in 1 m aliquots in DMSO at −20°C until use, and 3-morpholino-sydnonimine (SIN-1), stored at −20°C as 1 maliquots in water, were obtained from Molecular Probes (Pitchford, OR), as were fura-2 AM and rhodamine-123. Spermine-NO and diethylamine sodium–nitric oxide complex (DEA–NO) were purchased from Research Biochemicals (Natick, MA). Spermine-NO was dissolved as a 15 mm stock in water on the day of use, and DEA–NO was dissolved in methanol at 0.1 m, stored on dry ice in ethanol, and used within hours. Frozen stocks of the latter agents did not retain activity. Bovine hemoglobin (Sigma, St. Louis, MO) was reduced with excess sodium hydrosulfite and purified on a Sephadex G-25 column to produce 3 mm stocks of oxyhemoglobin, which was refrigerated and used within 3 d. The compound 2-phenyl-4,4,5,5-tetramethylimidazoline-1-oxyl-3-oxide (PTIO) was purchased from Alexis Biochemicals (San Diego, CA) and stored at 4°C as a 100 mm stock in ethanol. Calpain inhibitor-1 (Calbiochem, San Diego, CA) and MDL-28170 (the kind gift of Dr. Shujaath Mehdi, Marion Merrell Dow, Cincinnati, OH) were both stored as 10 mm stocks in ethanol at 4°C. All other reagents and chemicals were purchased from Sigma. CCCP and carbonyl cyanidep-trifluoromethoxy-phenylhydrazone (FCCP) were stored at 4°C as 5 mm stocks in DMSO, and rotenone was stored at 10 mm in DMSO. Ethanol-dissolved stocks of oligomycin at 6 mg/ml and α-cyano-4-hydroxycinnamic acid (4-CIN) at 1 mwere stored at −20°C. SOD was stored at 4°C as a 100,000 U/ml stock in water; iodoacetate was stored at −20°C at 1 min water. 3-Nitropropionic acid was mixed as a fresh 1 mstock in water on the same day that it was used, and pyruvate was added directly to buffer at the final 10 mm concentration.
RESULTS
NO donors
In previous work we have shown that NO donors, including SNOC, SNAP, and SIN-1, induce acute toxicity in neurons (Brorson and Zhang, 1997). To elucidate the mechanisms leading to neuronal death after exposure to NO, we have used these agents and others as NO sources, exploring their effects on mitochondrial physiology and energy homeostasis.
The varied physiological effects of different NO donors must be interpreted in the light of the NO concentration ([NO]) that they each produced. Using an NO-sensitive electrode, we measured the NO concentrations produced by the various NO donors in unstirred buffer over 20 min periods (Table 1). In static buffer, high initial readings from SNOC dilutions decayed over the first few minutes to substantially lower values. At 5 min the accumulations of NO ranged from 0.5 μm (for 3 μm SNOC) to nearly 10 μm (for 1 mm SNOC). The relationship between [NO] and SNOC concentration was nonlinear, reflecting more complex chemical kinetics than a simple irreversible first order decay. In contrast, SNAP (1 mm) produced much lower [NO], rising slowly to only ∼0.5 μm, whereas SIN-1 (1 mm) produced no detectable [NO]. The other NO donors used, spermine-NO (300 μm) and DEA–NO (100 μm), produced micromolar concentrations of NO. Neither saline alone nor 1 mml-cysteine plus NaNO2 generated signals (data not shown). Because the actual NO concentrations applied to the cells might be dependent on the handling of the agents and on the configuration used, they also were assayed in the perfusion chamber that was used in our experiments. The values of [NO] delivered to the perfusion chamber from solutions of the various NO donors closely matched those measured in the static buffer at the 5 min time point, although the initial high peak values generated by SNOC were blunted in the perfusion chamber (data not shown). The NO concentrations generated from gaseous NO were measured also, as cited below.
Table 1.
Concentrations of NO, in micromolars
| Time (minutes): | 5 | 10 | 15 | 20 | Mean over 20 min |
|---|---|---|---|---|---|
| SNOC, 3 μm | 0.54 ± 0.22 | 0.31 ± 0.08 | 0.19 ± 0.05 | 0.12 ± 0.07 | 0.45 ± 0.15 |
| SNOC, 30 μm | 1.57 ± 0.74 | 0.86 ± 0.47 | 0.68 ± 0.46 | 0.67 ± 0.46 | 1.51 ± 0.51 |
| SNOC, 300 μm | 5.52 ± 0.73 | 3.87 ± 0.63 | 2.98 ± 1.21 | 2.65 ± 1.35 | 4.99 ± 0.37 |
| SNOC, 1 mm | 9.68 ± 1.13 | 9.07 ± 0.95 | 8.29 ± 0.92 | 8.23 ± 1.30 | 9.34 ± 0.90 |
| SNAP, 1 mm | 0.46 ± 0.22 | 0.47 ± 0.24 | 0.50 ± 0.22 | 0.54 ± 0.20 | 0.46 ± 0.20 |
| SIN-1, 1 mm | −0.10 ± 0.16 | −0.05 ± 0.12 | −0.01 ± 0.05 | 0.00 ± 0.03 | −0.07 ± 0.12 |
| Spermine-NO, 300 μm | 1.93 ± 0.66 | 2.05 ± 0.67 | 2.11 ± 0.67 | 2.17 ± 0.73 | 1.90 ± 0.62 |
| DEA-NO, 100 μm | 5.74 ± 0.58 | 4.86 ± 0.81 | 4.52 ± 0.25 | 4.23 ± 0.18 | 4.95 ± 0.49 |
NO was measured in 20 ml of buffer containing the indicated NO donor, in 50 ml plastic tubes, at room temperature (∼22°C). Means ± SD of three to four separate measurements at 5 min intervals are shown. Separate measurements of NO concentrations delivered to the physiological perfusion chamber from each agent were similar to the values measured in the static buffer at 5 min, but without the immediate high peak values produced by SNOC (data not shown).
NO depolarizes mitochondria in living hippocampal neurons
To study mitochondrial function in intact hippocampal neurons, we used the fluorophore rhodamine-123 as an indicator of mitochondrial depolarization (Duchen, 1992). Rhodamine-123 is sequestered into mitochondria by the highly negative potential of the inner mitochondrial membrane, designated Δψm, which is maintained by the proton translocation of the electron transport system. If this activity is inhibited pharmacologically or if the proton gradient is eliminated by one of the protonophores CCCP or FCCP, the membrane depolarizes and rhodamine-123 is released into the cytoplasm. We observed increases in overall cytoplasmic fluorescence with mitochondrial depolarization (Figs.1, 2). Basal rhodamine-123 fluorescence was quite stable in neurons, fading only slowly, whereas the fluorescence in intermingled glial cells faded rapidly within the first few minutes of observation. CCCP (1 μm) produced a rapid rise in average somatic fluorescence, reaching a plateau value within 90 sec. With the washout of CCCP, fluorescence recovered to the same baseline in each cell over a 1–5 min interval. Repeated exposures to CCCP (at 0.1, 1, and 10 μm) or by FCCP (1 or 10 μm) produced approximately the same maximal rhodamine-123 fluorescence increases (data not shown). We used this peak increase in fluorescence produced by 1 μm CCCP to normalize subsequent changes produced by other agents.
Fig. 1.

Mitochondrial imaging with rhodamine-123.A, Photomicrographs of rhodamine-123 fluorescence in cultured hippocampal neurons (26 DIV). Successive frames show (1) a phase contrast image, (2) baseline fluorescence with a particulate cytoplasmic distribution consistent with localization of fluorophore to mitochondria, (3) increased diffuse cytoplasmic fluorescence after 1 min of stimulation with CCCP (1 μm), and (4) recovery of the particulate fluorescence pattern with the washout of CCCP. Scale bar, 30 μm. B, Digital fluorimetric imaging of rhodamine-123 fluorescence at baseline, after 1 min of exposure to 1 mm SNOC, and after 3 min of washout, demonstrating a reversible increase in cytoplasmic fluorescence induced by SNOC (indicated by warmer colors on the pseudocolor scale).
Fig. 2.

Rhodamine-123 detection of mitochondrial depolarization. Cytoplasmic rhodamine-123 fluorescence (arbitrary units) versus time for seven representative hippocampal neurons for each experiment. A, In control experiments 90 sec exposures to CCCP (1 μm) resulted in rapid increases in fluorescence, followed by stable or slightly decreased signals over 10 min exposures. B, SNOC (1 mm) produced rapid fluorescence increases. C, The effects of SNOC were not blocked by the coapplication of superoxide dismutase (SOD; 100 U/ml). D, The complex I inhibitor rotenone (5 μm) produced slower increases in fluorescence in some imaged neurons, with little reversibility.E, Quantitative summary of rhodamine-123 fluorescence studies, comparing changes in relative cytoplasmic fluorescence after 1 or 5 min averaged over all neurons in each experiment. These values then were averaged over all experiments for each agent. The concentrations used were 1 mm for SNOC, “old SNOC,” SIN-1, SNAP, and l-cysteine (l-Cys) plus NaNO2, 100 U/ml for SOD, 1 μm for MK-801, 5 μm for rotenone, and 1 mm for 3-nitropropionic acid (3-NP) (mean ± SEM; *p < 0.05; n = 6–10 experiments for each condition).
High concentrations of NO (∼9 μm) generated by 1 mm SNOC consistently produced an increase in rhodamine-123 fluorescence in most neurons (Figs. 1,2). The increase was a variable fraction of the signal change produced by CCCP. The effect generally occurred quickly with the application of SNOC, sometimes increasing further over a 5 or 10 min exposure, and often with incomplete recovery after washout. Changes in rhodamine-123 fluorescence at 1 and 5 min, quantified as a fraction of the maximal change produced by CCCP, showed that the average fluorescence in cells perfused with buffer alone slightly decreased over 5 min (Fig. 2E). In contrast, SNOC (1 mm) produced significant average increases in fluorescence, whereas inactivated SNOC (“old SNOC”) orl-cysteine plus NaNO2 (from which SNOC is synthesized) had no significant effects. Neither the NMDA antagonist MK-801 (1 μm) nor the enzyme superoxide dismutase-1 (SOD) changed the significant effects of NO released from SNOC. Electron transport inhibitors, including the complex I inhibitor rotenone (5 μm) (Budd and Nicholls, 1996) and the irreversible complex II inhibitor 3-nitropropionic acid (1 mm) (Beal, 1995), also produced qualitative increases in the rhodamine signal. The submicromolar NO concentrations produced by SNAP (1 mm) or SIN-1 (1 mm) (see Table 1) did not produce significant fluorescence changes.
We performed similar experiments by applying a range of NO concentrations, using several NO donors as well as gaseous NO dissolved in buffer (Fig. 3). Agents producing several micromolar NO concentrations, including 30 μmSNOC and 100 μm DEA–NO, produced large increases in rhodamine-123 fluorescence. NO concentrations in the 1–2 μm range (produced by 3 μm SNOC or 300 μm spermine-NO) appeared to produce smaller, variable qualitative fluorescence changes (Fig. 3A) that did not reach statistical significance. NO dissolved from gas at 1.55 μm also evoked significant increases in rhodamine-123 fluorescence, whereas buffer bubbled with 20% O2/80% N2 alone showed no changes from control traces. When the mean change in rhodamine-123 fluorescence was plotted as a function of the mean NO concentrations in the perfusion chamber for each treatment, a striking NO concentration-dependent relationship emerged (Fig. 3D). Concentrations of NO rising into the micromolar range produced increasing acute rhodamine-123 signals, indicating changes of Δψm. At ∼4 μm the rhodamine-123 signal changes appeared to reach a plateau.
Fig. 3.

Mitochondrial effects of other NO donors.A, Representative cytoplasmic rhodamine-123 fluorescence recordings from hippocampal neurons exposed to 3 μm SNOC, 30 μm SNOC, and 100 μm DEA–NO. CCCP (1 μm) was applied before and after each agent.B, The effects of dissolved NO from gas on rhodamine-123 fluorescence. Saline buffer was bubbled continuously with an NO/O2/N2 mixture and perfused over the neurons. Buffer bubbled with O2/N2 alone (top) had no effect. The buffer containing dissolved NO produced a modest rise in the rhodamine123 fluorescence (bottom). C, Summary of average changes in relative rhodamine-123 fluorescence (mean ± SEM; *p < 0.05 compared with controls) for 3 and 30 μm SNOC, 300 μmspermine-NO, 100 μm DEA–NO, and for NO from gas at two rates, which generated dissolved [NO] values at 5 min of 0.44 ± 0.07 and 1.55 ± 0.44 μm (mean ± SEM).D, The average changes in rhodamine-123 fluorescence are plotted versus the average concentrations of NO at 5 min produced by each agent, measured in the perfused chamber (mean ± SEM). The mitochondrial depolarization, indicated by fluorescence changes, correlated with the NO concentration (r = 0.86;p < 0.01).
As a final confirmation that NO actually mediated the effects of SNOC on rhodamine-123 fluorescence, the NO scavenging agents oxyhemoglobin and PTIO (Akaike et al., 1993) were used (Fig.4). As before, no significant change in fluorescence occurred in control neurons exposed to buffer alone, whereas 10 min exposures to SNOC (1 mm) alone produced increasing elevations in rhodamine fluorescence. Both oxyhemoglobin and PTIO prevented significant increases in fluorescence for 5 min of simultaneous exposure, whereas fluorescence increases followed scavenger washout with continued exposure to SNOC. The evidence confirmed a specific action of NO in producing the fluorescence changes.
Fig. 4.

NO scavengers block the effects of SNOC on mitochondrial potential. Shown are the effects of the NO scavenging agents oxyhemoglobin (Hgb; 30 μm) or PTIO (50 μm) on NO-induced changes in rhodamine-123 fluorescence hippocampal neurons.A, After a 90 sec exposure to CCCP (1 μm), fluorescence (arbitrary units) remained stable during 5 min of NO exposure (1 mm SNOC) in the presence of oxyhemoglobin but began to rise after the removal of oxyhemoglobin. B, SNOC (1 mm) alone for 10 min produced rapid, sustained, and reversible fluorescence increases. C, Quantitative summary of effects of scavengers on changes in rhodamine-123 fluorescence relative to a maximal fluorescence change produced by CCCP. SNOC alone produced a rapid, sustained rise in relative fluorescence. No significant increase was produced by SNOC in the presence of either oxyhemoglobin or PTIO. PTIO alone, in the pretreatment phase, appeared to produce a small decrease in rhodamine-123 fluorescence, likely because of its absorbance by the blue-colored PTIO (mean ± SEM; *p < 0.05 compared with baseline).
It is noteworthy that the decreases in Δψminduced by NO concentrations of several micromolars were similar to or greater than those produced by agents known to inhibit enzymes of mitochondrial respiration (rotenone or 3-nitropropionic acid), although less than those produced by direct depolarization of the mitochondrial membrane (by CCCP). The partial depolarization of mitochondria caused by high concentrations of NO is consistent with the expected effects of an inhibition of electron transport.
NO rapidly depletes ATP in hippocampal neurons
Mitochondrial dysfunction might result in energy depletion. Luciferase-based assays of total ATP and of the ATP/ADP ratio served to assess neuronal energy stores after 20 min exposures to various conditions (Fig. 5A). Average NO concentrations of 5–9 μm, produced by 300 μm or 1 mm SNOC, resulted in severe depletions of total ATP as compared with controls. Again, the depletion of ATP appeared to be mediated specifically by NO, because it was not reproduced by controls of old SNOC or l-cysteine plus NaNO2. Changes in the ratio of ATP/ADP generally paralleled the effects on total ATP, with substantially greater variance, likely related to uncertainties in the ADP measurements (see Materials and Methods). Subsequent analyses of neuronal energy stores primarily examined total ATP. Qualitative changes in the ATP/ADP ratio continued to parallel the effects on total ATP.
Fig. 5.

Depletion of neuronal ATP by NO. Normalized total ATP values and ATP/ADP ratios (means ± SD), were determined by luciferase assays, as described, from cultured hippocampal neurons.A, After 20 min exposures, NO produced by 300 μm or 1 mm SNOC produced a near-complete depletion of cellular total ATP stores and of the ATP/ADP ratio, whereas treatments with “old SNOC” orl-Cys+NaNO2, also at 1 mm, had no substantial effect on energy stores although the slight changes in total ATP, but not in the ATP/ADP ratio, reached statistical significance (n = 5; *p < 0.05 compared with controls). B, Concentration–response data for SNOC on cellular energy indicated highly sensitive effects on ATP and ATP/ADP (n = 4). C, The time course of ATP depletion by SNOC over a 20 min exposure period and over the subsequent 24 hr after a return to the culture medium.D, Effect of receptor and enzyme antagonists on the recovery of cellular ATP stores at 6 hr after NO exposure. The NMDA antagonist MK-801 (1 μm), the PARP antagonist benzamide (500 μm), the calpain antagonists calpain inhibitor-1 (CI-1; 3 μm) or MDL-28170 (10 μm), and superoxide dismutase (SOD; 100 U/ml) each allowed partial recovery of cellular ATP levels at 6 hr after NO exposure (n = 4; *p < 0.05 compared with controls and †p < 0.05 compared with SNOC alone).
ATP depletion by SNOC exhibited a concentration–response relationship with a half-maximal effect at ∼3 μm, corresponding to an [NO] of ∼0.5 μm (Fig. 5B). The time course was characterized by a steady decline of total ATP over the 20 min exposure, with no significant recovery of cellular energy stores in the subsequent 24 hr (Fig. 5C). Agents that partially protect neurons from delayed death after NO exposure (Brorson and Zhang, 1997), including MK-801, benzamide, calpain inhibitors, and SOD, did not substantially prevent the acute depletion of ATP during the 20 min SNOC exposures, but each significantly enhanced total energy recovery over the next 6 hr (Fig. 5D), as expected given previous findings of their neuronal protection. Benzamide, which inhibits PARP, slightly decreased the degree of energy depletion during the 20 min exposures and also allowed for the largest energy recovery in the post-treatment period.
NO produced by other agents also depleted energy stores (Fig.6). NO at concentrations ranging from ∼0.5 μm (from 3 μm SNOC or 1 mm SNAP) to 1.5 μm (from 30 μmSNOC) or 1.9 μm (from 300 μm spermine-NO) each partially reduced total ATP and the ATP/ADP ratio after 20 min. SIN-1 (1 mm), which did not produce a measurable amount of NO, nevertheless also partially depleted energy stores. NO dissolved in solution from a gaseous mixture with O2/N2 also was applied, using a continuous exchange of buffer to maintain neutral pH over the 20 min exposures. At an average [NO] of 0.55 ± 0.20 μm(mean ± SD), a modest depletion of ATP to ∼60% of parallel controls occurred, whereas an [NO] of 2.98 ± 1.46 μm depleted most of the neuronal energy stores (Fig.6B). With the exception of the anomalous energy depletion by SIN-1, the ATP depletion under various conditions correlated with the associated measured [NO], with concentrations of NO >1–2 μm resulting in severe depletion of neuronal energy stores (Fig. 6C).
Fig. 6.

ATP effects of lower concentrations of NO.A, Exposures to lower concentrations of SNOC were repeated in parallel with other NO donors, producing lower NO concentrations. SNAP (1 mm), spermine-NO (300 μm), SNOC (3 or 30 μm), and SIN-1 (1 mm) each produced significant decrements of ATP and ATP/ADP (mean ± SD; *p < 0.05). B, Neurons also were exposed for 20 min to an O2/N2 mixture alone and to NO from 5% NO gas dissolved in stirred buffer at two concentrations, 0.55 ± 0.09 and 2.98 ± 0.65 μm (mean ± SEM; averaged over 20 min). O2/N2 alone produced no measurable [NO] (0.00 ± 0.01 μm), and this treatment resulted in only a slight decrement in ATP as compared with untreated control coverslips. In contrast, NO from gas produced large concentration-dependent ATP depletions (mean ± SD;n = 4; p < 0.05 compared with O2/N2 treatment alone).C, The relative ATP after 20 min exposures to various NO donors or to gaseous NO was compared with the average measured [NO] produced by each agent. A strong concentration dependence was observed, with exposure to ∼2 μm NO or more producing a 50% depletion of ATP. The effect of SIN-1 (asterisk) was anomalous in that it produced significant ATP depletion without producing measurable [NO].
Our expectation was that NO was causing energy depletion in the neurons by the inhibition of mitochondrial function. To test this hypothesis, we compared the effects of NO (from 1 mm SNOC) on ATP with the effects of mitochondrial inhibitors. In contrast to the near-total depletion of ATP by 20 min exposure to NO, rotenone (5 μm), 3-nitropropionic acid (1 mm), or the mitochondrial ATP synthase inhibitor oligomycin (6 μg/ml) each only produced a partial depletion of ATP (Fig.7). We confirmed that this concentration of oligomycin was saturating by comparing 6 with 18 μg/ml, which produced no significant additional ATP depletion over 20 min exposures (data not shown). The protonophore CCCP (1 μm) or CCCP in combination with oligomycin also produced only partial depletion of ATP over 20 min, much less than that of SNOC. Unexpectedly, it thus appeared that the toxic NO concentrations, which had been found to depolarize mitochondria only partially, were having substantially greater energy-depleting effects than the complete inhibition of mitochondrial ATP production.
Fig. 7.

Effects of mitochondrial inhibitors on ATP. Effects of NO from SNOC on neuronal ATP at 20 min and 6 hr were compared with those of oligomycin (6 μg/ml), CCCP (1 μm), rotenone (5 μm), 3-nitropropionic acid (3-NP; 1 mm), and the combinations of SNOC plus oligomycin (SNOC+Oligo) or CCCP plus oligomycin (CCCP+Oligo). All treatments were applied for 20 min, and the cells were harvested for ATP assay at 20 min and 6 hr (mean ± SD; n = 6; *p < 0.05 compared with controls and †p < 0.05 compared with SNOC alone). NO produced more severe energy depletion than did mitochondrial inhibitors.
ATP depletion: Increased consumption or decreased production?
One possible explanation for the disparity between the energy depletion produced by NO and that by mitochondrial inhibitors might be that the severe effects of NO are the result of a large increase in ATP consumption as well as of the inhibition of mitochondrial ATP production. Indeed, PARP activation by NO is thought to cause toxicity in part because of increased ATP consumption (Zhang et al., 1994). The blockade of PARP by benzamide caused only a minor relief of ATP depletion by NO (see Fig. 5), but other avenues of ATP hydrolysis also might be activated by NO. It might be postulated that even the mitochondrial depolarizations observed during NO exposures are attributable to overactivity of the ATP synthase driven by increased ATP demand, producing a drain on the proton gradient and membrane depolarization. If the mitochondrial depolarizations were attributable solely to overdrive of the ATP synthase, oligomycin would reverse completely the rhodamine-123 signal changes produced by NO. However, on coapplication of oligomycin (6 μg/ml) with SNOC (1 mm), no reversal of the NO-induced rhodamine-123 signal changes was observed (n = 5; data not shown). The mitochondrial depolarization by NO appeared to be a primary effect on mitochondrial electron transport. With inhibition sufficient to depolarize the mitochondria, cessation of mitochondrial ATP synthesis is the expected result.
Contributions of glycolysis to energy stores
Glycolytic energy production alone generally has been thought to be insufficient to meet the energy demands of neurons (Siesjö, 1978). To test whether the partial preservation of energy stores in the face of complete mitochondrial inhibition depended on glycolytic energy production, we compared the effects of inhibiting mitochondrial respiration or glycolysis alone with those of inhibiting both glycolysis and mitochondria (Fig.8A). Iodoacetate, which inhibits the key glycolytic enzyme glyceraldehyde-3-phosphate dehydrogenase (Sabri and Ochs, 1971), produced severe depletion of ATP at 1 mm, a concentration producing near-maximal effects in separate experiments (data not shown). Because these experiments were performed in simple buffers containing glucose but no other hydrocarbon substrates such as lactate or pyruvate, the inhibition of glycolysis might produce energy depletion in part by blocking the substrate supply to the tricarboxylic acid cycle, indirectly halting mitochondrial oxidative phosphorylation as well. Accordingly, the depletion of ATP by iodoacetate was relieved partially by extracellular pyruvate, whereas additionally including the monocarboxylic acid transport inhibitor 4-CIN (Williams et al., 1996) prevented the relief of energy depletion, corroborating the specificity of the action of iodoacetate on glycolysis. Thus the inhibition of glycolysis alone did not deplete ATP severely if a substrate supply for mitochondrial respiration was maintained. In a similar manner, 2-deoxyglucose, which prevents glycolysis when completely substituted for extracellular glucose, also produced a partial energy depletion that was reversible by pyruvate, restored by 4-CIN, and increased by oligomycin (data not shown). Complete inhibition of mitochondria by the combination of saturating concentrations of FCCP (1 μm, shown to be a maximally effective concentration for depleting ATP in separate experiments) and oligomycin (6 μg/ml) also only partially depleted ATP. Furthermore, adding oligomycin to FCCP lessened the resulting energy depletion as compared with the protonophore alone, suggesting that part of the ATP depletion resulting from mitochondrial depolarization was occurring by reversal of the mitochondrial ATP synthase, leading to the consumption of ATP, as has been described in cerebellar granule neurons (Budd and Nicholls, 1996). The simultaneous inhibition of both glycolysis and mitochondria by treatment with iodoacetate plus FCCP or iodoacetate plus oligomycin produced near-complete depletion of ATP after 20 min exposures, similar to the effect of high [NO]. Thus, neither the inhibition of glycolysis alone nor the inhibition of mitochondrial respiration alone, but only a simultaneous inhibition of both glycolysis and oxidative energy production was sufficient to reproduce the severe energy-depleting effects of NO exposure.
Fig. 8.
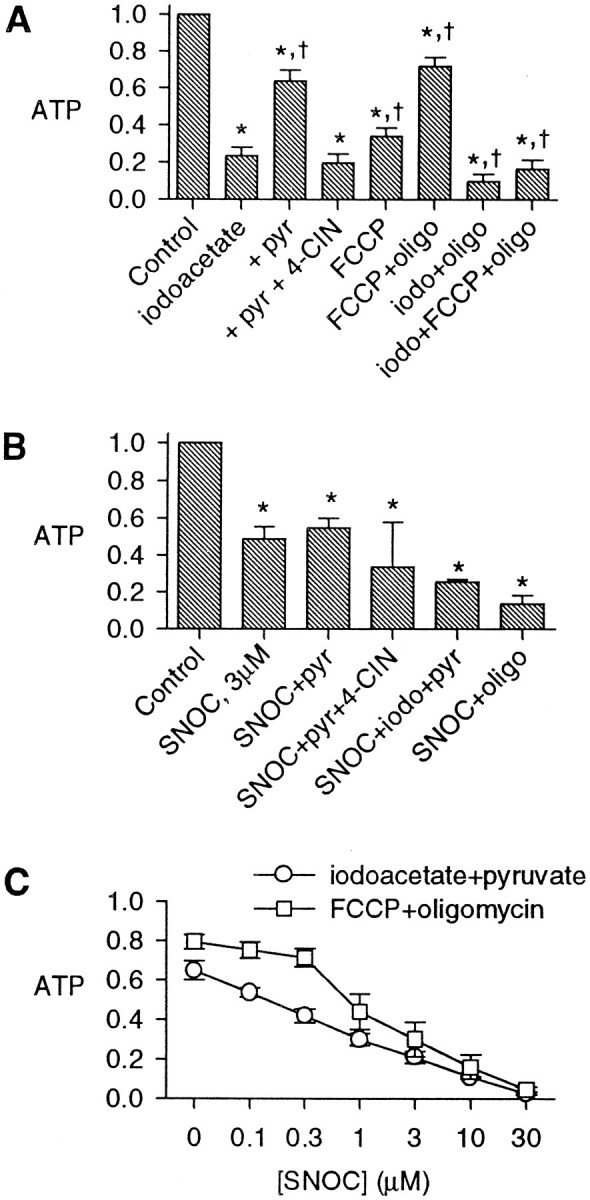
Comparison of effects of the inhibition of glycolysis and of mitochondria on ATP levels. Shown are normalized ATP values after 20 min treatments with the indicated agents (mean ± SD). A, The glycolytic inhibitor iodoacetate (1 mm) caused a substantial depletion of ATP, which was prevented mainly by the inclusion of 10 mm pyruvate (pyr) in the buffer. The monocarboxylic acid uptake inhibitor 4-CIN (10 mm) reversed the effect of pyruvate. FCCP (1 μm) partially depleted ATP; this was partially prevented by oligomycin (6 μg/ml). Combinations of iodoacetate (iodo) and oligomycin (oligo) and FCCP caused a severe depletion of ATP after 20 min (n = 6; *p < 0.05 compared with controls and †p < 0.05 compared with iodoacetate alone). B, ATP depletion by 3 μm SNOC was not significantly prevented by the addition of 10 mm pyruvate; 3 μm SNOC added to iodoacetate and pyruvate (iodo+pyr) or to oligomycin (oligo) depleted the cells of most ATP (*p < 0.05 compared with control; not significant when compared with SNOC alone). C, SNOC at a range of concentrations was applied in buffer also containing either iodoacetate and pyruvate or FCCP and oligomycin, demonstrating the concentration–response relationships of ATP depletion in the face of the inhibition of glycolysis or of oxidative phosphorylation.
Although high concentrations of NO appeared to be inhibiting both glycolytic and oxidative energy production, the concentrations required to inhibit the two arms of energy metabolism might be quite different. To assess whether a lower [NO] (∼0.5 μm) might inhibit one of the processes selectively, we applied 3 μmSNOC (Fig. 8B). Adding 10 mm pyruvate to 3 μm SNOC did not reverse its partial ATP depletion substantially, showing that the inhibitory effect of NO was not acting at glycolysis alone. Adding inhibitors of glycolysis or of mitochondrial ATP synthesis appeared to deplete ATP further, suggesting that neither arm of energy production was fully inhibited by modest [NO]. With the full inhibition of glycolysis by iodoacetate plus pyruvate (Fig. 8C), increasing SNOC concentrations induced additional energy depletion, with a broad concentration dependence. Similarly, with the full inhibition of mitochondria by FCCP and oligomycin, SNOC also produced a concentration-dependent further depletion of ATP with a somewhat higher concentration threshold. These pharmacological manipulations partially isolated the effects of NO on mitochondria from those on glycolysis and suggested that in neurons NO can inhibit both mitochondrial energy production and, somewhat less sensitively, glycolytic energy production.
Delayed toxicity of NO is not mimicked by inhibitors of mitochondria
Given the evidence for a rapid energy depletion by NO in neurons, we asked whether the energy depletion itself could be sufficient to explain the neuronal death induced by NO. We applied the various NO donors that were found to produce ATP depletion in 20 min exposures, including SNOC, SIN-1, SNAP, and spermine-NO. Each agent significantly reduced the survival of hippocampal neurons 24 hr after exposure (Fig. 9A). When the survival was compared with measures of the average [NO] over 20 min for each NO donor, a clear concentration-dependent toxicity was demonstrated, with 2 μm NO reducing survival by approximately one-third (Fig. 9B). SIN-1 produced toxicity despite its undetectable elevations of [NO]. The proportional decreases in survival for each NO donor were notably less than the relative decreases in ATP after 20 min (compare Figs. 9B and6C). Nevertheless, the cell death induced by the various donors correlated closely with the degree of energy depletion that they produced.
Fig. 9.
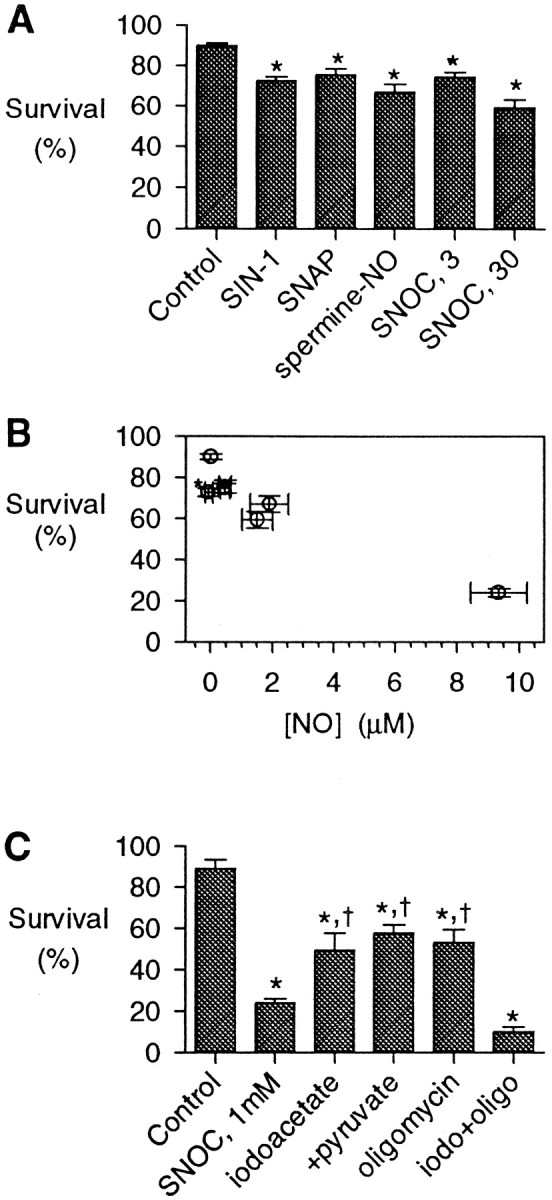
Neuronal survival after energy-depleting treatments. A, Neuronal survival was assayed 1 d after 20 min exposures to control buffer, SIN-1 (1 mm), SNAP (1 mm), spermine-NO (300 μm), or SNOC (3 or 30 μm). Each agent produced a modest decrease in survival (n = 4; *p < 0.05).B, The survival at 24 hr after exposure to each NO donor was correlated with the measured [NO] produced by each agent. SIN-1 (asterisk) was anomalous, producing toxicity without producing a measurable [NO] (see Table 1). C, Survival assayed 1 d after 20 min exposures to high [NO], ∼9 μm, from 1 mm SNOC as compared with metabolic inhibitors (mean ± SD; n = 4; *p < 0.05 compared with controls and†p < 0.05 compared with SNOC alone). The concentrations used were as above.
If the neurotoxicity of NO depends on the energy depletion it produces, then other agents that deplete energy (presumably without other actions specific to NO or peroxynitrite) also should produce similar neuronal death. Therefore, we also tested the delayed neuronal survival after 20 min treatments with saturating concentrations of inhibitors of energy production in comparison to that after treatment with a high level of NO (∼9 μm, from 1 mm SNOC). This concentration substantially decreased neuronal survival after 24 hr. In contrast, iodoacetate, iodoacetate/pyruvate, and oligomycin each produced substantially less toxicity, paralleling the lesser effects of these agents on energy depletion. Of note, the combination of iodoacetate and oligomycin, which causes complete energy depletion similar to that of 1 mm SNOC, produced as much toxicity at 24 hr, suggesting that the effects of NO on energy metabolism may be sufficient to explain the neurotoxicity it produces.
DISCUSSION
Many of the varied physiological roles of NO are mediated by cyclic GMP formation. In addition to the activation of soluble guanylate cyclase, NO is known to act on many other cellular sites by binding to heme and Fe-S centers (Butler et al., 1995),S-nitrosation of thiol proteins, and nitrotyrosine formation (Gross and Wolin, 1995). In addition, NO may produce oxidative damage, probably in large part via more reactive products such as peroxynitrite (ONOO−), irreversibly inactivating certain enzymes and producing DNA single-strand breaks (Nguyen et al., 1992). Of particular importance to the toxicity of NO is the activation of the energy-consuming and NAD-depleting enzyme PARP, activated by DNA strand breaks (Zhang et al., 1994). Although the neuronal toxicity of NO is clear, it is not known at which targets the primary attack of NO takes place, triggering eventual cell death. By studying the actions of exogenous NO on isolated neurons in culture, without the confounding effects of the elevations of intracellular Ca2+required to activate neuronal NOS, we have attempted to look at the earliest effects of NO directly in neurons, asking which mechanisms are most relevant to toxicity.
In the present study we have demonstrated that the application to cultured hippocampal neurons of toxic concentrations of NO results in mitochondrial depolarization and progressive ATP depletion. Remarkably, the ATP depletion after 20 min exposures to high NO concentrations is profound and substantially greater than that produced by inhibitors of mitochondrial energy production, suggesting that the energy-depleting action of NO is not confined to the inhibition of mitochondrial metabolism but also may involve the inhibition of glycolytic energy production.
To understand the pathophysiological relevance of these findings, it is essential to compare them with the range of the [NO] found in biological tissues. The maximal NO levels used in these experiments were high, ranging up to 10 μm (see Table 1). These high concentrations produced large depolarizations of mitochondria and near-complete depletions of energy stores after 20 min. However, lower [NO] from NO donors or from dissolved gaseous NO also produced mitochondrial depolarizations, and partial depletions of ATP were found with [NO] of <0.5 μm. How do these compare with physiological or pathophysiological NO concentrations? Resting levels of [NO] in tissue are thought to be in the low nanomolar range (Gross and Wolin, 1995). However, direct [NO] measurements in rabbit aortic wall by porphyrinic sensors recorded peak values of 1.3 μm at the endothelial surface and of 0.85 μm in the adjacent smooth muscle layer after stimulation with bradykinin (Malinski et al., 1993b). In a rat middle cerebral artery occlusion model of stroke, using microdialysis techniques, peak tissue [NO] was found to be 1.3–4 μm within 3–24 min of the onset of ischemia (Malinski et al., 1993a). Even higher [NO] values averaging 11 μm were estimated in complete forebrain ischemia (Tominaga et al., 1994). These concentrations of NO, reported in vascular wall and in ischemic brain, correspond to values that produce partial mitochondrial depolarizations and severe derangements of energy metabolism in the present experiments. Thus, the effects reported here of NO on the metabolism of neurons are likely to be quite relevant to diseases involving large increases in tissue [NO], such as stroke, and possibly even to local effects of physiological NO release.
The effect of temperature must be considered in the interpretation of the present experiments. Physiological experiments studying mitochondrial membrane potential were performed at room temperature, whereas the exposures for the reported ATP and survival assays generally were performed at 37°C. However, in separate experiments there were no significant differences in the ATP depletion by SNOC exposure at room temperature when compared with those at 37°C (data not shown). Furthermore, the exposures to NO dissolved from gas were done at 22°C, and they produced ATP depletions in line with those from chemical NO donors at 37°C. Thus the differences in temperature do not alter the large effect of NO on energy metabolism substantially.
In these experiments SIN-1 produced no measurable NO accumulation. Nevertheless, it produced partial energy depletion at 20 min and neuronal death at 24 hr, consistent with its well established neuronal toxicity (Lipton et al., 1993; Bolaños et al., 1995; Brorson and Zhang, 1997). Parallel production of O2•− from SIN-1 is likely to allow the very rapid conversion of NO to ONOO−, preventing any measurement of [NO]. ONOO− also is reported to inhibit enzymes of oxidative phosphorylation in isolated mitochondria or submitochondrial particles (Cassina and Radi, 1996;Lizasoain et al., 1996), yet SIN-1 failed to cause measurable mitochondrial depolarization. It may be that extracellular ONOO−, although highly injurious to neurons because of actions on the cellular surface, does not affect mitochondria directly because the access of this highly reactive anion to intracellular organelles is limited. In contrast, NO is known to permeate cell membranes readily so that it can reach the mitochondria. The present experiments with exogenous NO do not define whether the actual intracellular toxic agent is NO or ONOO−. This issue is difficult to settle in intact neurons, because manipulations to alter O2•− levels, such as by administration of SOD, are limited to the extracellular space. However, one of the primary sites for O2•− production is likely to be at the mitochondrial membrane itself as a byproduct of oxidative phosphorylation (Bindokas et al., 1996), so that NO may form ONOO− intracellularly. Locally produced ONOO− would be predicted to exert a potent inhibitory effect on mitochondria. Indeed, the effects of ONOO− have been said to be less reversible than those of NO, so that the measured change in Δψm in the short-term experiments may be attributable mainly to rapid reversible cytochrome c oxidase inhibition by NO (Lizasoain et al., 1996), whereas irreversible damage by ONOO− may occur more slowly but may accumulate over extended exposures.
Is ATP depletion caused by decreased production or increased consumption?
The present studies demonstrate the occurrence of rapid mitochondrial depolarization by NO in hippocampal neurons. Energy depletion soon follows, and the facile conclusion is that decreased production of ATP is entirely responsible. However, NO also may increase ATP hydrolysis by the cell, particularly by activation of PARP (Zhang et al., 1994). To what extent is the early ATP depletion produced by NO a result of increased consumption? During the immediate 20 min exposure period the energy depletion produced by NO was reduced only slightly by the PARP inhibitor benzamide (see Fig. 5D) so that PARP activation alone accounted for little of the ATP depletion. Further, the mitochondrial depolarization produced by NO was not blocked by oligomycin, showing that one of the primary events leading to mitochondrial rundown was not a large increase in energy consumption beyond mitochondrial capacity. Instead, it appears that inhibition by NO is the predominant effect on mitochondria early in exposure. However, at lower concentrations of NO, increased consumption might combine with partially decreased energy production to produce energy failure. Furthermore, in the period after treatment, PARP activation appears to play a major role in the prolonged energy depletion that occurs, in that the late energy depletion can be blocked mainly by benzamide.
Potential sites at which NO may inhibit ATP production
These experiments directly demonstrate the effect of NO exposure on mitochondrial membrane potential. Although the depolarization produced by NO appears to be incomplete as compared with that produced by CCCP, the degree of impairment of oxidative phosphorylation may be underestimated by this method. Inhibition of electron transport may depolarize the mitochondrial membrane only to the point at which turnover of the ATP synthase slows to a halt, stopping the drain of the proton gradient. During the first several minutes cellular ATP stores may remain high enough that they contribute to maintaining the Δψm at this level by driving the ATP synthase in reverse. Thus the mitochondria themselves might be consuming cytosolic ATP stores as a secondary effect (Budd and Nicholls, 1996). Inhibition of ATP production by NO might be complete although the mitochondrial membrane depolarization is only partial.
Previous work has demonstrated the suppression of mitochondrial respiration by NO. In hepatocytes NO was reported to inhibit complexes I and II and, most sensitively, mitochondrial aconitase, an enzyme of the tricarboxylic acid cycle (Stadler et al., 1991). Studies of isolated mitochondrial preparations have suggested that NO reversibly inhibits cytochrome c oxidase (complex IV) of the electron transport chain (Cassina and Radi, 1996; Lizasoain et al., 1996), ascribing the irreversible inhibition of complexes I and II to peroxynitrite. In addition, peroxynitrite impairs the action of the mitochondrial ATP synthase (Radi et al., 1994; Cassina and Radi, 1996). Thus NO or ONOO− might be acting at the entry points of electron transport, at multiple points along the chain, and at the ATP synthase. Nevertheless, the inhibition of mitochondria alone appears to be insufficient to explain the severe depletion of energy production by higher levels of NO, suggesting that the inhibition of glycolysis must be occurring also.
How might NO affect glycolysis to produce the profound energy depletion reported here? The most likely target is the glyceraldehyde-3-phosphate dehydrogenase complex, which is inhibited by NO (Molina y Vedia et al., 1992). The present experiments imply that the threshold for the inhibition of mitochondrial energy production is lower than that for the inhibition of glycolysis; however, at higher levels of NO exposure, severe depletion of neuronal energy stores occurs as the result of the simultaneous inhibition of glycolysis. A similar conclusion was reached in a study of brain synaptosomes exposed to NO in which lower concentrations inhibited oxidative metabolism, but higher concentrations inhibited anaerobic metabolism as well (Erecinska et al., 1995).
The traditional emphasis of the dependence of neurons on aerobic metabolism stems from experiments clearly demonstrating the vulnerability of the brain to hypoxia (Siesjö and Wieloch, 1985). However, this vulnerability results in part from the effects of lactic acidosis, which develops in tissue under hypoxic conditions (Kraig et al., 1987; Tombaugh and Sapolsky, 1990). In vitro, where pH can be controlled independently, neurons have been found to survive hours of exposure to hypoxia alone, in contrast to their exquisite sensitivity to combined glucose and oxygen deprivation (Goldberg et al., 1987; Goldberg and Choi, 1993). Few studies have looked directly at energy stores in isolated neurons, but recent work in cerebellar granule cells has confirmed that glycolysis alone can maintain energy charge for 10 min (Budd and Nicholls, 1996). Thus perhaps it should come as no surprise that, to disrupt neuronal energy production severely, NO must affect both glycolysis and mitochondria.
Relevance to neurological disease processes
If energy depletion by NO is relevant to its toxicity, why did lower [NO], here found sufficient to produce substantial energy depletion, produce relatively small decreases in neuronal survival at 24 hr? It may be that only the more severe insults produce rapid neuronal death via necrosis (Bonfoco et al., 1995). Partial energy depletion may trigger apoptosis, and it is possible that low-level exposures to NO, although not producing substantial cell death at the 24 hr time point, might initiate apoptotic pathways leading to a more delayed neuronal death. Ongoing experiments aim to test this hypothesis. High NO levels producing rapid neuronal death via severe mitochondrial dysfunction are likely to be more relevant to acute damage to the brain in processes like ischemia (Bolaños et al., 1998), whereas lower [NO] might cause slower and more subtle damage in the brain by effects on neuronal mitochondrial function. Some evidence for the involvement of NO has been offered in diseases in which neuronal damage takes place over many years, including Alzheimer’s disease (Good et al., 1996) and amyotrophic lateral sclerosis (Beal et al., 1997). “Slow excitotoxicity” has been postulated to occur in chronic neurological conditions whereby the combination of underlying defects in energy metabolism in neurons, combined with the stress of ongoing glutamate receptor activation, gradually produces neuronal damage or death (Albin and Greenamyre, 1992; Beal, 1995). The sensitive effects of NO on neuronal energy metabolism might contribute to such neurodegenerative processes.
Footnotes
This work was supported by Grant NS01630 from National Institutes of Health to J.R.B. and by the support of the Brain Research Foundation to H.Z. and J.R.B. We thank Arush Angirasa for technical assistance in performing the neuronal cultures, toxicity assays, and ATP-luciferase assays and William Thistlethwaite for assistance in measuring NO concentrations.
Correspondence should be addressed to Dr. James R. Brorson, Department of Neurology, MC2030, The University of Chicago, 5841 South Maryland Avenue, Chicago, IL 60637.
Dr. Zhang’s present address: Department of Neurosurgery, The University of Mississippi Medical Center, 2500 North State Street, Jackson, MS 39216.
REFERENCES
- 1.Akaike T, Yoshida M, Miyamoto Y, Sato K, Kohno M, Sasamoto K, Miyazaki K, Ueda S, Maesa H. Antagonistic action of imidazolineoxyl N-oxides against endothelium-derived relaxing factor/NO through a radical reaction. Biochemistry. 1993;32:827–832. doi: 10.1021/bi00054a013. [DOI] [PubMed] [Google Scholar]
- 2.Albin RL, Greenamyre JT. Alternative excitotoxic hypotheses. Neurology. 1992;42:733–738. doi: 10.1212/wnl.42.4.733. [DOI] [PubMed] [Google Scholar]
- 3.Almeida A, Heales SJR, Bolaños JP, Medina JM. Glutamate neurotoxicity is associated with nitric oxide-mediated mitochondrial dysfunction and glutathione depletion. Brain Res. 1998;790:209–216. doi: 10.1016/s0006-8993(98)00064-x. [DOI] [PubMed] [Google Scholar]
- 4.Beal MF. Aging, energy, and oxidative stress in neurodegenerative diseases. Ann Neurol. 1995;38:357–366. doi: 10.1002/ana.410380304. [DOI] [PubMed] [Google Scholar]
- 5.Beal MF, Ferrante RJ, Browne SE, Matthews RT, Kowall NW, Brown RH. Increased 3-nitrotyrosine in both sporadic and familial amyotrophic lateral sclerosis. Ann Neurol. 1997;42:646–654. doi: 10.1002/ana.410420416. [DOI] [PubMed] [Google Scholar]
- 6.Bindokas VP, Jordan J, Lee CC, Miller RJ. Superoxide production in rat hippocampal neurons: selective imaging with hydroethidine. J Neurosci. 1996;16:1324–1336. doi: 10.1523/JNEUROSCI.16-04-01324.1996. [DOI] [PMC free article] [PubMed] [Google Scholar]
- 7.Bolaños JP, Heales SJR, Land JM, Clark JB. Effect of peroxynitrite on the mitochondrial respiratory chain: differential susceptibility of neurones and astrocytes in primary culture. J Neurochem. 1995;64:1965–1972. doi: 10.1046/j.1471-4159.1995.64051965.x. [DOI] [PubMed] [Google Scholar]
- 8.Bolaños JP, Almeida A, Medina JM. Nitric oxide mediates brain mitochondrial damage during perinatal anoxia. Brain Res. 1998;787:117–122. doi: 10.1016/s0006-8993(97)01530-8. [DOI] [PubMed] [Google Scholar]
- 9.Bonfoco E, Krainc D, Ankarcrona M, Nicotera P, Lipton SA. Apoptosis and necrosis: two distinct events induced, respectively, by mild and intense insults with N-methyl-d-aspartate or nitric oxide/superoxide in cortical cell cultures. Proc Natl Acad Sci USA. 1995;92:7162–7166. doi: 10.1073/pnas.92.16.7162. [DOI] [PMC free article] [PubMed] [Google Scholar]
- 10.Brorson JR, Zhang H. Disrupted [Ca2+]i homeostasis contributes to the toxicity of nitric oxide in cultured hippocampal neurons. J Neurochem. 1997;69:1882–1889. doi: 10.1046/j.1471-4159.1997.69051882.x. [DOI] [PubMed] [Google Scholar]
- 11.Brorson JR, Sulit RA, Zhang H. Nitric oxide disrupts Ca2+ homeostasis in hippocampal neurons. J Neurochem. 1997;68:95–105. doi: 10.1046/j.1471-4159.1997.68010095.x. [DOI] [PubMed] [Google Scholar]
- 12.Budd SL, Nicholls DG. A reevaluation of the role of mitochondria in neuronal Ca2+ homeostasis. J Neurochem. 1996;66:403–411. doi: 10.1046/j.1471-4159.1996.66010403.x. [DOI] [PubMed] [Google Scholar]
- 13.Butler AR, Flitney FW, Williams DLH. NO, nitrosonium ions, nitroxide ions, nitrosothiols, and iron nitrosyls in biology: a chemist’s perspective. Trends Pharmacol Sci. 1995;16:18–22. doi: 10.1016/s0165-6147(00)88968-3. [DOI] [PubMed] [Google Scholar]
- 14.Cassina A, Radi R. Differential inhibitory action of nitric oxide and peroxynitrite on mitochondrial electron transport. Arch Biochem Biophys. 1996;328:309–316. doi: 10.1006/abbi.1996.0178. [DOI] [PubMed] [Google Scholar]
- 15.Duchen MR. Ca2+-dependent changes in the mitochondrial energetics in single dissociated mouse sensory neurons. Biochem J. 1992;283:41–50. doi: 10.1042/bj2830041. [DOI] [PMC free article] [PubMed] [Google Scholar]
- 16.Erecinska M, Nelson D, Vanderkooi JM. Effects of NO-generating compounds on synaptosomal energy metabolism. J Neurochem. 1995;65:2699–2705. doi: 10.1046/j.1471-4159.1995.65062699.x. [DOI] [PubMed] [Google Scholar]
- 17.Goldberg MP, Choi DW. Combined oxygen and glucose deprivation in cortical cell culture: calcium-dependent and calcium-independent mechanisms of neuronal injury. J Neurosci. 1993;13:3510–3524. doi: 10.1523/JNEUROSCI.13-08-03510.1993. [DOI] [PMC free article] [PubMed] [Google Scholar]
- 18.Goldberg MP, Weiss JW, Pham PC, Choi DW. N-methyl-d-aspartate receptors mediate hypoxic neuronal injury in cortical cultures. J Pharmacol Exp Ther. 1987;243:784–791. [PubMed] [Google Scholar]
- 19.Good PF, Werner P, Hsu A, Olanow CW, Perl DP. Evidence for neuronal oxidative damage in Alzheimer’s disease. Am J Pathol. 1996;149:21–28. [PMC free article] [PubMed] [Google Scholar]
- 20.Gross SS, Wolin MS. Nitric oxide: pathophysiological mechanisms. Annu Rev Physiol. 1995;57:737–769. doi: 10.1146/annurev.ph.57.030195.003513. [DOI] [PubMed] [Google Scholar]
- 21.Iadecola C. Bright and dark sides of nitric oxide in ischemic brain injury. Trends Neurosci. 1997;20:132–139. doi: 10.1016/s0166-2236(96)10074-6. [DOI] [PubMed] [Google Scholar]
- 22.Kraig RP, Petito CK, Plum F, Pulsinelli WA. Hydrogen ions kill brain at concentrations reached in ischemia. J Cereb Blood Flow Metab. 1987;7:379–386. doi: 10.1038/jcbfm.1987.80. [DOI] [PMC free article] [PubMed] [Google Scholar]
- 23.Lipton SA, Choi Y-B, Pan Z-H, Lei SZ, Chen H-SV, Sucher NJ, Loscalzo J, Singel DJ, Stamler JS. A redox-based mechanism for the neuroprotective and neurodestructive effects of nitric oxide and related nitroso-compounds. Nature. 1993;364:626–632. doi: 10.1038/364626a0. [DOI] [PubMed] [Google Scholar]
- 24.Lizasoain U, Moro MA, Knowles RG, Darley-Usmar V, Moncada S. Nitric oxide and peroxynitrite exert distinct effects on mitochondrial respiration which are differentially blocked by glutathione or glucose. Biochem J. 1996;314:877–880. doi: 10.1042/bj3140877. [DOI] [PMC free article] [PubMed] [Google Scholar]
- 25.Malinski T, Bailey F, Zhang ZG, Chopp M. Nitric oxide measured by a porphyrinic microsensor in rat brain after transient middle cerebral artery occlusion. J Cereb Blood Flow Metab. 1993a;13:355–358. doi: 10.1038/jcbfm.1993.48. [DOI] [PubMed] [Google Scholar]
- 26.Malinski T, Taha Z, Grunfeld S, Patton S, Kapturczak M, Tomboulian P. Diffusion of nitric oxide in the aorta wall monitored in situ by porphyrinic microsensors. Biochem Biophys Res Commun. 1993b;193:1076–1082. doi: 10.1006/bbrc.1993.1735. [DOI] [PubMed] [Google Scholar]
- 27.Molina y Vedia L, McDonald B, Reep B, Brune B, DiSilvio M, Billiar TR, Lapetina EG. Nitric oxide-induced S-nitrosylation of glyceraldehyde-3-phosphate dehydrogenase inhibits enzymatic activity and increases endogenous ADP-ribosylation. J Biol Chem. 1992;267:24929–24932. [PubMed] [Google Scholar]
- 28.Nguyen T, Brunson D, Crespi CL, Penman BW, Wishnok JS, Tannenbaum SR. DNA damage and mutation in human cells exposed to nitric oxide in vitro. Proc Natl Acad Sci USA. 1992;89:3030–3034. doi: 10.1073/pnas.89.7.3030. [DOI] [PMC free article] [PubMed] [Google Scholar]
- 29.Pang Z, Geddes JW. Mechanisms of cell death induced by the mitochondrial toxin 3-nitropropionic acid: acute excitotoxic necrosis and delayed apoptosis. J Neurosci. 1997;17:3064–3073. doi: 10.1523/JNEUROSCI.17-09-03064.1997. [DOI] [PMC free article] [PubMed] [Google Scholar]
- 30.Radi R, Rodriguez M, Castro L, Telleri R. Inhibition of mitochondrial electron transport by peroxynitrite. Arch Biochem Biophys. 1994;308:89–95. doi: 10.1006/abbi.1994.1013. [DOI] [PubMed] [Google Scholar]
- 31.Sabri MI, Ochs S. Inhibition of glyceraldehyde-3-phosphate dehydrogenase in mammalian nerve by iodoacetic acid. J Neurochem. 1971;18:1509–1514. doi: 10.1111/j.1471-4159.1971.tb00013.x. [DOI] [PubMed] [Google Scholar]
- 32.Siesjö BK. Brain energy metabolism. Wiley; New York: 1978. [Google Scholar]
- 33.Siesjö BK, Wieloch T. Cerebral metabolism in ischaemia: neurochemical basis for therapy. Br J Anaesth. 1985;57:47–62. doi: 10.1093/bja/57.1.47. [DOI] [PubMed] [Google Scholar]
- 34.Stadler J, Billiar TR, Curran RD, Stuehr DJ, Ochoa JB, Simmons RL. Effect of exogenous and endogenous nitric oxide on mitochondrial respiration of rat hepatocytes. Am J Physiol. 1991;260:C910–C916. doi: 10.1152/ajpcell.1991.260.5.C910. [DOI] [PubMed] [Google Scholar]
- 35.Tombaugh GC, Sapolsky RM. Mechanistic distinctions between excitotoxic and acidotic hippocampal damage in an in vitro model of ischemia. J Cereb Blood Flow Metab. 1990;10:527–535. doi: 10.1038/jcbfm.1990.94. [DOI] [PubMed] [Google Scholar]
- 36.Tominaga T, Sato S, Ohnishi T, Ohnishi ST. Electron paramagnetic resonance (EPR) detection of nitric oxide produced during forebrain ischemia of the rat. J Cereb Blood Flow Metab. 1994;14:715–722. doi: 10.1038/jcbfm.1994.92. [DOI] [PubMed] [Google Scholar]
- 37.Williams RJ, Maus M, Stella N, Glowinski J, Premont J. Reduced glucose metabolism enhances the glutamate-evoked release of arachidonic acid from striatal neurons. Neuroscience. 1996;74:461–468. doi: 10.1016/0306-4522(96)00195-9. [DOI] [PubMed] [Google Scholar]
- 38.Zhang J, Dawson VL, Dawson TM, Snyder SH. Nitric oxide activation of poly(ADP-ribose) synthetase in neurotoxicity. Science. 1994;263:687–689. doi: 10.1126/science.8080500. [DOI] [PubMed] [Google Scholar]