

Abstract
The suprachiasmatic nucleus (SCN) harbors an endogenous oscillator generating circadian rhythms that are synchronized to the external light/dark cycle by photic information transmitted via the retinohypothalamic tract (RHT). The RHT has recently been shown to contain pituitary adenylate cyclase-activating polypeptide (PACAP) as neurotransmitter/neuromodulator. PACAPergic effects on cAMP-mediated signaling events in the SCN are restricted to distinct time windows and sensitive to melatonin. In neurons isolated from the SCN of neonatal rats we investigated by means of the fura-2 technique whether PACAP and melatonin also influence the intracellular calcium concentration ([Ca2+]i). PACAP elicited increases of [Ca2+]i in 27% of the analyzed neurons, many of which were also responsive to the RHT neurotransmitters glutamate and/or substance P. PACAP-induced changes of [Ca2+]i were independent of cAMP, because they were not mimicked by forskolin or 8-bromo-cAMP. PACAP caused G-protein- and phospholipase C-mediated calcium release from inositol-trisphosphate-sensitive stores and subsequent protein kinase C-mediated calcium influx, demonstrated by treatment with GDP-β-S, neomycin, U-73122, calcium-free saline, thapsigargin, bisindolylmaleimide, and chelerythrine. The calcium influx was insensitive to antagonists of voltage-gated calcium channels of the L-, N-, P-, Q- and T-type (diltiazem, nifedipine, verapamil, ω-conotoxin, ω-agatoxin, amiloride). Immunocytochemical characterization of the analyzed cells revealed that >50% of the PACAP-sensitive neurons were GABA-immunopositive. Our data demonstrate that in the SCN PACAP affects the [Ca2+]i, suggesting that different signaling pathways (calcium as well as cAMP) are involved in PACAPergic neurotransmission or neuromodulation. Melatonin did not interfere with calcium signaling, indicating that in SCN neurons the hormone primarily affects the cAMP signaling pathway.
Keywords: PACAP, substance P, glutamate, retinohypothalamic tract, suprachiasmatic nucleus, melatonin, circadian rhythm, calcium, phospholipase C, protein kinase C, GABA
The hypothalamic suprachiasmatic nucleus (SCN) of mammals is the primary endogenous oscillator generating circadian rhythms that are synchronized with the environmental light/dark cycle by photic information directly transmitted from the retina via the retinohypothalamic tract (RHT). This photic input is the major natural phase-shifting stimulus (zeitgeber) that regularly resets the clock. The amino acid glutamate and the neuropeptide substance P (SP) are neurotransmitters/neuromodulators of the RHT that convey light information to the oscillator and thus produce phase-shifts of SCN activity during the night (for review, see Inouye and Shibata, 1994). In contrast, pituitary adenylate cyclase-activating polypeptide (PACAP), recently proposed as another neuromodulator of the RHT, induces phase-shifts during the daytime, probably mediated via PACAP-induced phosphorylation/activation of the transcription factor calcium/cAMP response element binding protein (CREB), a putative mediator between light (or darkness) information and phase-shifting of SCN activity rhythms. Thus, PACAPergic neurotransmission to the SCN may encode darkness information (Fukuhara et al., 1997; Hannibal et al., 1997; Kopp et al., 1997).
PACAP binding sites have been divided into different types based on the relative affinities for PACAP and vasoactive intestinal polypeptide (VIP), which shows 68% amino acid identity with the (1–28)N-terminal sequence of PACAP. PACAP type II receptors bind PACAP and VIP with equal affinity and are coupled to adenylate cyclase (AC) activity (Ishihara et al., 1992; Lutz et al., 1993), whereas type I receptors specifically bind to PACAP and exist in at least seven splice variants. These receptor isoforms are coupled to phospholipase C (PLC) and/or AC activity, with the exception of one isoform that is coupled to activation of voltage-gated calcium channels (Spengler et al., 1993;Chatterjee et al., 1996; Pantaloni et al., 1996). Furthermore, a third PACAP receptor subtype has been cloned that binds to both PACAP and VIP with high affinity and is coupled to AC and (probably) PLC activation (Inagaki et al., 1994).
The hormone melatonin, which is synthesized in and released from the pineal organ during the night and thus serves as an endocrine signal of darkness, is another time cue acting on the SCN. Melatonin elicits its effects via binding to mt1 and MT2 receptors that are coupled to inhibition of the AC (Reppert et al., 1994; Liu et al., 1997). In addition, recent reports demonstrated that melatonin also activates the calcium signaling pathway and thus affects PLC and protein kinase C (PKC) activity (Godson and Reppert, 1997; McArthur et al., 1997). Furthermore, in hypophysial gonadotrophs, melatonin has been shown to have a direct influence on the intracellular calcium concentration ([Ca2+]i) by inhibition of calcium influx through voltage-sensitive channels (Vanecek and Klein, 1992, 1995).
In the SCN the PACAP-induced activation of CREB, solely inducible at distinct time windows, is sensitive to melatonin (Kopp et al., 1997). In the present study we investigated the effects of PACAP and melatonin on the calcium signal transduction cascade in SCN cells isolated from neonatal rats to give further insight into the signaling events affected by these phase-entraining substances in the biological clock.
MATERIALS AND METHODS
Cell culture. Wistar rats (Charles River, Sulzfeld, Germany) were maintained in our rat colony under a 12 hr light/dark cycle with food and water ad libitum. Newborn male and female rats (1–7 d old) were killed by decapitation during the light period, and the area of the SCN was punched out of hypothalamic brain slices. The SCN was identified macroscopically by its position at the ventral surface of the hypothalamus, extending laterally to the third ventricle and directly dorsally to the optic chiasm. The tissue was transferred immediately to ice-cold Earle’s Balanced Salt Solution (EBSS) containing 10 mm HEPES and 7 mg/ml glucose. The cells were dissociated by incubation in a papain digestion solution (EBSS containing 10 mm HEPES, 7 mg/ml glucose, 5 mm EDTA, 1 mml-cysteine, and 20 U/ml papain) and repetitive pipetting. After complete dissociation the cells were pelleted by centrifugation, and the papain solution was removed. The cells were resuspended in EBSS containing 10 mm HEPES, 7 mg/ml glucose, 0.01% trypsin inhibitor, and 0.1% bovine serum albumin (BSA) and overlaid on an EBSS gradient solution (EBSS containing 10 mm HEPES, 7 mg/ml glucose, 0.1% trypsin inhibitor, and 1% BSA). After a second centrifugation the cells were washed in DMEM/Nutrient Mix F12 (DMEM/F12) supplemented with 10 mm HEPES, 2 mm glutamine, 100 U/ml penicillin, 100 μg/ml streptomycin, 100 μg/ml ascorbic acid, and 10% fetal calf serum and finally plated onto poly-l-lysine-coated coverslips with an internal grid. Cultures were maintained in supplemented DMEM/F12 in an incubator at 37°C in an atmosphere of 7% CO2 and 93% air and cultured for at least 5 d before the experiments.
Fluorescence microscopy and calcium imaging. For dye loading, cells were incubated for 30 min at 37°C in artificial CSF (aCSF) containing (in mm): NaCl 140, KCl 5, CaCl2 2, MgCl2 1, HEPES 10, and glucose 5 that contained 3 μm fura-2 AM, the fluorescent calcium indicator (Molecular Probes, Eugene, OR). Thereafter the coverslips were mounted in a specially constructed superfusion chamber on the heatable stage of a microscope (Axiovert 100; Zeiss, Jena-Göttingen, Germany) and superfused with aCSF for 10 min before drug application at a constant temperature of 37°C and at a flow rate of 500 μl/min. All experiments were performed between 10 A.M. and 10 P.M., except the measurements after long-time treatment with PACAP, which were performed during a 24 hr period from 9 A.M. to 9 A.M. Application of the drugs was performed by stopping the superfusion and adding the drugs with a Pasteur pipette directly into the superfusion chamber.
PACAP exists in two isoforms, PACAP38 and PACAP27, which share the same N-terminal 27 amino acids and arise from a 175 amino acid precursor peptide by tissue-specific post-translational processing (Miyata et al., 1989, 1990). Because PACAP38 appears as the predominant product of this processing of the PACAP precursor in the hypothalamus (Arimura et al., 1991; Hannibal et al., 1995), we focused on this isoform of the peptide. In most of the experiments PACAP was used at a concentration of 100 nm. The inhibitors of G-protein, PLC, PKC, and voltage-gated calcium channels, respectively, were applied for 3–10 min before stimulation with PACAP; pretreatment with melatonin extended over a period of 5–30 min before PACAP application. All drugs tested were stored as stock solutions at −20°C and diluted with prewarmed aCSF immediately before use. The drugs were washed out by starting the perfusion again, and complete washout of the chamber was achieved within 30 sec.
For the analysis of intracellular calcium concentrations, an Attofluor Ratio Imaging system (Atto Instruments, Rockville, MD) was used. Excitation light was provided by a mercury lamp (HBO 103 W/2; Osram, Berlin-München, Germany); excitation wavelengths of 334 and 380 nm were selected by different interference filters mounted on a computer-controlled filter changer. Exposure times were controlled by a shutter between the filter changer and a neutral density filter that was used in conjunction with manual gain setting to obtain approximately equal fluorescence intensities at the two different excitation wavelengths. Fluorescence light was collected by an Achrostigmat 40× oil-immersion objective (Zeiss), passed through a dichroic mirror (395 nm) and an emission filter (500–530 nm), and finally transmitted to a CCD camera with a photomultiplier. A personal computer with appropriate software (Attofluor Ratio Vision, Atto Instruments) was used to control the optic equipment and to record, analyze, and store the images and data.
In some experiments ratio data of the emission intensities at 334 and 380 nm were converted to approximate calcium concentrations as described previously (Grynkiewicz et al., 1985; Schomerus et al., 1995). However, this calibration procedure is an approximation, and the methods for calibrating emission ratios make many assumptions that cannot be readily tested experimentally (Leong, 1989; D’Souza and Dryer, 1994). Thus, most of the data in this study are presented in a semiquantitative manner as 334 nm/380 nm emission ratios instead of as intracellular calcium concentrations. In SCN neurons, PACAP elicited changes in [Ca2+]i with a broad variety (enhancement of [Ca2+]ifrom basal concentrations of ∼100 nm to peak concentrations ranging from 700 nm to 3.5 μm), and PACAP stimulation led to a long-lasting refractory time. Therefore, we defined for the experiments with G-protein or PLC inhibitors a threshold to identify the cells, which were responding to PACAP after specific inhibition of signal transduction cascade components. An increase of basal ratio values by a value of 0.15 was sufficient to declare this cell to be a responder. Statistical analysis was performed using unpaired Student’st test. Values were considered significantly different withp < 0.05.
Immunocytochemistry. The cell culture was characterized by immunocytochemical identification of glial as well as neuronal antigens and the demonstration of neurotransmitters known to be present in the SCN. Furthermore, in a subset of experiments, the cells, which were initially analyzed with the fura-2 technique, were subsequently characterized by immunocytochemical demonstration of GABA. Cells were fixed with 4% paraformaldehyde or 4% paraformaldehyde plus 0.5% glutaraldehyde in PBS, respectively, for 30 min. The cells were then thoroughly washed with PBS and preincubated for 30 min with PBS containing 0.3% Triton X-100 and 10% normal goat serum to reduce nonspecific staining. Blocking solution was replaced with the primary antibody solution [glial fibrillary acidic protein (GFAP) 1:1000 (Dako, Hamburg, Germany), microtubule-associated protein 2 (MAP2) 1:200 (ICN, Eschwege, Germany), GABA 1:250 (Sigma, Deisenhofen, Germany), arginine vasopressin (AVP) 1:200 (gift from Dr. F. Nürnberger, Dr. Senckenbergische Anatomie, Frankfurt, Germany), VIP 1:200 (Genosys, Cambridge, UK), gastrin-releasing peptide (GRP) 1:200 (Affiniti, Nottingham, UK), somatostatin (SOM) 1:200 (UCB, Brussels, Belgium) in PBS containing 0.3% Triton X-100, 1% BSA], and the cells were incubated overnight at room temperature (RT). Coverslips were then washed with PBS, and the secondary antibody solution [Cy3-conjugated goat anti-rabbit/mouse IgG 1:250–1:500 (Dianova, Hamburg, Germany), dichlorotriazinyl aminofluorescein-conjugated goat anti-rabbit IgG 1:50 (Dianova), FITC-conjugated goat anti-mouse IgG 1:30 (Sigma) in PBS containing 0.3% Triton X-100, 1% BSA] was added for 90 min at RT. The coverslips were finally mounted onto glass slides using fluorescence mounting medium (Dako).
Confocal laser microscopy. To characterize immunocytochemically the cells initially analyzed with the fura-2 technique as GABA-immunopositive or -negative neurons, a Zeiss LSM 510 confocal imaging system equipped with an argon laser and an inverse Axiovert 100 Zeiss microscope were used. Immunocytochemistry was performed with the fluorescent dye FITC-conjugated goat anti-mouse IgG as the second antibody to avoid extensive nonspecific staining of the layer of glial cells, usually elicited by chromogenes such as diaminobenzidine, and thus to allow re-identification of the coordinate system etched onto the coverslip. Monochromatic light at 488 nm was used to excite the FITC fluorophore using a dichroic beam splitter (FT 488) and an emission bandpass filter (BP 505–530), and also to generate transmission images. The images were stored for further analysis as digitized images with an eight-bit resolution (1024 × 1024 pixel).
Autoradiographic detection of 2-[125I]-iodomelatonin binding sites. Newborn Wistar rats (1–7 d old) were killed by decapitation, and the brains were frozen in 2-methylbutane (−20°C). Serial coronal sections including the SCN (16 μm thick) were cut using a cryostat and mounted on gelatin-coated slides. In vitro autoradiography was performed using one set of sections to determine total binding and a second set to determine nonspecific binding. Slides were preincubated in PBS containing 0.01% BSA for 1 hr at RT to remove endogenous ligand. Thereafter they were incubated with 50 pm2-[125I]-iodomelatonin (specific activity: 2200 Ci/mmol) in PBS/BSA without (total binding) or with (nonspecific binding) 1 μm melatonin for 1 hr at RT. After washing in ice-cold buffer (1 × 15 min in PBS/BSA + 1 × 15 min in PBS), sections were air-dried and exposed to x-ray film (Kodak, Stuttgart, Germany) for 3 weeks.
Materials. Drugs and chemicals were obtained from the following sources: NaCl, KCl, CaCl2, MgCl2, KH2PO4, Na2HPO4, Triton X-100, glucose, EGTA (Merck, Darmstadt, Germany); EBSS, DMEM/F12, fetal calf serum, penicillin/streptomycin, glutamine, HEPES (Life Technologies, Eggenstein, Germany); papain (Boehringer Mannheim, Mannheim, Germany); PACAP38, ionomycin, tetrodotoxin (TTX), forskolin, thapsigargin, GDP-β-S, U-73122, U-73343, bisindolylmaleimide I, chelerythrine, ω-agatoxin IVA, ω-conotoxin GVIA, melatonin (Calbiochem-Novabiochem, Bad Soden, Germany); 8-bromo-cAMP (8-Br-cAMP) (BioLog, Bremen, Germany); PACAP38 (Bachem, Heidelberg, Germany); SP, VIP (Peninsula, Belmont, CA); 2-[125I]-iodomelatonin (DuPont NEN, Boston, MA); all other drugs and chemicals were obtained from Sigma. Coverslips with a coordinate system that was etched onto the glass were obtained from Eppendorf (Hamburg, Germany).
RESULTS
Characterization of the dissociated and cultured cells
After 4–10 d in culture, cells dissociated from the hypothalamus of neonatal rats were characterized by immunocytochemical demonstration of specific antigens to determine the amount of SCN cells in our primary cell cultures. Neurons, identified by MAP2-immunoreactivity (Fig. 1C), rested on a layer of GFAP-immunopositive astrocytes (Fig. 1A,B). Astrocytes were initially rare but multiplied and flattened during the following days, achieving confluence after ∼4 d in culture. Neurons were further characterized by immunolabeling for GABA, AVP, VIP, GRP, and SOM (Fig. 1D–H). GABA is the predominant neurotransmitter of SCN neurons, whereas the neuropeptides delineate distinct neuronal subpopulations within the SCN (van den Pol and Tsujimoto, 1985). Immunocytochemical demonstration of GABA revealed that the majority of neurons in the cell culture were GABAergic (∼70%); AVP and VIP were detectable in ∼5–10% and GRP and SOM were detectable in ∼2% of the neurons. The number of the immunocytochemically identified cells varied between the preparations (n = 9), but the relative proportions of GABA, AVP, VIP, GRP, and SOM cells were similar to those found in the SCN in vivo, indicating that representative subsets of SCN neurons remained viable in culture (also see Welsh et al., 1995).
Fig. 1.

Immunocytochemical characterization of dissociated rat SCN cells after 4–10 d in culture. Neurons identified by the expression of MAP2 (C) rested on a layer of GFAP-immunopositive glial cells, which could be distinguished in flat (type-1-like) (A) and process-bearing (type-2-like) (B) astrocytes. Furthermore, different neurotransmitters that are typical for SCN neurons were immunodetected: GABA (D), AVP (E), GRP (F), SOM (G), and VIP (H). Most of the neurons in our cell culture were GABAergic (∼70%); ∼5–10% of the neurons expressed AVP or VIP, respectively, and ∼2% of the neurons showed GRP- or SOM-immunoreactivity. Scale bars, 10 μm.
PACAP induces changes in [Ca2+]iin a very complex pattern in GABAergic and non-GABAergic neurons
Fura-2 loading of cells resulted in a strong uptake of the fluorescent dye by neurons identified by their size and cell morphology, whereas only very few fibrillary astrocytes were labeled. Analysis of [Ca2+]i was restricted to neurons only, and up to 60 individual cells could be monitored simultaneously within one measurement.
After stimulation with ≥10 nm PACAP, 1169 (27%) of 4285 neurons analyzed with the fura-2 technique showed an increase of [Ca2+]i (Fig.2a). The percentage of cells that were responding to PACAP varied between different preparations (10–60%; n = 38). Conversion of the semiquantitative ratio values into approximate intracellular calcium concentrations showed that the PACAP-induced increases in [Ca2+]i varied considerably among single cells. During stimulation, [Ca2+]i rose from a basal concentration of ∼100 nm to peak concentrations ranging from 700 nm to 3.5 μm (Fig.2b–d). These differences were not dependent on the preparation or the culturing period.
Fig. 2.

PACAP-induced increases of [Ca2+]i in SCN neurons and conversion of the 334 nm/380 nm emission ratio data to approximate calcium concentrations. PACAP at concentrations of ≥10 nm caused an increase of [Ca2+]i in SCN neurons (a). The ratio data of a single PACAP-responsive neuron (b) were converted to approximate calcium concentrations (d) by means of the Grynkiewicz equation (Grynkiewicz et al., 1985). c,d, PACAP-induced changes of [Ca2+]i in two neurons from the same experiment that display a striking variation in the amplitude of the response. PACAP elicited [Ca2+]iincreases from basal levels of ∼100 nm to peak concentrations ranging from 700 nm to 3.5 μm. The duration of PACAP application is indicated bybars.
The PACAP-induced changes of [Ca2+]icould be distinguished into three major response patterns: (1) monophasic responses (20%) (Fig.3a), (2) biphasic responses with an initial increase of [Ca2+]ifollowed by a plateau phase (65%) (Fig. 3b), which extended in many neurons over several minutes and was not dependent on the duration of PACAP stimulation (Fig. 3c,d), and (3) calcium oscillations with varying amplitude (15%) (Fig.3e,f).
Fig. 3.

PACAP-induced changes of [Ca2+]i in SCN cells. Stimulation with PACAP (100 nm) elicited a broad spectrum of different changes of [Ca2+]i in 27% of the analyzed SCN neurons (n = 4285): 20% of these cells showed a monophasic response (a), 65% showed a biphasic pattern with an initial increase of [Ca2+]i followed by a plateau phase (b), which in many cells extended over several minutes and was not dependent on the duration of PACAP application (c, d), and 15% of the responding cells showed calcium oscillations with varying amplitude (e, f). Application of a short PACAP pulse (∼30 sec) resulted in a long-lasting refractory time, because even after 30 min >90% of the neurons (27 of 29 analyzed PACAP-responsive cells) did not respond to a second PACAP pulse with increases in [Ca2+]i(g). Prolonged pretreatment of SCN neurons with PACAP (16 hr) resulted in a dramatic desensitization of PACAP-induced calcium signaling. During the following 24 hr period after removal of the neuropeptide, <1% of the analyzed cells (8 of 1838) showed PACAP-induced increases in [Ca2+]i. A great number of neurons that responded to PACAP were also sensitive to glutamate (60%), SP (55%), or both glutamate and SP (40%) (h). The data are presented as 334 nm/380 nm emission ratios. The duration of the application of the neurotransmitters/neuromodulators is indicated bybars.
Application of a short PACAP pulse (∼30 sec) resulted in a long-lasting refractory time, because even 30 min after this first pulse most of the neurons (>90%) did not react to a second PACAP pulse with changes in [Ca2+]i (Fig.3g). Prolonged incubation of the neurons with PACAP (16 hr) caused a dramatic desensitization of PACAP-induced calcium signaling. During the following 24 hr period after removal of the neuropeptide, virtually all cells were unresponsive to further treatment with PACAP (>99%). In contrast, glutamate (10 μm) elicited changes of [Ca2+]i in these experiments that were not distinguishable from the responses of cells that were not pretreated with PACAP.
To demonstrate that the observed changes of [Ca2+]i were directly elicited by PACAP acting on SCN neurons and not caused by activation of neighboring cells that convey the signals via synaptic transmission or gap junctions, cells were preincubated with TTX or treated with PACAP after 1 d in culture. TTX (300–500 nm; n = 157), a reversible blocker of Na+ channels that are essential for propagation of impulses in excitable membranes, neither inhibited PACAP-induced increases of [Ca2+]i nor influenced the pattern of PACAP-induced changes in [Ca2+]i. Even in the presence of TTX, PACAP elicited increases of [Ca2+]i that were indistinguishable from those caused in the absence of TTX (Fig.4a). Furthermore, PACAP-induced increases of [Ca2+]iwere detectable as soon as 20 hr after cell dissociation, when the layer of astrocytes had not yet been developed and the cells were situated separately on the coverslip (Fig. 4b). These data indicate that the PACAP-induced changes in [Ca2+]i in SCN neurons were not mediated through intercellular communication.
Fig. 4.

Influence of intercellular communication on the PACAP-induced changes in [Ca2+]i. Pretreatment with TTX (300–500 nm; n = 157) did not interfere with PACAP-induced calcium signaling (a). Furthermore, PACAP elicited changes in [Ca2+]i even 20 hr after dissociation of the cells, when the layer of astrocytes had not yet been developed and the neurons were situated separately on the coverslip (b). These data indicate that PACAP-induced changes of [Ca2+]i are not the result of synaptic transmission or coupling via gap junctions but a direct effect of the peptide on the calcium signaling pathway in SCN neurons. The duration of TTX and PACAP application is indicated bybars.
Application of the structurally related peptide VIP (100 nm) did not increase calcium in neurons of the SCN (n = 53), indicating that the PACAP-induced changes of [Ca2+]i are mediated via specific PACAP receptors. Furthermore, pretreatment with VIP did not lead to desensitization of the PACAP-sensitive receptors, nor did it influence the pattern of PACAP-induced calcium signaling (Fig.5a,b).
Fig. 5.

Influence of VIP and cAMP on the PACAP-induced changes in [Ca2+]i. VIP (100 nm; n = 53) neither increased [Ca2+]i nor interacted with the pattern of changes of [Ca2+]i elicited by PACAP used at the same concentration, i.e., even after pretreatment with VIP, PACAP elicited monophasic and biphasic calcium responses as well as calcium oscillations. These data indicate that the PACAP-induced increases of [Ca2+]i are mediated via PACAP type I receptors (a, b). The PACAP-induced increases of [Ca2+]i are independent of the cAMP level, because activation of the AC by forskolin (10 μm; n = 162) (c) or direct enhancement of the intracellular cAMP concentration by treatment with 8-Br-cAMP (1 mm;n = 141) (d) did not increase basal calcium levels or interfere with PACAP-induced calcium signaling. The duration of drug application is indicated bybars.
Activation of the AC by forskolin (10 μm;n = 162) or application of the cell-permeable cAMP analog 8-Br-cAMP (1 mm; n = 141) did not change the basal [Ca2+]i or affect the PACAP-induced increases of [Ca2+]i, demonstrating that the intracellular cAMP level is obviously not involved in PACAP-induced calcium signaling in SCN neurons (Fig.5c,d).
Combined analysis of the PACAP-induced calcium responses and immunocytochemical demonstration of GABA showed that PACAP elicited increases in [Ca2+]i in both GABA-immunopositive (53%; 28 of 53 cells) and GABA-immunonegative neurons (47%) (Fig.6). Nevertheless, the pattern of PACAP-induced changes of [Ca2+]i did not vary between these PACAP-sensitive cells, i.e., PACAP induced monophasic and biphasic responses as well as calcium oscillations in GABAergic and non-GABAergic neurons.
Fig. 6.

Correlation of the PACAP-sensitive cells with immunocytochemically identified GABA-immunopositive neurons. Cells initially analyzed with the fura-2 technique were subsequently fixed with a mixture of paraformaldehyde/glutaraldehyde. GABA was immunodetected by labeling with a specific primary antibody and a FITC-coupled secondary antibody. The transmission image shows the cells on a coverslip with an internal grid, allowing the re-identification of the analyzed neurons (a); the corresponding fluorescence image shows the GABA-immunoreactive neurons (b). Arrowheads indicate GABA-immunopositive cells, which responded to PACAP with increases of [Ca2+]i. More than 50% of the PACAP-sensitive neurons were GABA-immunopositive. The pattern of PACAP-induced changes of [Ca2+]i(monophasic or biphasic responses or calcium oscillations) did not vary between GABAergic and non-GABAergic neurons. Scale bar, 10 μm.
In addition to PACAP, many of the neurons were also sensitive to glutamate and SP, two other neurotransmitters of the RHT. Application of SP (100 nm) resulted in an increase of [Ca2+]i in 30% of all cells tested (134 of 447); application of glutamate (10 μm) enhanced [Ca2+]i in 45% of the analyzed cells (1678 of 3794). A great number of neurons that responded to PACAP with increased [Ca2+]i were also sensitive to glutamate (60%; 216 of 361 cells), to SP (55%; 86 of 155 cells), and to glutamate and SP (40%; 24 of 62 cells) (Fig. 3h). This indicates that individual SCN neurons obtain photic information by different neurotransmitters/neuromodulators of the RHT.
PACAP mobilizes calcium from intracellular and extracellular origin
PACAP application to SCN neurons kept in calcium-free saline plus EGTA (1 mm) resulted in a uniform response pattern in all responding cells. A rapid increase in [Ca2+]i was followed by an immediate drop to basal levels, but a plateau phase or calcium oscillations, as detected in 80% of the responding cells after PACAP treatment in calcium-containing saline, were abolished (n = 393) (Fig. 7a). This indicates that intracellular calcium stores are involved in PACAP-induced calcium signaling in the SCN. Application of caffeine (10 μm–1 mm), which mobilizes calcium from ryanodine-sensitive intracellular calcium stores, did not interfere with PACAP-induced calcium responses (n = 345) (Fig. 7b). In contrast, treatment with thapsigargin (2 μm), which releases calcium from intracellular stores by inhibiting the microsomal (endoplasmic reticular) Ca2+-ATPase, caused an increase in [Ca2+]i, and no PACAP-induced changes in [Ca2+]i were detectable after thapsigargin-sensitive calcium stores were depleted (n = 174) (Fig. 7c).
Fig. 7.

Effects of removal of extracellular calcium and depletion of intracellular calcium stores on PACAP-induced calcium signaling. Application of PACAP to cells kept in calcium-free saline plus EGTA (1 mm) resulted in a rapid increase of [Ca2+]i followed by an immediate drop to basal levels in all PACAP-responsive cells. The plateau phase and calcium oscillations were abolished under these conditions, indicating that intracellular and extracellular calcium is involved in PACAP-induced calcium signaling (n = 393) (a). Treatment with caffeine (10 μm–1 mm; n = 345) did not interfere with PACAP-induced calcium responses (b). In contrast, incubation of thapsigargin (2 μm; n = 174) caused an increase of [Ca2+]i, and no PACAP-induced changes of [Ca2+]i were detectable after thapsigargin-sensitive calcium stores were depleted (c); however, these cells were able to react to glutamate. These data indicate that in SCN neurons PACAP induces calcium release from (thapsigargin-sensitive) intracellular stores and also calcium influx. The duration of drug application is indicated bybars.
The effects of PACAP on [Ca2+]iare mediated via G-protein, PLC, and PKC
Because the number of PACAP-sensitive cells varied considerably between different cell preparations, parallel measurements were performed in the experiments with G-protein or PLC inhibitors, and the average number of PACAP-responsive cells was normalized (control measurements without inhibition = 100%). Preincubation of the cells with GDP-β-S (1 mm; n = 240), a nonhydrolyzable GDP analog that competitively inhibits G-protein activation, resulted in an inhibition of PACAP-induced increases of [Ca2+]i in >60% of the PACAP-sensitive neurons (p < 0.0001 vs controls) (Fig. 8). Application of two different PLC inhibitors, neomycin (500 μm;n = 443) or U-73122 (10 μm;n = 249), led to a similar result. After pretreatment with neomycin or U-73122, only 30 or 5% of the PACAP-sensitive cells, respectively, responded to PACAP with a rise in [Ca2+]i (p < 0.0001 vs controls for both inhibitors) (Fig. 8). In contrast, preincubation with U-73343 (10 μm; n = 175), an analog of U-73122 that acts as a very weak inhibitor of the PLC and thus serves as a suitable negative control, did not result in an inhibition of PACAP-induced increases of [Ca2+]i (p = 0.51 vs controls) (Fig. 8). Inhibition of the PKC with bisindolylmaleimide I (GF 109203X; 2 μm) (n = 126) elicited merely monophasic PACAP-induced changes in [Ca2+]i in 70% of the PACAP-responsive neurons and thus suppressed the plateau phase and calcium oscillations in most cells (Fig.9a). A similar result was obtained by inhibition of the PKC with chelerythrine (10 μm; n = 156), which caused monophasic responses in 90% of the PACAP-sensitive neurons. In contrast, PACAP stimulation of cells from the same preparations, but without PKC inhibition, showed monophasic increases of [Ca2+]i in only 15% of the PACAP-responsive neurons.
Fig. 8.

Effects of G-protein and PLC inhibitors on PACAP-induced increases of [Ca2+]i. The data of this subset of experiments are expressed as percentage of control (measurements of cells from the same preparations without specific inhibition) because the number of PACAP-sensitive cells varied between the preparations (10–60%; n = 38), and PACAP elicited changes of [Ca2+]i with a striking variation in the amplitude (see Fig. 2 and Material and Methods). Preincubation with the G-protein antagonist GDP-β-S (1 mm; n = 240) led to an inhibition of PACAP-induced increases of [Ca2+]i in 60% of the PACAP-sensitive neurons. Application of the PLC inhibitors neomycin (500 μm; n = 443) or U-73122 (10 μm; n = 249) resulted in PACAP-induced calcium signaling in 30 or 5% of the analyzed PACAP-sensitive cells, respectively, demonstrating an inhibition of PACAP-induced calcium signaling in 70% or even 95% of these neurons. In contrast, preincubation with the U-73122 analog U-73343 (10 μm; n = 175), which acts as a very weak inhibitor of the PLC and thus serves as a negative control, did not inhibit PACAP-induced changes of [Ca2+]i. All inhibitors were preincubated for 10 min. Asterisks indicate significant differences from the corresponding control values (unpaired Student’st test). ***p < 0.0001.
Fig. 9.

Effects of PKC inhibitors and antagonists of VGCCs on PACAP-induced changes in [Ca2+]i. Inhibition of the PKC with bisindolylmaleimide I (GF 109203X; 2 μm; n = 126) resulted in merely monophasic PACAP-induced increases of [Ca2+]i in 70% of the PACAP-responsive cells and thus suppressed the plateau phase and calcium oscillations in most cells (a). A similar result was obtained by inhibition of the PKC with chelerythrine (10 μm; n = 156), which showed monophasic responses in 90% of the PACAP-sensitive cells (data not shown). In contrast, PACAP stimulation of cells from the same preparations, but without PKC inhibition, elicited monophasic increases of [Ca2+]i in only 15% of the PACAP-responsive neurons. Specific blockade of VGCCs of the L-type with diltiazem (10–100 μm; n = 149) (b), nifedipine (10–100 μm;n = 139) (c), or verapamil (10–100 μm; n = 100) (d), respectively, did not inhibit the calcium-induced calcium influx responsible for the plateau phase (c, d) and the calcium oscillations (b) after PACAP stimulation. Similar results were obtained by blockade of VGCCs of the T-type with amiloride (100 nm–100 μm; n = 459) (e), of the N-type with ω-conotoxin GVIA (1–10 μm; n = 290) (f), and of the P-type and also Q-type with ω-agatoxin IVA (1–500 nm;n = 238) (g). Even combined blockade of these VGCCs with a mixture of diltiazem (50–100 μm), amiloride (50–100 μm), ω-conotoxin GVIA (1–2 μm), and ω-agatoxin IVA (50–100 nm) did not inhibit the calcium influx elicited by PACAP application (n = 174) (h). The duration of drug application is indicated bybars.
Voltage-gated calcium channels are not involved in PACAP-induced changes in [Ca2+]i
The previous results demonstrate that calcium channels in the plasma membrane are responsible for the plateau phase of the biphasic calcium signals and for the calcium oscillations, because both depend on calcium influx. To examine the role of voltage-gated calcium channels (VGCCs) in PACAP-induced calcium signaling in SCN neurons, we blocked VGCCs with subtype-specific antagonists and analyzed the changes of [Ca2+]i after PACAP stimulation. Blockade of L-type calcium channels with nifedipine (10–100 μm; n = 139), verapamil (10–100 μm; n = 100), or diltiazem (10–100 μm; n = 149) did not influence the PACAP-induced changes of [Ca2+]i, and it did not inhibit the plateau phase or PACAP-induced calcium oscillations (Fig.9b–d). Blockade of T-type channels with amiloride (100 nm–100 μm; n = 459) (Tang et al., 1988), N-type channels with ω-conotoxin GVIA (1–10 μm; n = 290), and P-type and also Q-type channels with ω-agatoxin IVA (1–500 nm;n = 238) (Randall and Tsien, 1995) led to the same results: none of these treatments interfered with PACAP-induced calcium signaling (Fig. 9e–g). Furthermore, combined blockade of these VGCCs with a cocktail of diltiazem (50–100 μm), amiloride (50–100 μm), ω-conotoxin GVIA (1–2 μm), and ω-agatoxin IVA (50–100 nm) did not inhibit the PACAP-induced influx of calcium that is responsible for the plateau phase and calcium oscillations (n = 174) (Fig. 9h).
Melatonin and PACAP in the SCN: no evidence for an interaction on the calcium signal transduction cascade
In the SCN of newborn Wistar rats (day 1–7), melatonin binding sites were detected by in vitro autoradiography (Fig.10). Calcium imaging by means of the fura-2 technique revealed that application of melatonin in a physiological concentration (10 nm) did not change [Ca2+]i in primary cell cultures of rat SCN neurons (Fig. 11a). Furthermore, melatonin did not inhibit PACAP-induced increases of [Ca2+]i when applied for 5–10 min before PACAP treatment (n = 92) (Fig. 11a). Even after a prolonged time of preincubation (30 min), a period sufficient to completely inhibit PACAP-induced phosphorylation of the transcription factor CREB in slice cultures of the rat SCN (Kopp et al., 1997), melatonin did not influence the PACAP-induced pattern of changes in [Ca2+]i (n= 143) (Fig. 11b,c).
Fig. 10.

Autoradiographic demonstration of melatonin binding sites in the SCN of a newborn Wistar rat. Coronal hypothalamic sections (16 μm) of a 3-d-old rat were incubated with 2-[125I]-iodomelatonin. Melatonin binding sites were detected in the suprachiasmatic nucleus (SCN) and also in the paraventricular nucleus of the thalamus (PVN). Scale bar, 1 mm.
Fig. 11.
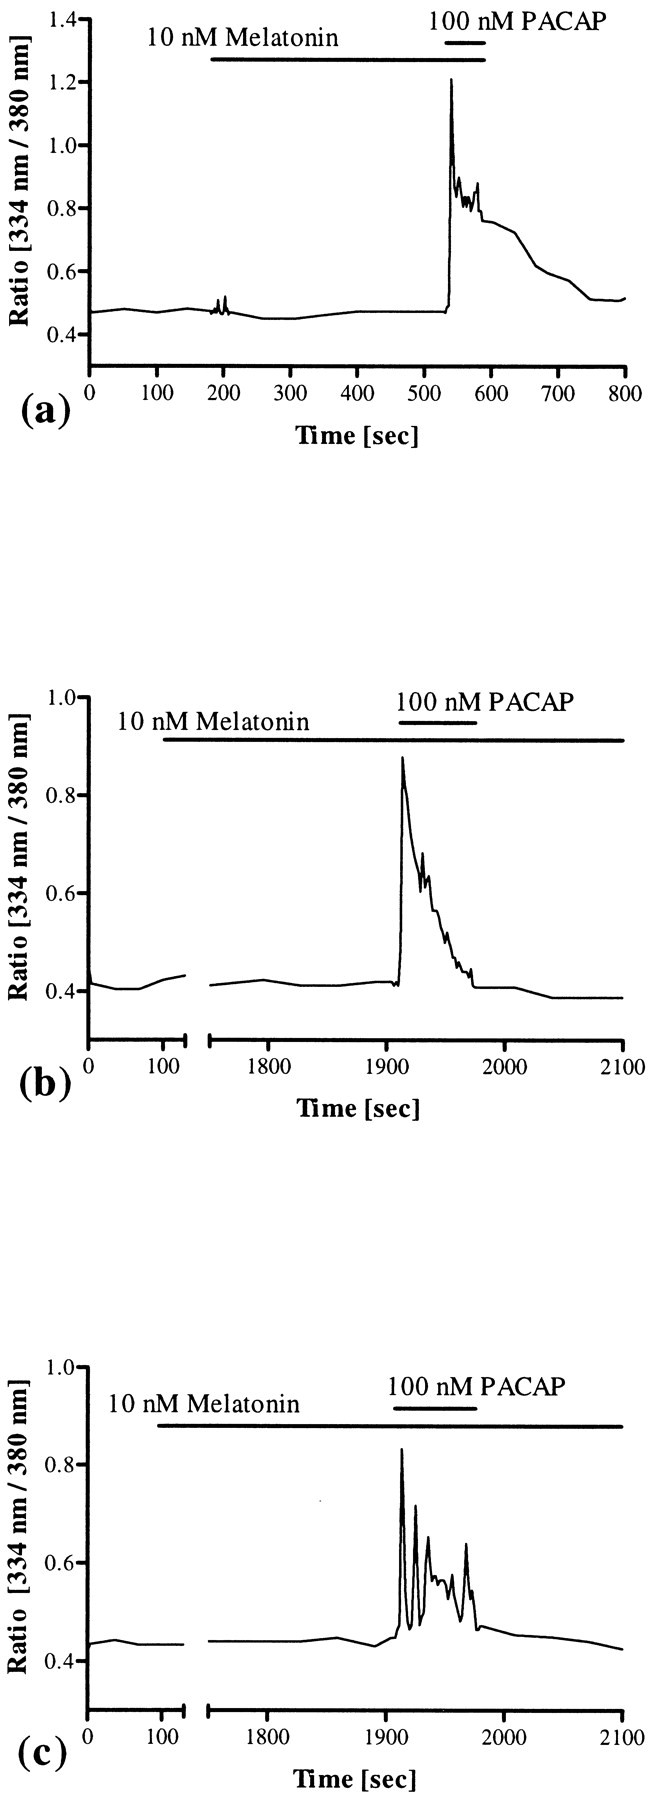
Effects of melatonin on [Ca2+]i and PACAP-induced calcium signaling. Application of melatonin in a physiological concentration (10 nm) neither changed the basal concentration of intracellular calcium nor inhibited PACAP-induced increases of [Ca2+]i in SCN neurons (n = 92) (a). Even after a prolonged time of preincubation (30 min), a period sufficient to completely block the PACAP-induced phosphorylation of the transcription factor CREB in the rat SCN (Kopp et al., 1997), melatonin did not interfere with the complex pattern of PACAP-induced changes in [Ca2+]i (n = 143) (b, c). The duration of melatonin and PACAP application is indicated by bars.
DISCUSSION
During the last few years, increasing evidence has been provided that PACAP acts as a neuromodulator of the RHT, conveying information about the ambient light/dark cycle to the circadian pacemaker in the hypothalamus (Hashimoto et al., 1996; Hannibal et al., 1997; Shioda et al., 1997). The cAMP signal transduction cascade is apparently one pathway through which PACAP affects SCN functions, because PACAP-induced phase-shifts were blocked by a specific cAMP antagonist (Hannibal et al., 1997) and the PACAP-induced phosphorylation of CREB was inhibited by melatonin (Kopp et al., 1997). In the present report we demonstrate that PACAP also elicits changes in [Ca2+]i in SCN neurons, demonstrating a substantially enhanced signaling potential of this neuropeptide in the circadian clock.
PACAP was first isolated in 1989 from ovine hypothalamus and named because of its AC-activating potency (Miyata et al., 1989). More recently, the peptide has also been shown to activate the calcium signaling pathway via a broad spectrum of signal transduction mechanisms. These signaling cascades are activated in parallel in many systems and include (1) activation of the AC with subsequent cAMP/protein kinase A-dependent opening of calcium channels, (2) release of calcium from inositol (1,4,5)-trisphosphate (IP3)-sensitive stores without subsequent calcium influx, (3) calcium release from ryanodine-sensitive stores independent of both IP3 and cAMP, and (4) PKC-dependent activation of calcium channels without IP3 formation. Different types of VGCCs and voltage-gated (TTX-sensitive) Na+ channels are often involved in these PACAP-induced calcium signaling events (Isobe et al., 1993; Rawlings et al., 1993, 1994; Leech et al., 1995;Hezareh et al., 1996, 1997; K. Tanaka et al., 1996, 1997, 1998;O’Farrell and Marley, 1997).
Our results demonstrate that in SCN neurons PACAP induces changes in [Ca2+]i that are independent of cAMP but require G-protein-mediated activation of PLC. This leads to an initial release of calcium from IP3-sensitive intracellular stores, which in turn causes PKC-mediated opening of calcium channels in the plasma membrane and subsequent calcium influx in 80% of the analyzed cells, resulting in a plateau phase or calcium oscillations. A similar mechanism has been described in a rat pancreatic cell line (Barnhart et al., 1997), in gonadotrophs of the rat anterior pituitary gland, and in the gonadotroph-derived αT3–1 cell line (Rawlings et al., 1993; Schomerus et al., 1994). However, in αT3–1 cells, the plateau phase could be blocked by L-type VGCC antagonists (Hezareh et al., 1997). In contrast, in SCN neurons, blockade of VGCCs of the L-type or of the N-, P-, Q-, and T-type as well as simultaneous blockade of all of these channels had no effect, suggesting that other (non-voltage-gated?) channels are involved in PACAP-induced changes in [Ca2+]i. In addition, voltage-gated Na+ channels are not involved in this calcium-induced calcium influx, because application of TTX did not interfere with PACAP-induced calcium signaling.
In SCN neurons, PACAP elicits a broad spectrum of different changes in [Ca2+]i. Because individual neurons of the SCN express an endogenous circadian rhythmicity (Welsh et al., 1995), SCN neurons may also display circadian rhythms in PACAP- sensitivity or in the pattern of PACAP-induced changes in [Ca2+]i. The different PACAP-induced changes in [Ca2+]i may therefore depend on the circadian phase of single neurons. Treatment with VIP did not elicit any changes in [Ca2+]i when applied in the same concentration as PACAP (100 nm), indicating that PACAP-induced changes in [Ca2+]i in the SCN are mediated via PACAP type I receptors. These receptors have recently been shown to mediate PACAP-induced phase-shifting of circadian rhythms in the SCN via activation of the cAMP signaling pathway (Hannibal et al., 1997). Activation of PACAP type I receptors in pheochromocytoma cells induces gene transcription as well as neurotransmitter release by activation of the cAMP or the calcium signaling pathway, respectively (Taupenot et al., 1998). Continuous activation of these receptors in catecholaminergic neuron-like cells attenuated the PACAP-induced cAMP accumulation, whereas the phosphoinositide turnover and phospho-CREB-mediated transcriptional activity has been overstimulated (Muller et al., 1998). In contrast, chronic exposure of SCN cells to PACAP resulted in a dramatic desensitization of the calcium signaling pathway. Possibly, in the SCN, PACAPergic modulation of afferent inputs and induction of phase-shifts, manifested by de novo protein biosynthesis, may be restricted to one or the other signaling pathway, a mechanism recently discussed for signaling events in the SCN induced by neuropeptide Y, a neuromodulator of the geniculohypothalamic tract (Harrington and Hoque, 1997). Glutamatergic neurotransmission to the SCN, suggested to be modulated by both neuropeptide Y and SP (Shirakawa and Moore, 1994; Abe et al., 1996; van den Pol et al., 1996), may be one target for PACAPergic neuromodulation. The effects of glutamate on SCN neuronal firing rate are not dependent on the circadian time, but glutamate induces the phosphorylation of CREB and phase-shifts (phase-delays as well as phase-advances) that are restricted to distinct time windows, indicating that glutamatergic neurotransmission requires modulation by the circadian clock (Ding et al., 1994, 1997;Gannon and Rea, 1994; Inouye and Shibata, 1994; Shirakawa and Moore, 1994). A great number of PACAP-sensitive neurons responds to glutamate and/or SP. Thus, single SCN neurons are target cells for retinal projections and display an individual (time-dependent?) sensitivity to different neurotransmitters/neuromodulators. In addition to zeitgeber information that is conveyed to the oscillator via the RHT, the SCN receives neuronal inputs from the raphe nuclei and the thalamic intergeniculate leaflet as well as endocrine information. Thus, various information from different sources reaches the clock and has to be integrated into rhythm generation, entrainment, and consolidation.
Immunocytochemical characterization revealed that >50% of the PACAP-sensitive neurons are GABAergic. GABA is the major neurotransmitter of the circadian timing system and has been shown in ∼80% of all SCN neurons and ∼50% of all SCN synaptic boutons (van den Pol and Tsujimoto, 1985; Okamura et al., 1989; Decavel and van den Pol, 1990; Moore and Speh, 1993; Buijs et al., 1994; M. Tanaka et al., 1997). GABAergic signaling events are involved in receiving, processing, and transmitting (light) information (Ralph and Menaker, 1989; O’Hara et al., 1995; Hermes et al., 1996; Isobe and Nishino, 1997; Strecker et al., 1997; Wagner et al., 1997). Thus, PACAP directly affects one of the most important neurotransmitter systems of the endogenous clock. The GABA-immunonegative population of PACAP-sensitive neurons requires further characterization. These neurons may represent GABAergic cells whose neurotransmitter content at the moment of fixation was too low to be detected immunocytochemically. This suggestion is based on findings that in the SCN GABA and glutamic acid decarboxylase, the enzyme that catalyzes GABA biosynthesis, exhibit a circadian rhythmicity of their content or activity (Aguilar-Roblero et al., 1993; Cagampang et al., 1996) and that dissociated SCN cells in culture express independently phased circadian rhythms with period lengths of 24.35 ± 1.20 hr (Welsh et al., 1995). On the other hand these neurons may be truly non-GABAergic. This would suggest that two populations of PACAP-sensitive neurons exist in the SCN.
The hormone melatonin is synthesized and released in the mammalian pineal organ in a diurnal rhythm, driven by the endogenous clock, with high levels during the dark period. In the SCN, melatonin binding sites have been demonstrated (Vanecek et al., 1987), indicating that the hormone forms a feedback loop. Like many other substances conveying time information to the SCN, melatonin elicits physiological responses in the oscillator at distinct time windows (for review, see Klein et al., 1991). These effects are thought to be mediated via inhibition of the AC (Reppert et al., 1994; Liu et al., 1997), but in principle melatonin can also affect the calcium signaling pathway (Vanecek and Klein, 1992, 1995; Godson and Reppert, 1997; McArthur et al., 1997). In the present report we show that melatonin does not affect [Ca2+]i in SCN neurons on its own. Moreover, melatonin does not affect PACAP-induced changes of [Ca2+]i. The missing effects of melatonin on [Ca2+]i may not be caused by a lack of melatonin receptors, because newborn rats express melatonin binding sites in the SCN and physiological effects of melatonin have been demonstrated in primary cell cultures of the rat SCN that were comparable to our cell cultures in preparation and cultivation (Vanecek and Watanabe, 1998; Watanabe et al., 1998). Our data indicate that the antagonistic effects of melatonin and PACAP on CREB phosphorylation in rat SCN slice cultures seem to be mediated via activation/inhibition of the cAMP signaling pathway (Kopp et al., 1997). This is consistent with a recent report that in primary cell cultures of the hamster SCN, melatonin inhibits the (cAMP-mediated) forskolin- and dopamine-induced but not the (Ca2+-mediated) glutamate-induced phosphorylation of CREB (McNulty et al., 1998).
In conclusion, these data in combination with previous findings demonstrate that in the SCN PACAP affects the cAMP as well as the calcium signaling pathway, eliciting a complex pattern in second messenger responses. Intrinsic GABAergic neurons of the SCN appear as the prime target cells for PACAPergic neurotransmission, whereas glutamatergic neurotransmission to the oscillator may be one target for PACAPergic neuromodulation. The antagonistic potency of melatonin on PACAP-induced signaling events seems to be restricted to the cAMP signaling pathway.
Footnotes
This research was supported by grants from the Deutsche Forschungsgemeinschaft. We thank E. Laedtke for expert technical assistance, Drs. E. Gebke, E. Maronde, S. Kroeber, and C. von Gall for helpful advice, and P. Schmidt, E. Cortés, K. Steinhauer, and M. Zimmer, who are responsible for our rat colony, for excellent collaboration.
Correspondence should be addressed to Dr. Michael D. A. Kopp, Max-Planck-Institut für Physiologische und Klinische Forschung, W. G. Kerckhoff-Institut, Parkstrasse 1, D-61231 Bad Nauheim, Germany.
REFERENCES
- 1.Abe H, Honma S, Shinohara K, Honma KI. Substance P receptor regulates the photic induction of Fos-like protein in the suprachiasmatic nucleus of Syrian hamsters. Brain Res. 1996;708:135–142. doi: 10.1016/0006-8993(95)01298-2. [DOI] [PubMed] [Google Scholar]
- 2.Aguilar-Roblero R, Verduzco-Carbajal L, Rodriguez C, Mendez-Franco J, Moran J, Perez de la Mora M. Circadian rhythmicity in the GABAergic system in the suprachiasmatic nuclei of the rat. Neurosci Lett. 1993;157:199–202. doi: 10.1016/0304-3940(93)90736-5. [DOI] [PubMed] [Google Scholar]
- 3.Arimura A, Somogyvari-Vigh A, Miyata A, Mizuno K, Coy DH, Kitada C. Tissue distribution of PACAP as determined by RIA: highly abundant in the rat brain and testes. Endocrinology. 1991;129:2787–2789. doi: 10.1210/endo-129-5-2787. [DOI] [PubMed] [Google Scholar]
- 4.Barnhart DC, Sarosi GA, Mulholland MW. PACAP-38 causes phospholipase C-dependent calcium signaling in rat acinar cell line. Surgery. 1997;122:465–475. doi: 10.1016/s0039-6060(97)90040-4. [DOI] [PubMed] [Google Scholar]
- 5.Buijs RM, Hou YX, Shinn S, Renaud LP. Ultrastructural evidence for intra- and extranuclear projections of GABAergic neurons of the suprachiasmatic nucleus. J Comp Neurol. 1994;340:381–391. doi: 10.1002/cne.903400308. [DOI] [PubMed] [Google Scholar]
- 6.Cagampang FRA, Rattray M, Powell JF, Campbell IC, Coen CW. Circadian changes of glutamate decarboxylase 65 and 67 mRNA in the rat suprachiasmatic nuclei. NeuroReport. 1996;7:1925–1928. doi: 10.1097/00001756-199608120-00011. [DOI] [PubMed] [Google Scholar]
- 7.Chatterjee TK, Sharma RV, Fisher RA. Molecular cloning of a novel variant of the pituitary adenylate cyclase-activating polypeptide (PACAP) receptor that stimulates calcium influx by activation of L-type calcium channels. J Biol Chem. 1996;271:32226–32232. doi: 10.1074/jbc.271.50.32226. [DOI] [PubMed] [Google Scholar]
- 8.Decavel C, van den Pol AN. GABA: a dominant neurotransmitter in the hypothalamus. J Comp Neurol. 1990;302:1019–1037. doi: 10.1002/cne.903020423. [DOI] [PubMed] [Google Scholar]
- 9.Ding JM, Chen D, Weber ET, Faiman LE, Rea MA, Gillette MU. Resetting the biological clock: mediation of nocturnal circadian shifts by glutamate and NO. Science. 1994;266:1713–1717. doi: 10.1126/science.7527589. [DOI] [PubMed] [Google Scholar]
- 10.Ding JM, Faiman LE, Hurst WJ, Kuriashkina LR, Gillette MU. Resetting the biological clock: mediation of nocturnal CREB phosphorylation via light, glutamate, and nitric oxide. J Neurosci. 1997;17:667–675. doi: 10.1523/JNEUROSCI.17-02-00667.1997. [DOI] [PMC free article] [PubMed] [Google Scholar]
- 11.D’Souza T, Dryer SE. Intracellular free Ca2+ in dissociated cells of the chick pineal gland: regulation by membrane depolarization, second messengers and neuromodulators, and evidence for release of intracellular Ca2+ stores. Brain Res. 1994;656:85–94. doi: 10.1016/0006-8993(94)91369-2. [DOI] [PubMed] [Google Scholar]
- 12.Fukuhara C, Suzuki N, Matsumoto Y, Nakayama Y, Aoki K, Tsujimoto G, Inouye SIT, Masuo Y. Day-night variation of pituitary adenylate cyclase-activating polypeptide (PACAP) level in the rat suprachiasmatic nucleus. Neurosci Lett. 1997;229:49–52. doi: 10.1016/s0304-3940(97)00415-1. [DOI] [PubMed] [Google Scholar]
- 13.Gannon RL, Rea MA. In situ hybridization of antisense mRNA oligonucleotides for AMPA, NMDA and metabotropic glutamate receptor subtypes in the rat suprachiasmatic nucleus at different phases of the circadian cycle. Mol Brain Res. 1994;23:338–344. doi: 10.1016/0169-328x(94)90244-5. [DOI] [PubMed] [Google Scholar]
- 14.Godson C, Reppert SM. The Mel1a melatonin receptor is coupled to parallel signal transduction pathways. Endocrinology. 1997;138:397–404. doi: 10.1210/endo.138.1.4824. [DOI] [PubMed] [Google Scholar]
- 15.Grynkiewicz G, Poenie M, Tsien RY. A new generation of Ca2+ indicators with greatly improved fluorescence properties. J Biol Chem. 1985;260:3440–3450. [PubMed] [Google Scholar]
- 16.Hannibal J, Mikkelsen JD, Clausen H, Holst JJ, Wulff BS, Fahrenkrug J. Gene expression of pituitary adenylate cyclase activating polypeptide (PACAP) in the rat hypothalamus. Regul Pept. 1995;55:133–148. doi: 10.1016/0167-0115(94)00099-j. [DOI] [PubMed] [Google Scholar]
- 17.Hannibal J, Ding JM, Chen D, Fahrenkrug J, Larsen PJ, Gillette MU, Mikkelsen JD. Pituitary adenylate cyclase-activating peptide (PACAP) in the retinohypothalamic tract: a potential daytime regulator of the biological clock. J Neurosci. 1997;17:2637–2644. doi: 10.1523/JNEUROSCI.17-07-02637.1997. [DOI] [PMC free article] [PubMed] [Google Scholar]
- 18.Harrington ME, Hoque S. NPY opposes PACAP phase shifts via receptors different from those involved in NPY phase shifts. NeuroReport. 1997;8:2677–2680. doi: 10.1097/00001756-199708180-00008. [DOI] [PubMed] [Google Scholar]
- 19.Hashimoto H, Nogi H, Mori K, Ohishi H, Shigemoto R, Yamamoto K, Matsuda T, Mizuno N, Nagata S, Baba A. Distribution of the mRNA for a pituitary adenylate cyclase-activating polypeptide receptor in the rat brain: an in situ hybridization study. J Comp Neurol. 1996;371:567–577. doi: 10.1002/(SICI)1096-9861(19960805)371:4<567::AID-CNE6>3.0.CO;2-2. [DOI] [PubMed] [Google Scholar]
- 20.Hermes MLHJ, Coderre EM, Buijs RM, Renaud LP. GABA and glutamate mediate rapid neurotransmission from suprachiasmatic nucleus to hypothalamic paraventricular nucleus in rat. J Physiol (Lond) 1996;496:749–757. doi: 10.1113/jphysiol.1996.sp021724. [DOI] [PMC free article] [PubMed] [Google Scholar]
- 21.Hezareh M, Schlegel W, Rawlings SR. PACAP and VIP stimulate Ca2+ oscillations in rat gonadotrophs through the PACAP/VIP type 1 receptor (PVR1) linked to a pertussis toxin-insensitive G-protein and the activation of phospholipase C-β. J Neuroendocrinol. 1996;8:367–374. doi: 10.1046/j.1365-2826.1996.04645.x. [DOI] [PubMed] [Google Scholar]
- 22.Hezareh M, Schlegel W, Rawlings SR. Stimulation of Ca2+ influx in αT3–1 gonadotrophs via the cAMP/PKA signaling system. Am J Physiol. 1997;273:E850–E858. doi: 10.1152/ajpendo.1997.273.5.E850. [DOI] [PubMed] [Google Scholar]
- 23.Inagaki N, Yoshida H, Mizuta M, Mizuno N, Fujii Y, Gonoi T, Miyazaki JI, Seino S. Cloning and functional characterization of a third pituitary adenylate cyclase-activating polypeptide receptor subtype expressed in insulin-secreting cells. Proc Natl Acad Sci USA. 1994;91:2679–2683. doi: 10.1073/pnas.91.7.2679. [DOI] [PMC free article] [PubMed] [Google Scholar]
- 24.Inouye SIT, Shibata S. Neurochemical organization of circadian rhythm in the suprachiasmatic nucleus. Neurosci Res. 1994;20:109–130. doi: 10.1016/0168-0102(94)90029-9. [DOI] [PubMed] [Google Scholar]
- 25.Ishihara T, Shigemoto R, Mori K, Takahashi K, Nagata S. Functional expression and tissue distribution of a novel receptor for vasoactive intestinal polypeptide. Neuron. 1992;8:811–819. doi: 10.1016/0896-6273(92)90101-i. [DOI] [PubMed] [Google Scholar]
- 26.Isobe K, Nakai T, Takuwa Y. Ca2+-dependent stimulatory effect of pituitary adenylate cyclase-activating polypeptide on catecholamine secretion from cultured porcine adrenal medullary chromaffin cells. Endocrinology. 1993;132:1757–1765. doi: 10.1210/endo.132.4.8384995. [DOI] [PubMed] [Google Scholar]
- 27.Isobe Y, Nishino H. GABAergic control of Arg-vasopressin release from suprachiasmatic nucleus slice culture. Brain Res. 1997;755:213–220. doi: 10.1016/s0006-8993(97)00099-1. [DOI] [PubMed] [Google Scholar]
- 28.Klein DC, Moore RY, Reppert SM. Suprachiasmatic nucleus: the mind’s clock. Oxford UP; New York: 1991. [Google Scholar]
- 29.Kopp M, Meissl H, Korf HW. The pituitary adenylate cyclase-activating polypeptide-induced phosphorylation of the transcription factor CREB (cAMP response element binding protein) in the rat suprachiasmatic nucleus is inhibited by melatonin. Neurosci Lett. 1997;227:145–148. doi: 10.1016/s0304-3940(97)00312-1. [DOI] [PubMed] [Google Scholar]
- 30.Leech CA, Holz GG, Habener JF. Pituitary adenylate cyclase-activating polypeptide induces the voltage-independent activation of inward membrane currents and elevation of intracellular calcium in HIT-T15 insulinoma cells. Endocrinology. 1995;136:1530–1536. doi: 10.1210/endo.136.4.7895663. [DOI] [PMC free article] [PubMed] [Google Scholar]
- 31.Leong DA. Intracellular calcium levels in rat anterior pituitary cells: single-cell techniques. Methods Enzymol. 1989;168:263–284. doi: 10.1016/0076-6879(89)68019-6. [DOI] [PubMed] [Google Scholar]
- 32.Liu C, Weaver DR, Jin X, Shearman LP, Pieschl RL, Gribkoff VK, Reppert SM. Molecular dissection of two distinct actions of melatonin on the suprachiasmatic circadian clock. Neuron. 1997;19:91–102. doi: 10.1016/s0896-6273(00)80350-5. [DOI] [PubMed] [Google Scholar]
- 33.Lutz EM, Sheward WJ, West KM, Morrow JA, Fink G, Harmar AJ. The VIP2 receptor: molecular characterisation of a cDNA encoding a novel receptor for vasoactive intestinal peptide. FEBS Lett. 1993;334:3–8. doi: 10.1016/0014-5793(93)81668-p. [DOI] [PubMed] [Google Scholar]
- 34.McArthur AJ, Hunt AE, Gillette MU. Melatonin action and signal transduction in the rat suprachiasmatic circadian clock: activation of protein kinase C at dusk and dawn. Endocrinology. 1997;138:627–634. doi: 10.1210/endo.138.2.4925. [DOI] [PubMed] [Google Scholar]
- 35.McNulty S, Schurov IL, Sloper PJ, Hastings MH. Stimuli which entrain the circadian clock of the neonatal Syrian hamster in vivo regulate the phosphorylation of the transcription factor CREB in the suprachiasmatic nucleus in vitro. Eur J Neurosci. 1998;10:1063–1072. doi: 10.1046/j.1460-9568.1998.00114.x. [DOI] [PubMed] [Google Scholar]
- 36.Miyata A, Arimura A, Dahl RR, Minamino N, Uehara A, Jiang L, Culler MD, Coy DH. Isolation of a novel 38 residue-hypothalamic polypeptide which stimulates adenylate cyclase in pituitary cells. Biochem Biophys Res Commun. 1989;164:567–574. doi: 10.1016/0006-291x(89)91757-9. [DOI] [PubMed] [Google Scholar]
- 37.Miyata A, Jiang L, Dahl RD, Kitada C, Kubo K, Fujino M, Minamino N, Arimura A. Isolation of a neuropeptide corresponding to the N-terminal 27 residues of the pituitary adenylate cyclase activating polypeptide with 38 residues (PACAP38). Biochem Biophys Res Commun. 1990;170:643–648. doi: 10.1016/0006-291x(90)92140-u. [DOI] [PubMed] [Google Scholar]
- 38.Moore RY, Speh JC. GABA is the principal neurotransmitter of the circadian system. Neurosci Lett. 1993;150:112–116. doi: 10.1016/0304-3940(93)90120-a. [DOI] [PubMed] [Google Scholar]
- 39.Muller A, Lutz-Bucher B, Kienlen-Campard P, Koch B, Loeffler JP. Continuous activation of pituitary adenylate cyclase-activating polypeptide receptors elicits antipodal effects on cyclic AMP and inositol phospholipid signaling pathways in CATH.a cells: role of protein synthesis and protein kinases. J Neurochem. 1998;70:1431–1440. doi: 10.1046/j.1471-4159.1998.70041431.x. [DOI] [PubMed] [Google Scholar]
- 40.O’Farrell M, Marley PD. Multiple calcium channels are required for pituitary adenylate cyclase-activating polypeptide-induced catechol-amine secretion from bovine cultured adrenal chromaffin cells. Naunyn Schmiedebergs Arch Pharmacol. 1997;356:536–542. doi: 10.1007/pl00005088. [DOI] [PubMed] [Google Scholar]
- 41.O’Hara BF, Andretic R, Heller HC, Carter DB, Kilduff TS. GABAA, GABAC, and NMDA receptor subunit expression in the suprachiasmatic nucleus and other brain regions. Mol Brain Res. 1995;28:239–250. doi: 10.1016/0169-328x(94)00212-w. [DOI] [PubMed] [Google Scholar]
- 42.Okamura H, Berod A, Julien JF, Geffard M, Kitahama K, Mallet J, Bobillier P. Demonstration of GABAergic cell bodies in the suprachiasmatic nucleus: in situ hybridization of glutamic acid decarboxylase (GAD) mRNA and immunocytochemistry of GAD and GABA. Neurosci Lett. 1989;102:131–136. doi: 10.1016/0304-3940(89)90067-0. [DOI] [PubMed] [Google Scholar]
- 43.Pantaloni C, Brabet P, Bilanges B, Dumuis A, Houssami S, Spengler D, Bockaert J, Journot L. Alternative splicing in the N-terminal extracellular domain of the pituitary adenylate cyclase-activating polypeptide (PACAP) receptor modulates receptor selectivity and relative potencies of PACAP-27 and PACAP-38 in phospholipase C activation. J Biol Chem. 1996;271:22146–22151. doi: 10.1074/jbc.271.36.22146. [DOI] [PubMed] [Google Scholar]
- 44.Ralph MR, Menaker M. GABA regulation of circadian responses to light. I. Involvement of GABAA-benzodiazepine and GABAB receptors. J Neurosci. 1989;9:2858–2865. doi: 10.1523/JNEUROSCI.09-08-02858.1989. [DOI] [PMC free article] [PubMed] [Google Scholar]
- 45.Randall A, Tsien RW. Pharmacological dissection of multiple types of Ca2+ channel currents in rat cerebellar granule neurons. J Neurosci. 1995;15:2995–3012. doi: 10.1523/JNEUROSCI.15-04-02995.1995. [DOI] [PMC free article] [PubMed] [Google Scholar]
- 46.Rawlings SR, Canny BJ, Leong DA. Pituitary adenylate cyclase-activating polypeptide regulates cytosolic Ca2+ in rat gonadotropes and somatotropes through different intracellular mechanisms. Endocrinology. 1993;132:1447–1452. doi: 10.1210/endo.132.4.8384987. [DOI] [PubMed] [Google Scholar]
- 47.Rawlings SR, Demaurex N, Schlegel W. Pituitary adenylate cyclase-activating polypeptide increases [Ca2+]i in rat gonadotrophs through an inositol trisphosphate-dependent mechanism. J Biol Chem. 1994;269:5680–5686. [PubMed] [Google Scholar]
- 48.Reppert SM, Weaver DR, Ebisawa T. Cloning and characterization of a mammalian melatonin receptor that mediates reproductive and circadian responses. Neuron. 1994;13:1177–1185. doi: 10.1016/0896-6273(94)90055-8. [DOI] [PubMed] [Google Scholar]
- 49.Schomerus C, Laedtke E, Korf HW. Calcium responses of isolated, immunocytochemically identified rat pinealocytes to noradrenergic, cholinergic and vasopressinergic stimulations. Neurochem Int. 1995;27:163–175. doi: 10.1016/0197-0186(95)00029-8. [DOI] [PubMed] [Google Scholar]
- 50.Schomerus E, Poch A, Bunting R, Mason WT, McArdle CA. Effects of pituitary adenylate cyclase-activating polypeptide in the pituitary: activation of two signal transduction pathways in the gonadotrope-derived αT3–1 cell line. Endocrinology. 1994;134:315–323. doi: 10.1210/endo.134.1.7903932. [DOI] [PubMed] [Google Scholar]
- 51.Shioda S, Shuto Y, Somogyvari-Vigh A, Legradi G, Onda H, Coy DH, Nakajo S, Arimura A. Localization and gene expression of the receptor for pituitary adenylate cyclase-activating polypeptide in the rat brain. Neurosci Res. 1997;28:345–354. doi: 10.1016/s0168-0102(97)00065-5. [DOI] [PubMed] [Google Scholar]
- 52.Shirakawa T, Moore RY. Responses of rat suprachiasmatic nucleus neurons to substance P and glutamate in vitro. Brain Res. 1994;642:213–220. doi: 10.1016/0006-8993(94)90924-5. [DOI] [PubMed] [Google Scholar]
- 53.Spengler D, Waeber C, Pantaloni C, Holsboer F, Bockaert J, Seeburg PH, Journot L. Differential signal transduction by five splice variants of the PACAP receptor. Nature. 1993;365:170–175. doi: 10.1038/365170a0. [DOI] [PubMed] [Google Scholar]
- 54.Strecker GJ, Wuarin JP, Dudek FE. GABAA-mediated local synaptic pathways connect neurons in the rat suprachiasmatic nucleus. J Neurophysiol. 1997;78:2217–2220. doi: 10.1152/jn.1997.78.4.2217. [DOI] [PubMed] [Google Scholar]
- 55.Tanaka K, Shibuya I, Nagatomo T, Yamashita H, Kanno T. Pituitary adenylate cyclase-activating polypeptide causes rapid Ca2+ release from intracellular stores and long lasting Ca2+ influx mediated by Na+ influx-dependent membrane depolarization in bovine adrenal chromaffin cells. Endocrinology. 1996;137:956–966. doi: 10.1210/endo.137.3.8603609. [DOI] [PubMed] [Google Scholar]
- 56.Tanaka K, Shibuya I, Harayama N, Nomura M, Kabashima N, Ueta Y, Yamashita H. Pituitary adenylate cyclase-activating polypeptide potentiation of Ca2+ entry via protein kinase C and A pathways in melanotrophs of the pituitary pars intermedia of rats. Endocrinology. 1997;138:4086–4095. doi: 10.1210/endo.138.10.5442. [DOI] [PubMed] [Google Scholar]
- 57.Tanaka K, Shibuya I, Uezono Y, Ueta Y, Toyohira Y, Yanagihara N, Izumi F, Kanno T, Yamashita H. Pituitary adenylate cyclase-activating polypeptide causes Ca2+ release from ryanodine/caffeine stores through a novel pathway independent of both inositol trisphosphates and cyclic AMP in bovine adrenal medullary cells. J Neurochem. 1998;70:1652–1661. doi: 10.1046/j.1471-4159.1998.70041652.x. [DOI] [PubMed] [Google Scholar]
- 58.Tanaka M, Matsuda T, Shigeyoshi Y, Ibata Y, Okamura H. Peptide expression in GABAergic neurons in rat suprachiasmatic nucleus in comparison with other forebrain structures: a double labeling in situ hybridization study. J Histochem Cytochem. 1997;45:1231–1237. doi: 10.1177/002215549704500906. [DOI] [PubMed] [Google Scholar]
- 59.Tang CM, Presser F, Morad M. Amiloride selectively blocks the low threshold (T) calcium channel. Science. 1988;240:213–215. doi: 10.1126/science.2451291. [DOI] [PubMed] [Google Scholar]
- 60.Taupenot L, Mahata SK, Wu H, O’Connor DT. Peptidergic activation of transcription and secretion in chromaffin cells: cis and trans signaling determinants of pituitary adenylyl cyclase-activating polypeptide (PACAP). J Clin Invest. 1998;101:863–876. doi: 10.1172/JCI1129. [DOI] [PMC free article] [PubMed] [Google Scholar]
- 61.van den Pol AN, Tsujimoto KL. Neurotransmitters of the hypothalamic suprachiasmatic nucleus: immunocytochemical analysis of 25 neuronal antigens. Neuroscience. 1985;15:1049–1086. doi: 10.1016/0306-4522(85)90254-4. [DOI] [PubMed] [Google Scholar]
- 62.van den Pol AN, Obrietan K, Chen G, Belousov AB. Neuropeptide Y-mediated long-term depression of excitatory activity in suprachiasmatic nucleus neurons. J Neurosci. 1996;15:5883–5895. doi: 10.1523/JNEUROSCI.16-18-05883.1996. [DOI] [PMC free article] [PubMed] [Google Scholar]
- 63.Vanecek J, Klein DC. Sodium-dependent effects of melatonin on membrane potential of neonatal rat pituitary cells. Endocrinology. 1992;131:939–946. doi: 10.1210/endo.131.2.1322288. [DOI] [PubMed] [Google Scholar]
- 64.Vanecek J, Klein DC. Mechanism of melatonin signal transduction in the neonatal rat pituitary. Neurochem Int. 1995;27:273–278. doi: 10.1016/0197-0186(95)00032-4. [DOI] [PubMed] [Google Scholar]
- 65.Vanecek J, Watanabe K. Melatonin inhibits the increase of cyclic AMP in rat suprachiasmatic neurons induced by vasoactive intestinal peptide. Neurosci Lett. 1998;252:21–24. doi: 10.1016/s0304-3940(98)00530-8. [DOI] [PubMed] [Google Scholar]
- 66.Vanecek J, Pavlik A, Illnerova H. Hypothalamic melatonin receptor sites revealed by autoradiography. Brain Res. 1987;435:359–362. doi: 10.1016/0006-8993(87)91625-8. [DOI] [PubMed] [Google Scholar]
- 67.Wagner S, Castel M, Gainer H, Yarom Y. GABA in the mammalian suprachiasmatic nucleus and its role in diurnal rhythmicity. Nature. 1997;387:598–603. doi: 10.1038/42468. [DOI] [PubMed] [Google Scholar]
- 68.Watanabe K, Yamaoka S, Vanecek J. Melatonin inhibits spontaneous and VIP-induced vasopressin release from suprachiasmatic neurons. Brain Res. 1998;801:216–219. doi: 10.1016/s0006-8993(98)00543-5. [DOI] [PubMed] [Google Scholar]
- 69.Welsh DK, Logothetis DE, Meister M, Reppert SM. Individual neurons dissociated from rat suprachiasmatic nucleus express independently phased circadian firing rhythms. Neuron. 1995;14:697–706. doi: 10.1016/0896-6273(95)90214-7. [DOI] [PubMed] [Google Scholar]