Abstract
We examined whether excitation and inhibition are balanced in hippocampal cortical networks. Extracellular field and single-unit activity were recorded by multiple tetrodes and multisite silicon probes to reveal the timing of the activity of hippocampal CA1 pyramidal cells and classes of interneurons during theta waves and sharp wave burst (SPW)-associated field ripples. The somatic and dendritic inhibition of pyramidal cells was deduced from the activity of interneurons in the pyramidal layer [int(p)] and in the alveus and st. oriens [int(a/o)], respectively. Int(p) and int(a/o) discharged an average of 60 and 20° before the population discharge of pyramidal cells during the theta cycle, respectively. SPW ripples were associated with a 2.5-fold net increase of excitation. The discharge frequency of int(a/o) increased, decreased (“anti-SPW” cells), or did not change (“SPW-independent” cells) during SPW, suggesting that not all interneurons are innervated by pyramidal cells. Int(p) either fired together with (unimodal cells) or both before and after (bimodal cells) the pyramidal cell burst. During fast-ripple oscillation, the activity of interneurons in both the int(p) and int(a/o) groups lagged the maximum discharge probability of pyramidal neurons by 1–2 msec. Network state changes, as reflected by field activity, covaried with changes in the spike train dynamics of single cells and their interactions. Summed activity of parallel-recorded interneurons, but not of pyramidal cells, reliably predicted theta cycles, whereas the reverse was true for the ripple cycles of SPWs. We suggest that network-driven excitability changes provide temporal windows of opportunity for single pyramidal cells to suppress, enable, or facilitate selective synaptic inputs.
Keywords: theta, sharp waves, oscillation, inhibition, EEG, temporal coding
Information in the brain is believed to be encoded within a representation that is distributed across large networks of neurons. Although the nature of such coding is not known, two opposing views have been advanced. According to the “frequency code” hypothesis, information is embedded in the rate of neuronal discharges. Synaptic inputs are integrated in the dendrites; the ratio of inhibition and excitation affects the overall probability of neuronal discharge, but precise spike timing of action potentials is left to chance (Barlow, 1972; Shadlen and Newsome, 1998). In contrast, the “temporal code” hypothesis suggests that spike times and patterns, relative to other neurons, encode the information (Abeles, 1982; Buzsaki, 1989; Gray and Singer, 1989; Hopfield, 1995). A key feature of the frequency code hypothesis is that the net excitatory and inhibitory inputs are balanced to maintain a proper dynamic range of spike discharge (Shadlen and Newsome, 1998). On the other hand, a transient gain of net excitation would facilitate the effect of an appropriately timed input, as predicted by the temporal code hypothesis (cf. Buzsaki and Chrobak, 1995). If we assume that population discharge of pyramidal cells and inhibitory interneurons reflects the net membrane polarization of an average neuron, parallel recording of neuronal activity from identified single neurons may be used to test these theoretical predictions.
Neurons of the hippocampal cortex are involved in a variety of different oscillations and intermittent population bursts, including rhythms at theta (5–10 Hz) and gamma (40–100 Hz) frequencies in the awake, exploring rat and during rapid eye movement (REM) sleep. During immobility, consummatory behaviors, and slow-wave sleep, intermittent population bursts in the CA3–CA1–subiculum–entorhinal cortex axis are associated with sharp waves (SPW) in the dendritic layers and with ultrafast (140–200 Hz) oscillations in the somatic layers, respectively (Vanderwolf, 1969; Buzsaki et al., 1983; Bland, 1986;Stewart and Fox, 1990; Chrobak and Buzsaki, 1996). The oscillatory context is imposed on the principal cells by networks of inhibitory interneurons (cf. Freund and Buzsaki, 1996), and the oscillatory waves can be conceived of as quantal packages of neuronal representations (Buzsaki and Chrobak, 1995; Hopfield, 1995; Lisman and Idiart, 1995;Skaggs et al., 1996).
The present experiments explored the involvement of pyramidal cells and interneurons in the various population patterns of the hippocampus in the behaving rat. Large discrepancies between excitation and inhibition were revealed within the oscillatory cycles of the various rhythms, as reflected by the activity differences of parallel-recorded pyramidal cells and interneurons. Interneurons could be classified into various functional groups on the basis of their involvement in population activity. We suggest that oscillating inhibitory networks may provide temporal windows for single cells to suppress or facilitate their synaptic inputs in a coordinated manner.
MATERIALS AND METHODS
Surgery and recording. The surgical procedures, electrode preparation, and implantation methods have been described (Csicsvari et al., 1998). In short, 16 male rats were implanted with either wire tetrodes or silicon electrode arrays that were used for the recording of neuronal activity. Wire tetrodes (Recce and O’Keefe, 1989) were constructed from four 13 μm polyimide-coated nichrome wires (H. P. Reid Co., Palm Coast, FL) bound together by twisting and then melting their insulation (Gray et al., 1995). Silicon electrode arrays were fabricated using the technology of integrated circuits. The shanks of the silicon probes were separated by either 150 or 300 μm. Each shank contained four or six recording sites (9 × 12 μm platinum pads) with 25 μm vertical spacings (Ylinen et al., 1995a). The electrodes were attached to a multidrive array, and the electrodes were slowly advanced until they reached the CA1 pyramidal layer. Two 50 μm single tungsten wires (with 2 mm of the insulation removed) were inserted into the cerebellum and served as ground and reference electrodes.
Data processing. Electrical activity was recorded during sleep while the rat was in its home cage followed by exploration in the home cage or during a wheel-running task for water reward (Buzsaki et al., 1983; Czurko et al., 1999). After amplification (5000–10,000×) and band-pass filtering (1 Hz–5 kHz; model 12–64 channels; Grass Instruments, Quincy, MA), field potentials and extracellular action potentials were recorded continuously using parallel-connected PC486 computers with ISC-16 analog-to-digital converter boards (12 bit resolution; RC Electronics, Santa Barbara, CA) or a 64 channel DataMAX system (16 bit resolution; RC Electronics). The recorded data were digitized continuously at 10 or 20 kHz. Recording sessions lasted from 15 to 50 min. After each recording session, the data were transferred to an 300 MHz pentium II personal computer running under the LINUX operating system and were stored on 4 mm digital audio tapes. The data were analyzed off-line.
Spike sorting. The continuously recorded wide-band signals were high-pass filtered (0.8–5 kHz) digitally. The power (root mean square) of the filtered signal was computed in a sliding window (0.2 msec) for spike detection (Bankman et al., 1993). The SD was calculated to estimate the variance of the baseline noise and to establish a detection threshold. Spikes with power of more than five times the SD from the baseline mean were extracted. The extracted spike waveforms were separated on the basis of their spike amplitude and waveshape. The spike waveforms were reconstructed to 40 kHz by using the principles of the sampling theorem (Press et al., 1992), and the peaks of the original and reconstructed waveforms were realigned. Instead of simple peak-to-peak measurement of the spike amplitude, all sampled amplitude values ± 0.5 msec from the peak were used to reduce noise-induced variance. The information encoded in the amplitude values was compressed using principal component analysis (PCA). Previously, the PCA method has been used successfully to discriminate units in single-electrode recordings (Abeles and Goldstein, 1977), and these principles were used here for multisite recordings. Typically, the first three principal components were calculated for each channel recorded by the electrode. Therefore, a single spike was represented by 12 waveform parameters as a 12-dimensional feature vector. Units were identified and isolated by a graphical-clustering method referred to as “cluster cutting” (Wilson and McNaughton, 1993; Skaggs et al., 1996). This technique exploits the observation that single units tend to form dense patches of points (clusters) when waveform parameters derived from different recording sites are displayed. A custom-made XWindow software (gclust) was used to plot selected pairs of waveform parameters and to select clusters by drawing a polygon around cluster borders. The program calculated the autocorrelograms of clusters to verify whether a chosen cluster represented the activity of a single cell. If no clear refractory period (<3 msec) was detected in the autocorrelogram, additional feature combinations were examined to subdivide the cluster further until a clear refractory period was present in the autocorrelogram. Only units with clear refractory periods are included in the present analysis. In addition, cross-correlation histograms of all possible pairs recorded from a given tetrode or silicon probe were calculated and examined for a symmetrical gap in the center bins. The presence of a gap (common refractoriness) indicated that the initial clusters represented activity of the same unit (Fee et al., 1996), and therefore those clusters were merged. These combined methods produced four to six (occasionally up to nine) well-isolated neuron clusters per electrode shank. Neurons with very low firing rates [“silent” cells (Thompson and Best, 1989)] could not be tested reliably with these methods and were excluded from the database.
After spike clustering, the spikes were extracted from the original wide-band (1 Hz–5 kHz) record, using a 9 msec window. The extracted wide-band spikes were averaged and reconstructed at an 80 kHz sampling rate.
Behavioral training. Methods of training in the wheel apparatus have been described previously (Czurko et al., 1999). Briefly, the rats were water deprived for 24 hr and trained to run continuously in a running wheel before surgery. The apparatus was a 30 cm × 40 cm × 35 cm box with an open top. The running wheel (10 cm wide; 29.5 cm in diameter) was attached to the side of the box. A drinking tube, 10 cm from the wheel and 5 cm above the floor, protruded from the back wall. A miniature loudspeaker was placed 10 cm above the drinking tube. A sound signal (2000 Hz) indicated the availability of water reward after a predetermined number of revolutions (5–20).
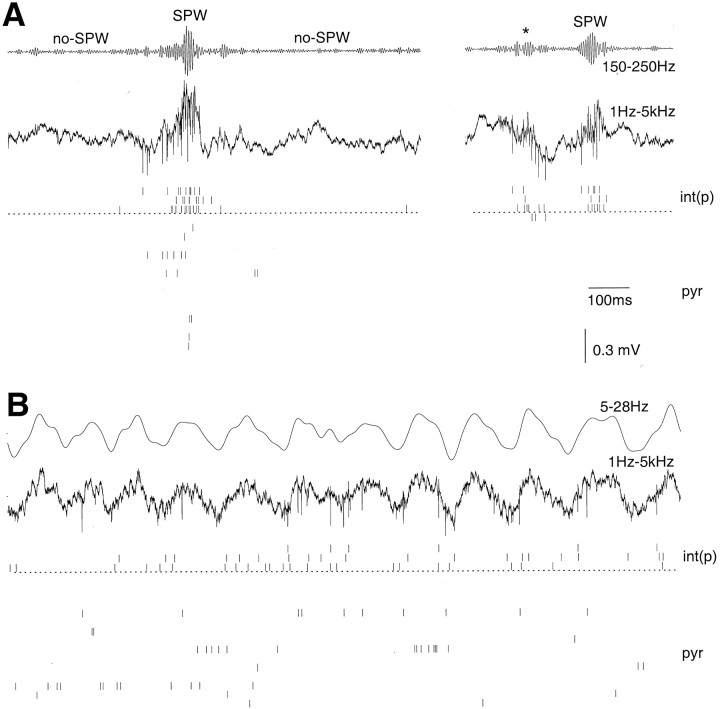
Detection of SPWs, ripples, and theta patterns. For the extraction of ripple waves, the wide-band recorded data were digitally band-pass filtered (150–250 Hz; Fig. 1). The power (root mean square) of the filtered signal was calculated for each electrode and summed across electrodes to reduce variability. During SPW-ripple episodes, the power substantially increased which enabled us to determine the beginning, peak, and end of individual ripple episodes. The threshold for ripple detection was set to 7 SDs above the background mean power. Epochs with <4 SD above the background mean power were designated no-SPW periods. Epochs with intermediate power were not included in the analysis (e.g., epoch marked by asterisk in Fig. 1). Theta epochs in the wheel-running task, exploration, and REM sleep were detected by calculating the ratio of the theta (5–10 Hz) and delta (2–4 Hz) frequency band in 2.0 sec windows. A Hamming window was used during the power spectra calculations. The theta–delta power ratio automatically marked periods of theta activity. The exact beginning and end of theta epochs during slow-wave sleep–REM sleep transitions sometimes were adjusted manually. Next, the individual theta waves were identified. The wide-band signal was digitally filtered in the 5–28 Hz range. This band was chosen empirically to avoid phase delays in peak detection. The negative peaks of the theta waves were detected because the positive peaks of the theta waves, recorded in strata oriens and pyramidale, were less prominent. The intervals between successive negative peaks served as reference time points for normalizing theta cycle durations.
Fig. 1.
Parallel recorded of interneurons and pyramidal cells in the CA1 pyramidal layer. A, Two epochs during slow-wave sleep. B, REM sleep. A, B, Traces, Filtered (upper) and wide-band (lower) traces recorded from one of the tetrodes. Vertical ticks, Action potentials of isolated neurons. Note the clustering of action potentials during sharp wave (SPW)-associated field ripples and the relative paucity of cell discharge between sharp waves (no-SPW). A, Right, A rare case without concomitant pyramidal cell discharge during SPW ripple. Asterisk, Small size ripple. Epochs like this were excluded from the analysis (see Materials and Methods). Positivity is up in this and all subsequent figures. int(p), Three interneurons in the CA1 pyramidal layer; pyr, 15 pyramidal cells recorded by four tetrodes.
Correlation analysis. Autocorrelation and cross-correlation functions were calculated separately during theta waves and SPWs and between SPWs. Because the number of action potentials used for the construction of autocorrelograms and cross-correlograms varied from cell to cell, the histograms were normalized by dividing each bin by the number of reference events. Thus, the histograms reflect discharge probabilities. For the calculation of the cross-correlation between SPW and unit discharges, the peak of the squared sum of the ripple was regarded as the reference point (time 0). Baseline activity was determined from the mean (± SD) firing rate in the −250 to −100 msec and 100 to 250 msec epochs. Modulation of unit activity during the SPW ripple was regarded significant if the mean discharge rate of the unit in the −100 to 100 msec time window was >3 SD from the baseline. Double-peak cells (see Results) had two significant peaks. The valley between the two peaks was regarded significant if the minimum bin value between the peaks was >3 SD from the peaks.
Phase correlations. The phase relationship between unit activity and field events was calculated in the following manner. Each spike was assigned to a given phase (bin size of 20°) of the normalized field cycle (ripple/theta). To reduce bin-border variability, we substituted the action potential times with a Gaussian kernel function. This procedure also low-pass filtered (smoothed) the histograms. Initially, half bin-width SDs were used for the kernel function. Thus, spikes with midbin phase increased the corresponding bin by 0.68. The phase calculation procedure was repeated with 2 and 4 SD kernel functions if the average histogram bin value was <20 and 10, respectively. Histograms with mean bin values of <five spikes were excluded from the analysis. Next, a sine wave was fit to the phase histogram to calculate the preferential phase of unit discharge. For the determination of preferred phase, only histograms with significant sine wave fit (p < 0.001) were considered.
Extracellular field estimation based on unit activity.Randomly selected epochs (60–100 sec for theta and 2–3 sec for ripple) were used to estimate the relationship between field and population discharges. The prefiltered extracellular fields were resampled (theta, 600 Hz; ripple, 5 kHz). Unit-spike trains were convolved with a Gaussian function; i.e., the Gaussian shape waves, centered at spike occurrence times, were summed to create an “analog” waveform. Gaussian waves with different SDs were used for theta and ripple estimation (theta, 16 msec; ripple, 0.6 msec). A multiple regression method was applied to estimate the filtered extracel- lular field pattern from the convolved spike trains. Interneurons and pyramidal cell discharges were used separately for these estimations. A correlation coefficient (r) was calculated to quantify the accuracy of the estimation. The mean of the Gaussian function was shifted for each cell during ripple calculations to obtain the highest correlation. This was done because interneurons could fire between the positive and negative peaks of the field, providing a poor correlation. The shifting procedure was not applied during theta estimation because the frequency of the theta waves varied (5–12 Hz) and therefore the procedure would not improve the estimation during theta rhythm. The calculations were performed with increasing numbers of pyramidal cells and interneurons, using all possible combinations or 50 randomly selected subsets of cells (whichever was smaller).
RESULTS
Extracellular identification of pyramidal cells and interneurons
Pyramidal layer interneurons [int(p)] and alveus and st. oriens interneurons [int(a/o)] were distinguished by their location. An interneuron was classified as being in the pyramidal layer when pyramidal neurons were also present in the recording. In addition to the unit activity, the presence of large amplitude fast-field oscillations (ripples), which are localized to the pyramidal layer, also assisted with the depth calibration of the electrodes (Buzsaki et al., 1992; Ylinen et al., 1995). Interneurons with cell bodies in the CA1 pyramidal layer [int(p)] include basket cells, chandelier cells, and a portion of bistratified neurons (Sik et al., 1995; Buhl et al., 1996; Ali et al., 1997). Interneurons in the alveus and stratum oriens [int(a/o)] were typically recorded in isolation from other cells. Besides depth, the main criterion for assigning a neuron to the int(a/o) group was the absence of simultaneously recorded pyramidal cells. Subsequent lowering of the microelectrode indicated the approximate distance of the cell body of the int(a/o) neuron from the pyramidal layer.
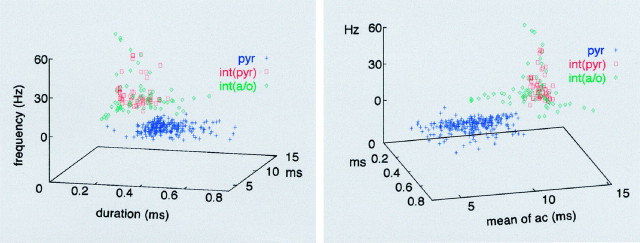
Three independent criteria were used to separate pyramidal cells from interneurons. These included discharge frequency (Ranck, 1973;Fox and Ranck, 1981; Buzsaki et al., 1983), spike duration (Wilson and McNaughton, 1993; Skaggs et al., 1996), and the autocorrelation function (Fig. 2). In general, pyramidal cells discharged at a low rate [1.4 ± 0.01 Hz (mean ± SE); n = 246] when long epochs were considered, in contrast to the faster-firing int(p) (14.1 ± 1.43 Hz; n = 55) and int(a/o) (13.0 ± 1.62;n = 68) interneurons (F = 117.7;p < 0.001; ANOVA). Nevertheless, some interneurons in both groups had overlapping firing rates with those of the pyramidal cells. The average duration of wide band-filtered (1 Hz–5 kHz) pyramidal cell spikes (0.44 ± 0.005 msec), measured at 25% of maximum spike amplitude, was significantly different from that of the int(p) (0.22 ± 0.007 msec) and int(a/o) (0.24 ± 0.01 msec;F = 274.1; p < 0.001) interneurons, but, again, there was some overlap between the pyramidal cells and putative interneurons. The discharge dynamics of pyramidal cells and putative interneurons were also characteristically different. Pyramidal cells occasionally fire complex-spike bursts of two to seven spikes at 3–5 msec interspike intervals (Ranck, 1973). This feature was reflected by a peak at 3–5 msec in the autocorrelograms, followed by a fast exponential decay. In contrast, the autocorrelograms of putative interneurons showed a slow decay. The average first moment of the autocorrelogram (i.e., the mean value) for pyramidal cells was 7.1 ± 0.12 msec, compared with the significantly longer values in int(p) (12.7 ± 0.05 msec) and int(a/o) (12.0 ± 0.17 msec;F = 545.2; p < 0.001).
Fig. 2.
Physiological identification of pyramidal cells and interneurons by extracellular recording. Three independent parameters of extracellular spikes are plotted in the three-dimensional space. x-axis, Duration of the extracellular spike (filtered at 1 Hz and 5 kHz) measured at 25% of spike amplitude.y-axis, The first moment (mean) of the spike autocorrelogram (ac). z-axis, Firing rate. Two views are shown. Note the clear separation of thepyr from the interneuron clusters. Note also the tight cluster formed by int(p). int(a/o), Interneurons recorded in the alveus and stratum oriens.
The combination of firing frequency, spike duration, and the mean value of the autocorrelation yielded two distinct clusters of units, which we then assigned pyramidal cell and interneuron designates (Fig. 2). There were still four ambiguous neurons that were recorded in the st. oriens and alveus. One of these four cells was designated a displaced pyramidal cell (Freund and Buzsaki, 1996) because its physiological criteria, including its spike shape, met those of the pyramidal neurons. The remaining three neurons were slow-firing, bursty cells (see below). However, their waveform was distinctly different from pyramidal cells, and therefore they were classified putatively as int(a/o) interneurons.
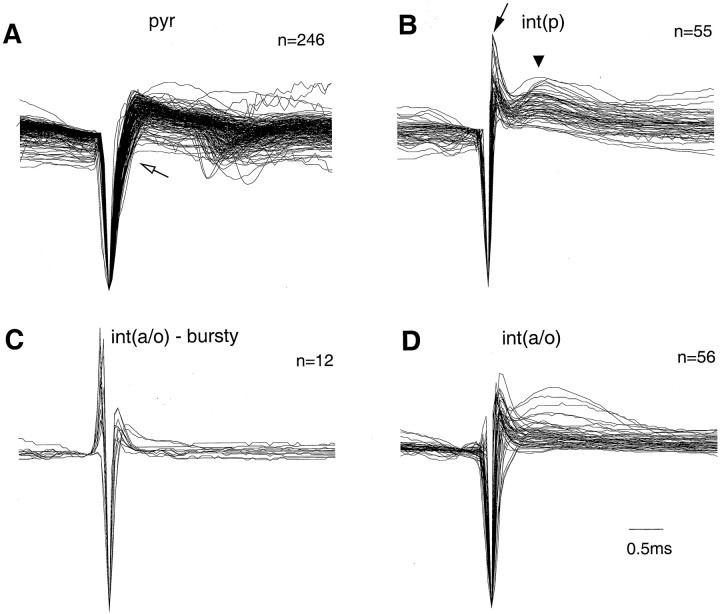
In addition to spike duration, the waveforms of pyramidal cells and interneurons were characteristically distinct. Figure3 illustrates the amplitude-normalized trace of each recorded neuron in the different groups. The waveform of interneurons in the int(p) group had the smallest variability. The initial negative phase of the extracellular spike arose from a relatively flat baseline. The ascending phase had a sharp deflection followed by a positive hump at a latency (1.1 msec from the beginning of the spike) that corresponds in time to the spike afterhyperpolarization of the intracellular action potentials observed previously in vivo (Sik et al., 1995). The slope change on the ascending phase was less conspicuous than in pyramidal cells, indicating that the kinetics of Na+ and K+ is different in these interneurons from that of the pyramidal cells. In accordance with their similar waveforms, neurons in the int(p) group formed a relatively tight cluster (Fig. 2). In contrast, the int(a/o) group contained a more heterogeneous set of cells. Fourteen percent of the int(a/o) interneurons had a relatively slow overall firing rate (<5 Hz) but had fast bursts of spikes (see below). The waveforms of most of these neurons were different from all other recorded cells (Fig. 3, bursty). The waveform began with a positive deflection with an amplitude that was 30–80% of the following negative component. We interpret this observation as an indication that the extracellular recording electrode was monitoring from the close vicinity of a large dendritic segment or the soma (“juxtacellular” recording). In summary, the combined criteria reliably separated interneurons with short-duration spikes and/or high frequency from pyramidal cells. Nevertheless, units with waveform and firing pattern similar to that of pyramidal cells should be considered putative interneurons.
Fig. 3.
Waveform differences of pyramidal cells and interneurons. Superimposed average traces of all pyramidal cells and putative interneurons. The waveforms (averages ofn > 200 individual spikes) were amplitude normalized for this display. Filters settings were 1 Hz and 5 kHz.A, Note the wider negative spike component ofpyr and a change in slope of the ascending phase (open arrow). B, Note also the uniform waveforms of the putative int(p). The sharp positive spike (filled arrow) usually is followed by another positive component at 0.8 msec (triangle).C, D, Putative int(a/o)displayed more variability. Waveforms of cells with fast (>250 Hz) bursts (see Fig. 10C) are shown separately (bursty). Note that in most bursty cells the waveform is characterized by an early positive component.
Discharge frequency and variability in pyramidal cells and interneurons
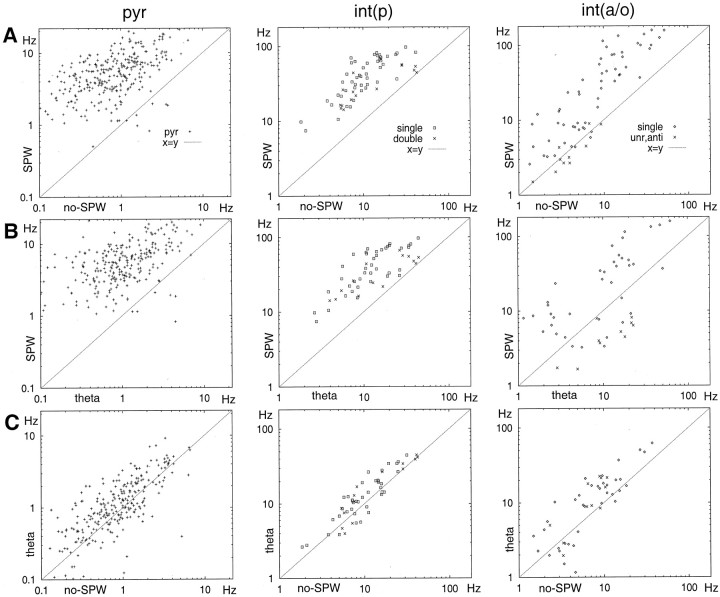
The discharge rate changes in different behavioral states are shown in Figure 4 for all neurons. The long-term firing rates of both pyramidal cells (theta, 1.4 ± 0.10 Hz; nontheta, 1.4 ± 0.09 Hz) and int(p) interneurons (theta, 16.3 ± 1.52 Hz; nontheta, 14.3 ± 1.32 Hz) were similar during theta and nontheta behaviors. The int(a/o) group, on the other hand, was significantly more active during theta than during the nontheta state (theta, 11.9 ± 1.50 Hz; nontheta, 8.3 ± 1.02 Hz; t = 7.0; p < 0.001; pairedt test). When the nontheta state was further divided into SPW and no-SPW epochs, the mean SPW/no-SPW ratios of discharge rate were 8.6 ± 0.44, 3.8 ± 0.20, and 2.8 ± 0.25 for pyramidal cells and int(p) and int(a/o) interneurons, respectively.
Fig. 4.
Comparison of the discharge frequency of individual neurons during different behavioral states. SPWs were associated with a large increase in firing rate in all groups. Interneurons were subdivided further according to their histograms during SPW as “SPW-unrelated” (unr), anti-SWP (anti), and single peak neurons (see Figs. 7, 8). There was no obvious difference in firing rate between single-peak (single) and double-peak (double) int(p) interneurons (see Fig. 8).
The coefficient of variation (CV) of spike discharges indicated that the interspike intervals did not follow a Poisson rule. CV values were similar in the two states for pyramidal cells (theta, 2.07 ± 0.06; nontheta, 2.03 ± 0.1; p > 0.05) but significantly different for both int(p) (theta, 1.53 ± 0.11; nontheta, 1.99 ± 0.02; p < 0.001) and int(a/o) (theta, 1.61 ± 0.10; nontheta, 2.44 ± 0.29;p < 0.002) interneurons. Note that for a Poisson process, CV is 1 (Softky and Koch, 1993). These large CV values could be explained by the relatively long pauses between active discharges, because CV values were much smaller during both theta [pyr, 1.05; int(p), 0.65; int(a/o), 0.74] and nontheta [pyr, 1.14; int(p), 0.72; int(a/o), 0.79] states when only interspike intervals < 100 msec were included in the analysis.
Phase relationship of interneurons and pyramidal cells to theta activity
Theta waves recorded from the alveus and strata oriens and pyramidale are highly coherent, and the waves have zero phase lags relative to one another. A large phase shift of the theta phase appears only in the apical dendritic layers (Winson, 1974; Buzsaki et al., 1983). Therefore, the local field, recorded simultaneously with unit activity, can serve as a reliable reference for comparing the theta phase-unit relationship. Because the frequency of theta activity varied during both awake locomotor activity and REM sleep, successive theta waves were normalized, and the spike discharges were referenced to the phase of the theta cycle (see Materials and Methods).
The relationship between theta activity and unit firing was studied quantitatively in two different ways. First, theta cycle-unit phase histograms were calculated and averaged across neurons. With this method, all recorded cells contributed to the overall average histogram, independent of whether the cell was phase-modulated by the theta waves or not (Fig. 5C). Second, the preferred phase of the theta cycle for a given neuron was determined quantitatively, and the preferred phase values were displayed in a histogram. For this histogram, only units with significant phase modulation (see Materials and Methods) were included (Fig. 5B). The discharge frequency, preferred theta phase, and magnitude of theta cycle modulation of firing frequency showed some variability in all cell groups. The great majority of pyramidal cells and interneurons that had significant theta phase preference fired on the negative phase of the local theta waves (Fig. 5B). This conclusion is further supported by the discharge probability of all neurons (Fig. 5C). The positive phase of the local theta waves was associated with the least probability of discharge of both pyramidal cells and interneurons. Less than 5% of neurons in any cell group discharged preferentially on the positive portion of theta waves. The int(p) and int(a/o) groups discharged earlier (60 and 20°, respectively) than the population peak activity of the pyramidal neurons. The relative magnitude of discharge frequency modulation of pyramidal cells and interneurons within the theta cycle is illustrated in Figure 5D. Neurons in the int(a/o) group, as a whole, had a relatively shallow theta depth modulation, similar to pyramidal cells. On the other hand, int(p) cells showed a much stronger phase modulation. Two int(a/o) neurons were “antitheta” cells (Buzsaki et al., 1983; Bland and Colom, 1989; Mizumori et al., 1990). These neurons were virtually silent during theta (<0.05 Hz). During no-SPW epochs, they fired at 1.3 and 4.6 Hz, respectively. One of them doubled its discharge rate during SPW, whereas the other antitheta neuron decreased its firing frequency during SPW (anti-SPW, antitheta cell). It should be emphasized that the above group comparisons are somewhat arbitrary. Whereas the individual int(p) cells were relatively homogeneous in terms of theta modulation and theta phase, neurons in the int(a/o) group showed a large individual variability.
Fig. 5.
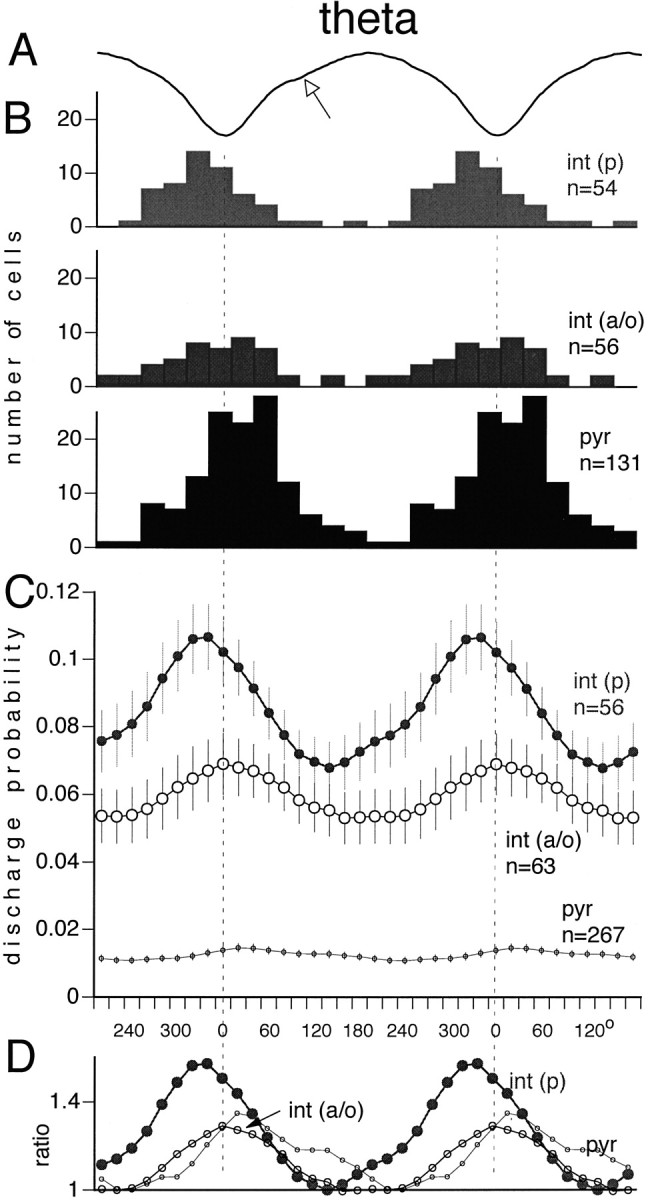
Theta phase modulation of pyr,int(p), and int(a/o). A, Averaged field theta wave. Two theta cycles are shown to facilitate phase comparison with unit discharges. The arrowindicates a “notch” in the waveform, typical in the theta wave of strata oriens and pyramidale. B, Phase distribution of single cells relative to the negative peak of the locally recorded theta waves (dashed vertical lines). The peak of the theta phase histogram was used to determine the preferred phase of a single cell. Only neurons with significant phase modulation are shown (see Materials and Methods). C, Average discharge probability of the neuronal subgroups (mean ± SE). All neurons are included, independent of whether their cross-correlograms showed a significant modulation with theta waves or not. Note thatint(p) preceded pyramidal neurons by ∼60°.D, Normalized probabilities of the different cell groups (depth of theta modulation). The lowest probability value during the theta cycle was regarded as the baseline for each neuronal type, and the probabilities were divided by this value. Note that the strongest inhibition occurs before the highest probability of pyramidal cell discharge.
Discharge patterns of pyramidal cells and interneurons during SPW-associated ripples
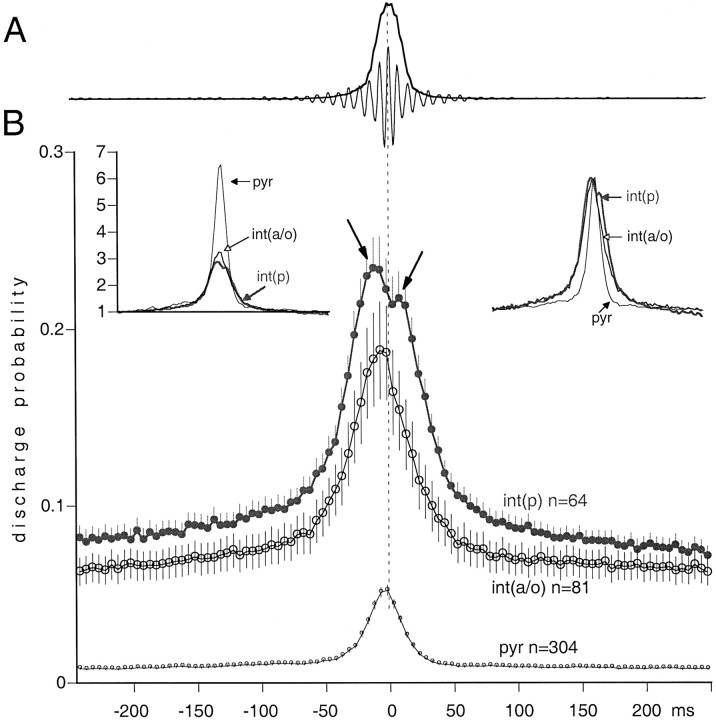
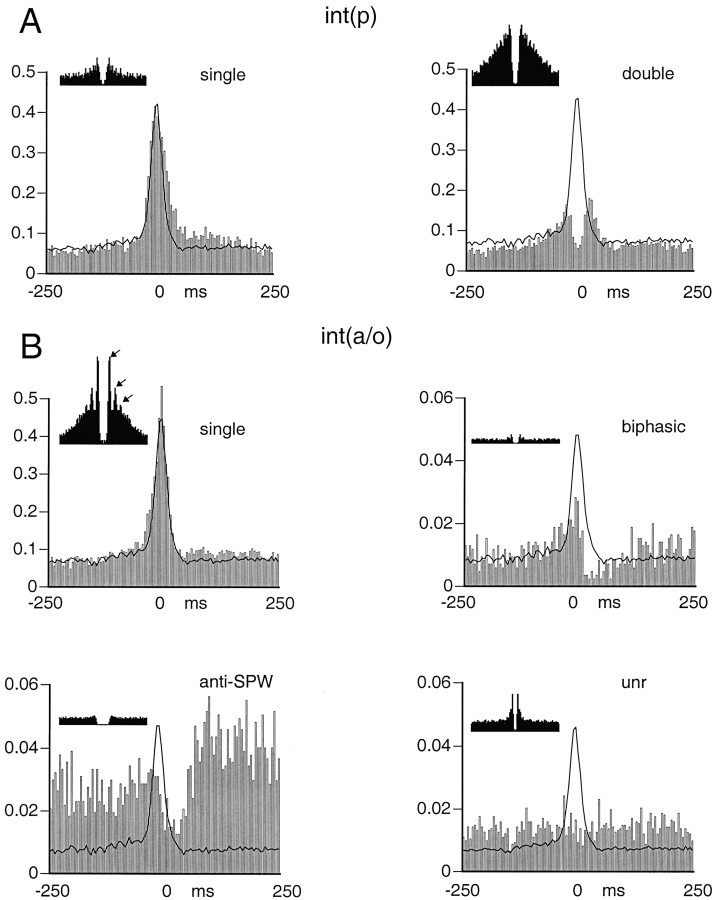
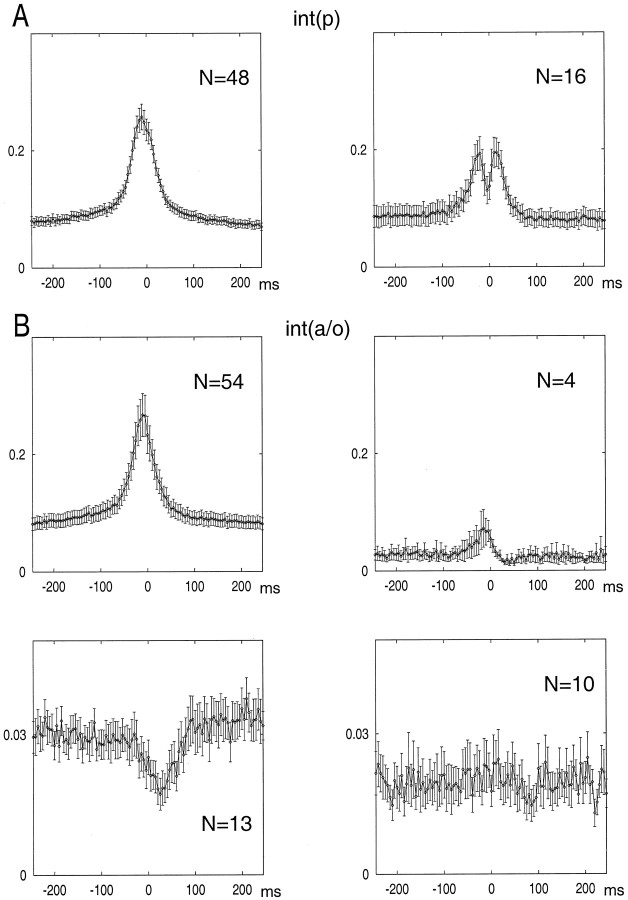
For the quantification of the temporal relationship between neuronal discharge and SPWs, the largest peak of the field ripple served as a reference point. All three cell groups increased their discharge probability during SPWs (Fig.6), but the magnitude of increase was quite different. Interneurons in both groups increased approximately threefold relative to the no-SPW baseline period. In contrast, pyramidal cells increased 6.6-fold at the peak of the SPW compared with that of no-SPW epochs (Fig. 6, left inset). Interneurons in both groups began to discharge earlier than did pyramidal cells, and their discharge frequency decayed more slowly than did that of the pyramidal cells, as indicated by the amplitude-normalized histograms (Fig. 6, right inset). On average, int(p) neurons discharged earlier than pyramidal cells and int(a/o) cells, and the histogram had an additional peak after the maximum discharge probability of pyramidal cells. Subsequent analysis of int(p) neurons revealed that they could be classified into two well-defined groups. Sixteen of the 64 cells had two peaks. In this group, the early and late peaks preceded and followed the peak discharge of pyramidal cells by 15–25 and 10–30 msec, respectively (Figs. 7A,8A). Between the early and late peaks, the discharge probability often returned to baseline level. Visual analysis of the original traces indicated that these interneurons fired spikes at both latencies during a single SPW event. The second group of int(p) neurons (n = 48) had a single peak that coincided with the peak of the ripple. The width of the histogram peak of these neurons was narrower than that of the double-peak group.
Fig. 6.
Discharge probability of pyr,int(p), and int(a/o) during hippocampal SPW-associated ripples. A, Averaged field ripple wave (thin line) and integrated, squared sum of the ripple (thick line). Neuronal discharges were aligned to the peak of the integrated ripple (time 0).B, Averaged discharge probability of the neuronal subgroups (mean ± SE). Left inset, Normalized probabilities. Each point of the probability curve was divided by the baseline discharge probability (averages of points between −250 and −200 msec). Note the 2.5-fold increase of discharge probability of pyramidal cells relative to that of interneurons during the peak of the ripple. Right inset, The probability distributions of the three groups shown at the same relative scale (0–100%). Note the earlier and longer-lasting discharge of interneurons relative to pyramidal cells.
Fig. 7.
Subsets of interneurons show different ripple-associated firing patterns. Single-cell examples are shown.A, Discharge probabilities of singleint(p). B, Discharge probabilities ofint(a/o). Time 0 (reference) corresponds to the peak of the ripple (see Fig. 6). Continuous lines, Averaged discharge probability of simultaneously recorded pyramidal neurons (n = 11–26).Insets, Autocorrelograms of spike times;x-axis, 100 msec. A,Single, Interneuron with single peak.Double, Interneuron with double peaks before and after the maximum activity of pyramidal cells. B,Single, Int(a/o) interneuron with single peak. Note several peaks (arrows) in the autocorrelogram, corresponding to ripple frequency.Biphasic, Interneuron with a small peak and suppression of neuronal discharge after the maximum activity of pyramidal cells.Anti-SPW, Anti-SPW interneuron. Note the suppression of discharge after the maximum activity of pyramidal cells.
Fig. 8.
Group data for the interneuron types shown in Figure 5. A, Int(p) had either a single peak (left) or double peaks (right) before and after the maximum discharge probability of pyramidal cells.B, Most int(a/o) had a single peak (upper left), whereas others were either suppressed after the population discharge of pyramidal cells (lower left; anti-SPW cells) or were not affected by the SPW burst (lower right; SPW-independent cells). A few cells had a significant suppression after an initial excitation (upper right).
Int(a/o) neurons showed four different types of activity during SPW (Figs. 7B, 8B). The majority (n = 54) had a well-defined single peak, similar to the single-peak int(p) group. In the second group (n = 13), only a decrease in discharge probability was observable without a preceding increase. We termed these neurons “anti-SPW” cells. The third group of int(a/o) neurons (n = 10) were not affected by the large population synchrony of pyramidal cells (“SPW-independent” group). Most neurons in the anti-SPW and SPW-independent groups were slow-firing bursty cells (see below). In the remaining four cells, the initial small peak was followed by a significant decrease in discharge probability at 25–30 msec after the peak. None of the interneurons in the int(a/o) group had double peaks.
During the SPW event, the neuronal population oscillates at 140–200 Hz, as reflected by the fast-field ripple. Phase locking and depth modulation of neurons during the ripples were determined the same way as in the analysis of theta activity. The maximum probability of pyramidal cell discharge occurred during the negative peaks of the field ripple (Fig. 9). The preferred phase of discharge for both interneuron groups was ∼90° after the negative peak. This phase difference corresponded to 1.2–2.0 msec delays between the peak activity of pyramidal cells and interneurons. The strongest modulation of neuronal discharges within the ripple cycle occurred in the int(a/o) group. Several int(a/o) neurons discharged at virtually every cycle of the ripple waves. This high level of ripple modulation was reflected by their periodic autocorrelograms (e.g., Fig.7B, inset). Anti-SPW and SPW-independent neurons did not emit a sufficient number of action potentials during the observation period to assess their phase locking to ripple frequency reliably.
Fig. 9.
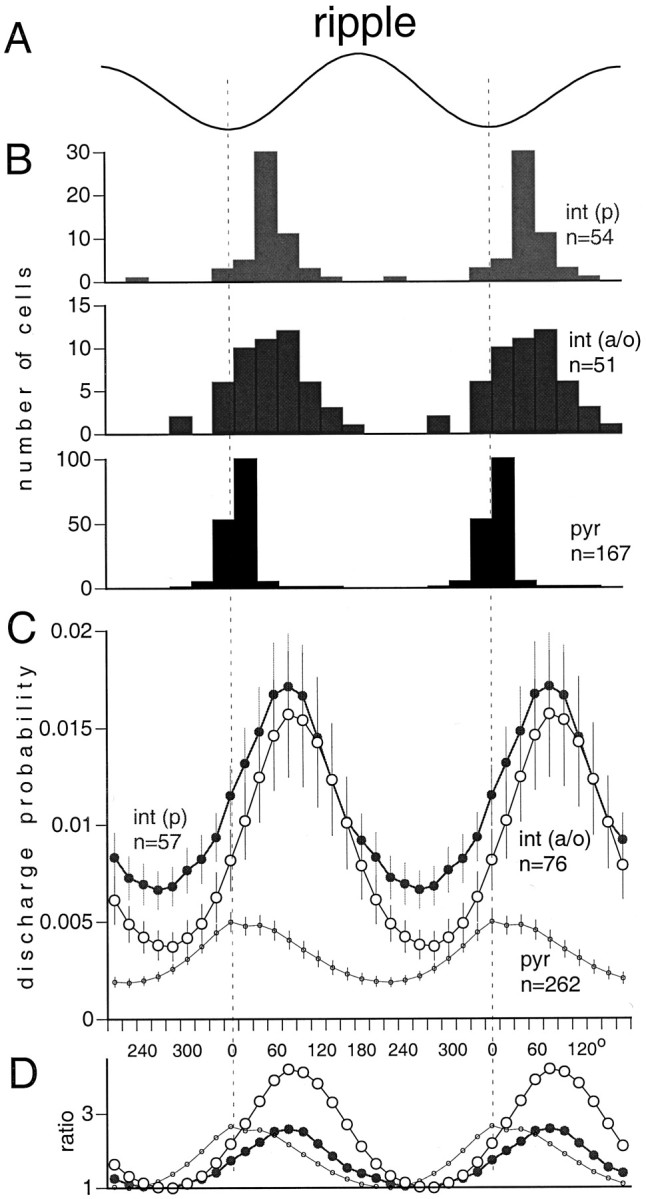
Ripple phase modulation of pyr,int(p), and int(a/o). A, Averaged field ripple wave (two cycles shown). B, Phase distribution of single cells relative to the negative peak of the ripple waves (dashed vertical lines). The peak of the phase-corrected cross-correlogram between cell discharge and ripple was used to determine the preferred phase of a single cell. Only neurons with significant ripple phase modulation are shown. C, Averaged discharge probability of the neuronal subgroups (mean ± SE). All neurons are included, independent of whether their cross-correlograms showed a significant modulation with the ripple waves or not. D, Normalized probabilities of the different cell groups (depth of ripple modulation). The lowest probability value during the ripple cycle was regarded as the baseline for each neuronal type, and the probabilities were divided by this figure. Note that interneurons follow pyramidal neurons by 90° (∼1.2 msec for a 200 Hz ripple).
Estimation of field patterns from neuronal interactions
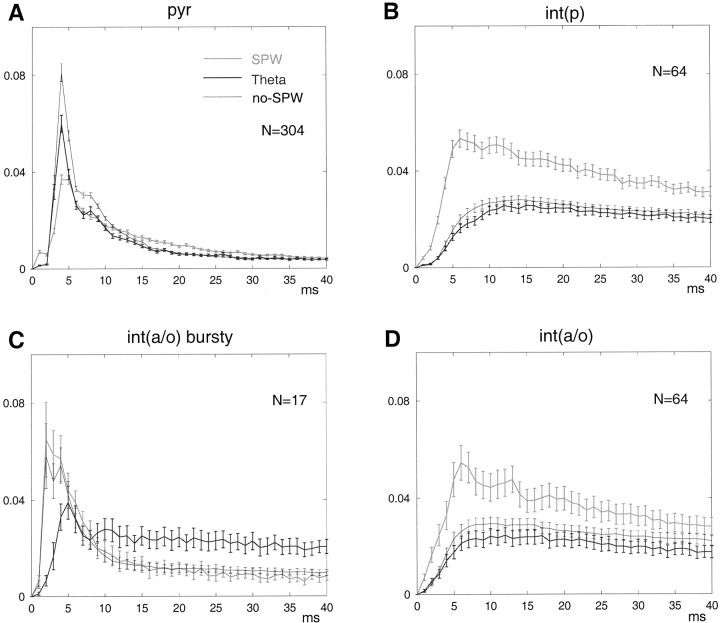
A major part of the extracellular current flow derives from synaptic activity and intrinsic oscillatory properties of the cell membrane, both of which may correlate with the discharge probability of neurons. The spike discharge pattern of single cells was dependent on the state of the network as reflected by changes in the autocorrelation function of the neurons (Fig. 10). Autocorrelation functions were calculated separately for spikes that occurred during theta state and SPWs and between SPW bursts (no-SPW; see Fig. 1). The autocorrelograms of pyramidal cells had prominent peaks between 3 and 4 msec during theta and between SPW bursts, corresponding to the complex-spike bursts these neurons emit. The peak shifted partially to the 5 msec bin during SPW bursts, suggesting that spike timing was under the control of population cooperativity at ripple frequency. The fast decay of the histogram indicated that, on average, pyramidal cells discharged at a low frequency, except when the neuron fired a complex-spike pattern. When autocorrelograms were calculated for a longer epoch (0.5 sec), some neurons had a small peak at 130–160 msec (i.e., at theta frequency; data not shown). The autocorrelograms of int(p) neurons, constructed from spikes collected during theta epochs and between SPW bursts, had broad peaks between 10 and 25 msec, corresponding to their preferred-firing frequency in the gamma band (40–100 Hz) (Bragin et al., 1995). During SPW, the peak shifted to 4–10 msec, indicating that int(p) neurons were phase-locked to the fast ripple waves. The majority of int(a/o) neurons showed similar autocorrelograms and state dependence to those of the int(p) neurons (Fig. 9).
Fig. 10.
State-dependent discharge patterns inpyr (A), int(p)(B), and int(a/o)(C, D). Autocorrelograms were calculated for each network state (theta, SPW, andno-SPW). A, Note the large, sharp peaks at <5 msec, indicating complex-spike bursts of pyramidal cells.B, D, Note also peaks during SPW at 6 msec in int(p) (B) and mostint(a/o) (D) interneurons.C, A subgroup of int(a/o) displayed high frequency (>300 Hz) burst discharges.
A portion of int(a/o) neurons (n = 17) had a slow discharge rate (<5 Hz) and bursts of fast spikes (Fig. 10C,bursty). The interspike interval during the spike burst was 2–3 msec, consistent with our visual observation that these cells fired bursts of three to eight action potentials at 300–500 Hz. The bursts occurred during SPWs or between SPWs but rarely during theta activity. This bursting pattern was faster and longer than that of the pyramidal neurons. In addition, the waveform of this minority int(a/o) subgroup was different from that of the pyramidal cells (Fig. 3). Finally, neurons in this subgroup increased their firing rate during theta state, a further distinction from pyramidal cells. Most cells in this group belonged to the anti-SPW and SPW-independent classes of int(a/o) neurons.
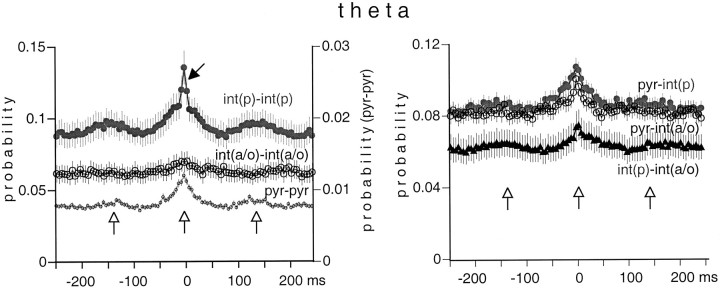
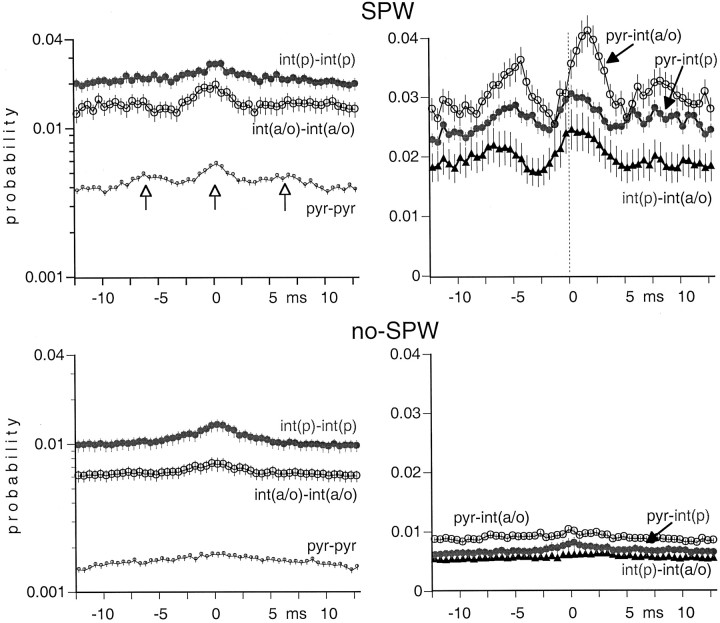
The next analysis examined the summed pairwise cross-correlograms within the same groups and across groups. Theta modulation was present in all comparisons (Fig. 11). It was least expressed in int(a/o)–int(a/o) pairs, although there were large individual differences within this group. There was a sharp 15-msec-wide peak on top of the wider theta peak in the cross-correlogram of int(p)–int(p) pairs, indicating that interneurons in the pyramidal layer are entrained in both gamma and theta oscillations (Bragin et al., 1995). During SPW epochs, the cross-correlograms revealed ripple-related rhythmicity (Fig.12). The time-shifted peaks of the cross-correlograms (<2 msec) between different cell groups provide support for the presence of a monosynaptic delay between pyramidal cells and interneurons (Csicsvari et al., 1998). In the absence of SPW and theta (no-SPW), no rhythmicity was apparent in the cross-correlograms.
Fig. 11.
Averaged cross-correlograms of cell pairs during theta oscillation. Note the rhythmic peaks in the cross-correlograms ofint(p)–int(p) andpyr–pyr pairs (left) andint(p)–int(a/o) pairs (right) at theta frequency (vertical open arrows). The narrow peak in theint(p)–int(p) histogram (left) reflects a prominent gamma frequency oscillation of these neurons (black arrow).
Fig. 12.
Averaged cross-correlograms of cell pairs during SPW bursts and between SPW events (no-SPW). Note the rhythmic peaks in the histogram of pyramidal neurons (vertical open arrows). Note also the time-shifted peaks of pyr–int(a/o) pairs. The discharge probabilities during no-SPW epochs were low for each group.
The state-dependent firing patterns and their interactions suggested that their summed activity can predict ongoing field activity. When two or more interneurons were recorded simultaneously, their summed activity mimicked the cyclic changes of theta activity (Fig.13). Extrapolation from the slopes of interneuronal correlations suggested that 25–30 simultaneously recorded interneurons could describe the field theta with 80% accuracy. In contrast, the correlation between theta and summed pyramidal activity was poor. Extrapolation from the slopes indicated that even as many as 100 pyramidal cells could provide a <0.6 correlation coefficient. The relationship between SPW-associated ripples and pyramidal activity was better, as indicated by the higher correlation coefficient values. The converse was true for interneurons, because their correlation with ripples was poorer than that with theta. Indeed, some interneuron ensembles exhibited lower correlation with ripples than did the same number of pyramidal neurons.
Fig. 13.
Correlation between field activity and population discharge of neurons. A, A short segment of theta activity (theta) and summed activity of 3int(p) and 16 pyr. Note the similarity between theta field and summed interneuron activity. B, The square of the mean correlation coefficients between unit activity and theta plotted as a function of the number of simultaneously recorded neurons. Note that interneurons (int) showed a more reliable relationship with theta than did pyramidal cells.Asterisk, Three of the six interneurons recorded from the alveus and st. oriens. C, The square of the mean correlation coefficients between unit activity and ripple cycles plotted as a function of the number of simultaneously recorded neurons during ripple. Note that pyramidal cell ensembles predict ripples more reliably than theta, but the reverse is true for interneurons.
DISCUSSION
The findings of the present experiments indicate that (1) network state changes covary with changes in spike dynamics of single cells and their interactions, (2) the timing of spikes is related to population rhythms, (3) large discrepancies emerge between net excitation and inhibition both within and across various rhythms, and (4) the coefficient of variation of spike intervals of each cell type was different from unity. During theta oscillations, interneurons constituted a relatively homogeneous group. In contrast, sets of the same interneurons demonstrated differential discharge rates during SPWs. Our findings support the hypothesis that cyclic variation of excitation and inhibition provides temporal windows of opportunity to selectively ignore or enhance the effectiveness of presynaptic activity. Viewing from a broader perspective, the periodically changing excitability of cortical pyramidal cells may form the basis for temporal coding of neuronal information (Gray and Singer, 1989; Buzsaki and Chrobak, 1995; Hopfield, 1995). These observations therefore are in contrast to the suggestion that inhibition and excitation are balanced in cortical networks and that spike times of cortical cells can be described by a simple Poisson process (Softky and Koch, 1993; Bair and Koch, 1996; Shadlen and Newsome, 1998).
Cyclic changes of hippocampal excitability during theta rhythm
Theta rhythm is the most prominent oscillatory pattern in the hippocampal formation (Green and Arduini, 1954). Although the function of the theta activity has not been clarified, theta oscillation does have a large impact on the coordination of neuronal discharges within and across various hippocampal regions (Rudell et al., 1980; Buzsaki et al., 1981; Pavlides et al., 1988; Huerta and Lisman, 1995). The discharge probabilities of both pyramidal cells and interneurons varied as a function of the theta cycle. If pyramidal cells were excited by random inputs, independent of the afferents driving the interneurons, one might expect that pyramidal cells should discharge when interneurons are relatively silent, as is the case in the anesthetized rat (Buzsaki et al., 1983; Ylinen et al., 1995b; Fox et al., 1996; Kamondi et al., 1998b). However, this was not the case in the drug-free animal. On average, int(p) and int(a/o) interneurons discharged 60 and 20° before the pyramidal cells, respectively (see also Skaggs et al., 1996). The discrepancy may be explained by the observation that the action potentials of pyramidal cells undergo a phase precession in the theta cycle while the rat crosses the “place field” of the recorded unit (O’Keefe and Recce, 1993) and by the assumption that several of our recorded neurons were place cells. Our observations therefore suggest that a place cell should discharge in the face of progressively stronger inhibition at earlier phases of the theta cycle as the rat moves toward the center of the place field. The behavior-dependent phase shift of pyramidal cell spikes may also explain why even large numbers of simultaneously active pyramidal cells predicted the field theta activity so poorly.
SPW and ripples: physiological implications
The hippocampal SPW originates in the recurrent network of CA3 neurons (Buzsaki et al., 1983), whose Schaffer collaterals excite the dendritic fields of CA1 pyramidal cells and interneurons. The synchronous depolarization of CA1 neurons sets into motion a dynamic interaction between interneurons and pyramidal cells, reflected by an oscillatory field potential (ripple) at 140–200 Hz in stratum pyramidale (Buzsaki et al., 1992). The specific synaptic currents mediating the ripple oscillation are believed to be synchronized somatic IPSPs of CA1 pyramidal neurons (Ylinen et al., 1995a).
The mechanism by which highly coherent discharge of pyramidal cells is brought about over the entire dorsal CA1 region during the ripple is not understood, however (Chrobak and Buzsaki, 1996). Three different hypotheses have been advanced for the explanation of the spatial coherence of fast ripples. The first assumes that the CA3 output produces a voltage-dependent fast discharge in the interneurons and that synchronization of the interneurons is mediated by gap junctions (Katsumaru et al., 1988). A second explanation is based on the reciprocal connections between the interneuronal and pyramidal cell populations. Fast oscillatory discharges in interneurons would, again, be brought about by the ramp-like depolarizing CA3 output. Chance discharge of just a few CA1 pyramidal cells within ∼1 msec is hypothesized to reset ongoing oscillatory spiking in the target interneurons and to generate a short-lived coherent discharge (Ylinen et al., 1995a). According to the third hypothesis, zero-time lag synchronization of pyramidal neurons is brought about by assumed gap junctions between their axons (Draguhn et al., 1998). Our observation that interneurons in both int(p) and int(a/o) groups followed the maximum discharge probability of pyramidal neurons by 1–2 msec supports the latter two models. Furthermore, the finding that the summed activity of pyramidal cells was often as good a predictor of ripple waves as interneurons also supports the primary importance of pyramidal cell discharge. Analysis of the spike dynamics of single cells provided further clues to the possible synchronizing mechanism. The gap junction hypothesis predicts that ripple frequency is determined by the interspike intervals of bursting pyramidal neurons. However, in our experiments the ripple frequency was lower (<200 Hz) than predicted by the interspike intervals of pyramidal cells during theta and the no-SPW epoch (>250 Hz). Even during SPW there was a mismatch between the peak of the pyramidal cell autocorrelogram and the simultaneously recorded ripple frequency. On the other hand, the interspike intervals of int(p) and most int(a/o) interneurons matched the frequency of the field ripple. These latter observations are compatible with the first two hypotheses. Finally, ripples were always associated with interneuronal with or without local pyramidal cell discharges. Thus, we suggest that the present findings are in favor of the pyramidal cell–interneuron interaction hypothesis.
The synchrony of both pyramidal cells and interneurons reached a maximum during SPW-related ripples. However, relative to no-SPW baseline epochs, the discharge probability of pyramidal cells increased 6.5-fold during the ripple, whereas interneurons in both groups increased their discharge probability by only 2.5–3. Thus, there is a substantial excitatory gain during the SPW, reflecting a period of high excitability (see also Csicsvari et al., 1998). The SPW-associated population burst may exert a strong depolarizing effect at the targets of CA1 pyramidal cells and may bring about plastic changes at those downstream synapses (Buzsaki, 1989; Chrobak and Buzsaki, 1994; Wilson and McNaughton, 1994). It is not immediately clear, however, why the increased excitation of pyramidal cells during SPWs is associated with an increased discharge of interneurons. Because the critical variable for somatic spike induction is the net depolarization, a relatively modest increase of dendritic excitation could be equally effective, provided that the level of inhibition remains unchanged. Parallel increases in input excitation and inhibition lead to a large decrease of the input resistance and therefore the electrotonic length of the neuron (Spruston et al., 1993). What could be the physiological implication of decreased input resistance? It has been shown recently that shunting and/or hyperpolarizing effects of interneurons effectively limit the somadendritic propagation of action potentials (Buzsaki et al., 1996; Tsubokawa and Ross, 1996). Therefore, it may be expected that action potentials initiated in the dendrites may also fail to invade the soma and axon of the pyramidal cells (Kamondi et al., 1998a; N. L. Golding and N. Spruston, personal communication) when interneuronal activity is increased. We hypothesize that the functional “uncoupling” of the soma and the dendrite by SPW-induced shunting will allow the dendritic spike bursts to bring about local changes of the active synapses without transmitting the high-frequency spike trains as an output via the axon. A further implication of the interneuron-mediated suppression of forward spike propagation is that functional “removal” of inhibitory cells from the network, as has been observed during afterdischarges (Bragin et al., 1997), would allow many more dendritic spikes to invade the soma and provide an excessive drive to the network.
Functional heterogeneity of interneurons: inhibitory coupling among interneurons
On the basis of somatic location, we distinguished two groups of interneurons. Those in the pyramidal layer primarily involve chandelier cells and basket cells and a portion of bistratified cells (Buhl et al., 1994; Sik et al., 1995; Ali et al., 1998). Most of these cells, therefore, are expected to innervate the soma and axon initial segment of the pyramidal cells. Another common feature of these neurons is that they can be excited by both CA3 and CA1 pyramidal cells. In contrast, cells with cell bodies in the alveus and st. oriens include several interneuron types. Most of these neurons receive selective innervation from CA1 but not from CA3 pyramidal cells (Sik et al., 1994, 1995; Blasco-Ibanez and Freund, 1995).
Interneurons in the int(p) and int(a/o) groups behaved similarly during theta activity in terms of theta phase modulation. Only a very small portion of int(a/o) neurons were selectively suppressed during theta (antitheta cells) (Buzsaki et al., 1983; Bland and Colom, 1989;Mizumori et al., 1990). The same group of cells, on the other hand, had remarkably heterogeneous discharge patterns during SPW. These findings suggest that the same interneuronal population can deliver different outputs depending on the selective activation of afferents. Whereas SPW-related histograms of most int(p) interneurons were similar in shape to those of the pyramidal cells, the histograms of other int(p) had peaks both before and after the maximum discharge probability of pyramidal cells. These bimodal cells likely were activated by the CA3 input before the discharge of CA1 pyramidal cells and were inhibited in the middle of the ripple by other inhibitory cells.
Interneurons in the st. oriens were also heterogeneous. The majority were strongly activated during SPWs, and several of them fired spikes with each ripple wave. The presence of SPW-unrelated cells and anti-SPW cells in the int(a/o) group suggests that some interneuron types in the alveus and st. oriens are not or are only weakly innervated by hippocampal pyramidal cells. Because these neurons discharged rhythmically during theta, this observation suggests that they exert only a feed-forward effect on the pyramidal cell population. The morphological identity of unimodal and bimodal interneurons and interneurons without pyramidal cell innervation remains to be demonstrated. It is also possible that each of the functional classes demonstrated here belongs to morphologically overlapping groups of interneurons (McMahon et al., 1998; Parra et al., 1998) and that their differential discharge properties reflect use-dependent change of their input synapses.
Footnotes
This work was supported by National Institutes of Health Grants NS34994, MH54671, and 1P41RR09754 and by the Human Frontier Science Program. We thank Darrell A. Henze and M. Recce for their comments on this manuscript and Jamie Hetke and Ken Wise for supplying us with silicon probes.
Correspondence should be addressed to Dr. György Buzsáki, Center for Molecular and Behavioral Neuroscience, Rutgers, The State University of New Jersey, 197 University Avenue, Newark, NJ 07102.
REFERENCES
- 1.Abeles M. Local cortical circuits: an electrophysiological study. Springer; Berlin: 1982. [Google Scholar]
- 2.Abeles M, Goldstein MH. Multispike train analysis. Proc IEEE. 1977;65:762–773. [Google Scholar]
- 3.Ali AB, Deuchars J, Pawelzi H, Thomson A. CA1 pyramidal to basket and bistratified EPSPs: dual intracellular recordings in rat hippocampal slices. J Physiol (Lond) 1998;507:201–217. doi: 10.1111/j.1469-7793.1998.201bu.x. [DOI] [PMC free article] [PubMed] [Google Scholar]
- 4.Bair W, Koch C. Temporal precision of spike trains in extrastriate cortex of the behaving macaque monkey. Neural Comput. 1996;8:1185–1202. doi: 10.1162/neco.1996.8.6.1185. [DOI] [PubMed] [Google Scholar]
- 5.Bankman IN, Johnson KO, Schneide W. Optimal detection, classification, and superposition resolution in neural waveform recordings. IEEE Trans Biomed Eng. 1993;40:836–841. doi: 10.1109/10.238472. [DOI] [PubMed] [Google Scholar]
- 6.Barlow HB. Single units and sensation: a neuron doctrine for perceptual psychology? Perception. 1972;1:371–394. doi: 10.1068/p010371. [DOI] [PubMed] [Google Scholar]
- 7.Bland BH. The physiology and pharmacology of hippocampal formation theta rhythms. Prog Neurobiol. 1986;26:1–54. doi: 10.1016/0301-0082(86)90019-5. [DOI] [PubMed] [Google Scholar]
- 8.Bland BH, Colom LV. Preliminary observations on the physiology and pharmacology of hippocampal theta-off cells. Brain Res. 1989;505:333–336. doi: 10.1016/0006-8993(89)91463-7. [DOI] [PubMed] [Google Scholar]
- 9.Blasco-Ibanez JM, Freund TF. Synaptic input of horizontal interneurons in stratum oriens of the hippocampal CA1 subfield: structural basis of feed-back activation. Eur J Neurosci. 1995;7:2170–2180. doi: 10.1111/j.1460-9568.1995.tb00638.x. [DOI] [PubMed] [Google Scholar]
- 10.Bragin A, Jando G, Nadasdy Z, Hetke J, Wise K, Buzsaki G. Gamma (40–100 Hz) oscillation in the hippocampus of the behaving rat. J Neurosci. 1995;15:47–60. doi: 10.1523/JNEUROSCI.15-01-00047.1995. [DOI] [PMC free article] [PubMed] [Google Scholar]
- 11.Bragin A, Csicsvari J, Penttonen M, Buzsaki G. Epileptic afterdischarge in the hippocampal-entorhinal system: current source density and unit studies. Neuroscience. 1997;76:1187–1203. doi: 10.1016/s0306-4522(96)00446-0. [DOI] [PubMed] [Google Scholar]
- 12.Buhl EH, Halasy K, Somogyi P. Diverse sources of hippocampal unitary inhibitory postsynaptic potentials and the number of synaptic release sites. Nature. 1994;368:823–828. doi: 10.1038/368823a0. [DOI] [PubMed] [Google Scholar]
- 13.Buhl EH, Szilagyi T, Halasy K, Somogyi P. Physiological properties of anatomically identified basket and bistratified cells in the CA1 area of the rat hippocampus in vitro. Hippocampus. 1996;6:294–305. doi: 10.1002/(SICI)1098-1063(1996)6:3<294::AID-HIPO7>3.0.CO;2-N. [DOI] [PubMed] [Google Scholar]
- 14.Buzsaki G. Two-stage model of memory trace formation: a role for “noisy” brain states. Neuroscience. 1989;31:551–570. doi: 10.1016/0306-4522(89)90423-5. [DOI] [PubMed] [Google Scholar]
- 15.Buzsaki G, Chrobak JJ. Temporal structure in spatially organized neuronal ensembles: a role for interneuronal networks. Curr Opin Neurobiol. 1995;5:504–510. doi: 10.1016/0959-4388(95)80012-3. [DOI] [PubMed] [Google Scholar]
- 16.Buzsaki G, Grastyan E, Czopf J, Kellenyi L, Prohaska O. Changes in neuronal transmission in the rat hippocampus during behavior. Brain Res. 1981;225:235–247. doi: 10.1016/0006-8993(81)90833-7. [DOI] [PubMed] [Google Scholar]
- 17.Buzsaki G, Leung LW, Vanderwolf CH. Cellular bases of hippocampal EEG in the behaving rat. Brain Res. 1983;287:139–171. doi: 10.1016/0165-0173(83)90037-1. [DOI] [PubMed] [Google Scholar]
- 18.Buzsaki G, Horvath Z, Urioste R, Hetke J, Wise K. High-frequency network oscillation in the hippocampus. Science. 1992;256:1025–1027. doi: 10.1126/science.1589772. [DOI] [PubMed] [Google Scholar]
- 19.Buzsaki G, Penttonen M, Nadasdy Z, Bragin A. Pattern and inhibition-dependent invasion of pyramidal cell dendrites by fast spikes in the hippocampus in vivo. Proc Natl Acad Sci USA. 1996;93:9921–9925. doi: 10.1073/pnas.93.18.9921. [DOI] [PMC free article] [PubMed] [Google Scholar]
- 20.Chrobak JJ, Buzsaki G. Selective activation of deep layer (V–VI) retrohippocampal cortical neurons during hippocampal sharp waves in the behaving rat. J Neurosci. 1994;14:6160–6170. doi: 10.1523/JNEUROSCI.14-10-06160.1994. [DOI] [PMC free article] [PubMed] [Google Scholar]
- 21.Chrobak JJ, Buzsaki G. High-frequency oscillations in the output networks of the hippocampal–entorhinal axis of the freely behaving rat. J Neurosci. 1996;16:3056–3066. doi: 10.1523/JNEUROSCI.16-09-03056.1996. [DOI] [PMC free article] [PubMed] [Google Scholar]
- 22.Csicsvari J, Hirase H, Czurko A, Buzsaki G. Reliability and state-dependence of pyramidal cell-interneuron synapses in the hippocampus: an ensemble approach in the behaving rat. Neuron. 1998;21:179–189. doi: 10.1016/s0896-6273(00)80525-5. [DOI] [PubMed] [Google Scholar]
- 23.Czurko A, Hirase H, Csicsvari J, Buzsaki G (1999) Sustained activation of hippocampal pyramidal cells by “space clamping” in a running wheel. Eur J Neurosci, in press. [DOI] [PubMed]
- 24.Draguhn A, Traub RD, Schmitz D, Jefferys JG. Electrical coupling underlies high-frequency oscillations in the hippocampus in vitro. Nature. 1998;394:189–192. doi: 10.1038/28184. [DOI] [PubMed] [Google Scholar]
- 25.Fee MS, Mitra PP, Kleinfeld D. Automatic sorting of multiple unit neuronal signals in the presence of anisotropic and non-Gaussian variability. J Neurosci Methods. 1996;69:175–188. doi: 10.1016/S0165-0270(96)00050-7. [DOI] [PubMed] [Google Scholar]
- 26.Fox SE, Ranck JB., Jr Electrophysiological characteristics of hippocampal complex-spike cells and theta cells. Exp Brain Res. 1981;41:399–410. doi: 10.1007/BF00238898. [DOI] [PubMed] [Google Scholar]
- 27.Fox SE, Wolfson S, Ranck JB., Jr Hippocampal theta rhythm and the firing of neurons in walking and urethane anesthetized rats. Exp Brain Res. 1986;62:495–508. doi: 10.1007/BF00236028. [DOI] [PubMed] [Google Scholar]
- 28.Freund TF, Buzsaki G. Interneurons of the hippocampus. Hippocampus. 1996;6:347–470. doi: 10.1002/(SICI)1098-1063(1996)6:4<347::AID-HIPO1>3.0.CO;2-I. [DOI] [PubMed] [Google Scholar]
- 29.Gray CM, Singer W. Stimulus-specific neuronal oscillations in orientation columns of cat visual cortex. Proc Natl Acad Sci USA. 1989;86:1698–1702. doi: 10.1073/pnas.86.5.1698. [DOI] [PMC free article] [PubMed] [Google Scholar]
- 30.Gray CM, Maldonado PE, Wilson M, McNaughton B. Tetrodes markedly improve the reliability and yield of multiple single-unit isolation from multi-unit recordings in cat striate cortex. J Neurosci Methods. 1995;63:43–54. doi: 10.1016/0165-0270(95)00085-2. [DOI] [PubMed] [Google Scholar]
- 31.Green JD, Arduini AA. Hippocampal electrical activity in arousal. J Neurophysiol. 1954;17:533–557. doi: 10.1152/jn.1954.17.6.533. [DOI] [PubMed] [Google Scholar]
- 32.Hopfield JJ. Pattern recognition computation using action potential timing for stimulus representation. Nature. 1995;376:33–36. doi: 10.1038/376033a0. [DOI] [PubMed] [Google Scholar]
- 33.Huerta PT, Lisman JE. Bidirectional synaptic plasticity induced by a single burst during cholinergic theta oscillation in CA1 in vitro. Neuron. 1995;15:1053–1063. doi: 10.1016/0896-6273(95)90094-2. [DOI] [PubMed] [Google Scholar]
- 34.Kamondi A, Acsady L, Buzsaki G. Dendritic spikes are enhanced by cooperative network activity in the intact hippocampus. J Neurosci. 1998a;18:3919–3928. doi: 10.1523/JNEUROSCI.18-10-03919.1998. [DOI] [PMC free article] [PubMed] [Google Scholar]
- 35.Kamondi A, Acsády L, Wang XJ, Buzsáki G. Theta oscillations in somata and dendrites of hippocampal pyramidal cells in vivo: activity dependent phase-precession of action potentials. Hippocampus. 1998b;8:244–261. doi: 10.1002/(SICI)1098-1063(1998)8:3<244::AID-HIPO7>3.0.CO;2-J. [DOI] [PubMed] [Google Scholar]
- 36.Katsumaru H, Kosaka T, Heizmann CW, Hama K. Gap junctions on GABAergic neurons containing the calcium-binding protein parvalbumin in the rat hippocampus (CA1 region). Exp Brain Res. 1988;72:363–370. doi: 10.1007/BF00250257. [DOI] [PubMed] [Google Scholar]
- 37.Lacaille JC, Mueller AL, Kunkel DD, Schwartzkroin PA. Local circuit interactions between alveus/oriens interneurons and CA1 pyramidal cells in hippocampal slices: electrophysiology and morphology. J Neurosci. 1987;7:1979–1993. doi: 10.1523/JNEUROSCI.07-07-01979.1987. [DOI] [PMC free article] [PubMed] [Google Scholar]
- 38.Lisman JE, Idiart MA. Storage of 7 ± 2 short-term memories in oscillatory subcycles. Science. 1995;267:1512–1515. doi: 10.1126/science.7878473. [DOI] [PubMed] [Google Scholar]
- 39.McMahon LL, Williams JH, Kauer JA. Functionally distinct groups of interneurons identified during rhythmic carbachol oscillations in hippocampus in vitro. J Neurosci. 1998;18:5640–5651. doi: 10.1523/JNEUROSCI.18-15-05640.1998. [DOI] [PMC free article] [PubMed] [Google Scholar]
- 40.Mizumori SJ, Barnes CA, McNaughton BL. Behavioral correlates of theta-on and theta-off cells recorded from hippocampal formation of mature young and aged rats. Exp Brain Res. 1990;80:365–373. doi: 10.1007/BF00228163. [DOI] [PubMed] [Google Scholar]
- 41.O’Keefe J, Dostrovsky J. The hippocampus as a spatial map. Preliminary evidence from unit activity in the freely-moving rat. Brain Res. 1971;34:171–175. doi: 10.1016/0006-8993(71)90358-1. [DOI] [PubMed] [Google Scholar]
- 42.O’Keefe J, Recce ML. Phase relationship between hippocampal place units and the EEG theta rhythm. Hippocampus. 1993;3:317–330. doi: 10.1002/hipo.450030307. [DOI] [PubMed] [Google Scholar]
- 43.Parra P, Gulyas AI, Miles R. How many subtypes of inhibitory cells in the hippocampus. Neuron. 1998;20:983–993. doi: 10.1016/s0896-6273(00)80479-1. [DOI] [PubMed] [Google Scholar]
- 44.Pavlides C, Greenstein YJ, Grudman M, Winson J. Long-term potentiation in the dentate gyrus is induced preferentially on the positive phase of theta-rhythm. Brain Res. 1988;439:383–387. doi: 10.1016/0006-8993(88)91499-0. [DOI] [PubMed] [Google Scholar]
- 45.Press WH, Teukolsky SA, Vettering WT, Flannery BP. Numerical recipes in C: the art of scientific computing, Ed 2. Cambridge UP; Cambridge, MA: 1992. [Google Scholar]
- 46.Ranck JB., Jr Studies on single neurons in dorsal hippocampal formation and septum in unrestrained rats. I. Behavioral correlates and firing repertoires. Exp Neurol. 1973;41:461–531. doi: 10.1016/0014-4886(73)90290-2. [DOI] [PubMed] [Google Scholar]
- 47. Recce ML, O’Keefe J. 1989. The tetrode: a new technique for multiunit extracellular recording. Soc Neurosci Abstr
- 48.Rudell AP, Fox SE, Ranck JB., Jr Hippocampal excitability phase-locked to the theta rhythm in walking rats. Exp Neurol. 1980;68:87–96. doi: 10.1016/0014-4886(80)90068-0. [DOI] [PubMed] [Google Scholar]
- 49.Shadlen MN, Newsome WT. The variable discharge of cortical neurons: implications for connectivity, computation, and information coding. J Neurosci. 1998;18:3870–3896. doi: 10.1523/JNEUROSCI.18-10-03870.1998. [DOI] [PMC free article] [PubMed] [Google Scholar]
- 50.Sik A, Ylinen A, Penttonen M, Buzsaki G. Inhibitory CA1-CA3-hilar region feedback in the hippocampus. Science. 1994;265:1722–1724. doi: 10.1126/science.8085161. [DOI] [PubMed] [Google Scholar]
- 51.Sik A, Penttonen M, Ylinen A, Buzsaki G. Hippocampal CA1 interneurons: an in vivo intracellular labeling study. J Neurosci. 1995;15:6651–6665. doi: 10.1523/JNEUROSCI.15-10-06651.1995. [DOI] [PMC free article] [PubMed] [Google Scholar]
- 52.Skaggs WE, McNaughton BL, Wilson MA, Barnes CA. Theta phase precession in hippocampal neuronal populations and the compression of temporal sequences. Hippocampus. 1996;6:149–172. doi: 10.1002/(SICI)1098-1063(1996)6:2<149::AID-HIPO6>3.0.CO;2-K. [DOI] [PubMed] [Google Scholar]
- 53.Softky WR, Koch C. The highly irregular firing of cortical cells is inconsistent with temporal integration of random EPSPs. J Neurosci. 1993;13:334–360. doi: 10.1523/JNEUROSCI.13-01-00334.1993. [DOI] [PMC free article] [PubMed] [Google Scholar]
- 54.Spruston N, Jaffe DB, Williams SH, Johnston D. Voltage- and space-clamp errors associated with the measurement of electrotonically remote synaptic events. J Neurophysiol. 1993;70:781–802. doi: 10.1152/jn.1993.70.2.781. [DOI] [PubMed] [Google Scholar]
- 55.Stewart M, Fox SE. Do septal neurons pace the hippocampal theta rhythm? Trends Neurosci. 1990;13:163–168. doi: 10.1016/0166-2236(90)90040-h. [DOI] [PubMed] [Google Scholar]
- 56.Thompson LT, Best PJ. Place cells and silent cells in the hippocampus of freely-behaving rats. J Neurosci. 1989;9:2382–2390. doi: 10.1523/JNEUROSCI.09-07-02382.1989. [DOI] [PMC free article] [PubMed] [Google Scholar]
- 57.Tsubokawa H, Ross WN. IPSPs modulate spike backpropagation and associated [Ca2+]i changes in the dendrites of hippocampal CA1 pyramidal neurons. J Neurophysiol. 1996;76:2896–2906. doi: 10.1152/jn.1996.76.5.2896. [DOI] [PubMed] [Google Scholar]
- 58.Vanderwolf CH. Hippocampal electrical activity and voluntary movement in the rat. Electroencephalogr Clin Neurophysiol. 1969;26:407–418. doi: 10.1016/0013-4694(69)90092-3. [DOI] [PubMed] [Google Scholar]
- 59.Wilson MA, McNaughton BL. Dynamics of the hippocampal ensemble code for space. Science. 1993;261:1055–1058. doi: 10.1126/science.8351520. [DOI] [PubMed] [Google Scholar]
- 60.Wilson MA, McNaughton BL. Reactivation of hippocampal ensemble memories during sleep. Science. 1994;265:676–679. doi: 10.1126/science.8036517. [DOI] [PubMed] [Google Scholar]
- 61.Winson J. Patterns of hippocampal theta rhythm in the freely moving rat. Electroencephalogr Clin Neurophysiol. 1974;36:291–301. doi: 10.1016/0013-4694(74)90171-0. [DOI] [PubMed] [Google Scholar]
- 62.Ylinen A, Bragin A, Nadasdy Z, Jando G, Szabo I, Sik A, Buzsaki G. Sharp wave-associated high-frequency oscillation (200 Hz) in the intact hippocampus: network and intracellular mechanisms. J Neurosci. 1995a;15:30–46. doi: 10.1523/JNEUROSCI.15-01-00030.1995. [DOI] [PMC free article] [PubMed] [Google Scholar]
- 63.Ylinen A, Soltesz I, Bragin A, Penttonen M, Sik A, Buzsaki G. Intracellular correlates of hippocampal theta rhythm in identified pyramidal cells, granule cells and basket cells. Hippocampus. 1995b;5:78–90. doi: 10.1002/hipo.450050110. [DOI] [PubMed] [Google Scholar]


