Abstract
Odors evoke synchronized oscillations and slow temporal patterns in antennal lobe neurons and fast oscillations in the mushroom body local field potential (LFP) of the locust. What is the contribution of primary afferents in the generation of these dynamics? We addressed this question in two ways. First, we recorded odor-evoked afferent activity in both isolated antennae and intact preparations. Odor-evoked population activity in the antenna and the antennal nerve consisted of a slow potential deflection, similar for many odors. This deflection contained neither oscillatory nor odor-specific slow temporal patterns, whereas simultaneously recorded mushroom body LFPs exhibited clear 20–30 Hz oscillations. This suggests that the temporal patterning of antennal lobe and mushroom body neurons is generated downstream of the olfactory receptor axons. Second, we electrically stimulated arrays of primary afferents in vivo. A brief shock to the antennal nerve produced compound PSPs in antennal lobe projection neurons, with two peaks at an ∼50 msec interval. Prolonged afferent stimulation with step, ramp, or slow sine-shaped voltage waveforms evoked sustained 20–30 Hz oscillations in projection neuron membrane potential and in the mushroom body LFP. Projection neuron and mushroom body oscillations were phase-locked and reliable across trials. Synchronization of projection neurons was seen directly in paired intracellular recordings. Pressure injection of picrotoxin into the antennal lobe eliminated the oscillations evoked by electrical stimulation. Different projection neurons could express different temporal patterns in response to the same electrical stimulus, as seen for odor-evoked responses. Conversely, individual projection neurons could express different temporal patterns of activity in response to step stimulation of different spatial arrays of olfactory afferents. These patterns were reliable and remained distinct across different stimulus intensities. We conclude that oscillatory synchronization of olfactory neurons originates in the antennal lobe and that slow temporal patterns in projection neurons can arise in the absence of temporal patterning of the afferent input.
Keywords: synchronization, oscillation, coding, olfactory receptors, olfaction, insect
Fast stimulus-evoked oscillations in the brain have now been known for over 50 years (Adrian, 1942, 1950). The functional significance of these oscillations remains controversial, although oscillatory synchronization has been shown to be stimulus-specific in a few systems (Gray et al., 1989; Wehr and Laurent, 1996) and experimental desynchronization impairs the fine discrimination of odors in the honeybee (Stopfer et al., 1997). Olfactory systems across phyla display, in addition to this fast oscillatory synchronization, complex slow temporal patterns of excitation and inhibition in projection neurons of the first synaptic area, namely, the olfactory bulb in vertebrates and the antennal lobe in insects (Kauer, 1974; Christensen and Hildebrand, 1987). The functional significance of these slow temporal response patterns is also unclear. The role of such temporal coding in vision, for example, remains controversial (McClurkin et al., 1991; Shadlen and Newsome, 1998). The slow temporal response patterns in the locust olfactory system are odor- and neuron-specific and thereby shape the population of activated, rhythmically synchronized projection neurons into an evolving sequence of synchronized oscillatory assemblies that contains information about the odor presented (Laurent and Davidowitz, 1994;Laurent et al., 1996; Wehr and Laurent, 1996). Odors thus appear to be encoded by dynamic neural ensembles, whose components and sequence of activation are both stimulus-specific (Laurent, 1996).
Odor-evoked oscillatory activity in the locust olfactory system is thought to be generated by the intrinsic circuitry of the antennal lobe. This hypothesis is supported by two previous findings. First, odor-evoked oscillations in antennal lobe projection neurons (PNs) persist after ablation of the mushroom body (Laurent and Davidowitz, 1994), suggesting that the antenna and antennal lobe are sufficient for oscillatory synchronization of PNs during odor responses. Second, focal injection of picrotoxin (a vertebrate GABAA and insect ionotropic GABA receptor antagonist) into the antennal lobe abolishes local neuron-mediated fast IPSPs in PNs, phase locking of PNs to the mushroom body local field potential (LFP), and finally LFP oscillations (MacLeod and Laurent, 1996). These results demonstrate that inhibitory synapses of local neurons onto PNs are necessary for their oscillatory synchronization. Oscillatory synchronization in the vertebrate olfactory bulb is thought to involve fast inhibitory feedback also (Rall and Shepherd, 1968; Freeman, 1975). However, the possible contribution of rhythmic and synchronized afferent input from the olfactory receptor neurons could not be eliminated. Although no evidence exists for reciprocal coupling between olfactory receptor neurons in insects, such connections could in principle participate in the generation of synchronized activity in the antennal lobe. Indeed, recent results from the salamander suggest that afferent synchronization and rhythmic odor-evoked activity can be recorded in the olfactory epithelium even after connections to the olfactory bulb have been severed (Dorries and Kauer, 1996; K. Dorries and J. Kauer, unpublished observations). The vertebrate olfactory epithelium, olfactory bulb, and piriform cortex are therefore each capable of generating oscillations in isolation, suggesting that these structures share a matched resonant capability rather than that any one drives the other (Freeman, 1962, 1968; K. Dorries and J. Kauer, personal communication). Here we investigate the degree to which this is true of the locust olfactory system. Are locust antennal olfactory receptor neurons rhythmically and coherently active during odor responses? If not, what is their contribution to oscillatory synchronization in the antennal lobe and mushroom body? We addressed these questions first by recording odor-evoked afferent activity and second by electrically stimulating primary afferents in vivo.
The mechanisms by which odor-evoked slow temporal patterns are generated in projection neurons and mitral/tufted cells are even less well understood. Although they are thought to involve lateral synaptic interactions (Meredith, 1986, 1992; White et al., 1992; Christensen et al., 1993), the details of these interactions are unknown and have only been the subject of speculation. Interestingly, the slow temporal patterns evoked by odors in locust PNs persist in the presence of picrotoxin (MacLeod and Laurent, 1996). This suggests that the mechanisms that generate them are distinct from those that generate synchronous oscillations. What, therefore, are these underlying mechanisms? One hypothesis is that the slow temporal patterns seen in PNs are driven by slow temporal patterns in the afferent input. For example, olfactory receptor neurons could respond with different time courses to different ligands because of perireceptor events (Pelosi, 1996), competitive binding interactions at the receptors, combinations of multiple odor-activated membrane conductances (Restrepo et al., 1996), or differential activation of (possibly interacting) second messenger cascades (Restrepo et al., 1996). Alternatively, these temporal patterns could be generated by complex dynamics resulting from intrinsic antennal lobe circuitry. To try and distinguish between these two (nonexclusive) possibilities, we recorded odor-evoked afferent activity and electrically stimulated arrays of primary afferentsin vivo.
MATERIALS AND METHODS
The preparation. Experiments were performed in vivo on 125 adult female locusts (Schistocerca americana) taken from a crowded colony. Animals were restrained dorsal side up. The head was immobilized with beeswax, and a watertight beeswax cup was built around the head for saline superfusion. A window was opened in the cuticle of the head capsule, between the compound eyes, and air sacs on the anterior surface of the brain were carefully removed. For stability, the esophagus was sectioned anterior to the brain, and the gut was removed through a distal abdominal section that was then ligatured. The brain was treated with protease (type XIV; Sigma, St. Louis, MO), gently desheathed, and supported with a small metal platform. The head capsule was continuously superfused with oxygenated physiological saline (in mm): 140 NaCl, 5 KCl, 5 CaCl2, 4 NaHCO3, 1 MgCl2, and 6.3 HEPES, pH 7.0, at room temperature. Picrotoxin (500 pl of 1 mm solution in locust physiological saline) was pressure injected into the center of the antennal lobe using a glass micropipette (2 μm tip diameter) connected to a pneumatic picopump (WPI, Sarasota, FL).
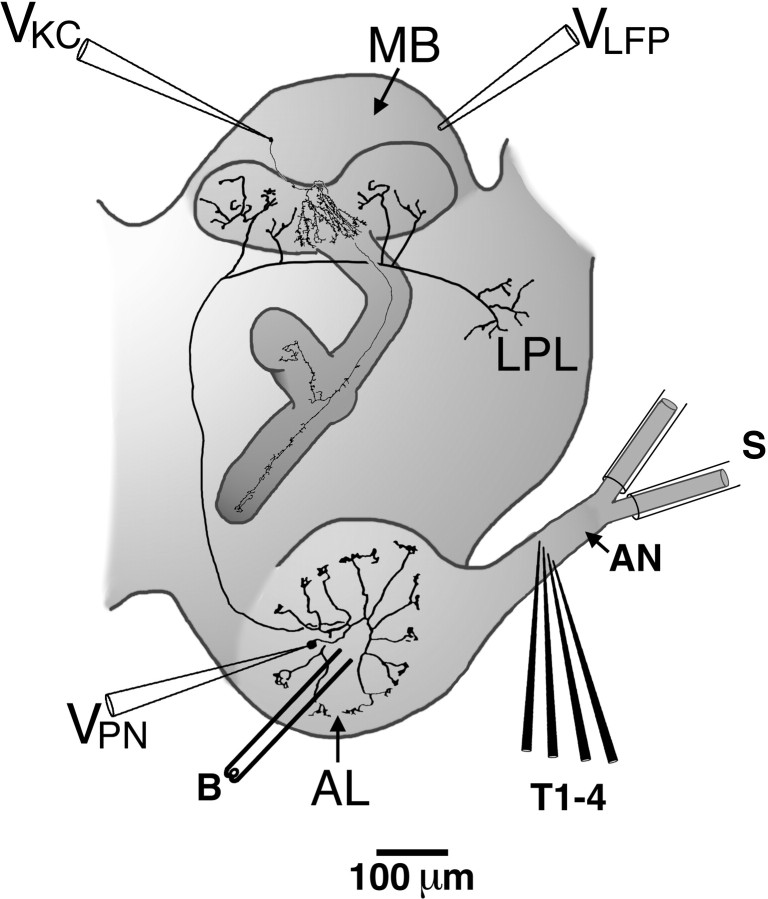
Electrical stimulation. The antennal nerve was cut distal to its bifurcation, and the antenna was removed. The cut ends of both antennal nerve branches were drawn into a polyethylene suction electrode, or (in some experiments) each branch was drawn into a separate suction electrode (Fig. 1). The antennal nerve was desheathed from the antennal lobe up to the bifurcation and penetrated with a planar array of four tungsten microelectrodes (etched to a 1 μm tip and insulated with Formvar; impedance 2–5 MΩ), which were placed across the width of the nerve, proximal to the bifurcation. Bipolar electrical stimuli were delivered between any two of the four tungsten electrodes (see Figs. 9, 11, 12; indicated by the notation TiTj for voltage applied from the ith to the jth electrode). The suction electrodes used a common AgCl wire in the bath as reference. Together, the suction electrodes and array allowed up to 15 stimulus configurations. In some experiments the antenna was left intact to enable natural stimulation with airborne odors; in these experiments only the array was used for electrical stimulation. Voltage pulses were produced with a programmable pulse generator (AMPI, Jerusalem, Israel) and, for voltage shock or step stimuli, were applied via a passive stimulus isolator (Grass Instruments, West Warwick, RI). Ramp or sine-shaped voltage waveforms were produced with an analog function generator in single-cycle mode (Hewlett-Packard, Palo Alto, CA), DC amplified (Brownlee Precision Instruments, Santa Clara, CA), and applied via a stimulus isolator. In some experiments (see Figs. 4-8,10b), the stimulus isolator was not used, and the resulting stimulus artifact in the LFP was minimized by digitally high-pass filtering at 5 or 10 Hz (as noted in figure captions) but in PNs remains evident as a downward trend in membrane potential. For Kenyon cell recordings, voltage shocks were applied with a 50 μm stainless steel bipolar stimulating electrode placed in the center of the antennal lobe.
Fig. 1.
Anatomy diagram showing the configuration of stimulating and recording electrodes. AL, Antennal lobe;AN, antennal nerve; B, bipolar stimulating electrode; LPL, lateral protocerebral lobe;MB, mushroom body; S, suction electrode;T1–4, planar array of tungsten stimulating electrodes;VKC, Kenyon cell intracellular recording electrode; VLFP, local field potential recording electrode;VPN, projection neuron intracellular recording electrode.
Fig. 9.
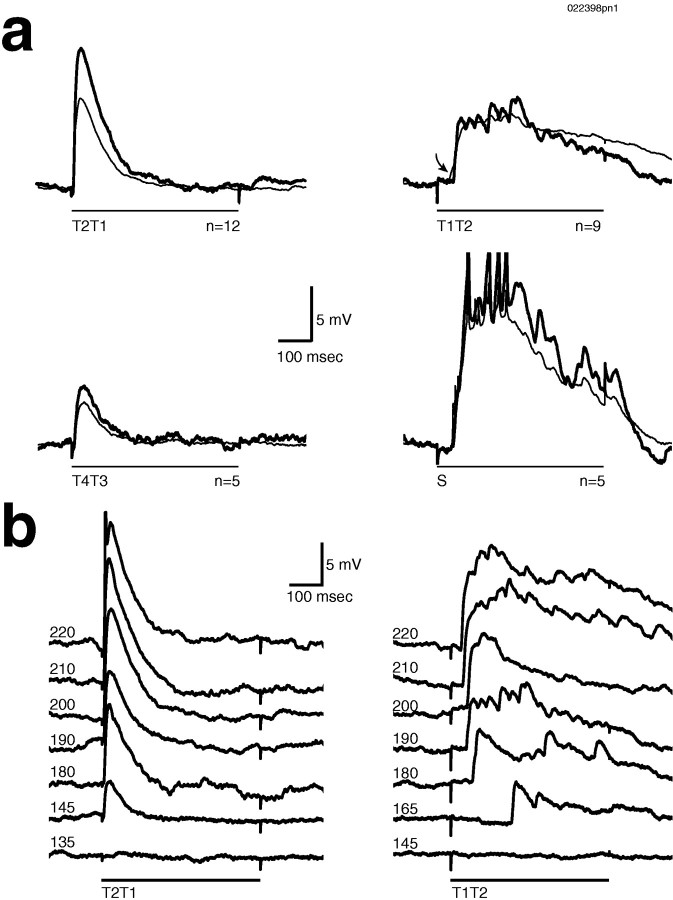
a, Stimulating different subsets of afferent fibers generated different temporal PN response patterns. In this PN different patterns are apparent in the subthreshold activity. Single (thick line) and mean (thin line) responses are superimposed. Increased latency (and increased latency variability; see mean) is indicated by the arrow.S, Suction electrode stimulus. b, An intensity series shows that the different temporal patterns remained distinct across intensities. Intensities are in millivolts. ForT1T2 but not for T2T1, latency was a function of stimulus intensity.
Fig. 11.
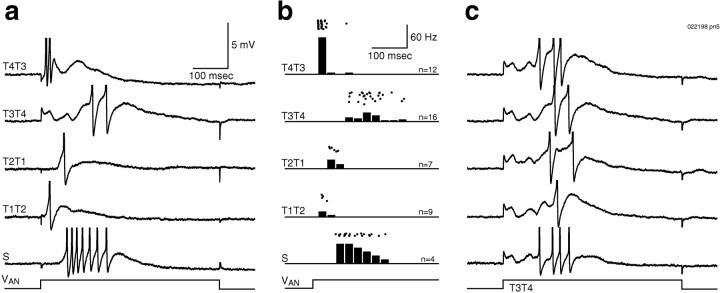
Different spatial patterns of afferent stimulation (500 msec step, VAN) could evoke many different firing patterns. a, Firing patterns can be seen in individual traces. Delayed firing to the suction electrode stimulus (S) is attributable in part only to conduction time along the antennal nerve.b, Peristimulus time histograms (25 msec bins) and rasters show reliability of firing patterns. c, Five consecutive trials in response to stimulus T3T4 show the consistent early inhibition and late firing.
Fig. 12.
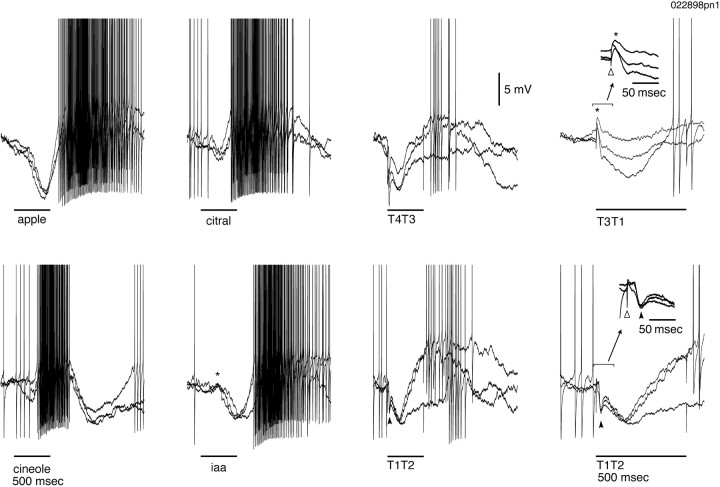
Responses to odors and electrical stimulation in the same PN. Three trials are superimposed in each condition. Apple and citral evoke initial inhibition followed by an epoch of excitation. Cineole leads to initial excitation followed by inhibition. Presentation of isoamyl acetate (iaa) evokes a mixed response with a weak subthreshold initial excitation (*), followed by epochs of inhibition and then excitation. Electrical stimulation with either T4T3 or T1T2 evokes initial inhibition followed by excitation. Close examination (inset) of the response to T1T2 reveals a fast initial IPSP (filled arrowhead) followed by a slow inhibitory component. The response to T3T1consists of a fast, subthreshold EPSP (*) followed by a slow inhibitory component. Stimulus onset artifacts are indicated by open arrowheads in insets.
Fig. 4.
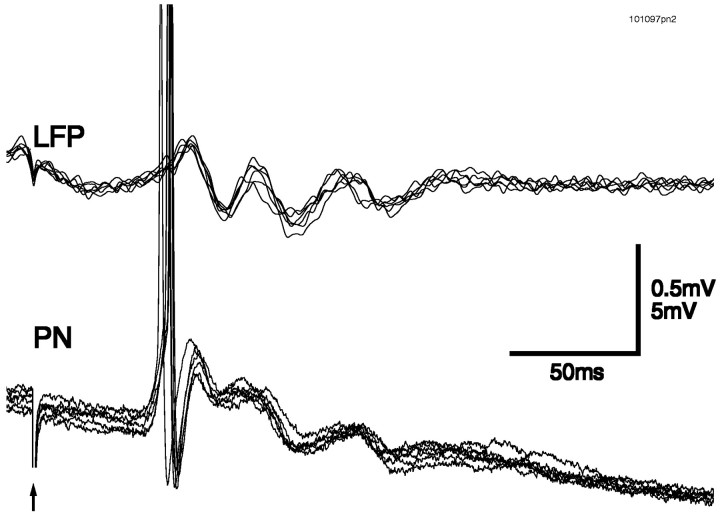
Consistency of synchronizedPN–LFP oscillations is shown by the superposition of traces from six consecutive trials (different animal from Fig. 3). LFP was filtered at 5–50 Hz; 500 msec step electrical stimulation by suction electrode, onset indicated by arrow, was used. Note that thedownward trend in the PN traces in this and other figures (see Figs. 5-8, 10b) is a stimulus artifact (see Materials and Methods).
Fig. 5.
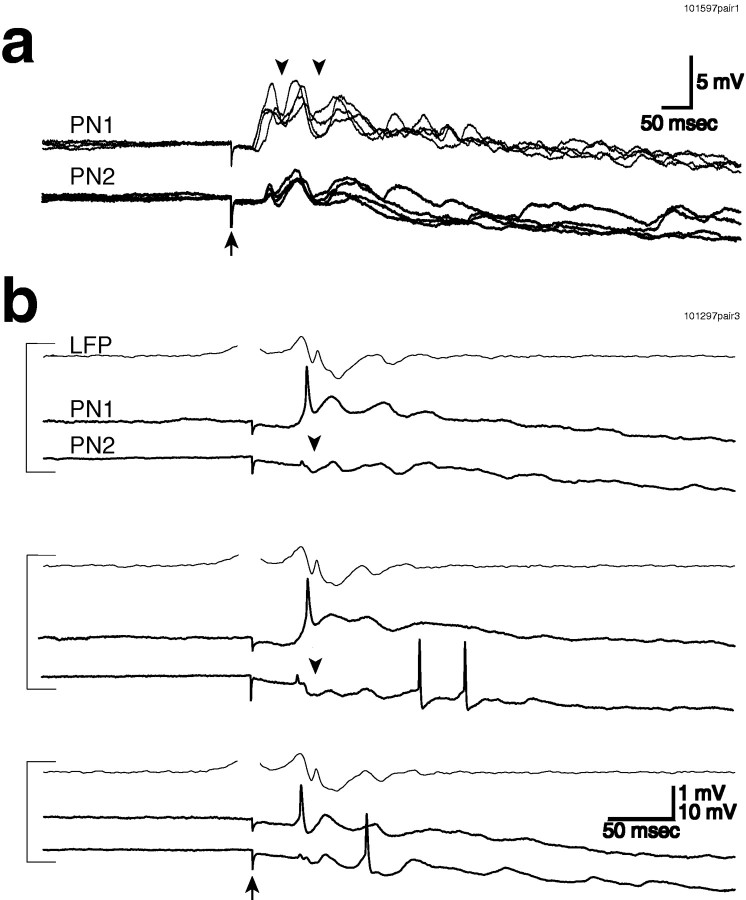
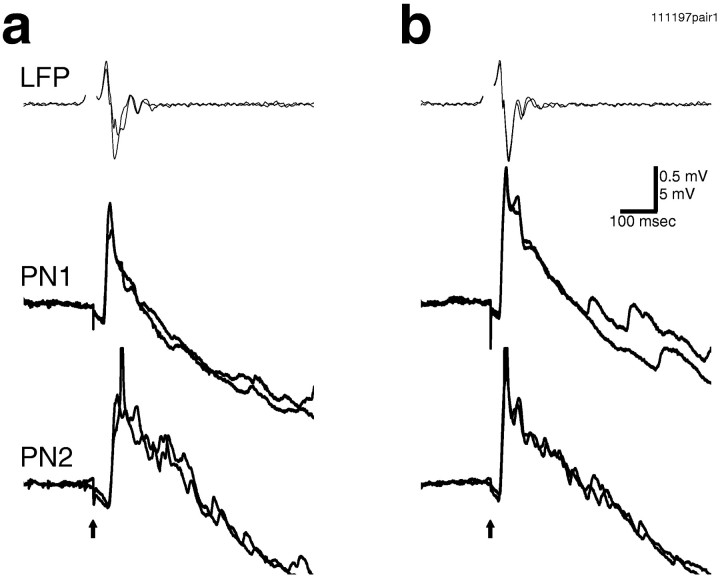
Synchronization between PNs could be seen directly in paired intracellular recordings. a, Four consecutive traces are superimposed, showing consistent synchronization of the subthreshold membrane potential oscillations in these two PNs (PN1 andPN2). IPSPs are indicated by arrowheads.b, The membrane potential of two PNs and the mushroom body LFP all showed synchronized oscillations (LFP filtered at 5–50 Hz).PN1 consistently receives an initial EPSP in response to electrical stimulation, whereas PN2 received an initial IPSP (arrowhead) followed by EPSPs later in the trial. This suggests that different PNs can receive different temporal patterns of inputs from the same electrical stimulus. Ina and b, 500 msec step electrical stimulation by suction electrode, onset indicated byarrow, was used.
Fig. 6.
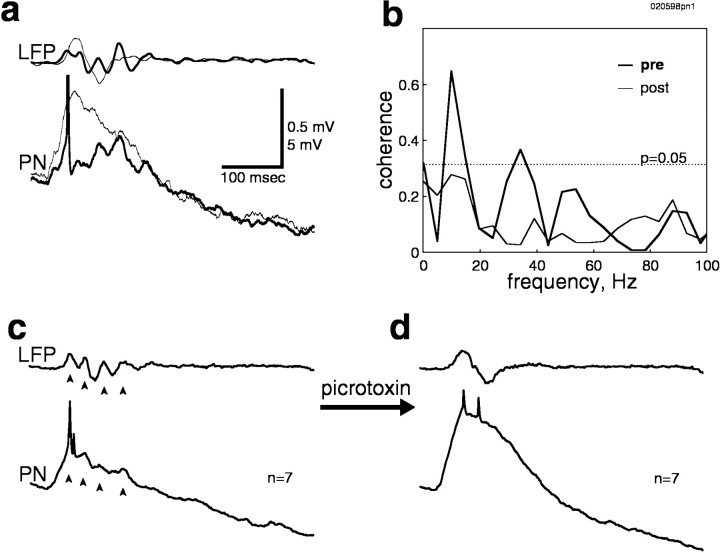
Pressure injection of picrotoxin into the AL disrupts the oscillations evoked by electrical stimulation in bothPNs and LFP. a, Single-trial responses of PN and LFPevoked by step electrical stimulation (with a suction electrode) before (thick line) and after (thin line) picrotoxin injection. Rhythmicity in both membrane potential andLFP is abolished after injection (LFPfiltered at 10–50 Hz). Response amplitude also increased after picrotoxin (PN hyperpolarized by −0.5 nA).b, Coherence between PN membrane potential and unfiltered mushroom body LFP computed over seven trials both before (pre) and after (post) picrotoxin injection. The peak at ∼30 Hz is absent after picrotoxin injection. The dotted lineindicates significant difference from zero (p = 0.05). c,d, Mean membrane potential and LFPcomputed before (c) and after (d) picrotoxin injection for the same 14 trials shown in b. Rhythmic EPSPs and phase-lockedLFP oscillations in c are indicated byarrowheads.
Fig. 7.
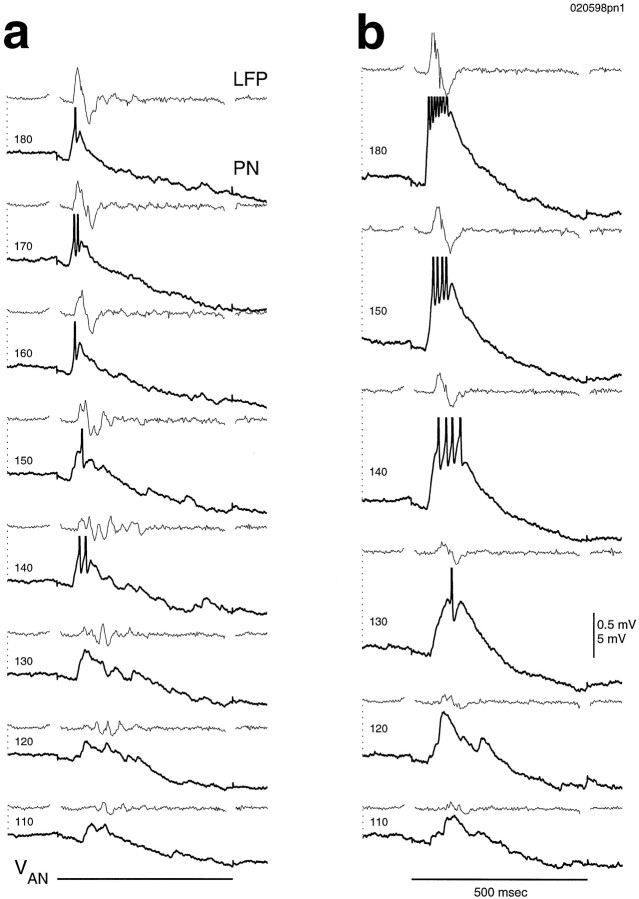
An intensity series showed that picrotoxin effects cannot be attributed to change in the stimulus threshold (samePN shown in Fig. 6). a, Oscillations are only evoked within a range of stimulus intensities (below which one or no cycles are evoked; above which only a population spike is evoked).b, After picrotoxin, no stimulus intensity can evoke oscillations.
Fig. 8.
Stimulation of either branch (a,b) of the antennal nerve evokes the same temporal pattern in a given PN. Two consecutive trials at the same intensity are superimposed, showing the consistency of the response. LFP was filtered at 10–50 Hz; 500 msec step electrical stimulation, onset indicated by arrow, was used.
Fig. 10.
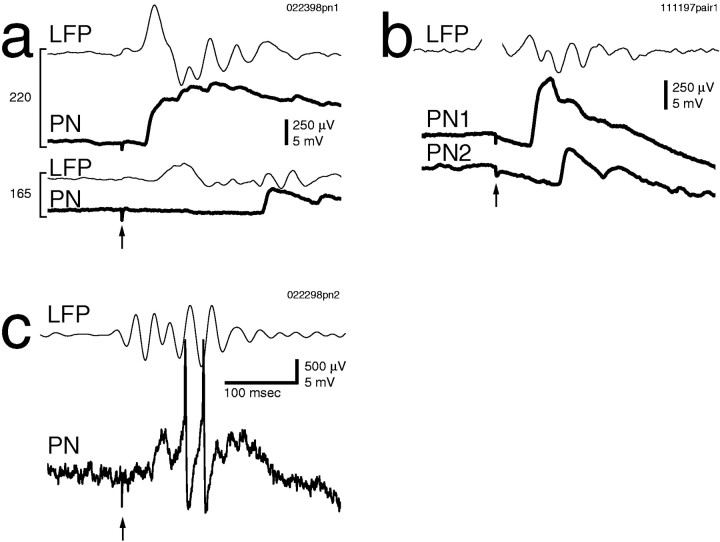
Different PNs show distinct temporal responses to the same afferent volley. a, Increasing stimulus intensity from 165 to 220 mV caused a 160 msec decrease in PN response latency but only a 25 msec decrease in field potential response latency. For the 165 mV stimulus, the field potential response preceded the PN response by 146 msec, indicating that other PN responses must also precede that of the recorded PN. The PNis the same as that shown in Figure 9. b, Different temporal responses to a stimulus in two simultaneously recordedPNs are shown. c, The field potential response preceded the response of this PN by 32 msec. Ina–c, 500 msec step electrical stimulation, onset indicated by arrow, was used. LFP was filtered at 5–50 Hz (a) and 10–50 Hz (b, c).
Olfactory stimulation. The open ends of a set of 20 stainless steel tubes (0.5 mm inner diameter) were placed 2.5 cm from the antenna, angled so that they converged onto the antenna. The other end of each tube was connected via polyethylene tubing to a 2 ml chamber that contained a 1 cm2 piece of filter paper, on which was deposited no odorant (air) or 10 μl of one of the following odors: isoamyl acetate, citral, cineole, geraniol, hexanol, octanol (Sigma), apple blossom potpourri oil (Gilbertie’s Herb Gardens, Easton, CT), or spearmint oil (Flavco, Mansfield, OH). The chambers were connected in parallel to a common air pressure injection system via a set of valves, so that electronically controlled gentle pressure pulses (0.3 l/min; insufficient to visibly bend the antenna) could be delivered to the animal. Source air was cleaned and dried by passing through activated charcoal and drierite. Odorant pulses of 0.5 or 1 sec duration were delivered at 0.1 Hz. For isolated antennal recordings, 5 ml polystyrene serological pipettes were used in place of the stainless steel tubes.
Electrophysiology. Intracellular recordings were made using conventional sharp glass microelectrodes pulled with a horizontal puller (Sutter Instruments, Novato, CA), which were filled with either 0.5 m KAcetate (for PNs) or a modified patch solution [for Kenyon cells (in mm): 155 KAsp, 1 CaCl2, 1.5 MgCl2, 10 EGTA, 2 ATP, 10 HEPES, and ∼3 glucose adjusted to give 380 mOsm, pH 7.0 (Laurent et al., 1993)] and had DC resistances of 100–300 MΩ. LFP and antennal nerve recording electrodes had ∼1 μm tips with DC resistances of 1–10 MΩ and were filled with locust physiological saline. For antennal nerve recordings, a ported electrode holder was used, and gentle negative pressure was applied with a 10 cc syringe. For recordings from isolated antennae, two segments were removed from the distal end of the antenna, and each end of the antenna was placed in a glass capillary (0.68 mm tip diameter) filled with physiological saline. All recordings were done in bridge mode using an Axoclamp-2A (Axon Instruments, Foster City, CA) or an SEC-10L (NPI Electronics, Tamm, Germany) amplifier and were stored to digital audio tape (DAT; 5.5 kHz sampling rate; Micro Data Instruments, Woodhaven, NY). The DAT recorder included an analog eight-pole bessel antialiasing filter. Data were redigitized from DAT at 5 kHz (LabVIEW software and NBMIO16L hardware; National Instruments) after DC amplification and anti-alias filtering at 3 kHz (Brownlee Precision Instruments).
Analysis. LFPs were digitally low-pass filtered at 50 Hz. Antennal and antennal nerve recordings were digitally low-pass filtered at 300 Hz. Digital filtering was noncausal (i.e., introduced no phase distortion). Decay time constants for isolated antennal recordings were obtained by fitting, in a least squares sense, the falling region (mean of five trials) from 90 to 30% of peak amplitude with the equation:
where κ is a constant and τ is the reported decay time constant. Spectral and cross-correlation analyses were done on the 1.5 sec response periods of each trial, except for one experiment (see Fig.2) in which these analyses were done on the entire 10 sec trial (for both antennal nerve recordings and LFPs). Cross-correlations were done on mean-subtracted traces and are thus mathematically equivalent to cross-covariances. Power spectra were computed by concatenating response periods from a block of trials and then estimating the power spectral density by Welch’s averaged periodogram method (Welch, 1967). Coherence was computed by separately obtaining cross-power and power spectra as above; coherence was then given by the ratio of the magnitude-squared cross-power to the product of the powers of each signal. Mean membrane potentials were computed by first subtracting the prestimulus resting potential from each trace and then simply computing the mean across trials. Peristimulus-time histograms were constructed by averaging spike times (obtained by using a threshold discriminator algorithm on the intracellular signals) across blocks of trials aligned on the stimulus command, using bins of 25 msec. All off-line analysis was performed with MATLAB (The MathWorks). Results are based on 101 single PN intracellular recordings and 18 paired PN intracellular recordings in 31 animals (including 6 PNs successfully held through picrotoxin injection), 212 Kenyon cell intracellular recordings in 74 animals, 9 in vivo antennal nerve recordings in 11 animals, and 17 isolated antennal recordings from 9 animals.
Fig. 2.
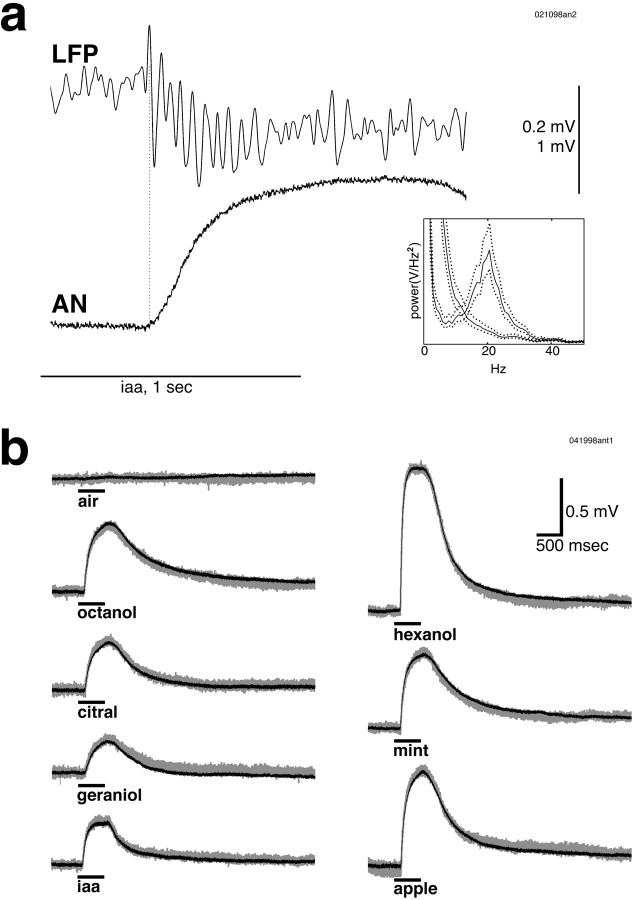
Odor presentation evoked fast oscillations in the mushroom body LFP, but no such oscillations were seen in simultaneously recorded antennal nerve activity. a, Presentation of isoamyl acetate (iaa). The antennal nerve recording showed a slow potential that took several seconds to decay. Odor presentation is indicated by the horizontal line. The onset of odor responses is indicated by thedotted vertical line. Inset, Power spectrum of unfiltered mushroom body LFP (responses to seven consecutive isoamyl acetate presentations) showing a peak at 20 Hz, with no such peak seen in the antennal nerve spectrum of the same trials. Dotted lines show 95% confidence levels. b, Recordings from an isolated antenna in response to charcoal-filtered, dried air and seven odors. The mean of five trials (blackline) is superimposed on a typical single trial (gray line). No oscillatory activity or slow temporal patterns were seen in the antennal recordings in response to these odors. Odor presentation (500 msec) is indicated by the horizontal bar.
RESULTS
Temporal structure of the afferent input
Presentation of odors to an antenna produced a slow potential deflection in the ipsilateral antennal nerve recording, which peaked some time after the end of the odor pulse, and took several seconds to decay. Figure 2a shows a simultaneous recording of the antennal nerve and the mushroom body LFP in response to presentation of isoamyl acetate. Fast oscillations were clearly present in the LFP, but none were seen in the population activity of the primary afferents. Power spectra of the mushroom body LFP showed a peak at 20 Hz. No such peak was seen in the antennal nerve spectrum of the same trials (Fig. 2a, inset). Figure 2b shows recordings from an isolated antenna in response to air and several odors. These responses were consistent across trials, as can be seen from the mean of five trials (Fig. 2b,black line) superimposed on the trace of a typical trial (gray line). No oscillatory activity or slow temporal patterns were seen in the responses to these odors. If normalized to the same peak amplitude, these odor responses were essentially indistinguishable, except for their decay time constants that ranged from 0.4 to 1.0 sec.
Central oscillatory synchronization evoked by electrical stimulation of primary afferent axons
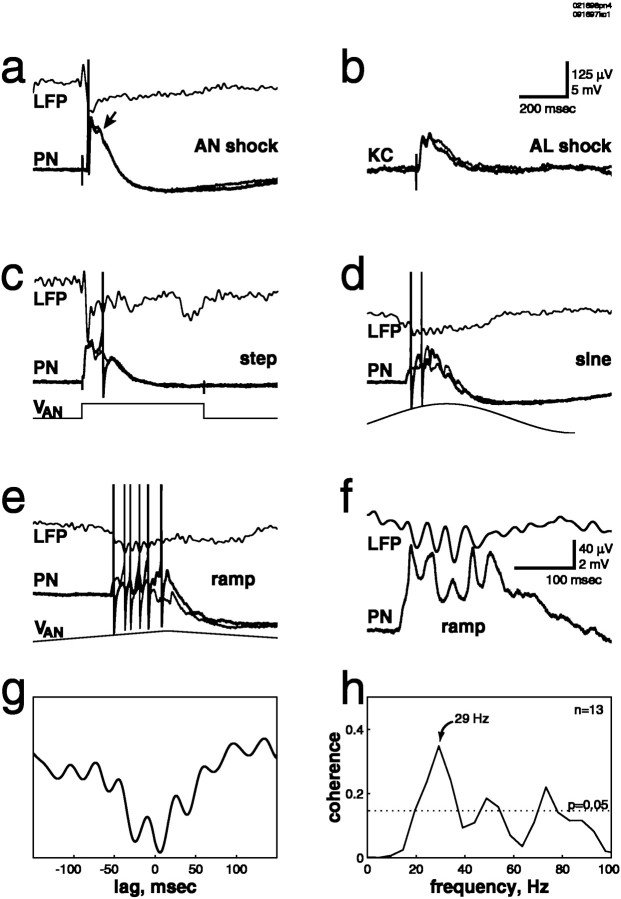
To test whether oscillatory activity in the antennal lobe could be evoked by direct activation of the primary afferent axons, we removed the antenna and stimulated the antennal nerve electrically with a suction electrode. A brief (500 μsec) shock produced a compound PSP in PNs that typically contained a second peak ∼50 msec after the first (Fig. 3a). The mushroom body LFP typically showed a single, biphasic deflection. Traces from two consecutive trials at the same intensity are superimposed, showing the consistency of the response. Single-shock stimulation of PN axons in the antennal lobe also gave rise to compound EPSPs in their synaptic targets in the mushroom body (Fig. 3b, Kenyon cells). As seen for PNs in response to antennal nerve stimulation, these consecutive Kenyon cell EPSPs were separated by ∼50 msec.
Fig. 3.
a, Shock of the antennal nerve with a suction electrode produced a suprathreshold compound PSP, which contained a second peak (indicated by the arrow) ∼50 msec after the first. Two consecutive trials at the same intensity are superimposed (lower traces, thick andthin lines). b, Shock of theAL produced a compound PSP in an intracellularly recorded Kenyon cell (KC), with two peaks at an ∼50 msec interval. Two consecutive trials at the same intensity are superimposed (thick and thin lines).c, Prolonged (step) electrical stimulation of the antennal nerve with an electrode array generated oscillations inPN membrane potential and in the mushroom bodyLFP. Here three cycles are evoked. Two consecutive trials at the same intensity are superimposed (thick andthin lines). VAN, Stimulus waveform. d, e, Prolonged electrical stimulation of the antennal nerve with a suction electrode using sine- or ramp-shaped stimuli generated sustained oscillations inPN membrane potential and in the mushroom bodyLFP. Two consecutive trials at the same intensity are superimposed (thick and thin lines).f, g, The PN was hyperpolarized by current injection of −0.2 nA. f, Note the synchronization of PN membrane potential and mushroom body LFP. g, Cross-correlation of the traces in f is shown.h, Coherence function of PN membrane potential and unfiltered mushroom body LFP, computed over 13 trials, is shown. The dotted line indicates significant difference from zero (p = 0.05). Data in a and c–h are from the samePN.
Because odor-evoked afferent input is sustained (e.g., see Fig.2), we next asked whether sustained electrical stimulation of the primary afferents could generate sustained oscillatory activity. Prolonged electrical stimulation of the antennal nerve (using a 500 msec voltage step) generated rhythmic, summating EPSPs in 93% of PNs. Three cycles were evoked in the example shown in Figure 3c. Two consecutive trials at the same intensity are superimposed, showing the consistency of the response. The interstimulus interval was 30 sec; with intervals <20 sec, successive responses decreased in amplitude and duration (data not shown). By the use of this step stimulation protocol, oscillations were seen in the mushroom body LFP in 90% of animals. The shape of the voltage waveform used for nerve stimulation affected the duration of the evoked oscillatory activity. Stimulation of the antennal nerve with sine- (Fig. 3d) or ramp-shaped (Fig. 3e) voltage stimuli, for example, generated sustained oscillations in PN membrane potential and in the mushroom body LFP. In Figure 3f, a PN was held hyperpolarized by current injection to prevent spiking and enhance the voltage ramp-evoked EPSPs. The precise synchronization of PN membrane potential and mushroom body LFP can be seen directly from the traces (Fig. 3f), from the cross-correlation of those two traces (Fig. 3g), and from the peak at ∼30 Hz in the coherence function (Fig.3h). The consistency of synchronized PN–LFP oscillations evoked by electrical stimulation of the afferent axons can be seen in Figure 4, in which traces from six consecutive trials are superimposed.
The LFP oscillations evoked by odors reflect rhythmic inputs carried by synchronized PN assemblies to the mushroom body. The synchronization of PN and LFP oscillations in response to electrical afferent stimulation suggests that electrical stimuli, like odors, activate synchronized PN assemblies. This was shown directly using paired intracellular recordings from PNs (Fig. 5a). The subthreshold membrane potential oscillations of these two PNs are consistently synchronized. Alternating EPSPs and IPSPs can be seen in PN1. The same electrical stimulus could produce different temporal patterns of subthreshold activity in two PNs, as seen in the pair in Figure 5b. Electrical stimulation consistently evoked an initial (suprathreshold) EPSP in PN1, whereas it evoked an initial IPSP followed by later EPSPs in PN2. Accordingly, the stimulus-evoked firing patterns of the two PNs differed; PN1 always fired on the first cycle of the oscillation, whereas PN2 was prevented from firing by the initial inhibition and thus tended to fire later in the trial. These patterns are reminiscent of the different oscillatory sequences of firing seen in response to odor presentation (Wehr and Laurent, 1996).
PN desynchronization by picrotoxin injection
The synchronized PN and LFP oscillations evoked by odor presentation are abolished by focal injection of picrotoxin into the antennal lobe (MacLeod and Laurent, 1996). Does picrotoxin also block oscillations evoked by electrical stimulation of the primary afferents? To address this question, we injected picrotoxin into the antennal lobe while recording from a PN and the mushroom body. Picrotoxin disrupted the oscillations evoked by electrical stimulation in both PNs and mushroom body LFP. Figure 6ashows a typical trial both before (thick line) and after (thin line) picrotoxin injection, illustrating the loss of rhythmicity in both membrane potential and LFP. The amplitude of the synaptic response in PNs was increased after picrotoxin injection, presumably because of the block of fast inhibitory feedback (MacLeod and Laurent, 1996). The desynchronization of PNs can also be seen in the decreased coherence between PN membrane potential and LFP after picrotoxin injection (Fig.6b). Finally, the consistency of oscillatory responses before and of nonoscillatory responses after picrotoxin injection can be seen in averages calculated over many consecutive trials (Fig.6c,d).
Oscillatory activity could be evoked only over a relatively narrow range of stimulus intensities (Fig. 7). In this preparation, rhythmicity was absent at intensities <110 mV, and only one or two cycles were generated for 110 mV. For stimulus intensities between 120 and 150 mV, regularity and rhythmicity were increased, and up to six cycles could be evoked. For intensities greater than ∼150 mV, oscillatory responses were curtailed, and rhythmicity was finally replaced by brief initial excitation followed by long-lasting inhibition in PNs and by a population spike in the mushroom body LFP (Fig. 7a). After picrotoxin injection, no stimulus intensity could evoke oscillations (Fig. 7b).
Temporal patterns evoked by stimulation of spatial arrays of afferents
To stimulate different arrays of afferent fibers, we first took advantage of the fact that the antennal nerve has two branches (Fig. 1) and used a separate suction electrode to stimulate each branch. Stimulation of either branch evoked the same basic temporal pattern in a given PN. Figure 8, for example, shows a simultaneous recording from two PNs and the LFP in response to stimulation of each branch (a, b) of the antennal nerve. In PNs that showed an initial inhibitory response (as didPN2 in Fig. 5b), the response was similarly initially inhibitory for stimulation of either branch of the antennal nerve. In no case did a PN respond with different temporal patterns for stimulation of the two branches of the antennal nerve.
We then inserted an array of four tungsten stimulating electrodes across the antennal nerve. By choosing any two of the electrodes and applying bipolar stimulation between them, we hoped to stimulate different subsets of the primary afferent fibers, thereby mimicking the ability of odorants to activate different subsets of olfactory receptor neurons. Activating different afferent fiber sets with the same step stimulus generated different temporal response patterns in all PNs tested. In Figure 9a, these different patterns are apparent in the subthreshold activity. Single (Fig. 9a, thick line) and mean (thin line) responses are superimposed to show the reliability of the different temporal patterns. These different temporal patterns remained different across stimulus intensities, as shown in Figure9b. Thus the different temporal patterns cannot be a simple effect of differential recruitment of the same population of afferents by the different stimulating electrodes. For stimulus T2T1, the mean response latency was 6.9 ± 0.5 msec (antennal nerve conduction time not subtracted) and did not vary with stimulus intensity. For stimulus T1T2, however, the latency clearly decreased with increased stimulus intensity, consistent with polysynaptic activity. The field potential response latency was nearly the same across stimulus intensities, as shown in Figure10a. Because the field potential response (which results from PN population activity) precedes the response of the PN in Figure 10a, responses of other PNs must also precede that of the recorded PN. Field potential responses also preceded PN responses in Figure 10, b and c. Staggered PN responses were seen directly in the paired recording shown in Figure 10b. These results indicate that the PNs activated by a given stimulus do not all respond simultaneously and for the same duration, similar to odor responses observed in vivo(Laurent et al., 1996).
Different spatial patterns of afferent stimulation could evoke many different firing patterns. These firing patterns could be seen in individual traces (Fig.11a), and their reliability could be seen from rasters and peristimulus time histograms (Fig.11b). Delayed firing could be caused by an early inhibition, as with stimulus T3T4, or by a delayed excitation, as with stimulus T2T1. Five consecutive trials in response to stimulus T3T4 demonstrate the consistency of the response (Fig. 11c).
Do the temporal patterns evoked by different spatial stimulus arrays bear any relation to the temporal patterns evoked by different odors? To address this, we electrically stimulated the antennal nerve in a preparation in which the antenna remained intact to enable the presentation of odors. Response to odors and electrical stimulation are shown in Figure 12 for a single PN. Three trials are superimposed for each stimulus. Apple and citral evoked an initial inhibition followed by a sustained excitation. Cineole caused an initial excitation followed by inhibition. Isoamyl acetate produced a mixed response with an initial subthreshold excitation, followed by epochs of inhibition and then excitation. This spectrum of temporal patterns for different odors is typical for PNs (Laurent and Davidowitz, 1994; Laurent et al., 1996). Electrical stimulation with either T4T3 or T1T2 evoked an initial inhibition followed by excitation, similar to the responses to apple and citral. Close examination of the response to T1T2 reveals a fast initial IPSP followed by a slow inhibitory component. In contrast, response to T3T1 consisted of a fast, subthreshold EPSP followed by a slow inhibitory component. No electrical stimulus produced an initial suprathreshold excitation for this PN.
DISCUSSION
Oscillatory synchronization
What is the role of primary afferents in the generation of oscillatory synchronization in the locust olfactory system? Odor-evoked oscillations in antennal lobe projection neurons persist after ablation of the mushroom body (Laurent and Davidowitz, 1994) but are abolished by focal injection of picrotoxin into the antennal lobe (MacLeod and Laurent, 1996). Simultaneous extracellular population recordings from the antennal nerve and the mushroom body revealed odor-evoked 20–30 Hz oscillations in the mushroom body LFP but not in the primary afferents. These results collectively show that the 20–30 Hz oscillations seen in the antennal lobe and mushroom body originate in the antennal lobe. This was confirmed in experiments in which olfactory receptor axons were stimulated electrically, thereby eliminating the possibility of afferent-induced rhythmic synchronization of olfactory receptors. Single shocks to the antennal nerve evoked compound EPSPs with two peaks at an ∼50 msec interval in antennal lobe PNs. LFPs two synapses downstream (in the mushroom body) usually failed to reveal more than a single wave of activity. Single shocks delivered directly to the antennal lobe PNs evoked compound EPSPs in mushroom body Kenyon cells, also with successive peaks at an ∼50 msec interval. These results indicate that simple suprathreshold activation of antennal lobe PNs (either synaptically from the antennal nerve or, directly, using an extracellular stimulating electrode) caused at least two consecutive waves of activation in these and possibly other PNs, at a frequency identical to that of odor-evoked responses. Such activity, however, was not sustained, unless unpatterned electrical stimulation was maintained. In this case, oscillatory activity in PNs and in the LFP could be sustained for many cycles. This demonstrates that nonspecific, temporally unstructured afferent input can cause sustained oscillatory activity in the antennal lobe and mushroom body networks, likely via activation of the antennal lobe reverberatory circuitry.
Our results for single-shock stimulation are very similar to those obtained in vertebrates, in which shock stimuli delivered to the olfactory nerve—analogous to the antennal nerve in insects—evoke damped gamma oscillations in field potentials and mitral cell firing in the olfactory bulb (Freeman, 1962, 1972, 1974). Shocks delivered to the lateral olfactory tract—analogous to the PN axon tract in insects—evoke damped field potential gamma oscillations in their target area, the piriform cortex (Freeman, 1959; Haberly and Shepherd, 1973; Rodriguez and Haberly, 1989; Ketchum and Haberly, 1991, 1993). As seen in those experiments, oscillatory activity in the locust antennal lobe could only be evoked within a narrow range of stimulus intensities. These dynamics have been replicated in realistic (Wilson and Bower, 1992) and abstract (Freeman, 1987; Li and Hopfield, 1989) models of mammalian olfactory bulb and piriform cortex.
Finally, focal injection of picrotoxin, an ionotropic GABA receptor antagonist, abolished electrically evoked oscillatory synchronization in the antennal lobe. The fact that no stimulus intensity could evoke oscillations after picrotoxin injection shows that the effect could not be attributed to a change in stimulus threshold. These results indicate that the inhibitory synapses from local GABAergic neurons onto PNs are necessary for oscillatory synchronization, whether the afferents are stimulated by odorants or electrically. Modeling studies have shown that inhibition can synchronize neural firing (van Vreeswijk et al., 1994; Jefferys et al., 1996). We conclude that oscillatory synchronization of antennal lobe neurons is a result of the intrinsic connectivity of olfactory afferents and of local and projection neurons in the antennal lobe.
Slow temporal patterns
Odors evoke slow temporal patterns of activity in PNs. These usually consist of successive epochs of excitation, inhibition, and absence of activity. Different odors evoke different temporal patterns in a given PN, and a given odor evokes different temporal patterns in simultaneously recorded PNs (Laurent and Davidowitz, 1994; Laurent et al., 1996; Wehr and Laurent, 1996). Similar slow temporal patterns are also seen in PNs in other insects (Waldrow, 1977; Christensen and Hildebrand, 1987, 1988; Waldrop et al., 1987; Sun et al., 1993), as well as in mitral cells of the vertebrate olfactory bulb (Kauer, 1974;Meredith, 1986; Hamilton and Kauer, 1989). To what extent are these dynamics driven by slow temporal patterns in the afferent input or, alternatively, generated by the intrinsic circuitry of the antennal lobe? To address this question, we first recorded the population activity of the antennal nerve in response to odor presentation to the antenna and showed that it contains no odor-specific slow temporal patterns. An absence of slow odor-evoked temporal patterns in the population activity does not exclude, however, the possibility that temporal patterns exist in individual or classes of olfactory receptor neurons. Indeed, the many slow temporal patterns seen in PNs are typically not reflected in the mushroom body LFP, i.e., in their averaged activity. We addressed this issue in two ways. First, we attempted to record odor responses from single receptor axons. All attempts failed, probably because of the small size (∼0.1 μm diameter) of the afferent axons. Direct recordings from the peripheral sensilla [e.g., as done with moth (Kaissling, 1986)] were unsuccessful (but see Kafka, 1970; Hansson et al., 1996). Failing this, we used a second method, in which afferents were stimulated electrically from their axons, using constant-voltage waveforms. The results showed that identical and unpatterned afferent stimuli could activate different temporal response patterns in simultaneously recorded PNs. These response patterns closely resembled those evoked by odor presentation in intact animals, in which PN firing is often cycle-specific (Wehr and Laurent, 1996). In addition, activation of different spatial arrays of afferent axons, using identical electrical stimulus waveforms, could often cause different temporal response patterns in individual PNs. Different temporal responses in simultaneously recorded PNs and LFP indicate that the same afferent volley can evoke distinct temporal patterns in different PNs. These responses were shaped by the same features (EPSPs, IPSPs, and periods of silence) seen during responses to odors. This indicates that temporal patterning of the olfactory afferent input is not required for shaping complex response patterns in PNs. Simple depolarization of single PNs by constant intracellular current injection never produced such temporal response patterns in them (data not shown). We conclude that the complexity of PN odor response patterns (oscillatory synchronization and slow temporal patterns) results in great part from the synaptic interactions within the antennal lobe. Although the contribution of temporal activity patterns in the olfactory receptor neurons cannot be excluded, our results indicate that PNs are not simple relay neurons for the afferent input. Rather, their output to downstream areas is profoundly shaped by lateral interactions within the antennal lobe, and these interactions are input-specific. This confirms earlier reports showing that simultaneously recorded PNs that respond to the same odor often respond in a correlated manner from trial to trial [i.e., the firing of one PN during one cycle on a given trial has predictive value about the firing of the other recorded PN, in that or a different cycle, on the same trial (Wehr and Laurent, 1996)]. How slow temporal response patterns arise from these lateral interactions, however, remains primarily speculative. Although realistic models of the olfactory bulb produce complex temporal response patterns in mitral cells, the mechanisms for their generation are not understood in detail (White et al., 1992). Meredith (1986,1992) has proposed that slow temporal patterns in mitral cells are a result of nonmonotonic intensity response functions, combined with the necessarily finite rate of intensity increase associated with the onset of an odor pulse. The fact that slow temporal patterns are evoked in PNs by step electrical stimuli, which are not subject to the rise-time limitations of odor stimulation, suggests that the temporal structure of these responses is generated by reverberatory lateral interactions within the antennal lobe, without dependence on the rate of intensity increase or nonmonotonicity of PN intensity response functions.
These results demonstrate that the computations performed by the antennal lobe include, in addition to a spatial (or identity) mapping of odor information (Hildebrand and Shepherd, 1997), a coordinate transformation from spatial input patterns into temporal output patterns. To our knowledge, this is the first report of such a transformation in a sensory system, although stimulus-related information has been demonstrated in higher principal components of visual cortical neuron responses in primates (Richmond and Optican, 1987; McClurkin et al., 1991). The existence of such transformations is known in some motor systems, where (for example) stimulation of so-called command neurons can elicit specific and complex motor outputs (Larimer, 1988) that usually involve temporal patterns of firing in neural assemblies. The functional significance of such a transformation in a sensory system is still unclear. Piriform cortex has been proposed to function as a content-addressable memory (Haberly and Bower, 1989), as suggested by its recurrent architecture and the demonstration of long-term potentiation in the afferent and associative pathways (Kanter and Haberly, 1990). Recurrent network models incorporating time delays (Tank and Hopfield, 1987), or fast and slow feedback (Kleinfeld, 1986; Sompolinsky and Kanter, 1986), can perform sequence recognition. Thus piriform cortex, by virtue of its fast and slow associative feedback pathways, might store and recognize spatiotemporal patterns of inputs from the olfactory bulb (Ketchum and Haberly, 1991). The mushroom body in insects contains putative feedback pathways in the protocerebral lobe (Mobbs, 1982; Gronenberg, 1987;MacLeod et al., 1998) and has been implicated in learning and memory in honeybees and Drosophila (Davis, 1993; Menzel and Muller, 1996). Neurons in these putative feedback pathways are sensitive to the temporal structure of their inputs and show odor responses whose specificity is degraded when their inputs are desynchronized by picrotoxin (MacLeod et al., 1998). This suggests that the information conveyed by oscillatory synchronization of PNs is decoded by these downstream neurons and/or by Kenyon cells. These circuits may therefore be able to store and recognize spatiotemporal input patterns from the antennal lobe, which consist of rhythmic sequences of synchronized PN assemblies shaped by slow temporal patterns in participating PNs.
Footnotes
This research was supported by a National Science Foundation grant and by National Institutes of Health and Howard Hughes Medical Institute training grants.
Correspondence should be addressed to Dr. Gilles Laurent, California Institute of Technology, Biology Division, Computation and Neural Systems Program, 139-74, Pasadena, CA 91125.
Dr. Wehr’s present address: Center for Neuroscience, University of California, Davis, 1544 Newton Court, Davis, CA 95616.
REFERENCES
- 1.Adrian E. Olfactory reactions in the brain of the hedgehog. J Physiol (Lond) 1942;100:459–473. doi: 10.1113/jphysiol.1942.sp003955. [DOI] [PMC free article] [PubMed] [Google Scholar]
- 2.Adrian E. The electrical activity of the mammalian olfactory bulb. Electroenceph Clin Neurophysiol. 1950;2:377–388. doi: 10.1016/0013-4694(50)90075-7. [DOI] [PubMed] [Google Scholar]
- 3.Christensen T, Hildebrand J. Male-specific, sex pheromone-selective projection neurons in the antennal lobes of the moth Manduca sexta. J Comp Physiol [A] 1987;160:553–569. doi: 10.1007/BF00611929. [DOI] [PubMed] [Google Scholar]
- 4.Christensen T, Hildebrand J. Frequency coding by central olfactory neurons in the sphinx moth Manduca sexta. Chem Senses. 1988;13:123–130. [Google Scholar]
- 5.Christensen T, Waldrop B, Harrow I, Hildebrand J. Local interneurons and information processing in the olfactory glomeruli of the moth Manduca sexta. J Comp Physiol [A] 1993;173:385–399. doi: 10.1007/BF00193512. [DOI] [PubMed] [Google Scholar]
- 6.Davis R. Mushroom bodies and Drosophila learning. Neuron. 1993;11:1–14. doi: 10.1016/0896-6273(93)90266-t. [DOI] [PubMed] [Google Scholar]
- 7.Dorries K, Kauer J. Field potential oscillations in frog and salamander olfactory bulb and epithelium. Soc Neurosci Abstr. 1996;22:2019. [Google Scholar]
- 8.Freeman W. Distribution in time and space of prepyriform electrical activity. J Neurophysiol. 1959;22:644–665. doi: 10.1152/jn.1959.22.6.644. [DOI] [PubMed] [Google Scholar]
- 9.Freeman W. Olfactory bulb response in the turtle. Nature. 1962;193:782–783. [Google Scholar]
- 10.Freeman W. Effects of surgical isolation and tetanization on prepyriform cortex in cats. J Neurophysiol. 1968;31:349–357. doi: 10.1152/jn.1968.31.3.349. [DOI] [PubMed] [Google Scholar]
- 11.Freeman W. Spatial divergence and temporal dispersion in primary olfactory nerve of cat. J Neurophysiol. 1972;35:733–744. doi: 10.1152/jn.1972.35.6.733. [DOI] [PubMed] [Google Scholar]
- 12.Freeman W. Average transmission distance from mitral-tufted to granule cells in olfactory bulb. Electroenceph Clin Neurophysiol. 1974;36:609–618. doi: 10.1016/0013-4694(74)90227-2. [DOI] [PubMed] [Google Scholar]
- 13.Freeman W. Mass action in the nervous system. Academic; New York: 1975. [Google Scholar]
- 14.Freeman W. Simulation of chaotic EEG patterns with a dynamic-model of the olfactory system. Biol Cybern. 1987;56:139–150. doi: 10.1007/BF00317988. [DOI] [PubMed] [Google Scholar]
- 15.Gray C, Konig P, Engel A, Singer W. Oscillatory responses in cat visual cortex exhibit inter-columnar synchronization which reflects global stimulus properties. Nature. 1989;338:334–337. doi: 10.1038/338334a0. [DOI] [PubMed] [Google Scholar]
- 16.Gronenberg W. Anatomical and physiological properties of feedback neurons of the mushroom bodies in the bee brain. Exp Biol. 1987;46:115–125. [PubMed] [Google Scholar]
- 17.Haberly L, Bower J. Olfactory cortex: model circuit for study of associative memory? Trends Neurosci. 1989;12:258–264. doi: 10.1016/0166-2236(89)90025-8. [DOI] [PubMed] [Google Scholar]
- 18.Haberly L, Shepherd G. Current density analysis of opossum prepyriform cortex. J Neurophysiol. 1973;36:789–802. doi: 10.1152/jn.1973.36.4.789. [DOI] [PubMed] [Google Scholar]
- 19.Hamilton K, Kauer J. Patterns of intracellular-potentials in salamander mitral tufted cells in response to odor stimulation. J Neurophysiol. 1989;62:609–625. doi: 10.1152/jn.1989.62.3.609. [DOI] [PubMed] [Google Scholar]
- 20.Hansson B, Ochieng S, Grosmaitre X, Anton S, Njagi P. Physiological responses and central nervous projections of antennal olfactory receptor neurons in the adult desert locust, Schistocerca gregaria (Orthoptera: Acrididae). J Comp Physiol [A] 1996;179:157–167. [Google Scholar]
- 21.Hildebrand J, Shepherd G. Mechanisms of olfactory discrimination: converging evidence for common principles across phyla. Annu Rev Neurosci. 1997;20:595–631. doi: 10.1146/annurev.neuro.20.1.595. [DOI] [PubMed] [Google Scholar]
- 22.Jefferys J, Traub R, Whittington M. Neuronal networks for induced “40 Hz” rhythms. Trends Neurosci. 1996;19:202–208. doi: 10.1016/s0166-2236(96)10023-0. [DOI] [PubMed] [Google Scholar]
- 23.Kafka W. MolekulareWechselwirkungen bei der Erregung einzelner Riechzellen. Z vergl Physiologie. 1970;70:105–143. [Google Scholar]
- 24.Kaissling K. Chemo-electrical transduction in insect olfactory receptors. Annu Rev Neurosci. 1986;9:121–145. doi: 10.1146/annurev.ne.09.030186.001005. [DOI] [PubMed] [Google Scholar]
- 25.Kanter E, Haberly L. NMDA-dependent induction of long-term potentiation in afferent and association fiber systems of piriform cortex in vitro. Brain Res. 1990;525:175–179. doi: 10.1016/0006-8993(90)91337-g. [DOI] [PubMed] [Google Scholar]
- 26.Kauer J. Response patterns of amphibian olfactory bulb neurones to odor stimulation. J Physiol (Lond) 1974;243:695–715. doi: 10.1113/jphysiol.1974.sp010772. [DOI] [PMC free article] [PubMed] [Google Scholar]
- 27.Ketchum K, Haberly L. Fast oscillations and dispersive propagation in olfactory cortex and other cortical areas: a functional hypothesis. In: Davis J, Eichenbaum H, editors. Olfaction: a model system for computational neuroscience. MIT; Cambridge, MA: 1991. pp. 69–100. [Google Scholar]
- 28.Ketchum K, Haberly L. Synaptic events that generate fast oscillations in piriform cortex. J Neurosci. 1993;13:3980–3985. doi: 10.1523/JNEUROSCI.13-09-03980.1993. [DOI] [PMC free article] [PubMed] [Google Scholar]
- 29.Kleinfeld D. Sequential state generation by model neural networks. Proc Natl Acad Sci USA. 1986;83:9469–9473. doi: 10.1073/pnas.83.24.9469. [DOI] [PMC free article] [PubMed] [Google Scholar]
- 30.Larimer J. The command hypothesis–a new view using an old example. Trends Neurosci. 1988;11:506–510. doi: 10.1016/0166-2236(88)90013-6. [DOI] [PubMed] [Google Scholar]
- 31.Laurent G. Dynamical representation of odors by oscillating and evolving neural assemblies. Trends Neurosci. 1996;19:489–496. doi: 10.1016/S0166-2236(96)10054-0. [DOI] [PubMed] [Google Scholar]
- 32.Laurent G, Davidowitz H. Encoding of olfactory information with oscillating neural assemblies. Science. 1994;265:1872–1875. doi: 10.1126/science.265.5180.1872. [DOI] [PubMed] [Google Scholar]
- 33.Laurent G, Seymour-Laurent K, Johnson K. Dendritic excitability and a voltage-gated calcium current in locust nonspiking local interneurons. J Neurophysiol. 1993;69:1484–1498. doi: 10.1152/jn.1993.69.5.1484. [DOI] [PubMed] [Google Scholar]
- 34.Laurent G, Wehr M, Davidowitz H. Temporal representations of odors in an olfactory network. J Neurosci. 1996;16:3837–3847. doi: 10.1523/JNEUROSCI.16-12-03837.1996. [DOI] [PMC free article] [PubMed] [Google Scholar]
- 35.Li Z, Hopfield J. Modeling the olfactory-bulb and its neural oscillatory processings. Biol Cybern. 1989;61:379–392. doi: 10.1007/BF00200803. [DOI] [PubMed] [Google Scholar]
- 36.MacLeod K, Laurent G. Distinct mechanisms for synchronization and temporal patterning of odor-encoding neural assemblies. Science. 1996;274:976–979. doi: 10.1126/science.274.5289.976. [DOI] [PubMed] [Google Scholar]
- 37.MacLeod K, Bäcker A, Laurent G. Who reads temporal information contained across synchronized and oscillatory spike trains? Nature. 1998;398:693–698. doi: 10.1038/27201. [DOI] [PubMed] [Google Scholar]
- 38.McClurkin J, Optican L, Richmond B, Gawne T. Concurrent processing and complexity of temporally encoded neuronal messages in visual perception. Science. 1991;253:675–677. doi: 10.1126/science.1908118. [DOI] [PubMed] [Google Scholar]
- 39.Menzel R, Muller U. Learning and memory in honeybees: from behavior to neural substrates. Annu Rev Neurosci. 1996;19:379–404. doi: 10.1146/annurev.ne.19.030196.002115. [DOI] [PubMed] [Google Scholar]
- 40.Meredith M. Patterned response to odor in mammalian olfactory bulb: the influence of intensity. J Neurophysiol. 1986;56:572–597. doi: 10.1152/jn.1986.56.3.572. [DOI] [PubMed] [Google Scholar]
- 41.Meredith M. Neural circuit computation: complex patterns in the olfactory-bulb. Brain Res Bull. 1992;29:111–117. doi: 10.1016/0361-9230(92)90014-o. [DOI] [PubMed] [Google Scholar]
- 42.Mobbs P. The brain of the honeybee Apis mellifera. 1. The connections and spatial organization of the mushroom bodies. Philos Trans R Soc Lond [Biol] 1982;298:309–354. [Google Scholar]
- 43.Pelosi P. Perireceptor events in olfaction. J Neurobiol. 1996;30:3–19. doi: 10.1002/(SICI)1097-4695(199605)30:1<3::AID-NEU2>3.0.CO;2-A. [DOI] [PubMed] [Google Scholar]
- 44.Rall W, Shepherd G. Theoretical reconstruction of field potentials and dendrodendritic synaptic interactions in olfactory bulb. J Neurophysiol. 1968;31:884–915. doi: 10.1152/jn.1968.31.6.884. [DOI] [PubMed] [Google Scholar]
- 45.Restrepo D, Teeter J, Schild D. Second messenger signaling in olfactory transduction. J Neurobiol. 1996;30:37–48. doi: 10.1002/(SICI)1097-4695(199605)30:1<37::AID-NEU4>3.0.CO;2-H. [DOI] [PubMed] [Google Scholar]
- 46.Richmond B, Optican L. Temporal encoding of two-dimensional patterns by single units in primate inferior temporal cortex. II. Quantification of response waveform. J Neurophysiol. 1987;57:147–161. doi: 10.1152/jn.1987.57.1.147. [DOI] [PubMed] [Google Scholar]
- 47.Rodriguez R, Haberly L. Analysis of synaptic events in the opossum piriform cortex with improved current source density techniques. J Neurophysiol. 1989;61:702–718. doi: 10.1152/jn.1989.61.4.702. [DOI] [PubMed] [Google Scholar]
- 48.Shadlen M, Newsome W. The variable discharge of cortical neurons: implications for connectivity, computation, and information coding. J Neurosci. 1998;18:3870–3896. doi: 10.1523/JNEUROSCI.18-10-03870.1998. [DOI] [PMC free article] [PubMed] [Google Scholar]
- 49.Sompolinsky H, Kanter I. Temporal association in asymmetric neural networks. Phys Rev Lett. 1986;57:2861–2864. doi: 10.1103/PhysRevLett.57.2861. [DOI] [PubMed] [Google Scholar]
- 50.Stopfer M, Bhagavan S, Smith B, Laurent G. Impaired odour discrimination on desynchronization of odour-encoding neural assemblies. Nature. 1997;390:70–74. doi: 10.1038/36335. [DOI] [PubMed] [Google Scholar]
- 51.Sun X, Fonta C, Masson C. Odor quality processing by bee antennal lobe interneurons. Chem Senses. 1993;18:355–377. [Google Scholar]
- 52.Tank D, Hopfield J. Neural computation by concentrating information in time. Proc Natl Acad Sci USA. 1987;84:1896–1900. doi: 10.1073/pnas.84.7.1896. [DOI] [PMC free article] [PubMed] [Google Scholar]
- 53.van Vreeswijk C, Abbott L, Ermentrout B. When inhibition not excitation synchronizes neural firing. J Comput Neurosci. 1994;1:313–321. doi: 10.1007/BF00961879. [DOI] [PubMed] [Google Scholar]
- 54.Waldrop B, Christensen T, Hildebrand J. GABA-mediated synaptic inhibition of projection neurons in the antennal lobes of the sphinx moth Manduca sexta. J Comp Physiol [A] 1987;161:23–32. doi: 10.1007/BF00609452. [DOI] [PubMed] [Google Scholar]
- 55.Waldrow U. CNS units in cockroach (Periplaneta americana): specificity of response to pheromones and other odor stimuli. J Comp Physiol [A] 1977;116:1–17. [Google Scholar]
- 56.Wehr M, Laurent G. Odor encoding by temporal sequences of firing in oscillating neural assemblies. Nature. 1996;384:162–166. doi: 10.1038/384162a0. [DOI] [PubMed] [Google Scholar]
- 57.Welch P. The use of fast Fourier transform for the estimation of power spectra: a method based on time averaging over short, modified periodograms. IEEE Trans Audio Electroacoust AU. 1967;15:70–73. [Google Scholar]
- 58.White J, Hamilton K, Neff S, Kauer J. Emergent properties of odor information coding in a representational model of the salamander olfactory-bulb. J Neurosci. 1992;12:1772–1780. doi: 10.1523/JNEUROSCI.12-05-01772.1992. [DOI] [PMC free article] [PubMed] [Google Scholar]
- 59.Wilson M, Bower J. Cortical oscillations and temporal interactions in a computer-simulation of piriform cortex. J Neurophysiol. 1992;67:981–995. doi: 10.1152/jn.1992.67.4.981. [DOI] [PubMed] [Google Scholar]


