Abstract
We have studied, at high resolution, the sizes and pattern of dendrites of directionally selective retinal ganglion cells in the rabbit. The dendrites had a distinctive pattern of branching. The major dendritic trunks were relatively thick, beginning at ∼1 μm and tapering to ∼0.5 μm in diameter. Higher order dendrites exiting from them generally stepped abruptly to a diameter of 0.4–0.6 μm, which they maintained throughout their length. Recording confirmed the existence of a zone within the receptive field, usually occupying 20–25% of its area, where direction of movement was only weakly discriminated. The dendritic arbors of cells, injected with Lucifer yellow after recording, revealed no difference in dendritic structure between the discriminating and nondiscriminating zones. The nondiscriminating zone was located on the preferred side of the receptive field (the side from which movement in the preferred direction originates). This is consistent with a mechanism of direction selectivity based on inhibition generated by movement in the null direction but not with feedforward excitation, as occurs in flies and is postulated in some models of mammalian direction selectivity.
Keywords: retina, direction selectivity, mechanism, anatomy, physiology, structure
In their original descriptions of directionally selective retinal ganglion cells, Barlow and Levick (1965) reported that the receptive fields of these cells contain an area in which local movements in any direction generate a similar electrophysiological response, a nondiscriminating zone within an otherwise directionally selective receptive field. Here we report a detailed study of the nondiscriminating zone and its underlying dendritic arbor. We recorded from directionally selective (DS) cells in rabbit retinas and carefully mapped the nondiscriminating zone. We asked, first, whether there are features within the dendritic arbors of the cells that distinguish the discriminating from nondiscriminating zones, as possible clues to the directional mechanism. This should be a sensitive way to detect such specializations, if they exist, because the comparison is made within the arbor of a single ganglion cell.
A second reason to reexamine the nondiscriminating zone was that it has implications for the mechanism of direction selectivity. There are two general classes of possible models, one using feedforward inhibition generated by stimulus movement in the null direction and an alternative using feedforward excitation generated by stimuli moving in the preferred direction. The former is used in the classic formulation ofBarlow and Levick (1965) and several subsequent ones (Wyatt and Daw, 1975; Torre and Poggio, 1978; Ariel and Daw, 1982b). The latter was used in the first models of direction selectivity in flies and in a recent model of the mammalian cell (Reichardt, 1961; Franceschini et al., 1989; Borst and Egelhaaf, 1989, 1995; Borg-Graham and Grzywacz, 1992; Amthor and Grzywacz, 1993; Douglass and Strausfeld, 1995). As will be discussed later, the location of the nondiscriminating zone appears to distinguish between the two.
As a prelude to these experiments, we made a detailed, quantitative examination of the microstructure of the dendritic arbor of the DS cells. Many descriptions of the overall dendritic pattern of the cells have been published (Amthor et al., 1984; Famiglietti, 1992; Oyster et al., 1993; Yang and Masland, 1994; Vaney, 1994), including a preliminary measurement of the major initial taper of the dendrites (Yang and Masland, 1994), but none that attempt quantitatively realistic measurements. Because these may be critical for the ultimate biophysical understanding of the cells, we present them here. To measure the thickness of dendrites is not a trivial problem, because of unknowable distortions during tissue processing and because these thin structures challenge the resolution of light microscopy. We therefore made the measurements in living tissue and used internal optical standards as a control for optical errors.
MATERIALS AND METHODS
The general methods for isolating and maintaining rabbit retinas, recording from them, studying receptive fields, and injecting the cells have all been described in previous papers and will be briefly summarized here (Yang and Masland, 1994; Peters and Masland, 1996). Analysis of the dendrites by confocal microscopy will be described in more detail.
New Zealand white rabbits of either sex, weighing 2–4 kg were anesthetized by intramuscular injection of ketamine (50 mg/kg) and xylazine (10 mg/kg). The ganglion cells were labeled either by injecting 10 μl fast blue (2%) into the optic nerve or 10 μl of 4,6 diamidino-2-phenylindole (5 μg) intraocularly. Topical anesthetic (proparacaine hydrochloride 0.5% ophthalmic solution) was applied in the operated area, and the animal was allowed to recover. Three to four days later, the animal was enucleated under deep anesthesia using urethane (25%; 2 gm/kg, i.p.) and ketamine (50 mg/kg). The animal was then euthanized with an intravenous overdose of urethane or ketamine, in accordance with institutional procedures. The enucleated eye was hemisected and everted over a Teflon post. The retina was carefully peeled off the pigment epithelium. A small piece of retina was cut off and placed on a piece of filter paper. A loose plastic mesh weighted by a platinum ring was then placed on top of the retina. The preparation was moved to a chamber attached to a microscope stage and superfused at 37°C with Ames’ medium saturated with 95% O2and 5% CO2.
Stimuli were generated on a display monitor (Tektronix 602) by a computer program that allowed generation of stationary or moving spots or rectangles or various stationary or drifting gratings. It was reflected upward by a mirror positioned beneath the microscope. A microscope objective (Olympus Optical, Tokyo, Japan; 20×; NA, 0.4) replaced the condenser and focused the stimulus on the retina.
Retinal ganglion cells labeled with fluorescent tracer were visualized under brief fluorescence illumination (365 nm excitation), and the ON-OFF DS cells were targeted with the aid of soma features previously described (Yang and Masland, 1994; He and Masland, 1997). The activity of single ganglion cells was recorded with tungsten-in-glass electrodes (Levick, 1972), and amplified, displayed, and stored by conventional techniques. The boundaries of the receptive field and its directional responses were recorded on a Mylar overlay placed on the face of a slave monitor. After recording was completed, the extracellular electrode was removed, and the cell was injected with Lucifer yellow, again using the labeled soma as a guide. Landmarks were projected onto the image of the injected cell from the stimulating monitor, to ensure alignment of the physiological receptive field with the injected cell. The injected cell and the landmarks were photographed in situ.
Confocal microscopy of the dendrites. A satisfactory injection was characterized by abrupt termination of the dendrites at their ends, without large, beaded swellings along them. After a cell had been injected, the retina was placed on a microscope slide prepared with 50 μm plastic supports placed on each end. A standard coverslip was placed on the supports, so that the coverslip bridged the retina with minimal pressure, and a volume of Ames’ medium remained as a metabolic reservoir. The retina was immersed in Ames’ medium, the edges of the coverslip were sealed with nail polish, and the preparation was allowed to cool to room temperature (∼24°C).
All measurements were made using a Leica (Nussloch, Germany) confocal microscope. At low power (Leica PL Fluotar; 16×; NA, 0.50) an image of whole dendritic tree was taken. Using a 100× objective and a zoom factor of 4, high-magnification images were then acquired at several locations along a dendritic path from the soma to the periphery (Leica PL Apo; 100×, NA, 1.40). At the end of every high-power image, a low-power image was taken to ensure that the overall dendritic morphology did not undergo any observable change or distortion.
The procedure for measuring the diameters of the dendrites was as follows. In every high-magnification image in which measurements were to be made, a line was drawn in an area containing no dendrites. The averaged pixel intensity of this line was taken as the background level. A line was drawn perpendicularly across the dendrite at the point of interest, generating a histogram of pixel intensity along the line. With a threshold at 5× background, the diameter of the dendrite was measured in pixels and then converted to micrometers.
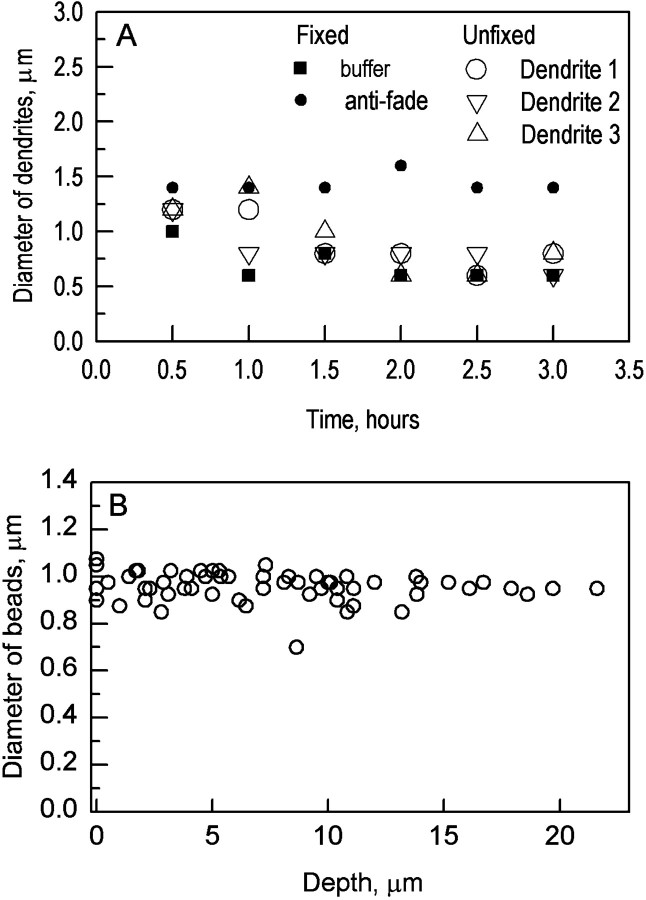
Because the preparations were unfixed, and the microscopy could take 2–3 hr, it was important to ensure that the morphology of the cell did not change over the period of measurement. For two injected cells, images of selected regions of the dendritic arbor were taken repeatedly at intervals of 30 min. The conditions of preparing and measuring the specimen were kept identical to the other experiments. To evaluate the bleaching caused by the laser beam in repeated measurements, two other injected cells were coverslipped in 0.1 m phosphate buffer and Vectashield (H-100; Vector Laboratories, Burlingame, CA), respectively, after fixation (4% formaldehyde in 0.1 mphosphate buffer). Images of preselected areas were taken repeatedly. Results of this series of experiments are shown in Figure1.
Fig. 1.
Optical and tissue controls. A, Repeated measurement of dendrites in unfixed and fixed tissue. For each cell, a single point within the dendritic arbor was chosen for study and imaged at 30 min intervals. For both fixed and unfixed tissue, there was a fall in the apparent diameter of the dendrites with time. However, the effect of mounting the tissue in an anti-fading compound shows that this is caused almost entirely by fading. For the actual measurements, a point in the dendritic arbor was imaged only once, so fading is not a major issue. B, Measured sizes of agar-embedded polystyrene beads as a function of depth within the agar substrate. Their nominal diameter was 1 μm. There was some scatter in the measured sizes of the beads, but no significant variation with optical depth.
As an optical control, fluorescent microspheres of known sizes (0.2, 0.5, 1.0, and 2.0 μm; Molecular Probes L-5473) were embedded in 4% agar in 0.1 m phosphate buffer and sectioned in a vibratome at 50 μm. Fluorescent beads appeared throughout the thickness of the section. The population of beads was through-focused at a zinterval of 0.05 μm, using the same objective as for high-power viewing of the dendrites. The widest apparent diameter of each bead was measured.
RESULTS
The size and pattern of the distal dendrites
We injected directionally selective retinal ganglion cells with Lucifer yellow in vitro, after which dendrites were measured from images generated on a confocal microscope. The retinas were studied unfixed; we counted on the strongly protective effects of cooling to room temperature to prevent degradation of the tissue (Ames and Li, 1992; Ames et al., 1992, 1995). To check this assumption, we imaged selected proximal dendrites at a series of times, ranging from immediately after injection to several hours later, the time required to collect confocal images at many points within the dendritic arbor.
Figure 1A shows the results obtained when the same dendrites were imaged once every 30 min for 3.5 hr. The points show the average diameter measured for three different dendrites. Similar results were obtained from observations made on another cell (data not shown). There was a fall in apparent diameter over the course of the experiment. However, it appears that this was almost entirely because of the bleaching caused when the same point on the dendrite was repeatedly imaged: a virtually identical decrease was observed when dendrites of a fixed cell were studied. In confirmation, mounting a cell in an anti-fading compound (Vectashield; Vector Laboratories) entirely prevented the apparent fall in diameter. For the actual measurement, a point on a dendrite was imaged only once and should not be subject to substantial bleaching. We conclude that the dendrites were stable during the time required for measurement (this conclusion was also supported by comparing low-power images of the whole arbor taken at the beginning and end of the experiment).
A second issue was the possibility of optical blurring of the dendrites. To evaluate blurring, we imaged polystyrene beads of known diameter. Such beads are guaranteed by the manufacturer only to have a certain mean diameter; there is some variation of the actual size of individual beads. It was therefore necessary to measure an adequate sample of beads. More importantly, we wanted to know if the optical behavior of the system changed as a function of depth within the mounting medium, because the dendrites of the retinal ganglion cells are located ∼25 μm below the surface of the tissue. We therefore mounted suspensions of beads in 4% agar in 0.1 m phosphate buffer, an aqueous medium optically similar to that in which the retinas were mounted, and measured the apparent diameters of the beads (Fig. 1B).
The apparent diameters of the beads varied little with depth. They were distributed around a value of 0.96 μm, indicated by the internal scale of the confocal microscope. Whether the slight difference was caused by inaccuracies of the internal calibration of the instrument, to the threshold used for our measurement, or to inaccuracy in the actual size of the beads, is uncertain; the second is the more likely because of its somewhat arbitrary nature. Because the difference is small, no correction for it was made. Images of these beads (and beads of several other sizes) are shown in Figure2, inset F.
Fig. 2.
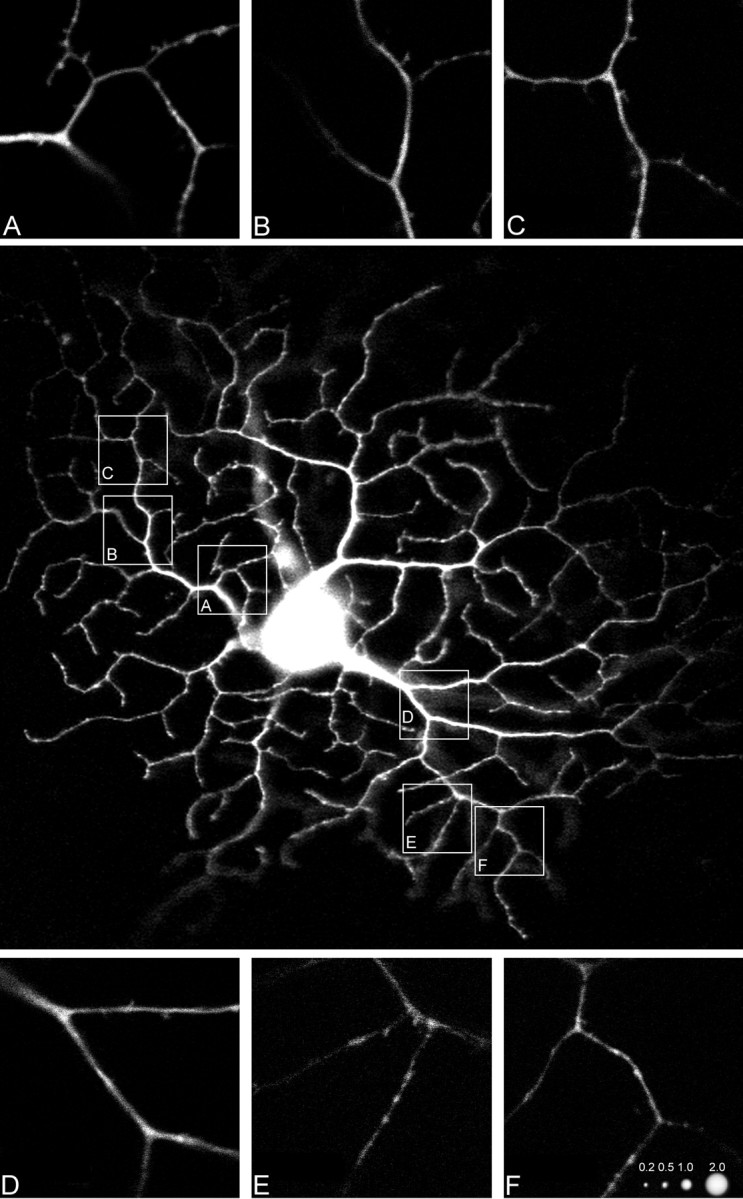
Low-power confocal micrograph of a directionally selective retinal ganglion cell injected with Lucifer yellow. Unprocessed confocal image. Insets show the designated areas at higher magnification. Images of polystyrene beads taken under the same optical conditions are shown in F, together with their nominal diameters.
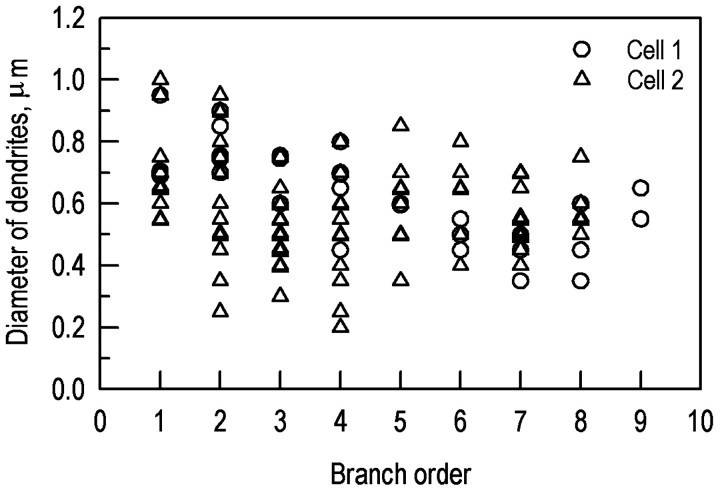
Two well filled cells were chosen for detailed study. One of the filled cells is shown in Figure 2, recorded by confocal microscopy with no further electronic processing. For each of the two cells, the diameters of the dendrites were measured at a series of positions. Figure3 shows the dendritic diameter as a function of branch order. The zero order dendrites are those that directly exit the soma and average 0.72 μm in diameter; the ninth order average 0.60 μm. At points distal to the second order, the average diameter of the dendritic arbor was essentially constant at ∼0.55 μm. The primary dendrites were clearly larger than later ones, but there was considerable variability at all subsequent orders when the dendrites were viewed in this way.
Fig. 3.
Diameter of the dendrites as a function of branching order. The variability occurs because the dendrites do not decrease in diameter in a progressive way as a function of branch order. Instead, the distal dendrites achieve a relatively constant diameter as soon as they have left a primary or secondary one, and do not thin much thereafter.
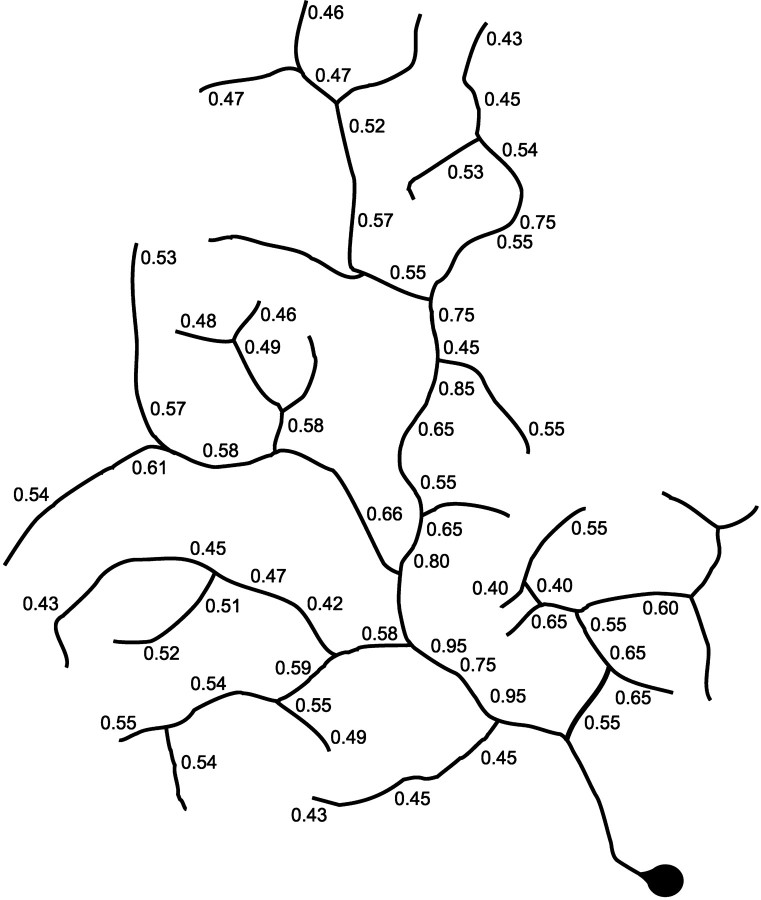
Much of the variability occurs because the dendrites do not decrease in size in a rigidly progressive way with successive branchings. As is readily seen in Figure 2, dendrites as thin as 0.45 μm can exit directly from the largest (0.95 μm) primary stalks. This represents a direct transition from the thickest processes found anywhere in the arbor to the thinnest. On the other hand, the thin dendrites themselves can branch with little or no decrease in diameter subsequent to the branch point. In sum, the existence of a branching point is a poor predictor of the relationship between the diameters of the processes before and after branching. Figure 4illustrates these transitions diagrammatically for part of the cell shown in Figure 2.
Fig. 4.
Schematic representation of one of the major dendritic branches of the cell shown in Figure 2, showing the diameters of dendrites at selected points (in Fig. 2, this is the arbor that includes insets A–C.)
The dendritic arbor in the nondiscriminating zone
As has been repeatedly described, the preferred and null directions were oriented 180° apart. Movement in the preferred direction gave strong responses, movement in the null direction weak responses, and this difference was maintained for a variety of light or dark spots or edges. When tested with stationary stimuli, the cells responded at light on and at off. When a flashing stimulus was tested at various positions along the preferred-null axis, there was no consistent difference in response between different portions of the receptive field.
To moving stimuli, however, there was an asymmetry. On the preferred side of the receptive field, there was a zone in which the direction of movement was poorly discriminated. This zone could be quite large, covering as much as 25% of the receptive field determined by flashing spots (Barlow and Levick, 1965; He, 1994). This was tested by placing a 100 × 200 μm aperture in one of three zones of the receptive field (Fig. 5). The response histograms in Figure 5 show separately the response to the leading edge and the trailing edge. In the nondiscriminating zone (located on the preferred side), the difference between movement in the preferred and null directions was notably less than elsewhere. After recording was completed, the cells were injected with Lucifer yellow. Figure 5 shows the dendritic arbor of one of them, with the tested zones (the positions of the test aperture) superimposed.
Fig. 5.
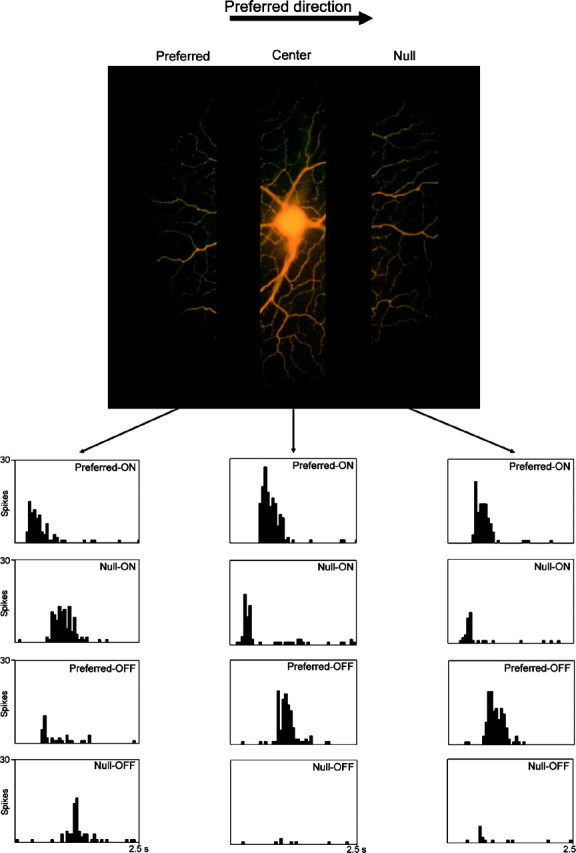
Responses to movement in the nondiscriminating zone of a directionally selective retinal ganglion cell. The responses of the cell to edges moving behind an aperture were tested. The aperture was located in one of these zones, on the null side, the preferred side, or the center of the receptive field. The stimulus was a light rectangle 500 × 500 μm moving at 200 μm/sec behind a 100 × 200 μm aperture. ON responses refer to the leading edge of the moving stimulus, OFF responses to the trailing edge. The moving edges were aligned parallel to the longer axis of the aperture. The zones illustrated in the micrograph are 100-μm-wide but extend further vertically than the aperture tested, to allow better visualization of dendritic detail in the three tested zones. After recording had been completed, the cell was injected with Lucifer yellow. When the aperture was positioned on the preferred side of the receptive field, the difference in response between preferred and null directions was much less than elsewhere in the receptive field. Histograms show mean responses for 10 trials.
We could discern no difference between the dendritic arbor in the discriminating and nondiscriminating zones for any cell studied in this way. The combined recording and injection was repeated for 15 cells with the same result, summarized in Figure6. Although some cells tested with these fairly large stimuli showed only a diminution of direction selectivity, the nondiscriminating zone was always located on the preferred side of the receptive field.
Fig. 6.
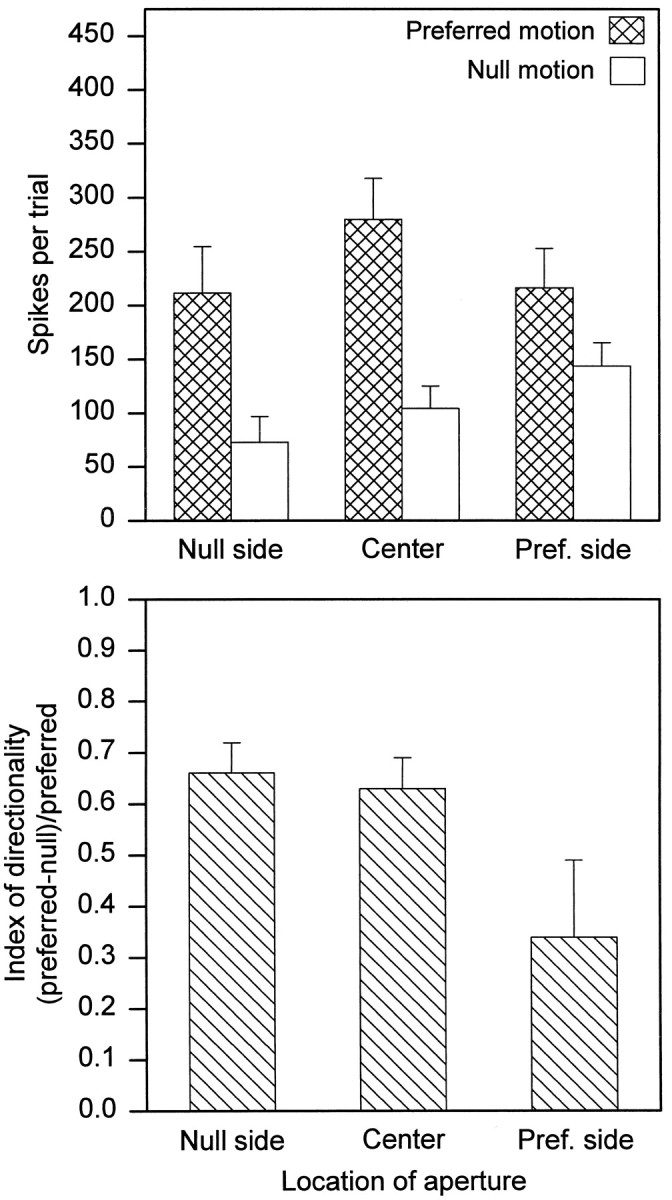
Comparison of receptive field zones for 15 cells. The cells were tested with edges moving behind apertures located at one of the three positions within the receptive field, as shown in Figure6; the stimulus parameters were the ones used there. Here the responses to leading and trailing edges are combined. Means ± SEM.
With the size and location of the nondiscriminating zone established, it becomes possible to search previously published arbors for signs of specialization in the nondiscriminating zone (it should extend inward from the preferred edge of the arbor.) In previous studies, the dendritic arbors of 23 ON-OFF DS cells have been published together with the preferred directions of the cells (Yang and Masland, 1992,1994; Oyster et al., 1993; He and Masland, 1997). At the level of light microscopic structure, no sign of specialization is evident (the same is true for a series of 55 unpublished arbors of cells injected after recording in connection with one of our previous studies; He and Masland, 1997.)
DISCUSSION
The pattern of dendritic branching: thin dendrites from thick
As has been previously noted, dendrites of the ON-OFF directionally selective cells cover the dendritic field evenly: thin dendrites recurve to fill the spaces created as the major dendrites diverge (Oyster et al., 1993; Yang and Masland, 1994). This contrasts with the pattern observed for α and β cells of the cat; indeed to the patterns of most projection neurons. As was pointed out by Kier et al. (1995), this is probably a cause of the relatively flat distribution of sensitivity of the cells to test spots flashed at different locations across the receptive field. It differs from that of most rabbit ganglion cells (De Vries and Baylor, 1997) and from the situation for α and β cells in the cat, in which the absolute length of dendrite per unit area and the sensitivity to visual stimulation decline more smoothly with distance from the soma.
A distinctive feature of the dendritic arbor is that the thin dendrites, which make up most of the total, exit from primary dendrites with an abrupt downward step in diameter but retain that diameter to their ends; if they have any taper at all, it is slight. This contrasts with the structure of other retinal ganglion cells and most other projection neurons; the cells flagrantly disregard the 3/2 rule (Rall, 1977). The final meaning of this geometry cannot be deduced without knowledge of the receptors and ion channels of the dendrites and their locations. On electrotonic grounds, it would create relatively high input impedances along the thin dendrites and lower ones along the thick. Current propagating inward along a thin dendrite will encounter a sink at the point where the dendrite enters the thick one. Because this geometry is distinctively different from that of many other projection neurons, the possibility exists that it is related to the mechanism of direction selectivity; in any event, it will need to be incorporated into its eventual biophysical understanding.
Dendritic structure in the discriminating and nondiscriminating zones
We found no difference between the geometry of the dendritic arbor of the DS cell in the region of the arbor in which direction discrimination occurs and that where it does not. In effect, the experiment is internally controlled because the comparison is made within a single cell. Although some as-yet-unimagined ordering within the dendrites remains possible, this experiment and the many others examining the question in less sensitive ways all indicate that the mechanism of direction selectivity must be sought in the circuitry afferent to the DS ganglion cell itself: that the laterally displaced signal that must exist is not created by a geometric specialization of the ganglion cell.
Structural plasticity in the DS cell?
An intriguing aspect of the structure of the DS cells is revealed by comparing the cells injected by us (Fig. 2) and previously by Oyster et al. (1993; their Fig. 4) with those injected by Vaney (1994). The difference is that our DS cells often bear many spine-like structures, whereas the cells shown by Vaney (1994) have virtually none, despite overall filling robust enough to vividly reveal cells coupled to the injected cell by gap junctions (Vaney, 1994, his Figs. 3, 6, 7, 9, and 11). It is unlikely that DS cells have spines in American rabbits but not in Australian. A notable experimental difference is that our cells and those of Oyster et al. (1993) were injected after a long period of physiological stimulation during recording, whereas those of Vaney (1994) were from preparations maintained throughout the experiment in constant bright light. The spine-like structures may undergo physiological plasticity, as has been demonstrated in hippocampal and thalamic neurons (Hosokawa et al., 1995; Rocha and Sur, 1995; Fischer et al., 1998) and axon terminals of goldfish bipolar cells (Yazulla and Studholme, 1992). Movements of spine-like structures on the dendrites of living retinal ganglion cells have recently been directly visualized (Wong et al., 1998).
The mechanistic significance of the nondiscriminating zone
As noted earlier, the existence of the nondiscriminating zone was reported in the classic description of retinal direction selectivity (Barlow and Levick, 1965). Here we confirm it using modern methods and direct visualization of the dendritic arbor. What are the implications of the nondiscriminating zone?
The most important is that the location of the nondiscriminating zone reaffirms models in which the fundamental event in the directional discrimination is a laterally displaced inhibition (Barlow and Levick, 1965; Wyatt and Daw, 1975). Because this is different from the apparent mechanism of direction selectivity in flies (for review, see Borst and Egelhaaf, 1989; Franceschini et al., 1989) and from a recently proposed model of direction selectivity in mammalian retinal ganglion cells (Borg-Graham and Grzywacz, 1992; Amthor and Grzywacz, 1993), the question merits re-examination.
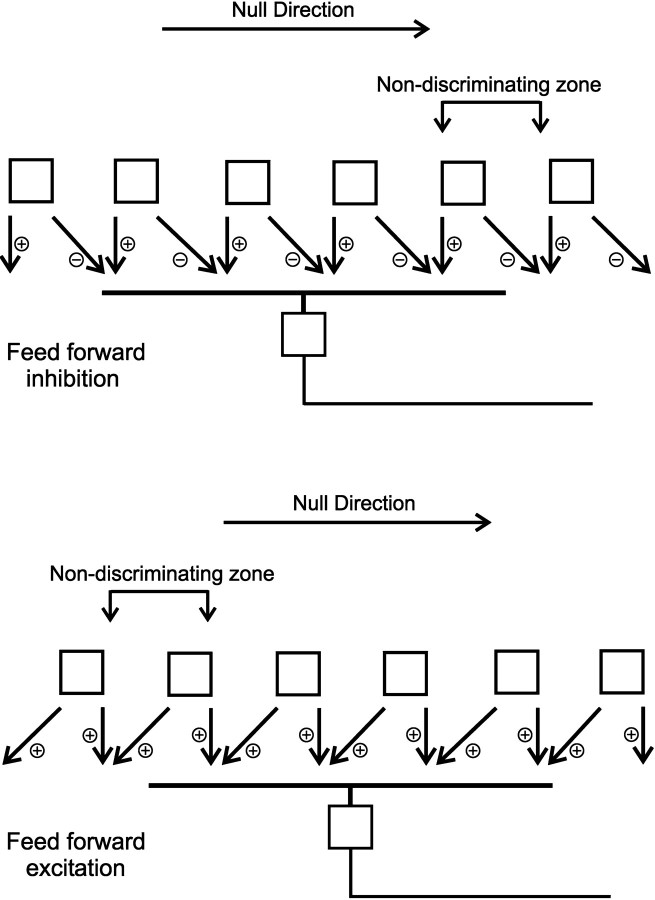
The two types of model are shown, in generic form, in Figure7. At the top is shown a model based on feedforward inhibition, at the bottom a model based on feedforward excitation. Both illustrations are generic in the sense that specific neurons (bipolar or amacrine) are not identified, nor is the cellular site (presynaptic or postsynaptic) of the directional decision given. The primary goal is only to capture the geometric specialization required by the models. As for all models of direction selectivity, the direct inputs and the laterally displaced inputs must be at least additive. They are most likely multiplicative, as shown long ago byReichardt (1961) and by Torre and Poggio (1978).
Fig. 7.
Inhibitory and excitatory models of direction selectivity predict different locations for the nondiscriminating zone. The drawings show a generic “local subunit” that works by feedforward inhibition and one that works by feedforward excitation. In both cases, the interaction of the local and displaced inputs would presumably be multiplicative, a requirement demonstrated previously (Reichardt, 1961; Torre and Poggio, 1978). In contrast to the finding reported here, feedforward excitation predicts that the nondiscriminating zone would be located on the null side of the receptive field of the ganglion cell.
The nondiscriminating zone presumably occurs because the laterally directed process “falls off” the dendritic field of the ganglion cell on one side or the other. If there is laterally directed conduction of excitation or inhibition (as all models require), there must be a region at the edge of the receptive field where lateral conduction carries the signal beyond the edge of the dendritic arbor of the ganglion cell. In this region, the ganglion cell will be unable to discriminate the direction of motion, because the laterally directed signal does not impinge on the ganglion cell. For our initial argument, it does not matter how finely the laterally directed process tiles the retina; this will affect the size of the nondiscriminating zone, as discussed below, but cannot prevent the nondiscriminating zone from existing. Feedforward excitation and feedforward inhibition make different predictions about the location of the nondiscriminating zone (Fig. 7). If the laterally conducted event is excitatory, the nondiscriminating zone is located on the null side of the receptive field. If inhibitory, it is located on the preferred side, as is actually observed.
The original model of the directional mechanism in flies was excitatory and thus would place the nondiscriminating zone on the null side. It is not clear that measurements precise enough to reveal a nondiscriminating zone have been made in flies, where the local subunit is small relative to the whole “receptive field”. Well established current models are push–pull, with both excitation and inhibition operating, and in this case there would be no true nondiscriminating zone (Borst and Egelhaaf, 1989; Franceschini et al., 1989; Douglass and Strausfeld, 1995). The present results thus suggest that the mechanism of direction selectivity is different in flies and mammalian retinas (push–pull models do predict that the directional discrimination will be stronger in the middle of the visual field than at its extreme edges, because only half of the push–pull mechanism should operate at the null-side edge or the preferred-side edge).
An early starburst-based model of the mammalian cell was excitatory: starburst cells by their release of acetylcholine were supposed to cause feedforward excitation of the retinal ganglion cell when the stimulus moves in the preferred direction (Borg-Graham and Grzywacz, 1992; Grzywacz and Amthor, 1993). Previous evidence against this is that (1) under ordinary stimulus conditions, cholinergic antagonists do not prevent direction selectivity (Masland and Ames, 1976; Ariel and Daw, 1982a,b; Kittila and Massey, 1997; He and Masland, 1997), and (2) laser ablation of the starburst cells does not prevent direction selectivity (He and Masland, 1997). Here we add that the nondiscriminating zone is on the opposite side of the receptive field from the one predicted by a mechanism based on feedforward excitation.
A recent revision of the starburst model postulates a push–pull mechanism, with starburst excitation in the preferred direction and GABA-mediated inhibition in the null direction (Grzywacz et al., 1997,1998). However, this model, like the fly model discussed above, predicts that no nondiscriminating zone should exist on either side.
In sum, our results support the earlier conclusion that direction selectivity in retinal ganglion cells is caused primarily by feedforward inhibition generated by stimuli moving in the null direction. A feature that remains unexplained is the size of the nondiscriminating zone, which can occupy 25% of the receptive field (Barlow and Levick, 1965; He, 1994). If the nondiscriminating zone is caused by the events shown in Figure 7, then the distance traversed by the laterally conducting process must be fairly large, large enough to account for 20–25% of the receptive field. However, the local subunit is reported to be smaller than that. Initial descriptions indicated that a medium-sized directionally selective ganglion cell could discriminate movements of 50–100 μm across its receptive field (Barlow and Levick, 1965; Wyatt and Daw, 1975), and a more recent report suggests even finer discriminations (Grzywacz et al., 1995). If the size of the local subunit is determined by the lateral distance across which inhibition is conducted, and if this distance also defines the width of the nondiscriminating zone, there is an apparent conflict: the nondiscriminating zone appears to be too large. However, measurements of the size of the nondiscriminating zone and of the least discriminable traverse have used widely varying stimulus paradigms and differing criteria for a directional response. The question should perhaps be reexamined more systematically.
Footnotes
We thank the staff of the Schepens Eye Research Institute for the use of their confocal microscope and Rebecca Rockhill for the figures. R.H.M. is a Senior Investigator of Research to Prevent Blindness.
Correspondence should be addressed to Richard H. Masland, Wellman 429, Massachusetts General Hospital, Boston, MA 02114.
REFERENCES
- 1.Ames A, III, Li YY. Energy requirements of glutamatergic pathways in rabbit retina. J Neurosci. 1992;12:4234–4242. doi: 10.1523/JNEUROSCI.12-11-04234.1992. [DOI] [PMC free article] [PubMed] [Google Scholar]
- 2.Ames A, III, Li YY, Heher EC, Kimble CR. Energy metabolism of rabbit retina as related to function: high cost of Na+ transport. J Neurosci. 1992;12:840–853. doi: 10.1523/JNEUROSCI.12-03-00840.1992. [DOI] [PMC free article] [PubMed] [Google Scholar]
- 3.Ames A, III, Maynard KI, Kaplan S. Protection against CNS ischemia by temporary interruption of function-related processes of neurons. J Cereb Blood Flow Metab. 1995;15:433–439. doi: 10.1038/jcbfm.1995.54. [DOI] [PubMed] [Google Scholar]
- 4.Amthor FR, Grzywacz NM. Directional selectivity in vertebrate retinal ganglion cells. In: Miles FA, Wallman J, editors. Visual motion and its role in the stabilization of gaze. Elsevier Science; Oxford: 1993. [PubMed] [Google Scholar]
- 5.Amthor FR, Oyster CW, Takahashi ES. Morphology of ON-OFF direction-selective ganglion cells in the rabbit retina. Brain Res. 1984;298:187–190. doi: 10.1016/0006-8993(84)91167-3. [DOI] [PubMed] [Google Scholar]
- 6.Ariel M, Daw NW. Effects of cholinergic drugs on receptive field properties of rabbit retinal ganglion cells. J Physiol (Lond) 1982a;324:135–160. doi: 10.1113/jphysiol.1982.sp014104. [DOI] [PMC free article] [PubMed] [Google Scholar]
- 7.Ariel M, Daw NW. Pharmacological analysis of directionally selective rabbit retinal ganglion cells. J Physiol (Lond) 1982b;324:161–185. doi: 10.1113/jphysiol.1982.sp014105. [DOI] [PMC free article] [PubMed] [Google Scholar]
- 8.Barlow HB, Levick WR. The mechanism of directionally selective units in rabbit’s retina. J Physiol (Lond) 1965;178:477–504. doi: 10.1113/jphysiol.1965.sp007638. [DOI] [PMC free article] [PubMed] [Google Scholar]
- 9.Borg-Graham LJ, Grzywacz NM. A model of the directional selectivity circuit in retina: transformations by neurons singly and in concert. In: McKenna T, Davis J, Zornetzer SF, editors. Single neuron computation. Academic; New York: 1992. pp. 347–376. [Google Scholar]
- 10.Borst A, Egelhaaf M. Principles of visual motion detection. Trends Neurosci. 1989;12:297–306. doi: 10.1016/0166-2236(89)90010-6. [DOI] [PubMed] [Google Scholar]
- 11.DeVries SH, Baylor DA. Mosaic arrangement of ganglion cell receptive fields in rabbit retina. J Neurophysiol. 1997;78:2048–2060. doi: 10.1152/jn.1997.78.4.2048. [DOI] [PubMed] [Google Scholar]
- 12.Douglass JK, Strausfeld NJ. Visual motion detection circuits in flies: peripheral motion computation by identified small-field retinotopic neurons. J Neurosci. 1995;15:5596–5611. doi: 10.1523/JNEUROSCI.15-08-05596.1995. [DOI] [PMC free article] [PubMed] [Google Scholar]
- 13.Famiglietti EV., Jr Dendritic co-stratification of ON and ON-OFF directionally selective ganglion cells with starburst amacrine cells in rabbit retina. J Comp Neurol. 1992;324:322–335. doi: 10.1002/cne.903240303. [DOI] [PubMed] [Google Scholar]
- 14.Fischer M, Kaech S, Knutti D, Matus A. Rapid actin-based plasticity in dendritic spines. Neuron. 1998;20:847–854. doi: 10.1016/s0896-6273(00)80467-5. [DOI] [PubMed] [Google Scholar]
- 15.Franceschini N, Riehle A, Le Nestour A. Directionally selective motion detection by insect neurons. In: Stavenga DG, Hardie R, editors. Facets of vision. Springer; Berlin: 1989. pp. 360–390. [Google Scholar]
- 16.Grzywacz NM, Amthor FR. Facilitation in ON-OFF directionally selective ganglion cells of the rabbit retina. J Neurophysiol. 1993;69:2188–2199. doi: 10.1152/jn.1993.69.6.2188. [DOI] [PubMed] [Google Scholar]
- 17.Grzywacz NM, Amthor FR, Merwine DK. Directional hyperacuity in ganglion cells of the rabbit retina. Vis Neurosci. 1995;11:1019–1025. doi: 10.1017/s0952523800003953. [DOI] [PubMed] [Google Scholar]
- 18.Grzywacz NM, Tootle JS, Amthor FR. Is the input to a GABAergic or cholinergic synapse the sole asymmetry in rabbit’s retinal directional selectivity. Vis Neurosci. 1997;14:39–54. doi: 10.1017/s0952523800008749. [DOI] [PubMed] [Google Scholar]
- 19.Grzywacz NM, Amthor FR, Merwine DK. Necessity of acetylcholine for retinal directionally selective responses to drifting gratings in rabbit. J Physiol (Lond) 1998;512.2:575–581. doi: 10.1111/j.1469-7793.1998.575be.x. [DOI] [PMC free article] [PubMed] [Google Scholar]
- 20.He S-G. PhD thesis. Australian National University; 1994. Further investigations of direction-selective ganglion cells of the rabbit retina. [Google Scholar]
- 21.He S-G, Masland RH. Retinal direction selectivity after targeted laser ablation of starburst amacrine cells. Nature. 1997;389:378–382. doi: 10.1038/38723. [DOI] [PubMed] [Google Scholar]
- 22.Hosokawa T, Rusakov DA, Bliss TVP, Fine A. Repeated confocal imaging of individual dendritic spines in the living hippocampal slice: evidence for changes in length and orientation associated with chemically induced LTP. J Neurosci. 1995;15:5560–5573. doi: 10.1523/JNEUROSCI.15-08-05560.1995. [DOI] [PMC free article] [PubMed] [Google Scholar]
- 23.Kier CK, Buchsbaum G, Sterling P. How retinal microcircuits scale for ganglion cells of different size. J Neurosci. 1995;15:7673–7683. doi: 10.1523/JNEUROSCI.15-11-07673.1995. [DOI] [PMC free article] [PubMed] [Google Scholar]
- 24.Kittila CA, Massey SC. The pharmacology of directionally selective ganglion cells in the rabbit retina. J Neurophysiol. 1997;77:675–689. doi: 10.1152/jn.1997.77.2.675. [DOI] [PubMed] [Google Scholar]
- 25.Levick WR. Another tungsten microelectrode. Med Biol Eng. 1972;10:510–515. doi: 10.1007/BF02474199. [DOI] [PubMed] [Google Scholar]
- 26.Masland RH, Ames A., III Responses to acetylcholine of ganglion cells in an isolated mammalian retina. J Neurophysiol. 1976;39:1220–1235. doi: 10.1152/jn.1976.39.6.1220. [DOI] [PubMed] [Google Scholar]
- 27.Oyster CW, Amthor FR, Takahashi ES. Dendritic architecture of ON-OFF direction-selective ganglion cells in the rabbit retina. Vision Res. 1993;33:579–608. doi: 10.1016/0042-6989(93)90181-u. [DOI] [PubMed] [Google Scholar]
- 28.Peters BN, Masland RH. Responses to light of starburst amacrine cells. J Neurophysiol. 1996;75:469–480. doi: 10.1152/jn.1996.75.1.469. [DOI] [PubMed] [Google Scholar]
- 29.Rall W. Core conductor theory and cable properties of neurons. In: Brookhart JM, Mountcastle VB, Kandel ER, Geiger SR, editors. Handbook of physiology. American Physiological Society; Bethesda, MD: 1977. pp. 39–97. [Google Scholar]
- 30.Reichardt W. Autocorrelation, a principle for the evaluation of sensory information by the central nervous system. In: Rosenblith WA, editor. Sensory communication. MIT; Cambridge, MA: 1961. pp. 303–317. [Google Scholar]
- 31.Rocha M, Sur M. Rapid acquisition of dendritic spines by visual thalamic neurons after blockade of N-methyl-d-aspartate receptors. Proc Natl Acad Sci USA. 1995;92:8026–8030. doi: 10.1073/pnas.92.17.8026. [DOI] [PMC free article] [PubMed] [Google Scholar]
- 32.Torre V, Poggio T. A synaptic mechanism possibly underlying directional selectivity to motion. Proc R Soc Lond B Biol Sci. 1978;202:409–416. [Google Scholar]
- 33.Vaney DI. Territorial organization of direction-selective ganglion cells in rabbit retina. J Neurosci. 1994;14:6301–6316. doi: 10.1523/JNEUROSCI.14-11-06301.1994. [DOI] [PMC free article] [PubMed] [Google Scholar]
- 34.Wong WT, Faulkner-Jones B, Sanes JR, Wong ROL. Dynamic dendritic remodeling in developing retinal ganglion cells. Soc Neurosci Abstr. 1998;24:1766. [Google Scholar]
- 35.Wyatt HJ, Daw NW. Directionally sensitive ganglion cells in the rabbit retina: specificity for stimulus direction, size and speed. J Neurophysiol. 1975;38:613–626. doi: 10.1152/jn.1975.38.3.613. [DOI] [PubMed] [Google Scholar]
- 36.Yang G, Masland RH. Direct visualization of the dendritic and receptive fields of directionally selective retinal ganglion cells. Science. 1992;258:1949–1952. doi: 10.1126/science.1470920. [DOI] [PubMed] [Google Scholar]
- 37.Yang G, Masland RH. Receptive fields and dendritic structure of directionally selective retinal ganglion cells. J Neurosci. 1994;14:5267–5280. doi: 10.1523/JNEUROSCI.14-09-05267.1994. [DOI] [PMC free article] [PubMed] [Google Scholar]
- 38.Yazulla S, Studholme KM. Light-dependent plasticity of the synaptic terminals of Mb bipolar cells in goldfish retina. J Comp Neurol. 1992;320:521–530. doi: 10.1002/cne.903200409. [DOI] [PubMed] [Google Scholar]


