

Abstract
The first Aplysia californica insulin gene is characterized and its proteolytic processing from prohormone to final peptides elucidated using a combination of biochemical and mass spectrometric methods. Aplysia insulin (AI) is one of the largest insulins found, with a molecular weight of 9146 Da, and an extended A chain compared with other invertebrate and vertebrate insulins. The AI prohormone produces a series of C peptides and also a unique N-terminally acetylated D peptide. AI-producing cells are restricted to the central region of the cerebral ganglia mostly within the F and C clusters, and AI is transported to neurohemal release sites located on the upper labial and anterior tentacular nerves. The expression of AI mRNA decreases when the animal is deprived of food, and injections of AI reduce hemolymph glucose levels, suggesting that the function of insulin-regulating metabolism has been conserved.
Keywords: insulin, neuropeptide, Aplysia californica, cerebral ganglion, hunger/satiation, glucose
Insulin is one of the most extensively studied protein hormones found in a diverse range of species ranging from humans (Banting and Best, 1922) to unicellular organisms and plants (Collier et al., 1987). In animal species, the insulin prohormone is a single polypeptide chain containing a signal peptide and B and A peptides (chains) separated by one or more C peptides. To form insulin, the B and A chains are linked by multiple disulfide bonds and then proteolytically cleaved. Insulin shows a high degree of structural conservation across different phyla despite the differences in peptide sequence among the studied species, and similarities between gastropod and mammalian insulin peptides are known (Ebberink and Joosse, 1985). Insulin molecules all share the basic disulfide bonding pattern but also can have unique characteristics as well. The most well known function of insulin involves the hormonal control of metabolism. Although insulins often are released as neurohormones and undergo active uptake from plasma (Schwartz et al., 1992), they may have a role in neurotransmisson as insulin is synthesized and released by neurons (Uvnas-Wallenstein, 1981; Boyd et al., 1985; Jonas et al., 1996).
Immunocytochemical evidence indicates that these insulin-like peptides are present in the CNS of Aplysia californica (Van Minnen and Schallig, 1990). Application of human insulin extracellularly causes hyperpolarization of identified neurons in the abdominal ganglion of Aplysia (Schwartz et al., 1990;Shapiro et al., 1991). Additionally, the receptor responsible for this activity has been isolated and characterized (Jonas et al., 1996), and the activation of this tyrosine kinase-linked receptor has been shown to stimulate Ca2+-independent protein kinase C isoforms in non-neuronal cells of Aplysia after application of insulin. Interestingly, application of bovine insulin to the bag cell clusters, which contain a high concentration of insulin receptors, results in an acute rise of a unique neuronal Ca2+ pool and triggers release of the neuroactive peptide egg-laying hormone (ELH) (Jonas et al., 1997).
Surprisingly, after cloning the insulin receptor and these functional studies, no insulin peptide or gene has been found inAplysia, although several insulin-like peptides have been isolated in other mollusks (Smit et al., 1988, 1991). We report here the cloning of Aplysia insulin and the characterization of the prohormone processing yielding two forms of Aplysiainsulin, a series of C peptides, and a unique acetylated D peptide. In addition, we demonstrate the mRNA expression decreases when the animal is deprived of food and that injections of insulin reduce hemolymph glucose levels.
MATERIALS AND METHODS
Animals. Aplysia californica weighing 10–200 gm were obtained from Aplysia Research Facility (Miami, FL), whereas those weighing 200–350 gm were purchased from either Pacific Biomarine (Venice, CA) or Marinus, Inc. (Long Beach, CA), and larger animals (up to 2 kg) were collected from McAbee Beach in Monterey, CA. Animals were maintained in artificial seawater (Instant Ocean; Aquarium Systems, Mentor, OH) at 14°C.
Cellular sample preparation. Ganglia and cellular clusters with intact connectives and commissures were removed after injection of 390 mm MgCl2 equal to one-half of each animal’s body weight. In some cases, a moderate protease treatment (e.g., 1% protease type IX for 30–60 min at 34°C) was used to soften the connective tissues before desheathing.
Matrix-assisted laser desorption–ionization mass spectrometry. Mass spectra were obtained using two mass spectrometers, namely a Voyager Elite and a Voyager DE STR equipped with delayed ion extraction (PE Biosystems, Framingham, MA). A pulsed nitrogen laser (337 nm) was used as the desorption/ionization source, and positive-ion mass spectra were acquired using both linear and reflectron mode. Each representative mass spectrum shown is the unsmoothed average of 64–128 laser pulses. Mass calibration was performed externally using either bovine insulin (Sigma, St. Louis, MO) or a previously calibrated spectrum obtained from Aplysiabag cells. The averaged mass assignment error is 190 ppm for linear mode, which is typical for the cellular peptide assay using external calibration (Li et al., 1998). Our mass accuracy can be improved severalfold using reflectron mode, which requires more concentrated samples and greater instrumental optimization but reduces the mass assignment uncertainty to <50 ppm. The instrumental conditions are individually optimized to produce high quality spectra over the desired mass range so that when examining high mass regions, many peptides at lower masses are not observed (and vice versa). Extracellular salts were removed by a previously described method (Garden et al., 1996).
Microbore RP-HPLC of homogenates. Cerebral F and C clusters from 23 animals were pooled for microbore RP-HPLC separation. The clusters were collected on dry ice and subsequently stored at −80°C in ∼200 μl of acidified acetone (1:40:6, HCl:acetone:H2O) as described previously (Newcomb and Scheller, 1990; Floyd et al., 1999). Samples were homogenized in a microhomogenizer (Jencons Scientific Ltd., Bedfordshire, UK), sonicated (model 2200; Branson, Danbury, CT), and centrifuged (Biofuge 15; Baxter, McGaw Park, IL). The supernatant was removed, lyophilized (Labconco; Fisher Scientific, Itasca, IL), and resuspended in 40 μl of 2% acetonitrile in 0.1% trifluoroacetic acid (TFA) or 0.1% heptafluorobutyric acid (HFBA). Twenty microliters of the extract were injected in a reversed-phase microbore HPLC instrument (Magic 2002; Michrom BioResources, Auburn, CA) consisting of a Reliasil C-18 column with 300 Å packing. The flow rate was 50 μl/min at ambient temperature. The column was equilibrated with solvent A, and a gradient was developed from 0–80% of solvent B in 30 min and then 80–98% of solvent B in 10 min. The first separation used a 2.0 × 150 mm C-18 column with solvent A consisting of 2% acetonitrile/∼98% H2O + 0.1% TFA and solvent B being 90% acetonitrile/∼10% H2O + 0.1% TFA. This resulted in fractions containing multiple coeluting peptides requiring additional separation steps. After each separation, matrix-assisted laser desorption–ionization mass spectrometry (MALDI-MS) was used to track the peptide of interest through each stage. The fraction containing the 1714 Da peptide was subsequently lyophilized, resuspended in 20 μl of aqueous acetonitrile, and reinjected. Solvent B was changed to a mixture of isopropanol:acetonitrile:methanol (1:2:2), with the column changed to 1.0 mm inner diameter (i.d.) C-18, to further aid in the separation of this peptide. The final separation of this isolated fraction used a different counter ion, HFBA instead of TFA and a 0.5 mm i.d. C-18 column, resulting in the collection of a relatively pure fraction containing the novel 1714 Da peptide into a single fraction as observed by MALDI-MS.
In all cases, the samples were collected by a fraction collector (FC 203B; Gilson, Middletown, WI), and each fraction was screened by MALDI-MS; 0.25 μl of each liquid chromatography (LC) fraction was deposited onto a MALDI-MS sample plate followed by the same volume of 10 mg/ml α-cyano-4-hydroxy-cinnamic acid (dissolved in 6:3:1 acetonitrile:water:3% TFA) (Aldrich, Milwaukee, WI) or aqueous dihydroxybenzoic acid (ICN Biochemicals, Costa Mesa, CA) (10 mg/ml) matrix solution. Unless otherwise specified, all solvents were purchased from Fisher Scientific and were reagent quality or better.
Cloning. Standard molecular techniques (Sambrook et al., 1989) were used except where noted. Aplysia californicaganglion cDNA library was a gift of Dr. Gregg Nagle (Marine Biomedical Institute, University of Texas, Medical Branch, Galveston, TX). The library, a directional Uni-Zap λ phage library (Stratagene, La Jolla, CA), was used both as a template for PCR and for conventional hybridization screening. Semi-nested degenerate rapid amplification of cDNA ends (RACE) was performed using two vector primers and an antisense degenerate primer designed to a subset of the peptide sequence (NVNDKLRGIL = ard ati cci cki ary ttr tcr tti acr tt). PCR was performed in two stages on a robocycler gradient 40 thermal cycler (Stratagene) using taq DNA polymerase and dNTPs from Perkin-Elmer (Norwalk, CT). Both stages were cycled 25 times with 30 sec at 95°C, 1 min at the annealing temperature, and 2 min at 72°C. Three separate annealing temperatures (50, 54, and 58°C) were run in parallel, and a set without the degenerate primer was used as a control. The reactions were hot started and not allowed to cool to <72°C between the stages. In the first stage, 10 μl reactions containing 0.1 μm vector primer (ACC ATG ATT ACG CCA AG), 0.1 μm degenerate primer, 100 μm dNTPs, and 0.1 μl of library were hot started with 0.1 U of taq in 0.5 μl of reaction buffer. In the second stage, 50 μl of prewarmed (72°C) reaction mix containing 1 μm nested vector primer (GAA ATT AAC CCT CAC TAA AGG), 1 μm degenerate primer, and 100 μm dNTPs were added to each tube, then hot started again with 1 U of taq. The results of the PCR were assessed using agarose gel electrophoresis and the highest temperature reactions showing significantly more product than the matched degenerate primerless control were polyethylene glycol 8000-precipitated and TA-cloned (Invitrogen, Carlsbad, CA). Insert-bearing clones were identified using colony PCR then cycle-sequenced by dye termination (Perkin-Elmer, Norwalk, CT). Inserts from promising degenerate clones were isolated and labeled using32P-dCTP and random primers (New England Biolabs, Beverly, MA). These probes were then used to screen a library to identify full-length clones. Three clones were sequenced to generate a consensus. Sequence alignments were generated using Geneworks version 2.1, and consensus contigs were assembled manually.
Northerns. Like ganglia were dissected and pooled from five animals anesthetized with 50% volume of isotonic MgCl2. The RNA was isolated by the acid phenol method (Chomczynski and Sacchi, 1987). RNA was fractionated on a MOPS/formaldehyde 1.5% agarose gel and downward transferred (Turboblotter; Schleicher & Schuell, Keene, NH) overnight with 20× SSPE onto positively charged nylon (Biodyne B; Life Technologies, Gaithersburg, MD). The RNA was UV crosslinked (Stratalinker; Stratagene) then washed with DEPC-treated water and stained with methylene blue (0.2% methylene blue 0.3 m sodium acetate, pH 5.5). The blot was scanned to document the loading and transfer of the RNA, and then the positions of the lanes and the bands in the RNA marker lane (Novagen, Madison, WI) were noted on the membrane with a number 2 pencil. After complete destaining in 1% SDS 0.1 × SSPE, the blots were prehybridized (50% formamide, 7% SDS, 250 mm sodium phosphate, pH 7.2, 10 mm EDTA, and 10% dextran sulfate) for 1 hr at 50°C in a rotary oven (Hybaid, Franklin, MA). The blot was then hybridized with random primer-labeled (New England Biolabs) probe overnight at 50°C. Washes were performed two times for 15 min at room temperature with 2× SSPE and 0.1% SDS, then at 50°C for 1 hr with 0.1× SSPE and 0.1% SDS. Blots were wrapped in saran and exposed to film. Autoradiograms were aligned with the blots, and the positions of the markers were noted. They were then scanned and assembled into final figures using Photoshop 3.0.
Antibodies. The antigen was prepared by couplingAplysia insulin Cβ (DTENVNDKLRGILLN) to BSA (SIGMA A0281) using either 1-ethyl-3-(dimethylaminopropyl)carbodiimide (EDC) (SIGMA E7750) or paraformaldehyde/glutaraldehyde (Pf/G; EM Sciences, Fort Washington PA). The coupling was performed in a 0.5 ml volume of 50 mmNaH2PO4, pH 7.2, containing 5 mg of BSA, 1 mg of peptide, and either 10 mg of EDC or 1% paraformaldehyde and 0.1% glutaraldehyde. The mixture was allowed to react overnight at 4°C and then the coupled antigen was purified from the reaction using a Microcon-30 (spinning at 13,800 ×g for 30 min at 4°C to concentrate). After washing the retentate four times with 0.4 ml of 50 mmNaH2PO4, pH 7.2, it was resuspended in 0.25 ml of the same buffer and transferred to a new tube.
Four male Sprague Dawley rats (Teconic; 250–300 gm) were immunized by intraperitoneal injection with 12.5 μl (∼250 μg) antigen in an emulsion of 0.5 ml PBS and 0.5 ml of Freund’s complete adjuvant. At 21 and 42 d after initial injection, the rats were boosted by intraperitoneal injection with 6.65 μl (∼125 μg) antigen in an emulsion of 0.5 ml PBS and 0.5 ml of Freund’s incomplete adjuvant. The animals were sacrificed by decapitation at 49 d after initial injection, and the blood was harvested and processed for serum. Sera were aliquoted, frozen, and lyophilized, or stored at 4°C with EDTA (25 mm final) and thimerosal (0.1% final) added as stabilizers.
Immunocytochemistry. Immunocytochemistry was performed as previously described (Vilim et al., 1996). Tissues were fixed in freshly prepared fixative (4% paraformaldehyde, 0.2% picric acid, 25% sucrose, and 0.1 mNaH2PO4, pH 7.6) either 3 hr at room temperature or overnight in the cold. After washes with PBS to remove the fixative, the ganglia from large animals were desheathed to expose the neurons. All subsequent incubations were done at room temperature with rocking. Tissue was permeabilized and blocked by overnight incubation in Block buffer (BB): 10% normal donkey serum, 2% Triton X-100, 1% BSA, 154 mm NaCl, 10 mmNa2HPO4, 50 mmEDTA, and 0.01% thimerosal, pH 7.4. Primary antibody was diluted 1:250 in BB and incubated with the tissue for 4–7 d. The tissue was then washed twice a day for 2–3 d with wash buffer (WB) (2% Triton X-100, 1% BSA, 154 mm NaCl, 10 mmNa2HPO4, 50 mmEDTA, and 0.01% thimerosal, pH 7.4). After the washes, the tissue was incubated with 1:500 dilution of secondary antibody (lissamine–rhodamine donkey anti-rat; Jackson ImmunoResearch, West Grove, PA) for 2–3 d. Tissue was then washed twice with WB for 1 d and four times with storage buffer (1% BSA, 154 mm NaCl, 10 mm Na2HPO4, 50 mm EDTA, and 0.01% thimerosal, pH 7.4) for 1 d. The tissues were then stored at 4°C or viewed and photographed on a Nikon microscope (Morrell, Melville, NY) equipped with epifluorescence.
Food deprivation experiments. Twenty animals that had been starved for 0, 1, 2, and 3 weeks were obtained from theAplysia Research Facility (Miami, FL). They were all 100–110 gm and were the same age when the experiment started. The experiment was designed such that the animals would all arrive on the same day. The animals were shipped on ice and processed on arrival without letting the animals warm. The ganglia from each animal were removed, combined and processed for RNA as described above. Northern analysis proceeded as above, and densitometric analysis of the scanned autoradiographs was performed using NIH Image (version 1.55). Statistical significance of differences between control and starved animals was determined with Student’s t test.
Hemolymph glucose experiments. Aplysia insulin (AI) was isolated from 100 Aplysia cerebral ganglia and subjected to multiple RP-HPLC separations until a peak with 80% purity (by MALDI-MS) at 9146 Da was obtained. The effect of the authentic AI on hemolymph glucose level was measured. Animals (129–200 gm) were tested after 3 d of food deprivation to assure that the crop was empty of food during the experiment, and were injected on the test day with 1 ml of artificial sea water (ASW) (n = 7) and AI (∼100 pmol of native AI in 1 ml of ASW;n = 6) into the hemocoel with a syringe needle (26 gauge). We also tested synthetic acetyl-TGR peptide (∼1.07 mm per animal, 1 ml; n = 4), which is the first three amino acids of the insulin “D-peptide”, and was of interest because no other known insulin prohormone contains this peptide. Hemolymph glucose was measured enzymatically using the glucose oxidase method (Trinder, 1969) (Sigma kit, #315), using procedures similar to those previously reported (Horn et al., 1998). Hemolymph samples of 2 ml were withdrawn through a 25 gauge syringe needle inserted into the hemocoel just before an injection, and at 1.5 and 3 hr after the injection. Samples were centrifuged at 14,000 rpm for 1 min. One milliliter of kit reagent was added to 200 μl of sample and read in a spectrophotometer at 505 nm after an 18–35 min incubation period. Hemolymph glucose was sampled from animals located in separate chambers that were floating in their home tank. A 3 × 3 ANOVA was conducted on the hemolymph glucose data (injection condition by time) and, subsequently, specific comparisons of means were made using Tukey’s HSD test for unequal sample sizes.
RESULTS
MALDI-MS of single top-layer cerebral F cluster (CFt) neurons identified a peak with a mass of 1714 Da that did not correspond to any known neuropeptide (Rubakhin et al., 1999). The same peak was also observed in the anterior tentacular (AT) and upper labial (UL) nerves. Furthermore, CFt neurons were observed to project to the AT nerve and ramify there in a manner consistent with neurohemal release (Rubakhin et al., 1999). Previous work had also indicated that extracts of the AT and UL nerves contained an insulin-like activity (Horn et al., 1998). Thus, isolation and sequencing of the 1714 Da unknown peak was undertaken in an effort to identify potential neuroendocrine peptides, and specifically insulin, in Aplysia.
F and C clusters were pooled from 23 animals, homogenized, lyophilized, and subjected to three separate rounds of HPLC separations using MALDI-MS to track the 1714 Da peak. The output of the final separation (Fig. 1, inset) was a peptide with sufficient amount and purity to be sequenced. The N-terminal sequencing analysis on this sample via Edman degradation revealed a sequence of: XTXNVNDKLRGILLN (with X indicating unassignable residue) that was used for subsequent PCR analysis.
Fig. 1.

Representative mass spectrum of a top layer neuron from the F cluster in the cerebral ganglion. Peaks generally correspond to [M+H]+, where M is the molecular weight of each peptide. Aplysia insulin (AI), and its shortened form AI′, Cβ, and its truncated form Cβ′, are labeled. Inset, Purified HPLC fraction containing Cβ.
Semi-nested degenerate PCR yielded a single clone which, upstream of the degenerate primer, encoded the predicted upstream amino acid sequence. The correct clones were used to screen a library and isolate three clones. The longest insert was ∼4.5 kb. The mRNA shown in Figure 2 consists of a 468 bp open reading frame that codes for a 156 amino acid precursor containing a single copy of the 1714 Da peptide (underlined in figure). Northern analysis (Fig. 3) indicates that the mRNA is ∼4.5 kb in length, suggesting that the clones isolated from the library were near full length. Sequencing of the 5′ 1 kb of these three clones yielded consensus sequence for the entire coding region. The 3′ end of the mRNA has not been sequenced, but the 190 bp of 3′ untranslated region sequenced contains multiple stop codons in all three frames, indicating that the remaining 3.2 kb of 3′ sequence is also untranslated region. The predicted amino acid sequence does, in fact, show considerable homology to the insulin family of prohormones and represents the first of its kind to be reported inAplysia.
Fig. 2.
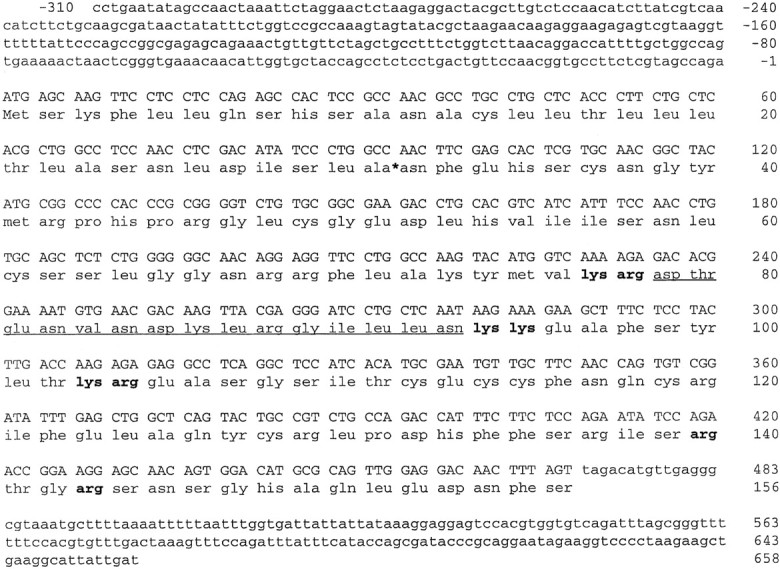
cDNA and predicted protein sequence of theAplysia insulin prohormone (GenBank accession numberAF160192). The nucleotide sequence of the strand corresponding to the mRNA is shown with 5′ and 3′ untranslated in lowercase letters and the coding region in uppercase letters. Nucleotide sequence in the coding region is grouped by codons with the coded amino acid shown below. Numbering of amino acids and nucleotides is shown at the end of each line with nucleotide numbering negative before the coding sequence and positive after the 5′ untranslated region. Predicted proteolytic processing sites are shown in bold, and the predicted signal sequence proteolytic processing site is shown with an asterisk. The sequence of the biochemically purified and sequenced peptide isunderlined.
Fig. 3.

Northern analysis of AI mRNA.A, Methylene blue staining of total RNA isolated from the different ganglia of Aplysia. The equal density of the rRNA band (which runs as a single 18 sec band) demonstrates equal loading of RNA in all lanes. The size and positions of the RNA markers are shown to the left. M, RNA marker lane; B, buccal ganglia; C, cerebral ganglia; L, pleural ganglia; E, pedal ganglia; A, abdominal ganglia. B,Hybridization of the total RNA with probe to the insulin mRNA. The hybridizing RNA is present only in cerebral ganglion total RNA and shows a principal band at ∼4.5 kb. Lower molecular weight (<1 kb) hybridizing RNA in the cerebral ganglia is most likely the result of degradation products of the full-length mRNA.
Several criteria confirm that the isolated clone represents the precursor to the peptide originally isolated and sequenced from F cluster neurons. First, the amino acid sequence of the 1714 Da peptide is found on the precursor (Fig. 2, underlined sequence) and it is flanked by dibasic processing sites, indicating that it can be proteolytically cleaved from the precursor. Second, the Northern analysis (Fig. 3) shows that the precursor mRNA is present exclusively in the cerebral ganglia, where the F cluster is located. Third, immunocytochemistry directed against the 1714 Da peptide sequence stains neurons in the F cluster of the cerebral ganglia and the UL and AT nerves (Fig. 4). Furthermore, the immunostained neurons in the F cluster have a similar morphology and distribution as the CFt class of neurons, which were the basis for the purification of the peptide (Rubakhin et al., 1999). Fourth, additional peptides predicted by the precursor can be seen in the MALDI-MS spectra from these neurons. These peaks were subsequently used to define the processing of the precursor.
Fig. 4.

Cβ immunoreactivity from whole mounts of the intact cerebral ganglion of a 20 gm juvenile animal, in dorsal (A) and ventral (B) views. Upper labial (UL) nerve, anterior tentacular (AT) nerve, two symmetrical neurons in the region of the optical ganglia, and top layer neurons of the F and C clusters exhibit intense staining. In contrast, the cerebral pleural (CPl) and cerebral pedal (CPe) nerves do not show any staining. Scale bar, 500 μm.
The amino acid sequence of the precursor predicts several processing sites of the prohormone convertase/furin family of endoproteases (Fig.2, shown in bold). These dibasic or RXXR sites are cleaved C-terminal to the last basic residue, then carboxypeptidase E removes the C-terminal basic residues. If the next C-terminal residue is a glycine, peptidyl-glycine α-amidating monooxygenase (PAM), another processing enzyme, can convert the glycine to an amide (Eipper et al., 1992). Additional postranslational processing such as sulfation, pyroglutamate formation, acetylation, additional proteolysis, and others can further modify the peptides to produce the final bioactive products.
When combined with the prohormone sequence, MALDI-MS is a powerful tool to confirm expected cleavage and determine unexpected processing steps. Because the cells synthesizing AI are easily isolated from the cerebral cluster (Rubakhin et al., 1999), individual cells were analyzed using MALDI-MS and compared with MALDI-MS analysis of LC fractions. More than 600 mass spectra from individual cell somas and nerves from over 56Aplysia, and LC fractions pooled from 23 animals have been examined. Mass spectra and biochemical characterization of each peptide are discussed separately below; in all cases, every measurement has been repeated numerous times, and representative data have been presented. Figure 1 shows a representative mass spectrum of a single CFt cell with AI and C peptides labeled. The nomenclature system common to other insulins has been adapted, so that the prohormone consists of a B chain, C peptides, and an A chain with insulin made up of the disulfide-linked B and A chains.
Consistent with the targeting of the precursors to the release pathway, the precursor has a hydrophobic signal peptide. Using SignalP version 1.1 signal sequence predictor (Nielsen et al., 1997), the predicted cleavage is between A[31] and N[32]. However, no appropriate B-chain peptide masses are observed in the spectra because of the formation of disulfide bonds. The spectra shown in Figure5A is of a homogenate of a group of C cluster cells on the sample plate before and after incubation overnight with dithiothreitol (DTT) to reduce disulfide bonds. The observed B chain starts with N[32] (immediately after the signal sequence) and ends in V [76] (at dibasic cleavage site KR), yielding a mass of 5093. As illustrated in Table1, we observe this mass with a mass error of 27 ppm, providing strong support for this assignment. The A chain begins with E [105] (after dibasic cleavage site KR), and ends with S[139] (at monobasic cleavage site R). This peptide has an N-terminal glutamic acid, which is commonly cyclized to pyroglutamate in neuropeptides and hormones (Bateman et al., 1990; Russo et al., 1997;Garden et al., 1999). This step causes a mass change of −18 Da, and now the predicted and observed single cell masses match (4057 Da), confirming the formation of the pGlu at the A chain.
Fig. 5.

A, MALDI-MS of a C cluster homogenate before and after DTT treatment, illustrating cleavage of insulin disulfide bonds resulting in the appearance of A (4057 Da) and B (5093 Da) chains. B, Mass spectra of single F cluster neuron (top trace) and AT nerve (bottom trace) showing processing of Cβ with a series of C-terminally truncated forms labeled. C, Confirmation of acetylation of the D peptide. In linear mode, only the acetylated D peptide is observed. When the spectrum is acquired in reflectron mode, both native and acetylated D peptides are seen. The acetylation is further confirmed using the reflectron mode with a timed ion selector (TIS) set at the molecular weight of the acetylated peptide.
Table 1.
Peptides from the AI prohormone
| Peptide name | Modifications | Predicted mass | Observed mass | Mass error (ppm) |
|---|---|---|---|---|
| A chain | pGlu | 4057.62 | 4057.79 | 42 |
| B chain | None | 5093.88 | 5093.74 | 27 |
| AI | Disulfide bonds | 9146.5 | 9146.53 | 3 |
| AI′ | Disulfide bonds | 8625.82 | 8625.64 | 21 |
| Cα | pGlu | 812.36 | 812.34 | 25 |
| Cβ | None | 1713.91 | 1713.89 | 12 |
| D peptide | N-acetylation | 1762.74 | 1762.77 | 17 |
The A and B chains together add to 9151 Da. When examining a single CFt cell (Fig. 1) that was not incubated in DTT, a strong peak is observed close to this mass that disappears with DTT treatment. When deducing the structure of the A and B chains, one notices the presence of four possible Cys–Cys bonds. Each Cys–Cys bond results in the loss of 2 Da. Single cells and purified LC fractions containing AI were examined with high mass accuracy using reflectron mode. The observed mass is 9146.5 (ς = ±0.9;n = 10), suggesting the presence of three disulfide bonds, and confirming the presence of between two and four disulfide bonds.
Interestingly, a second peak at 8626 Da also disappears in the presence of DTT (Fig. 1). This appears to be a modified form of AI (AI′), consisting of a truncated B chain that involves a cleavage at the single basic residue K[73] and results in the removal of C-terminal residues KYMV from the B chain of AI, with the shortened form of the B chain (assigned as B-chain′ with molecular weight at 4572 Da) observed after treatment with DTT. Besides observing the AI and AI′ (removal of KYMV), MALDI-MS also detects the presence of two additional peaks that correspond to the removal of C-terminal residues V and M, respectively. This observation is likely caused by the MALDI-MS in-source decay process (Brown and Lennon, 1995; Reiber et al., 1998), and serves as additional confirmation of our AI sequence.
The AI prohormone contains two peptides located between the A and B chains. These are designated as Cα and Cβ. Cα (E[96]–T[102]) is cleaved between dibasic residues and also has an N-terminal pGlu. Cβ is the original peptide isolated (mass of 1714 Da) and one of the most intense peaks in single-cell MALDI-MS spectra. Several peaks were detected in a single F cluster neuron and in the AT nerve in the 1100–1800 Da range that correspond to processing of Cβ (Fig. 5B). Specifically, peaks corresponding to Cβ(1–10), Cβ(1–12), Cβ(1–13), and Cβ(1–14) are observed, indicating this peptide is proteolytically degraded. Interestingly, close examination of the Cβ(1–10) mass peak indicates the presence of both amidated and nonamidated forms, with amidated forms being significantly more abundant. This result confirms the presence of PAM in these F cluster neurons, and also explains the absence of Cβ(1–11). Because of the action of PAM, the glycine at position 11 is converted to an amide. The detection of some nonamidated Cβ(1–10) likely reflects the relative rates of PAM and the unknown carboxypeptidase enzyme on Cβ(1–11).
Examining the prohormone sequence shown in Figure 2, there is an additional peptide after the A chain, specifically T[141]–S[156]. Such an extra peptide is unique to AI compared with other known insulin prohormones, although insulin growth factors (IGFs) contain a D domain that is not proteolytically cleaved from the rest of the prohormone. We observe this mass in LC fractions and single cells, as well as a peak exactly 42 Da higher, indicating putative acetylation of the peptide. We also observe an intense peak corresponding to cleavage at the R[143], leaving the peptide S[144]–S[156] without the +42 Da peak, indicating the acetylation is in the N-terminal 3 amino acids, and most likely on the N-terminal threonine. The appropriate LC fractions have been sequenced, which confirms our assignments of both the D peptide and shortened form in the mass spectra. Because of limitations of MALDI-MS in observing the <300 Da range because of the interference from the MALDI-MS matrix, we have been unsuccessful in observing the putative acetyl-TGR peptide. In addition, it is possible that this peptide is present in the shortened forms T-amide, acetyl-T-amide, or acetyl-TG. These are the only masses, besides the signal sequence, not directly confirmed with mass spectrometry.
Both the putative acetylated and native peptides are observed in LC fractions and in single cells. An important question is whether both the acetyl and non-acetyl peptides are present in cells. The 0.1% TFA used in the first stage of the LC separations has been reported to partially remove acetyl groups from peptides (Gheorghe et al., 1997), and MALDI-MS also can remove the labile acetyl group (Schnölzer and Lehmann, 1997). Basically, after ionization, the extra energy imparted to the molecule is sufficient to remove the acetyl group while the molecule is in the flight tube. However, this phenomenon can only be observed in reflectron mode and not in linear mode, where the fragment ion travels the same speed as precursor ions. To test for such measurement artifacts and confirm the +42 Da is caused by acetylation, we sampled several CFt cells, used MALDI-MS in both linear (Ac-D peptide observed) and reflectron mode (both peptides observed), and also set the external mass gate at the acetylated mass in reflectron mode (Fig. 5C). In the later case, only the Ac-D peptide would selectively pass through the flight tube via the mass gate to reach the detector, with all other masses being eliminated. Because we see both peptides (and no others), this strongly suggests that the peptide is predominately in the acetylated form, and the removal of the acetyl group during the initial passage down the flight tube (as a metastable ion; Schnölzer and Lehmann, 1997) (and in the LC purification process) is responsible for our observation of both masses. This also confirms our assignment of the +42 Da peak as an acetyl form because it can be converted into the biochemically confirmed D peptide. This represents the first known acetylated neuropeptide in Aplysia.
The distribution of AI precursor was examined using antibodies to the Cβ peptide. Immunocytochemistry showed that only the EDC-coupled Cβ antibody gave immunostaining (Fig. 4). All of the immunostained neuronal bodies for this peptide are found in the cerebral ganglia, and the stained neurons appeared to be bilaterally symmetrical. This is consistent with the results of Northern analysis of the distribution of the AI precursor in which AI mRNA was only observed in the cerebral ganglia. The Cβ antibody stains two main clusters of larger, top-layer neurons in the F and C clusters on the dorsal surface of the cerebral ganglia, in both the adult and juvenile animals, confirming our MALDI-MS studies. Additionally, it stains a single neuron near the optic nerve. A striking feature is the dense immunopositive innervation of the sheath surrounding the AT and UL nerves. This innervation forms a cuff that extends approximately half the length of the nerves and is consistent with neurohemal release and consequent neuroendocrine function of peptides produced from the AI precursor. Detailed studies of the light green cells (LGC) in Lymnaea show their neuroendocrine function, including synthesis and release of molluscan insulin-related peptides (Geraerts et al., 1992; Smit et al., 1998). Previously we reported (Rubakhin et al., 1999) that the F cluster neurons located in the cerebral ganglia in Aplysia have similar appearance, position, and physiological properties to the LGC cluster neurons of Lymnaea. Similarly, insulin-immunoreactive cells occupy complementary regions in mollusksPlanorbarius corneus (Sonetti et al., 1992) and Helix aspersa (Gomot et al., 1992), supporting the idea of a conserved location of neurosecretory cells within these closely related organisms.
To investigate the effects of food deprivation on AI mRNA expression, a group of Aplysia of similar size and age were starved for 1, 2, and 3 weeks. The mRNA levels for AI, actin, cerebral peptide 2 (CP2) and myomodulin (MM) were measured, with the results shown in Figure6. As indicated, AI precursor mRNA levels drop significantly (p < 0.001) after 2 and 3 weeks of food deprivation. Actin mRNA levels also dropped significantly (p < 0.05) after 2 and 3 weeks of food deprivation. Although CP2 mRNA levels showed a decreasing trend, and MM mRNA levels showed an increasing trend with longer food deprivation, these results were not statistically significant. Thus, the decline in AI mRNA with food deprivation cannot be attributed to some generalized decline in mRNA levels. It should be noted that although CP2, MM, and AI mRNA are found exclusively in neurons, actin mRNA is present in the ganglia sheath as well as the neurons. Thus, the decrement of actin mRNA resulting from prolonged food deprivation may represent the downregulation of the synthesis of contractile machinery in the sheath.
Fig. 6.

Effect of food deprivation on insulin, cerebral peptide 2 (CP2), myomodulin, and actin mRNA levels. Error bars indicate mean ± SEM of mRNA levels measured from five animals after 0, 1, 2, and 3 weeks of food deprivation.Asterisk denotes statistically significant differences as compared with non-food-deprived controls. CP2 and myomodulin mRNA levels did not change significantly, whereas insulin (p < 0.001) and actin (p < 0.05) mRNA showed significant decreases after 2 and 3 weeks of starvation.
To determine if Aplysia insulin may be involved in the regulation of hemolymph glucose, AI was injected into food-deprived animals. Injection of AI significantly decreased hemolymph glucose at 1.5 and 3 hr compared with control injection of ASW (Fig.7;F(4,28) = 4.73; p < 0.005; p values < 0.05, Tukey’s HSD comparisons). TheAplysia insulin prohormone fragment, acetyld-TGR peptide, had no effect on hemolymph glucose levels compared with control injection of ASW. There were no obvious behavioral effects in any of the injected animals, including no egg laying.
Fig. 7.

Effect of AI and the acetyl d-TGR peptide on hemolymph glucose in food-deprived Aplysia. At 1.5 and 3 hr after injection of AI hemolymph, glucose was significantly decreased compared with control injection of ASW. The acetyl d-TGR peptide had no effect on hemolymph glucose. Values are means ± SEM. *p < 0.05 versus ASW control, Tukey’s HSD test.
DISCUSSION
The AI prohormone undergoes complex processing to yield a series of peptides including AI, several C peptides, and a unique D peptide. Figure 8 summarizes the processing scheme and indicates whether each resulting peptide was observed with MALDI-MS, biochemically characterized, or merely predicted. As can be seen, for all major steps, the peptides have been confirmed with multiple techniques. Figure 9 compares a few of the reported insulin prohormones from locust to human and illustrates the similarities.
Fig. 8.

Summary of insulin processing based on single-cell MALDI-MS and biochemical characterization. Inset shows AI with the A and B chains connected with putative disulfide bonds.
Fig. 9.

Comparison of the AI prohormone structure to those of Lymnaea, human, and locust. As the AI precursor exhibits a D peptide region, it contains characteristics of both insulin and insulin growth factors in addition to being the largest molecular weight insulin reported to date.
Table 2 compares the amino acid sequence of AI to those of Lymnaea molluscan insulin-related peptides (MIPs) and human insulin. The A chains of both MIPs and AI appear to be terminally blocked (N-terminal pGlu). Comparison of amino acid sequence of the B chain and A chain shows that AI is homologous to MIPs with average sequence identity ∼45%, ranging from 40 to 62%. Human insulin and AI do not share significant amino acid sequence similarity. However, all the residues that are important for the maintenance of the basic insulin core structure are conserved. As illustrated in Table 2, the spacing between cysteine residues are the same for all insulin species, suggesting that the characteristic disulfide bridges in the insulin molecules have been conserved. In addition, the hydrophobic core residues responsible for globular insulin structure are either conserved as identical residues or are replaced by equivalent hydrophobic residues.
Table 2.
Amino acid sequence comparison of insulins

Identical residues are bolded, and similar polarities are italicized. Residues conserved in members of both the invertebrate insulin (AI and MIPs) and the vertebrate insulin (human) are boxed with solid lines, and those conserved between AI and MIPs or MIPs and human insulin are boxed with dashed lines. Gaps in sequences are indicated by hyphens. Number 1 designates the first residues of the A and B chains of human insulin.
Aplysia insulin is the largest reported insulin peptide (∼9146 Da) with greatly extended A and B chains. It is substantially larger than the MIPs isolated from Lymnaea stagnalis (Smit et al., 1998), human, and bovine insulin as illustrated in Figure 9. Similar to MIPs (Smit et al., 1998), the B chain of AI is processed so that the last four C-terminally located amino acid residues are removed posttranslationally. The N-terminal pyroglutamate formation of A chain in AI is also homologous to MIPs, where N-terminal Glu or Gln forms cyclized pGlu modifications. Another striking feature of the AI molecule is the presence of eight cysteine residues. Compared with vertebrate insulins in which three pairs of Cys form two interchain and one intrachain disulfide bonds, an extra pair of Cys are present in AI and the MIPs. Previous literature has suggested the extra pair of Cys form an extra disulfide bond in MIPs (Smit et al., 1998). The experimental observed mass suggests the presence of three disulfide bonds, but the mass error of ±1 Da cannot rule out the possibility of between two and four disulfide bonds. Higher mass accuracy or further biochemical experiments are needed to truly confirm the number of disulfide bonds and understand the bonding pattern. The absence of the H[10] in the B chain of AI makes it unlikely to form the Zn-binding domain found in vertebrate insulins.
The presence of a C peptide is conserved across all insulin prohormones, however a definitive function for the C peptide has yet to be determined. Ido et al. (1997) reported recently that human insulin C peptide is biologically active and aids in recovery from the diabetes-induced decrease in cellular sodium-potassium adenosine triphosphatase (ATPase) activity and impaired nerve conduction (Ido et al., 1997). The AI C peptides show no sequence homology to vertebrates, but do exhibit similar locations in prohormone (i.e., two C peptides generated by cleavage of dibasic residues) to MIPs. There is a high degree of structural identity of all C peptides of the pro-MIPs (de With et al., 1997; Smit et al., 1998). Table3 provides a comparison of AI C peptides with that of pro-MIPs in Lymnaea. Although AI Cα peptide (only 7 AAs) is much shorter than those of pro-MIPs (either 25 or 26 residues), their C-terminal sequence is similar. As indicated in Table3, four of seven amino acid residues in AI Cα peptide are identical to those of other pro-MIPs at the C terminal. The other two residues also carry similar polarity as their counterparts in the C peptides of the pro-MIP. The high degree of sequence identity at C-terminal of these Cα peptides suggests a potential receptor-binding site. In addition, the pGlu formation at the N-terminal Glu of AI Cα peptide further suggests bioactivity as pGlu extends the lifetime of peptides after release (Abraham and Podell, 1981; Stagg and Candy, 1998).
Table 3.
Comparison of amino acid sequence of insulin C peptides

Identical residues are boxed with solid lines. Both AI Cβ and Cα are compared to several previously reported Lymnaea Cαpeptides. The AI Cβ and Cα are only detected as separate peptides, whereas for Lymnaea, a single peptide is observed or inferred.
The AI Cβ peptide also shows some sequence similarity to the N-terminal end of Cα in pro-MIP III. Interestingly, for both AI Cβ and MIP Cβ(de With et al., 1997), a large number of C-terminally truncated Cβ peptides are detected by MALDI-MS in single cells. The detection of shortened forms in cell somas strongly suggests that these peptides result from intracellularly proteolytic processing instead of extracellular degradation. In addition, the absence of Cβ(1–11) and detection of amidated Cβ(1–10) suggests the presence of PAM. Also, in contrast to Lymnaea MIPs in which the intact Cβ peptide are absent from processes (de With et al., 1997), the intact form of AI Cβ peptide is one of the most intense peaks detected in AI-containing cells and processes. Similar peptide profiles show the intact and truncated Cβ peptides are also observed in the neurohemal release area.
Perhaps the most interesting aspect of this AI prohormone is the D peptide. In other insulins, the prohormone ends with the A chain. For the AI prohormone, a unique peptide is encoded and its expression confirmed with both MALDI-MS and biochemical isolation and sequencing. Interestingly, the D peptide is acetylated, and we observe (again both by MALDI-MS of a single cell and biochemically) a shortened form consisting of the removal of the ac-TGR. The only members of the insulin superfamily that have extra peptides are the locust insulin (Lagueux et al., 1990) with a short putative propeptide preceding the B chain inferred from the gene sequence and the IGFs. Whereas IGF II has both a D domain and an E domain (Froesch and Zapf, 1985; Girbau et al., 1987), these have not been reported to be cleaved off the prohormone and so are not active in themselves. Thus, these peptides inAplysia appear to be unique to the extensive insulin superfamily.
Insulin in many species is associated with food intake and metabolism (Woods, 1995). Supporting the idea of a similar function of AI is the observation that there was a significant decrease in AI mRNA expression after extended starvation. In addition, injection of AI significantly reduced hemolymph glucose. A decrease in blood glucose is one of the cardinal effects of insulin injection in vertebrate species (Friedman and Granneman, 1983). This later result of AI on hemolymph glucose is supported by the previous finding that extracts of the UL and AT nerves, the storage/release sites for AI prohormone products, also cause a decrease in glucose concentration in the hemolymph ofAplysia (Horn et al., 1998). Interestingly, in the previous study (Horn et al., 1998) injection of vertebrate insulin did not affect hemolymph glucose in Aplysia. Consistent with the interpretation that AI is involved in glucose metabolism are studies inLymnaea stagnalis on the light green cells, which synthesize a molluscan insulin. These cells are excited by glucose (Kits et al., 1991), and lesion of these cells results in increased hemolymph glucose (Geraerts, 1992).
Several studies have demonstrated the biological effects of insulin onAplysia. The exposure of bag cells to mammalian insulin was shown to induce autophosphorylation of the bag cell receptors and elevate voltage-dependent Ca2+ and K+ currents, which regulates the excitability of these neurons (Jonas et al., 1996). Application of bovine insulin to these clusters leads to a dramatic elevation in intracellular Ca2+ concentration and triggers neuropeptide (such as ELH) release (Jonas et al., 1997). Because bag cells are well known for control of egg-laying behavior, insulin peptides may involve regulating reproduction of the animal through their actions on these cells. Besides its actions on the bag cell neurons, application of human insulin hyperpolarizesAplysia abdominal ganglion L14 motor neurons required for inking (Shapiro et al., 1991). By suppressing the firing of L14 cells, this might maintain different levels of readiness for defense of hungry and satiated animals.
Although the most well known function of insulin in vertebrates is related to glucose metabolism, recent research suggests that insulin plays important roles in learning and memory (Wickelgren, 1998). For example, several lines of research indicate that defective glucose metabolism could contribute to Alzheimer’s disease; furthermore, both insulin and glucose infusions produced striking improvements in verbal memory in early-stage Alzheimer’s patients as well as controls (Craft et al., 1996; Hoyer, 1997, 1998). Although exciting, further evidence is needed to confirm the effect of insulin on memory. Compared with vertebrate nervous systems, an invertebrate such asAplysia provides an advantageous model to study the behavioral, neurophysiological, and biochemical components of the plastic changes underlying learning and memory (Kandel and Schwartz, 1982). Thus, Aplysia may serve as a model system to investigate the roles of AI in learning and memory.
Footnotes
This work was supported by the National Institutes of Health Grants NS31609, MH50235, K05MH01427, MH11586, and MH35564, and National Science Foundation Grant CHE 9622663. We gratefully acknowledge the generous gift of Aplysia cDNA library from Dr. Gregg Nagle. We also thank Tatiana Moroz for assistance in cell isolation and Midwest Analytical, Inc. for peptide sequencing. Aplysia californica were partially provided by the National Resource for Aplysia at the University of Miami under National Institutes of Health National Center for Research Resources Grant RR10294.
Correspondence should be addressed to J. V. Sweedler, 600 South Mathews Avenue, University of Illinois, Urbana, IL 61801.
REFERENCES
- 1.Abraham GN, Podell DN. Pyroglutamic acid: nonmetabolic formation, function in proteins and peptides, and characteristics of the enzymes effecting its removal. Mol Cell Biochem. 1981;38:181–190. doi: 10.1007/BF00235695. [DOI] [PubMed] [Google Scholar]
- 2.Banting FG, Best CH. The internal secretion of the pancreas. J Lab Clin Med. 1922;7:251–266. [PubMed] [Google Scholar]
- 3.Bateman A, Solomon S, Bennett HPJ. Post-translational modification of bovine pro-opiomelanocortin: tyrosine sulfation and pyroglutamate formation, a mass spectrometric study. J Biol Chem. 1990;266:22130–22136. [PubMed] [Google Scholar]
- 4.Bell GI, Pictet RL, Rutter WJ, Cordell B, Tischer E, Goodman HM. Sequence of the human insulin gene. Nature. 1960;284:26–32. doi: 10.1038/284026a0. [DOI] [PubMed] [Google Scholar]
- 5.Boyd FT, Clarke DW, Mather TF, Raizada MK. Insulin receptors and insulin modulation of norepinephrine uptake in neuronal cultures from rat brain. J Biol Chem. 1985;260:15880–15884. [PubMed] [Google Scholar]
- 6.Brown RS, Lennon JJ. Sequence-specific fragmentation of matrix-assisted laser desorped protein/peptide ions. Anal Chem. 1995;67:3990–3999. doi: 10.1021/ac00117a027. [DOI] [PubMed] [Google Scholar]
- 7.Chomczynski P, Sacchi N. Single step method of RNA isolation by acid guanidinium thiocyanate-phenol-chloroform extraction. Anal Biochem. 1987;162:156–159. doi: 10.1006/abio.1987.9999. [DOI] [PubMed] [Google Scholar]
- 8.Collier E, Watkinson A, Cleland CF, Roth J. Partial purification and characterization of an insulin-like material from spinach and Lemna gibba G3. J Biol Chem. 1987;262:6238–6247. [PubMed] [Google Scholar]
- 9.Craft S, Newcomer J, Kanne S, Dagogo-Jack S, Cryer P, Sheline Y, Luby J, Dagogo-Jack A, Alderson A. Memory improvement following induced hyperinsulinemia in Alzheimer’s disease. Neurobiol Aging. 1996;17:123–30. doi: 10.1016/0197-4580(95)02002-0. [DOI] [PubMed] [Google Scholar]
- 10.de With ND, Li KW, Jimenez CR, Vnok N, Dreisewerd K, Hillenkamp F, Karas M, Geraerts WPM. Intracellular degradation of C-peptides in molluscan neurons producing insulin-related hormones. Peptides. 1997;18:765–770. doi: 10.1016/s0196-9781(97)00020-x. [DOI] [PubMed] [Google Scholar]
- 11.Ebberink RHM, Joosse J. Molecular properties of various snail peptides from brain and gut. Peptides. 1985;6:451–457. doi: 10.1016/0196-9781(85)90413-9. [DOI] [PubMed] [Google Scholar]
- 12.Eipper BA, Stoffers DA, Mains RE. The biosynthesis of neuropeptides: peptide α-amidation. Annu Rev Neurosci. 1992;15:57–85. doi: 10.1146/annurev.ne.15.030192.000421. [DOI] [PubMed] [Google Scholar]
- 13.Floyd PD, Li L, Moroz TP, Sweedler JV. Characterization of peptides from Aplysia using microbore liquid chromatography with MALDI-TOF mass spectrometry guided purification. J Chromatogr A. 1999;830:105–113. doi: 10.1016/s0021-9673(98)00880-2. [DOI] [PubMed] [Google Scholar]
- 14.Friedman MI, Granneman J. Food intake and peripheral factors after recovery from insulin-induced hypoglycemia. Am J Physiol. 1983;244:R274–R382. doi: 10.1152/ajpregu.1983.244.3.R374. [DOI] [PubMed] [Google Scholar]
- 15.Froesch ER, Zapf J. Insulin-like growth factors and insulin: comparative aspects. Diabetologia. 1985;28:485–493. doi: 10.1007/BF00281982. [DOI] [PubMed] [Google Scholar]
- 16.Garden RW, Moroz LL, Moroz TP, Shippy SA, Sweedler JV. Excess salt removal with matrix rinsing: direct peptide profiling of neurons from marine invertebrates using matrix-assisted laser desorption/ionization time-of-flight mass spectrometry. J Mass Spectrom. 1996;31:1126–1130. doi: 10.1002/(SICI)1096-9888(199610)31:10<1126::AID-JMS403>3.0.CO;2-7. [DOI] [PubMed] [Google Scholar]
- 17.Garden RW, Moroz TP, Gleeson JM, Floyd PD, Li L, Rubakhin SS, Sweedler JV. Formation of N-pyroglutamyl peptides from N-Glu and N-Gln precursors in Aplysia neurons. J Neurochem. 1999;72:676–681. doi: 10.1046/j.1471-4159.1999.0720676.x. [DOI] [PubMed] [Google Scholar]
- 18.Geraerts WPM. Neurohormonal control of growth and carbohydrate metabolism by the light green cells in Lymnaea stagnalis. Gen Comp Endocrinol. 1992;86:433–444. doi: 10.1016/0016-6480(92)90068-u. [DOI] [PubMed] [Google Scholar]
- 19.Geraerts WP, Smit AB, Li KW, Hordijk PL. The light green cells of Lymnaea: a neuroendocrine model system for stimulus-induced expression of multiple peptide genes in a single cell type. Experientia. 1992;48:464–473. doi: 10.1007/BF01928165. [DOI] [PubMed] [Google Scholar]
- 20.Gheorghe MT, Jornvall H, Bergman T. Optimized alcoholytic deacetylation of N-acetyl-blocked polypeptides for subsequent Edman degradation. Anal Biochem. 1997;254:119–125. doi: 10.1006/abio.1997.2380. [DOI] [PubMed] [Google Scholar]
- 21.Girbau M, Gomez JA, Lesniak MA, de Pablo F. Insulin and insulin-like growth factor I both stimulate metabolism, growth, and differentiation in the postneurula chick embryo. Endocrinology. 1987;121:1477–1482. doi: 10.1210/endo-121-4-1477. [DOI] [PubMed] [Google Scholar]
- 22.Gomot A, Gomot L, Marchand CR, Colard C, Bride J. Immunocytochemical localization of insulin-related peptide(s) in the central nervous system of the snail Helix aspersa. Cell Mol Neurobiol. 1992;12:21–32. doi: 10.1007/BF00711636. [DOI] [PubMed] [Google Scholar]
- 23.Horn CC, Koester J, Kupfermann I. Evidence that hemolymph glucose in Aplysia californica is regulated but does not affect feeding behavior. Behav Neurosci. 1998;112:1258–1265. [PubMed] [Google Scholar]
- 24.Hoyer S. Models of Alzheimer’s disease: cellular and molecular aspects. J Neural Transm [Suppl] 1997;49:11–21. doi: 10.1007/978-3-7091-6844-8_2. [DOI] [PubMed] [Google Scholar]
- 25.Hoyer S. Risk factors for Alzheimer’s disease during aging. Impacts of glucose/energy metabolism. J Neural Transm [Suppl] 1998;54:187–194. doi: 10.1007/978-3-7091-7508-8_18. [DOI] [PubMed] [Google Scholar]
- 26.Ido Y, Vindigni A, Chang K, Stramm L, Chance R, Heath WF, DiMarchi RD, Di Cera E, Williamson JR. Prevention of vascular and neural dysfunction in diabetic rats by C-peptide. Science. 1997;277:563–566. doi: 10.1126/science.277.5325.563. [DOI] [PubMed] [Google Scholar]
- 27.Jonas EA, Knox RJ, Kaczmarek LK, Schwartz JH, Salomon DH. Insulin receptor in Aplysia neurons: characterization, molecular cloning and modulation of ion currents. J Neurosci. 1996;16:1645–1658. doi: 10.1523/JNEUROSCI.16-05-01645.1996. [DOI] [PMC free article] [PubMed] [Google Scholar]
- 28.Jonas EA, Knox RJ, Caitlin T, Smith M, Wayne NL, Connor JA, Kaczmarek LK. Regulation by insulin of a unique neuronal Ca2+ pool and of neuropeptide secretion. Nature. 1997;385:343–346. doi: 10.1038/385343a0. [DOI] [PubMed] [Google Scholar]
- 29.Kandel ER, Schwartz JH. Molecular biology of learning: modulation of transmitter release. Science. 1982;218:433–443. doi: 10.1126/science.6289442. [DOI] [PubMed] [Google Scholar]
- 30.Kits KS, Bobeldijk RC, Crest M, Lodder JC. Glucose-induced excitation in molluscan central neurons producing insulin-related peptides. Pflügers Arch. 1991;417:597–604. doi: 10.1007/BF00372957. [DOI] [PubMed] [Google Scholar]
- 31.Lagueux M, Lwoff L, Meister M, Goltzene F, Hoffmann JA. cDNAs from neurosecretory cells of brains of Locusta migratoria encoding a novel member of the superfamily of insulins. Eur J Biochem. 1990;187:249–254. doi: 10.1111/j.1432-1033.1990.tb15302.x. [DOI] [PubMed] [Google Scholar]
- 32.Li L, Moroz TP, Garden RW, Floyd PD, Weiss KR, Sweedler JV. Mass spectrometric survey of interganglionically transported peptides in Aplysia. Peptides. 1998;19:1425–1433. doi: 10.1016/s0196-9781(98)00094-1. [DOI] [PubMed] [Google Scholar]
- 33.Newcomb RW, Scheller RH. Regulated release of multiple peptides from the bag cell neurons of Aplysia californica. Brain Res. 1990;521:229–237. doi: 10.1016/0006-8993(90)91547-t. [DOI] [PubMed] [Google Scholar]
- 34.Nielsen H, Engelbrecht J, Brunak S, von Heijne G. Identification of prokaryotic and eukaryotic signal peptides and prediction of their cleavage sites. Protein Eng. 1997;10:1–6. doi: 10.1093/protein/10.1.1. [DOI] [PubMed] [Google Scholar]
- 35.Raudsepp T, Otte K, Rozell B, Chowdhary BP. FISH mapping of the IGF2 gene in horse and donkey-detection of homoeology with HSA11. Mamm Genome. 1997;8:569–572. doi: 10.1007/s003359900505. [DOI] [PubMed] [Google Scholar]
- 36.Reiber DC, Grover TA, Brown RS. Identifying proteins using matrix-assisted laser desorption/ionization in-source fragmentation data combined with database searching. Anal Chem. 1998;70:673–683. doi: 10.1021/ac971157l. [DOI] [PubMed] [Google Scholar]
- 37.Rubakhin SS, Li L, Moroz TP, Sweedler JV. Characterization of the Aplysia californica cerebral ganglion F-cluster. J Neurophysiol. 1999;81:1251–1261. doi: 10.1152/jn.1999.81.3.1251. [DOI] [PubMed] [Google Scholar]
- 38.Russo C, Saido TC, DeBusk LM, Tabaton M, Gambetti P, Teller JK. Heterogeneity of water-soluble amyloid-peptide in Alzheimer’s disease and Down’s syndrome brains. FEBS Lett. 1997;409:411–416. doi: 10.1016/s0014-5793(97)00564-4. [DOI] [PubMed] [Google Scholar]
- 39.Sambrook J, Fritsch EF, Maniatis T. Molecular cloning: a laboratory manual. Cold Spring Harbor Laboratory; New York: 1989. [Google Scholar]
- 40.Schnölzer M, Lehmann WD. Identification of modified peptides by metastable fragmentation in MALDI mass spectrometry. Int J Mass Spectrom Ion Processes. 1997;169/170:263–271. [Google Scholar]
- 41.Schwartz JH, Shapiro E, Brown SD, Saltiel AR. Short-term electrophysiological actions of insulin on Aplysia neurons: identification of a possible novel modulatory second-messenger mechanism. Cold Spring Harb Symp Quant Biol. 1990;55:95–100. doi: 10.1101/sqb.1990.055.01.012. [DOI] [PubMed] [Google Scholar]
- 42.Schwartz MW, Sipols AJ, Marks JL, Sanacora G, White JD, Scheurink A, Kahn SE, Baskin DG, Woods SC, Figlewicz DP, Porte D., Jr Inhibition of hypothalamic neuropeptide Y gene expression by insulin. Endocrinology. 1992;130:3609–3616. doi: 10.1210/endo.130.6.1597158. [DOI] [PubMed] [Google Scholar]
- 43.Shapiro E, Brown SD, Saltiel AR, Schwartz JH. Short-term action of insulin on Aplysia neurons: generation of a possible novel modulator of ion channels. J Neurobiol. 1991;22:55–62. doi: 10.1002/neu.480220106. [DOI] [PubMed] [Google Scholar]
- 44.Smit AB, Geraerts WPM, Meester I, Van Heerikjuizen H, Joosse J. Characterization of a cDNA clone encoding molluscan insulin-related peptide II of Lymnaea stagnalis. Eur J Biochem. 1991;199:699–703. doi: 10.1111/j.1432-1033.1991.tb16173.x. [DOI] [PubMed] [Google Scholar]
- 45.Smit AB, Vreugdenhil E, Ebberink RHM, Geraerts WPM, Klootwijk J, Joosse J. Growth controlling molluscan neurons produce the precursor of an insulin-related peptide. Nature. 1988;331:335–338. doi: 10.1038/331535a0. [DOI] [PubMed] [Google Scholar]
- 46.Smit AB, van Kesteren RE, Li KW, van Minnen J, Spijker S, van Heerikhuizen H, Geraerts WP. Towards understanding the role of insulin in the brain: lessons from insulin-related signaling systems in the invertebrate brain. Prog Neurobiol. 1998;54:35–54. doi: 10.1016/s0301-0082(97)00063-4. [DOI] [PubMed] [Google Scholar]
- 47.Sonetti D, van Heumen WR, Roubos EW. Light- and electron-microscopic immunocytochemistry of a molluscan insulin-related peptide in the central nervous system of Planorbarius corneus. Cell Tissue Res. 1992;267:473–481. doi: 10.1007/BF00319369. [DOI] [PubMed] [Google Scholar]
- 48.Stagg LE, Candy DJ. The effect of analogues of adipokinetic hormone II on second messenger systems in the fat body of Schistocera gregaria. Insect Biochem Mol Biol. 1998;28:59–68. [Google Scholar]
- 49.Trinder P. Determination of glucose in blood using glucose oxidase with an alternative oxygen acceptor. Ann Clin Biochem. 1969;6:24–27. [Google Scholar]
- 50.Uvnas-Wallenstein K. Peptides in metabolic autonomic nerves. Diabetologia. 1981;20:337–342. doi: 10.1007/BF00254501. [DOI] [PubMed] [Google Scholar]
- 51.Van Minnen J, Schallig H. Demonstration of insulin-related substances in the central nervous systems of pulmonates and Aplysia californica. Cell Tissue Res. 1990;260:381–386. [Google Scholar]
- 52.Vilim FS, Price DA, Lesser W, Kupfermann I, Weiss KR. Costorage and corelease of modulatory peptide cotransmitters with partially antagonistic actions on the accessory radula closer muscle of Aplysia californica. J Neurosci. 1996;16:8092–8104. doi: 10.1523/JNEUROSCI.16-24-08092.1996. [DOI] [PMC free article] [PubMed] [Google Scholar]
- 53.Wickelgren I. Tracking insulin to the mind. Science. 1998;280:517–519. doi: 10.1126/science.280.5363.517. [DOI] [PubMed] [Google Scholar]
- 54.Woods SC. Insulin and the brain: a mutual dependency. In: Fluharty SJ, Morrison AR, Stellar E, Sprague JM, editors. Progress in psychobiology and physiological psychology, Vol 16. Academic; New York: 1995. pp. 53–81. [Google Scholar]