

Abstract
Subcellular localization of the NMDA receptor NR1 splice forms was studied by expressing individual splice variants and their epitope-tagged derivatives in mouse fibroblasts and in hippocampal neurons. When NR1 splice variants were expressed in fibroblasts, the amount of NR1 molecules expressed on the cell surface varied among forms with different C-terminal cytoplasmic domains. The splice forms with the longest C-terminal cytoplasmic tail (NR1–1a and NR1-1b) showed the lowest amount of cell surface expression, and the splice forms with the shortest C-terminal cytoplasmic tail (NR1–4a and NR1-4b) showed the highest cell surface expression. Cell surface expression of NR1 was enhanced by the coexpression of the NR2 subunit. We measured the glutamate-induced increase of calcium concentration in fibroblasts expressing one of the NR1 splice forms and the NR2B subunit. The increase of calcium concentration after glutamate application had a positive correlation with the amount of NR1 splice forms expressed on the cell surface. When epitope-tagged NR1 splice variants were expressed in primary hippocampal neurons using recombinant adenoviruses, we also observed the differential expression on the cell surface between splice variants. These results suggest that the splicing of the C-terminal domain of the NR1 subunit regulates the cell surface expression of the functional NMDA receptors.
Keywords: NMDA receptor, alternative splicing, fluorescent antibody technique, calcium imaging, membrane proteins, neurons
Glutamate is the major excitatory neurotransmitter in the vertebrate CNS. Ionotropic glutamate receptors are divided into AMPA, kainate, and NMDA subclasses according to the specific agonists that activate these receptor subclasses. NMDA receptors are expressed widely in the mammalian CNS and play a central role in synaptic plasticity, circuit formation, and excitotoxicity (Nakanishi, 1992). NMDA receptors are comprised of NR1 and NR2 subunits. Both subunits have a transmembrane topology that is similar to that of other AMPA and kainate receptors (Hollmann et al., 1994;Wood et al., 1995; Hirai et al., 1996). They have three transmembrane regions and one membrane-associated region with the N-terminal extracellular domain and the C-terminal cytoplasmic domain. NR1 subunits exist in eight alternatively spliced forms derived from a single gene product (Sugihara et al., 1992; Hollmann et al., 1993), and NR2 subunits are the products of four different genes, NR2A–NR2D (Kutsuwada et al., 1992; Monyer et al., 1994). Although extensive electrophysiological and biophysical studies have revealed the properties of the agonist binding domains and the channel forming domains of the NMDA receptor complex, little is known about the mechanism of cell surface expression and accumulation at the synapse.
Several recent immunocytochemical and biochemical studies have shed light on the distribution of the NMDA receptor molecules on the neuronal cell surface and the relationship between the subunit assembly and cell surface expression. Only 40–50% of the NR1 molecules are expressed on the cell surface in cultured hippocampal neurons, whereas most of the NR2B molecules are expressed on the cell surface (Hall and Soderling, 1997). Cell surface staining experiments have shown that the NR1–1a splice form requires NR2A molecules for efficient cell surface expression (McIlhinney et al., 1996). Identification of a family of proteins containing multiple postsynaptic density 95/Discs large/zona occludens 1 [PSD-95/Discs large/ZO-1 (PDZ)] domains, such as PSD-95 and chapsyn-110 (PSD-93), has revealed the receptor clustering activity of these proteins when expressed in a heterologous system (Kornau et al., 1995; Kim et al., 1996). Furthermore, splice variant-specific formation of receptor clustering was observed in cells expressing NR1 molecules without other receptor-associated proteins (Ehlers et al., 1995). These observations indicate that the NMDA receptor expression and clustering on the cell surface is a complex process.
To elucidate the mechanisms of formation of the NMDA receptor complex on the cell surface, subcellular distributions of the eight splice variants of the NR1 subunit were analyzed in both the absence and presence of the NR2 subunit in fibroblasts. Differential efficiency of the cell surface expression among splice variants was further tested by Ca2+ imaging in fibroblasts and by expressing epitope-tagged NR1 molecules in primary hippocampal neurons. The results suggest a possible regulation of the cell surface expression of the NMDA receptor complex by the alternative splicing of the C-terminal domain of the NMDA receptor NR1 subunit.
MATERIALS AND METHODS
Construction of NR1 subunit expression vectors. cDNAs encoding NR1 splice variants were provided by Dr. M. Hollmann (Gottingen, Germany). cDNAs were cloned into the mammalian expression vector pCMVβ (Clontech, Palo Alto, CA) after removal of the β-galactosidase cDNA. Human c-myc tag (EQKLISEEDL) or influenza hemagglutinin protein (HA) tag (YPYDVPDYA) was inserted between Ile26 and Val27 of the NR1 cDNAs, and the cDNAs were cloned into the pCMVβ vector.
Transfection of 3T3 cells. Transfection of 3T3 cells was performed using lipofectamine (Life Technologies, Grand Island, NY) reagent at 40–50% confluence. Cells were plated onto polyornithine-coated coverslips for immunofluorescence microscopy or onto 60 mm tissue culture dishes for immunoelectron microscopy and for preparation of cell extracts, or they were plated onto poly-l-lysine-coated coverslips attached to the bottom of 35 mm tissue culture dishes with holes of 10 mm diameter for Ca2+ imaging. Cells were assayed 2 d after transfection.
Antibodies. We obtained monoclonal anti-NR1 antibody (clone 54.1) from PharMingen (San Diego, CA) and used it at a concentration of 1:100 for immunofluorescence and 1:1000 for immunoblotting. Monoclonal anti-HA antibody (clone 12CA5) came from Boehringer Mannheim (Indianapolis, IN) and were used at a concentration of 1:100. We obtained polyclonal anti-synaptophysin antibody from Zymed (San Francisco, CA) and monoclonal anti-α-tubulin (DM-1A) from Seikagaku Corporation (Tokyo, Japan). Mouse hybridoma cell line 9E10 was obtained from Developmental Studies Hybridoma Bank (Iowa City, IA). Anti-myc monoclonal antibody was purified from hybridoma supernatant by protein G-Sepharose column and used at the concentration of 1 μg/ml.
Fluorescein-conjugated anti-mouse IgG antibody and rhodamine-conjugated anti-rabbit IgG were obtained from Dako (Glostrup, Denmark). Rhodamine-conjugated anti-mouse IgG antibody was from Cappel (West Chester, PA), fluorescein-conjugated goat Fab′ anti-mouse IgG was from Protos Immunoresearch (San Francisco, CA), and Cy3-conjugated goat anti-mouse IgG was from Jackson ImmunoResearch (West Grove, PA).
Cell surface staining of 3T3 cells, COS7 cells, and PC12 cells. We added anti-myc antibody directly to the culture medium at a concentration of 1 μg/ml and incubated the cells for 20 min at 37°C. Cells were washed with prewarmed culture medium and then reacted with fluorescein-conjugated IgG or Fab′ against mouse IgG for 10 min. Cells were rinsed in HBSS (Life Technologies) and fixed with 2% paraformaldehyde in PBS for 25 min at room temperature. In some experiments, samples were further processed for the detection of intracellular antigens after permeabilization in 0.2% Triton X-100. We also performed cell surface labeling of cells after fixation with 2% paraformaldehyde in PBS and obtained basically identical staining pattern.
Immunoblotting and immunoprecipitation. Immunoblotting and immunoprecipitation were done as described previously (Okabe et al., 1998a). For immunoblotting, cells were directly dissolved in SDS gel sample buffer (2% SDS, 50 mm Tris-HCl, pH 7.5, 0.75% DTT, 5% glycerol, Bromophenol blue) and heated to 95°C for 5 min. Immunoprecipitation of NR1 from brain extract was performed using monoclonal anti-NR1 in combination with protein A-Sepharose (Amersham Pharmacia Biotech, Uppsala, Sweden).
Immunofluorescence microscopy. Cells were washed in PBS and fixed in 2% paraformaldehyde in PBS for 20 min at room temperature. After the brief wash in PBS, cells were permeabilized in 0.1–0.2% of Triton X-100 for 5 min, and then nonspecific binding was blocked by incubation in 5% normal goat or horse serum in PBS for 30 min. Then, the cells were washed in PBS and incubated with primary antibodies in PBS for 30 min at room temperature. After washing in PBS three times, samples were incubated with fluorescein or rhodamine-conjugated secondary antibodies in PBS plus 2% normal goat or horse serum for 30 min. Cells on the coverslips were washed in PBS three times, mounted in 70% glycerol in PBS, and examined under aZeiss (Oberkochen, Germany) Axiophoto microscope or a ZeissLSM501 confocal laser scanning microscope. Quantitation of fluorescence was done using a Zeiss LSM501 confocal laser scanning microscope. We made optical sections through the depth of the cells for each preparation, and the fluorescence intensity was calculated from the single optical slice at the cell surface for cell surface intensity and from summation and averaging of the total z-axis stack for total cellular intensity.
Calcium imaging of transfected 3T3 cells. We performed imaging of intracellular Ca2+ by calculating the background-corrected fluorescence ratio of fura-2 at 340 and 380 nm excitation, using an Axon Imaging Workbench system (Axon Instruments, Foster City, CA). The exposure time at each wavelength was 132 msec, with a single frame pair captured every second. We estimated the free calcium concentration from a standard curve between the F340/F380 ratio and [Ca2+], using the established calibration method (Grynkiewicz et al., 1985). 3T3 cells were loaded with fura-2 by incubation in fura-2 AM (Molecular Probes, Eugene, OR) at a concentration of 5 μm in HEPES-buffered saline (HBS) (in mm: 20 Na-HEPES, pH 7.4, 115 NaCl, 5.4 KCl, 1 CaCl2, and 13.8 glucose) for 30 min at room temperature. Experiments were performed at room temperature in a perfusion chamber. HBS was used as a recording saline.l-glutamate and glycine were dissolved in recording solution at 10 and 1 μm, respectively. Application of drugs was accomplished by complete bath exchange. Pseudocolor images were created from raw eight-bit images using NIH Image software.
Calcium concentrations were calculated by averaging intracellular calcium of cells expressing a red-shifted variant of green fluorescent protein (eGFP), that is, those cells of which average intensity of eGFP signal was >30 (on a scale of 0–256 eight-bit digital images) after background subtraction. In most transfection experiments, one microscopic field (under a 40× oil immersion lens) contained 10–20 eGFP-positive 3T3 cells. Four fura-2 image pairs before perfusion and seven fura-2 image pairs 20–26 sec after perfusion of 0.5 ml of glutamate-containing HBS were recorded. No large fluctuation of fura-2 signals was observed during the period of 20–27 sec after perfusion in general.
Primary culture of mouse hippocampal neurons. Mouse hippocampal cells were prepared from embryos at the age of embryonic day 17 (E17). The method of dissection and dissociation was basically identical to the method of rat hippocampal cell culturing described previously (Okabe et al., 1998b). The cell suspension was plated onto glass coverslips in 24-multiwell plates, coated with 1 mg/ml poly-l-lysine, at a density of 200–500 cells/mm2. Cells were incubated at 37°C under 5% CO2 in an MEM medium (Life Technologies) containing 2% B-27 supplement (Life Technologies), 5% fetal bovine serum (Equitech-Bio, Ingram, TX), and 0.2 mml-glutamine. Ara-C (10 μm) was added 2 d after plating to prevent glial proliferation. One-fifth of the medium was replaced every 3–4 d.
Generation of recombinant adenoviruses. Construction of replication-deficient adenovirus was performed using the cosmid-terminal protein complex (COS–TPC) method described previously (Miyake et al., 1996). Recombinant adenoviruses expressing NR1 molecules (AxCMV-NR1–1b or AxCMV-NR1–4b) are human adenoviruses serotype 5, removing sequences in the E1A, E1B, and E3 regions, with an insertion of an NR1–1b or NR1–4b expression unit (Kanegae et al., 1995). The NR1–1b or NR1–4b expression unit contains an NR1–1b or NR1–4b coding region under the control of the cytomegalovirus immediate early gene promoter, together with the rabbit β-globin polyadenylation signal. The recombinant viruses were purified by CsCl step gradients and were stored at −80°C (Kanegae et al., 1994).
Adenovirus infection. Day 16–18 hippocampal neurons, COS7 cells, or PC12 cells were exposed for 60 min to viruses at a multiplicity of infection of 100. Cells were then washed, reincubated in the previously removed media, and after 48 hr, assayed by immunocytochemistry or immunoblotting.
Cell surface labeling of primary neurons. Primary neurons were incubated in HBS containing 1 μg/ml anti-myc antibody for 20 min at room temperature, washed with HBS three times, and then fixed by methanol at −20°C for 10 min. Fixed cells were treated with 5% normal horse serum to block nonspecific binding, and the first antibody was visualized by secondary antibody staining using goat anti-mouse IgG conjugated to Cy3. Cells were then reacted with either anti-myc antibody again to detect total myc-tagged NR1 protein or anti-synaptophysin antibody to detect the presynaptic structure, using fluorescein-conjugated secondary antibody. When cells were fixed before cell surface labeling, similar distribution of cell surface NR1 molecules were detected by successive reaction with Cy3-conjugated secondary antibody. However, the intensity of staining was weaker, possibly because of the reduction of antigenicity of the myc epitope.
Expression of the results of cell counting. To determine the number of cells, a total of 10–30 randomly chosen fields per coverslip was counted using 200 or 400× magnification under a fluorescence microscope. Results of double-staining experiments (see Figs. 3, 7) were expressed as the percentage of cells positive with cell surface staining in the population of cells positive with total cellular staining. All numerical values were the mean ± SEM of data from three to four independent culture experiments.
Fig. 3.

Cell surface expression of NR1 splice forms in 3T3 fibroblasts. 3T3 cells were transfected with eight splice forms of NR1 molecules and their epitope-tagged derivatives, and NR1 molecules on the cell surface were detected by reacting live 3T3 cells with primary antibodies and fluorescein-conjugated secondary antibodies.A–F, Cell surface staining was detected in cells transfected with NR1–2a (A), NR1–2b (B), NR1–3a (C), NR1–3b (D), NR1–4a (E), and NR1–4b (F). Similar cell surface staining was detected in cells transfected with corresponding myc-tagged derivatives. G–J, Transfected cells reacted with anti-myc antibody and fluorescein-conjugated secondary antibody were fixed, permeabilized, and further processed for the detection of total myc-epitopes by anti-myc antibody and rhodamine-conjugated secondary antibody. Cells transfected with NR1–1bmyc did not show cell surface staining (G), even in the presence of abundant total cellular staining (H). Cells transfected with NR1–4bmyc had both strong cell surface staining (I) and total cellular staining (J). K, Quantitation of cell surface expression of NR1 splice variants. Cells were double-labeled for cell surface staining and total cellular staining, as shown in G–J, and we then determined the percentages of cells having cell surface staining with either anti-NR1 or anti-myc. More than 100 cells immunopositive with anti-NR1 or anti-myc antibodies were examined for the presence of cell surface staining in each transfection experiment. Four independent experiments were performed. Scale bar, 20 μm.
Fig. 7.
Calcium imaging of 3T3 cells transfected with NR1 splice variants, NR2B, and eGFP. 3T3 cells were transfected with expression plasmids of NR1 splice variants (NR1–1b inA, C, E: NR1–4b inB, D, F) together with NR2B and eGFP, and the increase of intracellular calcium was measured. Microscopic fields containing 10–20 eGFP-positive cells were selected (A, B), and fluorescence ratio images were obtained before (C, D) and 20 sec after (E, F) application of 10 μm glutamate. A few cells transfected with NR1–1b and NR2B at the molar ratio of 1:1 showed >200 nm calcium increase (E). In contrast, more than half of the cells transfected with NR1–4b and NR2B at the molar ratio of 1:1 showed >200 nm of calcium increase (F).
Immunofluorescence microscopy of transfected 3T3 cells using anti-NR1 or anti-myc antibody revealed that >30% of cells were transfected and expressed NR1 molecules. Because cells having faint staining of total NR1 molecules were included in cell counting, proportion of cells showing surface staining fell in a range of 4.0–35% of transfected cells. However, cell surface expression of NR1 splice variants was not a rare event, because most of the cells expressing large amount of NR1 molecules showed cell surface expression, except cells expressing NR1–1 splice forms.
RESULTS
Immunofluorescence analysis of subcellular distribution of NMDA receptor NR1 subunits
The anti-NMDA receptor NR1 antibody (clone 54.1) recognizes the NMDAR1 residues 660–811 [according to Moriyoshi et al. (1991)], which correspond to the extracellular loop between M3 and M4 (Brose et al., 1994) (Fig. 1). Human c-myc or influenza HA tag was added to the N-terminal domain of the eight splice variants of the NR1 molecules to detect extracellular epitopes distinct from the epitope of clone 54.1. Native NR1 splice variants or their epitope-tagged derivatives were expressed in mouse 3T3 fibroblasts, and transfected cells were examined by immunofluorescence microscopy using anti-NR1 monoclonal antibody (clone 54.1), anti-myc monoclonal antibody (clone 9E10), or anti-HA monoclonal antibody (clone 12CA5).
Fig. 1.

Membrane topology and location of three exon cassettes of the NMDA receptor NR1. NMDA receptor NR1 molecules have three membrane-spanning domains (M1, M3, and M4) and one membrane-associated domain (M2). A human c-myc and influenza HA tag was inserted at the N-terminal extracellular region of the NR1 molecule. Monoclonal anti-NR1 (clone 54.1) recognizes the extracellular region between M3 and M4. Exon cassettes N, C1, and C2 are shown asopen boxes. The NR1–3 and NR1–4 splice forms lack a C2 exon cassette, and this results in the creation of an additional coding region of 22 amino acids (C2′ cassette). Eight splice variants are formed by the presence and absence of these three exon cassettes. We used the nomenclature of NR1 splice forms by Hollmann et al. (1993) in this study.
We examined total cellular distribution of NR1 splice variants by immunolabeling detergent-treated 3T3 cells (Fig.2A–L). Localization of NR1–1a and NR1–1b splice forms was distinct from the other six splice variants. NR1–1a and NR1–1b proteins formed discrete subcellular domains that were closely associated with the plasma membrane. The other six splice variants were distributed throughout the cells and did not form discrete clusters. Cell counting of 3T3 cells transfected with “b” splice forms, and their myc-tagged molecules confirmed that only NR1–1 splice forms formed discrete clusters (Fig.2M).
Fig. 2.

Subcellular localization of NR1 splice forms in 3T3 fibroblasts. 3T3 cells were transfected with eight splice forms of NR1 molecules and their epitope-tagged derivatives and examined by immunofluorescence. A–L, NR1–2a (C), NR1–2b (D), NR1–3a (E), NR1–3b (F), NR1–4a (G), NR1–4b (H), and their epitope-tagged molecules [NR1–2amyc (J), 2aHA (L)] were localized throughout the cytoplasm. In contrast, NR1–1a (A), NR1–1b (B), and their epitope-tagged molecules [NR1–1amyc (I), 1aHA (K)] formed distinct subcellular domains (arrows). M, Percentage of cells having distinct domains of anti-NR1 or anti-myc immunoreactivity in cells transfected with four splice variants of NR1 (NR1–1b to NR1–4b) and their myc-tagged derivatives (NR1–1bmyc to NR1–4bmyc). More than 200 cells immunopositive with anti-NR1 or anti-myc antibodies were examined for the presence of distinct receptor-rich domains in each transfection experiment. Four independent experiments were performed. Scale bar, 20 μm.
To detect NR1 molecules expressed on the cell surface, live 3T3 cells transfected with NR1 splice forms were labeled with anti-NR1, anti-myc, or anti-HA antibody, and the cells were subsequently reacted with fluorescein-conjugated anti-mouse IgG antibody. Cell surface expression of the NR1 molecules was found in the cells expressing NR1–2a, NR1–2b, NR1–3a, NR1–3b, NR1–4a, NR1–4b (Fig.3A–F), or their epitope-tagged derivatives (Fig. 3I, 4bmyc) (data not shown for other myc-tagged splice forms). In contrast, no cell surface staining was detected in the cells expressing NR1–1a, NR1–1b, NR1–1amyc, or NR1–1bmyc (Fig. 3G, 1bmyc). The presence or absence of the N-terminal exon cassette did not influence the cell surface expression of the NR1 molecules.
To quantitate the difference of the cell surface expression of the NR1 splice variants, percentages of cells showing cell surface staining of NR1 molecules were calculated by labeling both cell surface and total cellular NR1 molecules with different chromophores and subsequently analyzing them with immunofluorescence microscopy (Fig.3G–J). The most striking difference was that the cells expressing the NR1–1b or NR1–1bmyc splice form did not show any surface staining, whereas 4.0–35% of transfected cells (corresponding to 2.0–15% of total cell population) expressing the other three splice forms showed cell surface expression of the NR1 molecules (Fig.3K). The proportion of cells having the NR1 molecules on the cell surface was statistically different among the NR1–2b, NR1–3b, and NR1–4b subunits (NR1–2b, NR1–3b, NR1–4b, one-way ANOVA; F = 39.35; p < 0.004; NR1–2bmyc, NR1–3bmyc, NR1–4bmyc, F = 24.8;p < 0.001). A similar amount of the NR1 protein was detected in samples from cells transfected with different splice variants by immunoblotting (Fig.4A–C). This result shows that the differential cell surface expression cannot be explained by the differential amount of the expressed proteins.
Fig. 4.

SDS-PAGE analysis of the amount of NR1 molecules.A–C, The amount of NR1 proteins in 3T3 cells transfected with NR1 splice variants NR1–1b (lane 1), NR1–2b (lane 2), NR1–3b (lane 3), NR1–4b (lane 4), and their myc-tagged derivatives. Total proteins were solubilized in sample buffer and detected with anti-NR1 antibody (A) or anti-myc antibody (B). Anti-NR1 antibody detects 120 kDa NR1 polypeptides in cells transfected with authentic NR1 splice forms and their myc-tagged derivatives. Anti-myc antibody specifically detects 120 kDa proteins in cells transfected with myc-tagged NR1 splice variants. The similar amount of proteins loaded on the gel was confirmed by blotting using anti-tubulin antibody (C). Arrowheads indicate the positions of molecular weight markers (120, 90, 48, and 35 kDa).Lane B in A shows the electrophoretic mobility of native NR1 molecules immunoprecipitated from brain extract.D, E, The amount of NR1 protein in 3T3 cells transfected with NR1 splice variants NR1–1b, NR1–2b, NR1–3b, and NR1–4b together with NR2B. Cells were maintained for 2 d with or without NMDA receptor antagonist d,l-APV, and total proteins were extracted in sample buffer. The amount of NR1 protein in cells maintained with d,l-APV was higher than that in cells maintained without NMDA antagonist. A similar amount of NR1 protein was detected among different splice variants in the presence of d,l-APV (D). The similar amount of proteins loaded on the gel was confirmed by blotting using anti-tubulin antibody (E). F, The amount of NR1 protein in COS7 cells infected with recombinant adenoviruses. Infected cells were maintained for 2 d after viral infection, and total proteins were extracted in sample buffer. Blotting using anti-NR1 antibody and anti-myc antibody revealed similar amounts of NR1–1bmyc (lane 1) and NR1–4bmyc (lane 4). Arrowheads indicate the positions of molecular weight markers (120, 90, 48, and 35 kDa).
Interaction between NR1 splice variants
To see how different splice variants interact with each other in a single cell, 3T3 cells were cotransfected with either NR1–1a plus NR1–2amyc or NR1–4b plus NR1–1bmyc, and the distributions of myc-tagged splice forms were examined. When NR1–2amyc was coexpressed with NR1–1a, NR1–2amyc molecules formed distinct receptor-rich domains and were colocalized with NR1–1a molecules (Fig.5A,B,E). No subcellular clustering of NR1–2amyc was observed without NR1–1a. This result suggests that NR1 splice variants can interact with each other in the intracellular membrane organelles, because NR1–1a-rich domains are the intracellular structure.
Fig. 5.
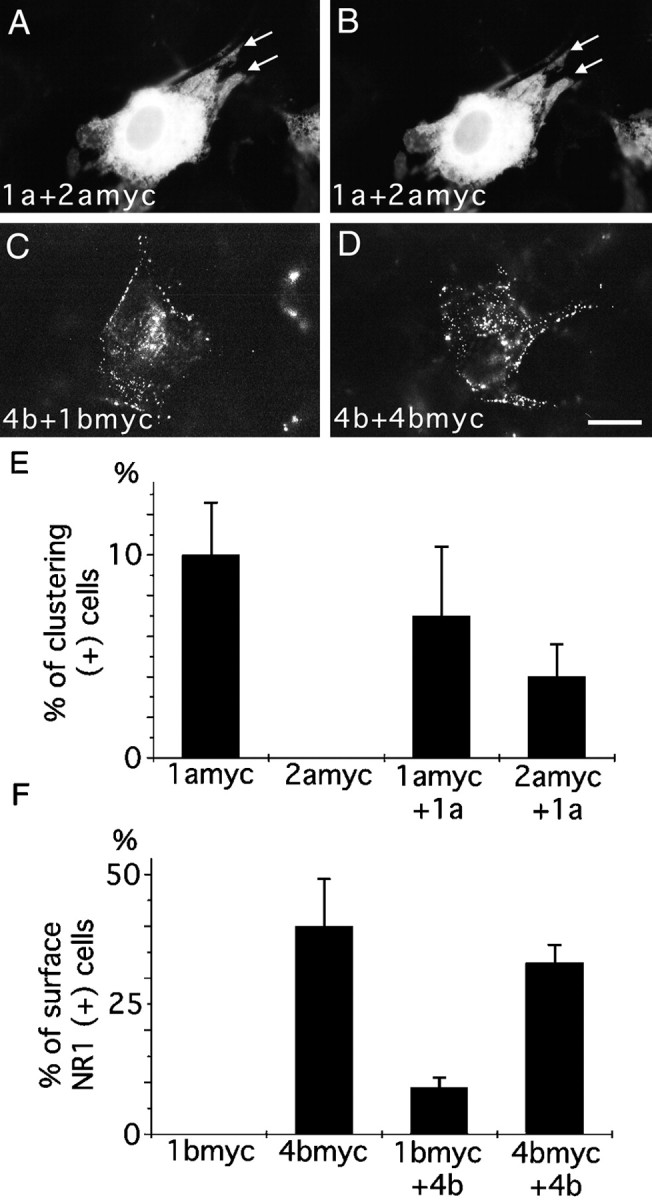
Interaction between NR1 splice variants.A, B, 3T3 cells transfected with NR1–1a and NR1–2amyc and reacted with anti-myc antibody (A) for the detection of NR1–2amyc and with anti-NR1 antibody (B) for the detection of total NR1 molecules. NR1–2amyc was colocalized with NR1–1a to form distinct subcellular domains (arrows in A andB). C, 3T3 cells were transfected with NR1–4b and NR1–1bmyc. NR1–1bmyc molecules were detected by surface staining with anti-myc antibody. Intense surface staining was observed in the presence of NR1–4b. D, 3T3 cells transfected with NR1–4b and NR1–4bmyc. Cell surface NR1–4bmyc molecules were detected by anti-myc antibody. E, Cell counting of 3T3 cells transfected with either NR1–1amyc or NR1–2amyc with or without NR1–1a. Without NR1–1a, no 3T3 cells formed distinct NR1–2a-rich domains. With NR1–1a, NR1–2a-rich domains were observed in >4% of transfected cells. More than 100 cells were counted for each transfection experiment; three independent transfection experiments were performed. F, Cell counting of 3T3 cells transfected with either NR1–1bmyc or NR1–4bmyc with or without NR1–4b. Without NR1–4b, no 3T3 cells transfected with NR1–1bmyc showed cell surface staining with anti-myc antibody. With NR1–4b, NR1–1bmyc was present on the cell surface in 8% of transfected cells. More than 100 transfected cells were examined for each transfection experiment; three independent transfection experiments were performed. Scale bar, 20 μm.
To see whether the coexpression of NR1–4b facilitates the cell surface expression of the NR1–1bmyc, 3T3 cells were cotransfected with NR1–4b and NR1–1bmyc, and the NR1–1bmyc expressed on the surface was detected by anti-myc antibody (Fig. 5C,D). Eight percent of cotransfected cells showed unambiguous surface staining with anti-myc antibody (Fig. 5F). Control cells expressing NR1–1bmyc alone did not show any surface staining. This result suggests that the association of the NR1–1b subunit with the NR1–4b subunit enhances the cell surface expression of NR1–1b molecules.
Enhancement of cell surface expression of NR1 splice variants by NR2B
To see whether the coexpression of NR2 subunits alters the cell surface expression of NR1 splice variants, 3T3 cells were cotransfected with myc-tagged NR1 splice variants and NR2B. After transfection, cells were maintained in a medium containing 1 mmd-2-amino-5-phosphonovaleric acid (d,l-APV) to suppress activation of NMDA receptors by glutamate present in the culture medium (Anegawa et al., 1995; Raymond et al., 1996). Immunoblotting experiments have confirmed that the cells maintained without NMDA antagonists showed reduced amounts of the NR1 protein and that the amount of the NR1 protein in transfected cells was maintained to be similar in the presence ofd,l-APV (Fig.4D,E).
The presence of NR2B significantly enhanced the cell surface expression of myc-tagged NR1–1b molecules (Fig.6A–D). The counting of immunostained cells confirmed that the proportion of cells having myc-tagged NR1–1b molecules on the cell surface increased up to 6.7% of the transfected cells in the presence of NR2B (Fig.6E). The coexpression of NR2B also enhanced the proportion of cells showing surface staining of NR1–2bmyc (t test; p < 0.05) but not that of NR1–3bmyc and NR1–4bmyc (NR1–3bmyc, t test;p = 0.17; NR1–4bmyc, p = 0.09). The relative fluorescence intensities of cell surface labeling and the total cellular labeling were measured separately (Fig.6F). The presence of NR2B specifically increased the fluorescence intensity of the cell surface staining of NR1–2bmyc (t test; p < 0.05) but not that of NR1–3bmyc and NR1–4bmyc (NR1–3bmyc, t test;p = 0.12; NR1–4bmyc, p = 0.09). The fluorescence intensity of the total cellular staining was not different among the splice variants (among cells transfected with NR1–1bmyc, NR1–2bmyc, NR1–3bmyc, and NR1–4bmyc plus or minus NR2B, one-way ANOVA; F = 0.328, p = 0.91). Although the coexpression of NR2B enhanced the cell surface expression of NR1–1bmyc and NR1–2bmyc, the differences of the amount of NR1 on the cell surface among splice variants were preserved. There were differences in both the number of cells positive with surface staining (among cells transfected with NR1–1bmyc, NR1–2bmyc, NR1–3bmyc, and NR1–4bmyc plus NR2B, one-way ANOVA; F = 19.68; p< 0.0001) and the intensity of the cell surface staining (among cells transfected with NR1–1bmyc, NR1–2bmyc, NR1–3bmyc, and NR1–4bmyc plus NR2B, one-way ANOVA; F = 10.77, p < 0.001).
Fig. 6.
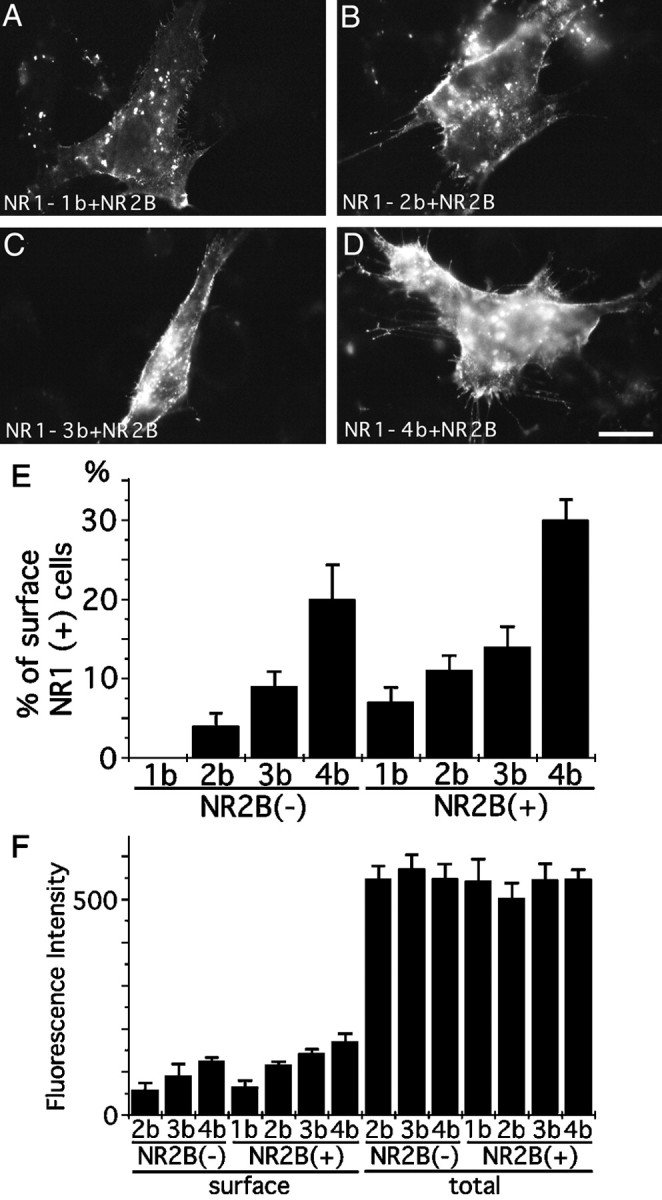
Interaction between NR1 splice variants and NR2B.A–D, 3T3 cells transfected with NR1–1bmyc (A), NR1–2bmyc (B), NR1–3bmyc (C), or NR1–4bmyc (D) together with NR2B. Cell surface myc epitopes were detected by immunofluorescence microscopy. All four NR1 splice variants were detected on the cell surface. E, Cell counting of 3T3 cells having cell surface staining against anti-myc antibody. Cells were transfected with either NR1–1bmyc, NR1–2bmyc, NR1–3bmyc, or NR1–4bmyc with or without NR2B. Without NR2B, no cell surface expression of NR1–1bmyc was observed. Coexpression of NR2B enhanced the surface expression of NR1–1bmyc. More than 100 transfected cells were examined for each transfection experiment; three independent transfection experiments were performed. F, Quantitation of fluorescence intensity of cell surface staining and total cellular staining of 3T3 cells transfected with either NR1–1bmyc, NR1–2bmyc, NR1–3bmyc, or NR1–4bmyc with or without NR2B. Coexpression of NR2B enhanced the amount of NR1–1bmyc and NR1–2bmyc on the cell surface. Similar total cellular staining was observed with or without NR2B. Fluorescence intensities of 25 transfected cells were measured for each transfection experiment. The presented data are derived from a single transfection experiment. Two other independent experiments showed a similar difference of fluorescence intensity. Scale bar, 20 μm.
Correlation between the cell surface expression of NR1 splice variants and the increase of intracellular calcium concentrations after glutamate application
To see whether there is any differences of the amount of calcium influx after glutamate application among 3T3 cells expressing different NR1 splice variants, calcium imaging experiments were performed. 3T3 cells were transfected with each NR1 splice variants together with NR2B and eGFP (Levy et al., 1996). Two different molar ratios (1:1 and 1:16) of NR1 and NR2B plasmids were chosen for transfection experiments. Fluorescent signals from eGFP were first visualized to confirm the similar number of transfected cells per microscopic field, and the intracellular calcium concentrations of eGFP positive cells were measured before and after application of 10 μml-glutamate (Fig. 7). Figure8, A and B, shows the summary of calcium imaging experiments. At the ratio of 1:1 of NR1 to NR2B, increases of calcium concentrations were highest with NR1–4b and lowest with NR1–1b. The other two variants showed the value intermediate between NR1–4b and NR1–1b. By reducing the ratio to 1:16, the difference between NR1–4b and other three variants increased. The differences of the increases of calcium concentration among splice variants were statistically significant (ratio of 1:1, one-way ANOVA; F = 4.14; p < 0.01; ratio of 1:16, F = 13.91; p < 0.000001). It is likely that the amount of NR1 molecules on the cell surface becomes a limiting factor for the amount of functional receptor complex when the ratio of NR1 to NR2B is reduced. Significant reduction of calcium influx with NR1–1b, NR1–2b, and NR1–3b variants at the lower NR1/NR2B ratio supports the idea that NR1–4b variant is most efficiently expressed on the cell surface.
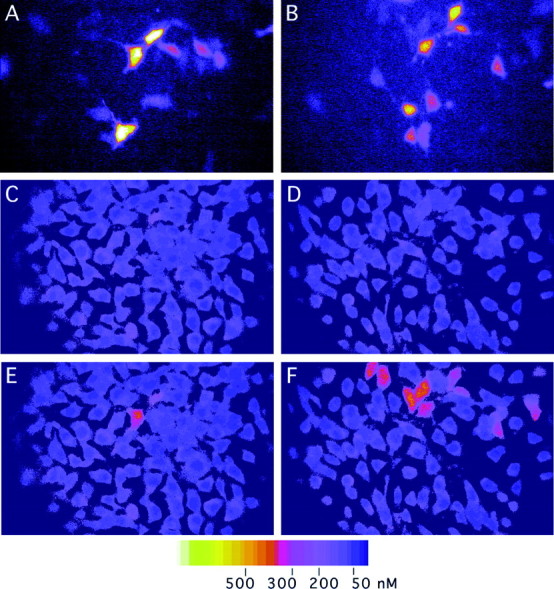
Fig. 8.
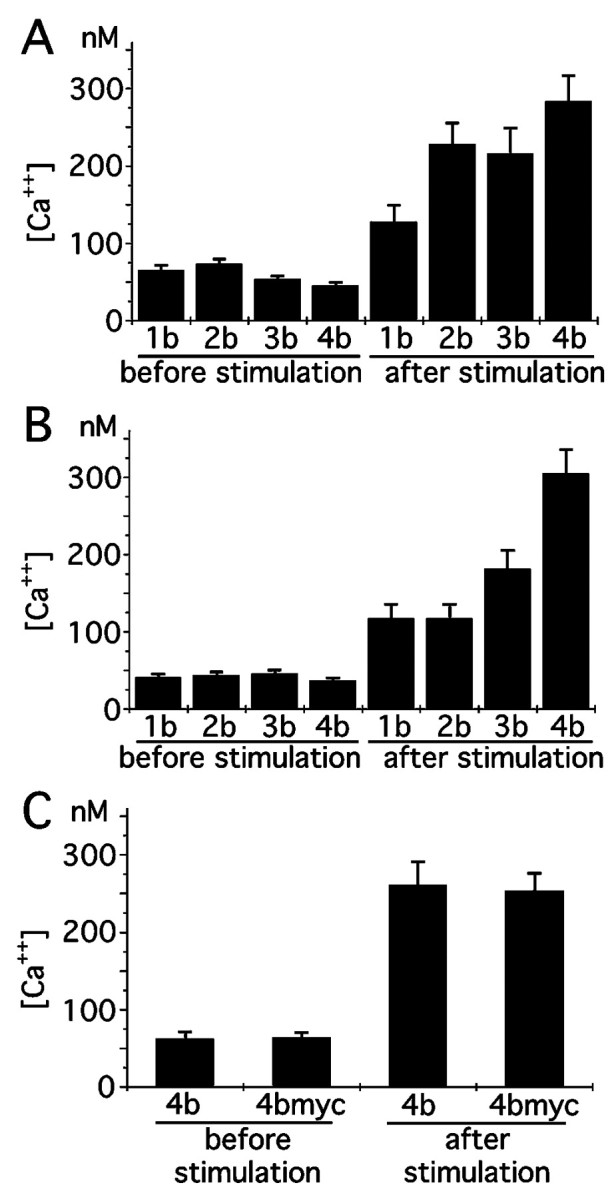
Quantitation of calcium increase in 3T3 cells expressing NR1 splice variants and NR2B after glutamate application.A, B, Intracellular calcium concentration before and after 10 μm glutamate application. NR1 splice variants and NR2B were transfected at the molar ratio of 1:1 (A) and 1:16 (B). 3T3 cells positive with eGFP fluorescence were selected, and the calcium concentrations were determined and averaged. The result is the summary of two independent transfection experiments. Three culture dishes for each splice variant were examined in each transfection experiment. Transfected cells (10–20) were measured in each culture dish.C, Similar increase of intracellular calcium after 10 μm glutamate application in 3T3 cells transfected with either NR1–4b or NR1–4bmyc together with NR2B. The result is the summary of two independent transfection experiments. Four culture dishes were examined for either NR1–4b or NR1–4bmyc. Transfected cells (10–20) were measured in each culture dish.
Increases of calcium concentrations in cells transfected with NR1–4bmyc were also measured and found to be similar to the value of native NR1–4b molecules, suggesting that NR1–4bmyc forms functional NMDA receptors in combination with NR2B (Fig. 8C).
Cell surface expression of myc-tagged NR1–1b and NR1–4b in COS7 cells and PC12 cells
We generated recombinant adenovirus to express myc-tagged NR1–1b and NR1–4b in various cell types. When COS7 cells (kidney fibroblast-like cells) were infected with recombinant adenoviruses at the same multiplicity of infection, similar amounts of NR1–1bmyc and NR1–4bmyc proteins were detected by immunoblotting (Fig.4F). We next examined the subcellular distribution of NR1–1bmyc and NR1–4bmyc in COS7 cells and PC12 cells (rat pheochromocytoma cell line). In both cell types, we could detect cell surface expression of NR1–4bmyc molecules. However, there were few NR1–1bmyc molecules on the surface of infected cells (Fig.9). This result indicates that differential cell surface expression of NR1 splice forms takes place in a variety of cell types and is not a particular phenomenon in specific cell types. Figure 9, A and B, shows a COS7 cell having discrete subcellular domain of NR1–1bmyc without detectable cell surface expression. This further supports the notion that the NR1–1b clusters are not on the cell surface.
Fig. 9.
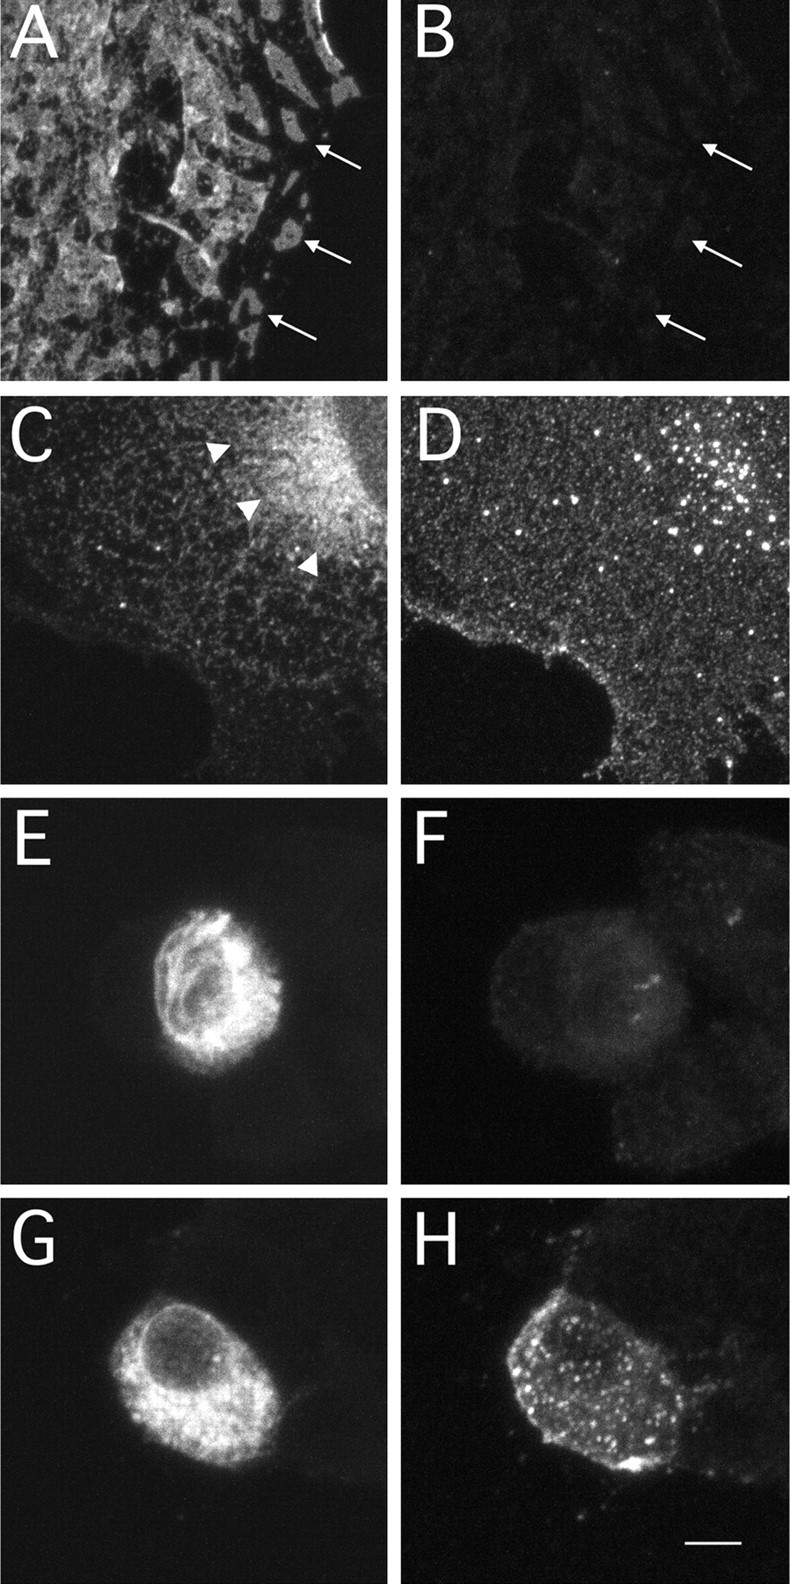
Cell surface expression of NR1–1bmyc and NR1–4bmyc in COS7 cells and PC12 cells. A,B, A COS7 cell expressing myc-tagged NR1–1b molecules using recombinant adenoviruses. Total NR1–1bmyc molecules (A) and molecules expressed on the cell surface (B) were detected by anti-myc antibody and fluorescein- or Cy3-conjugated secondary antibody in COS7 cells. Distinct subcellular domains of NR1–1bmyc molecules were observed (arrows in A), but there were few molecules on the cell surface (B).C, D, A COS7 cell expressing myc-tagged NR1–4b molecules using recombinant adenoviruses. Total NR1–4bmyc staining revealed diffuse intracellular distribution (C). Arrowheads inC indicate the region of strong perinuclear staining. Cells expressing NR1–4bmyc showed strong cell surface expression (D). E, F, A PC12 cell expressing myc-tagged NR1–1bmyc molecules using recombinant adenoviruses. Cells expressing NR1–1bmyc did not show cell surface staining (F), even in the presence of abundant total cellular NR1–1bmyc (E). G,H, A PC12 cell expressing myc-tagged NR1–4b. Cells expressing NR1–4bmyc showed both strong cell surface staining (H) and total cellular staining (G). Scale bar: A–D, 7 μm;E–H, 5 μm.
Cell surface expression of myc-tagged NR1–1b and NR1–4b in primary hippocampal neurons
To evaluate the function of the C-terminal domain of NR1 molecules in a native environment, we expressed myc-tagged NR1 splice variants NR1–1b and NR1–4b in primary neurons using recombinant adenoviruses. Hippocampal neurons were maintained more than 2 weeks in culture before infection. Both NR1–1bmyc and NR1–4bmyc were selectively localized to the cell body and dendrites of infected neurons, but they were not localized to the axon (data not shown). Intracellular distribution of NR1–1bmyc and NR1–4bmyc was diffuse, and no large distinct subcellular domains were detected in cells expressing myc-tagged NR1 (Fig.10B,E).
Fig. 10.

Cell surface expression of NR1–1bmyc and NR1–4bmyc molecules in primary hippocampal neurons.A–C, A hippocampal neuron expressing NR1–1bmyc using recombinant adenoviruses. A, Cell surface staining detected by Cy3-conjugated secondary antibody. B, Total NR1–1bmyc staining detected by FITC-conjugated secondary antibody in the same dendrite. C, The superimposed image ofA and B. Diffuse intracellular staining and punctate cell surface staining of NR1–1bmyc were observed.D–F, A hippocampal neuron expressing NR1–4bmyc using recombinant adenoviruses. D, Cell surface staining.E, Total NR1–4bmyc staining. F, The superimposed image of D and E. The amount of NR1–4bmyc molecules on the cell surface is higher than that of NR1–1bmyc. G–L, Colocalization of cell surface NR1–4bmyc puncta and synaptophysin immunoreactivity. G,J, Cell surface staining using anti-myc antibody of distal (G) and proximal (J) dendrites. H,K, Anti-synaptophysin staining of the same dendrites.I, L, The superimposed image ofG and H, or J andK, respectively. NR1–4bmyc-positive puncta were in apposition to the presynaptic structure detected by anti-synaptophysin antibody (arrows). M, N, Fluorescence quantitation of hippocampal neurons. M, Fluorescence intensity (Cy3 fluorescence for cell surface NR1 and FITC fluorescence for total NR1) within a region of 50 μm2 was measured from 20 randomly selected neurons expressing myc-tagged NR1–1b or NR1–4b. The differences between NR1–1b and NR1–4b were significant for surface staining (t test; p < 0.005) but not for total staining (t test; p > 0.05).N, Fluorescence intensity ratio (cell surface NR1/total NR1) calculated from the data shown in M. Scale bar:A–F, 10 μm; G–L, 5 μm.
We examined cell surface expression of NR1–1bmyc and NR1–4bmyc by reacting live neurons with anti-myc antibody. Detectable amounts of NR1–1bmyc and NR1–4bmyc molecules were present on the cell surface, and the staining pattern was punctate on the cell body and the dendrites (Fig. 10A–F). Colocalization of cell surface NR1 clusters and presynaptic structure was examined by double immunofluorescence microscopy. Sixty-two percent of NR1–4bmyc-positive puncta were in apposition to presynaptic structure detected by anti-synaptophysin immunoreactivity (Fig.10G–L, 10 dendritic segments of 10 neurons counted). Nonsynaptic clusters of NR1–1bmyc or NR1–4bmyc were also evident. Similar nonsynaptic clusters of native NR1 molecules were reported previously (Rao and Craig, 1997). To estimate the efficiency of the surface expression of the myc-tagged NR1, cell surface myc-tagged NR1 and total myc-tagged NR1 were labeled with different chromophores and the fluorescence intensities were quantitated separately. Figure10M shows that the density of cell surface NR1–4bmyc is significantly higher than that of cell surface NR1–1bmyc (t test; p < 0.01), despite the slightly lower expression level of total NR1–4bmyc in infected cells. We calculated the ratio of fluorescence intensity between cell surface and total myc-tagged NR1 (Fig. 10N) and found that the difference between splice variants was significant (t test;p < 0.001). This experiment suggests that the efficiency of the NR1–4b splice form to be expressed on the cell surface is higher than that of the NR1–1b splice form in the native environment of the primary neurons.
DISCUSSION
This study shows that the splicing of the C-terminal domain of the NR1 subunit plays an important role on the cell surface expression of the NMDA receptor complex. This differential cell surface expression was also modulated by the coexpression of NR2 subunits.
Regulated cell surface expression of NR1 splice variants
A previous study has shown that the presence of NR2A is necessary for the efficient cell surface expression of the NR1–1a subunit (McIlhinney et al., 1996). This observation is consistent with the acetylcholine receptor expression on the cell surface in which the cell surface expression requires all four principal subunits (Gu et al., 1991). However, the present study indicates that the requirement of both NR1 and NR2 subunits holds true only in the case of the NR1–1 splice variants and that the other three C-terminal splice forms can be expressed on the cell surface without NR2. Acetylcholine receptor and NMDA receptors have different membrane topology, and the regulation of intracellular processing and sorting might differ substantially. In this sense, AMPA–kainate receptors have similar membrane topology with NMDA receptors, and single subunits of AMPA receptors are expressed on the cell surface and correctly oriented in the plasma membrane (Verdoorn et al., 1991; Hall et al., 1997). This suggests that the family of ionotropic glutamate receptors can be expressed on the cell surface as single subunits in general, with the exception of the NR1–1 splice form.
The mechanism of the retention of the NR1–1 splice form within the cell is currently unknown. In the case of the shaker (Kv1) α subunit of K+ channels, the association of the Kvβ2 subunit with the N-terminal cytoplasmic domain of the Kv1 α chain enhances cell surface expression of the channel complex (Shi et al., 1996). The effect of the Kvβ2 subunit is interpreted to enhance proper folding of the N-terminal domain of the Kv1 α subunit. The NR1–1 has the longest C-terminal cytoplasmic domain among the four C-terminal splice variants, and the correct folding of this largest cytoplasmic tail might require the association of NR2 subunits or other NR1 splice variants. The observation that the coexpression of NR1–4b or NR2B resulted in the appearance of NR1–1 on the cell surface supports this view.
Another possibility is that the interaction of cytoplasmic proteins with the domain of the C1 or C2 exon cassette inhibits proper cell surface sorting of NR1 splice variants. Several proteins are identified as interacting with specific sequences in the C-terminal tail of the NR1 subunit. Among these, a recently cloned cytoplasmic protein, yotiao, specifically interacts with the region corresponding to the C1 exon cassette (Lin et al., 1998). Another protein that interacts with the region of the C1 exon cassette is the neurofilament L protein (NF-L) (Ehlers et al., 1998). Because yotiao is a protein containing many putative coiled-coil domains and the interaction of NF-L to NR1 is mediated by the coiled-coil domain of NF-L, it is likely that the region of the C1 exon cassette preferentially associates with the coiled-coil motif of several proteins. It is possible that one of these proteins has a higher affinity for the C-terminal domain of the NR1–1 splice variant and inhibits the proper sorting of the NR1–1. This hypothesis could explain the formation of receptor-rich intracellular domains in NR1–1 transfected cells by possible cross-linking of NR1–1 with the associated proteins (Ehlers et al., 1995).
Regulated calcium influx by the C-terminal splicing of the NR1 subunit
In the presence of NR2B subunit, all the C-terminal splice variants of NR1 were expressed on the cell surface and formed functional NMDA receptors. The cell counting and fluorescence measurement analyses indicate that there was still a difference in the amount of cell surface NR1 subunits among splice variants. The order of the amount of NR1 on the surface was estimated to be NR1–1 < NR1–2 and NR1–3 < NR1–4. It is likely that the difference of NR1 splice forms on the cell surface regulates the amount of functional NMDA receptor complex, because the calcium imaging experiments showed that the difference of the calcium increase was also in the order of NR1–1 < NR1–2 and NR1–3 < NR1–4.
NMDA receptor is inactivated by intracellular calcium (Legendre et al., 1993), and this inactivation is regulated by the binding of Ca2+–calmodulin to the C-terminal domain of the NR1 subunit (Ehlers et al., 1996). Because one of the binding site of Ca2+–calmodulin is localized within the alternatively spliced C1 exon cassette, it is possible that NR1 splice variants containing the C1 exon cassette (NR1–1 and NR1–3) are specifically sensitive to this type of inactivation. In this sense, it is possible that our Ca2+ imaging experiments underestimated the amount of functional receptors containing NR1–1 and NR1–3. However, when the comparison was made within splice forms having C1 exon cassette (between NR1–1 and NR1–3) or within splice forms lacking C1 exon cassette (between NR1–2 and NR1–4), there still remained substantial differences in the Ca2+ increase. These differences still hold a positive correlation with the amount of the surface NR1 subunits. Furthermore, recent studies have shown that C1 exon cassette is not a critical region for Ca2+-dependent inactivation (Zang et al., 1998; Krupp et al., 1999). Therefore, we conclude that differential efficiency of cell surface expression of NR1 splice forms is one of the critical factors regulating the amount of Ca2+ influx by glutamate stimulation.
Biological roles of the C-terminal splicing of the NR1 subunit
We observed differential cell surface expression of NR1 splice variants when NR1–1bmyc and NR1–4bmyc were expressed in primary hippocampal neurons using recombinant adenoviruses. Cell surface NR1 molecules were correctly sorted to the synaptic sites. This result was consistent with a previous report using HA-tagged NR1 molecules expressed in hippocampal neurons (Lissin et al., 1998). It is likely that the C-terminal splicing of NR1 molecules regulates cell surface expression of NMDA receptor complex in a native environment.
Studies using probes and antibodies specific to the C-terminal exon cassettes have shown that the expression of each splice variant follows a complex spatiotemporal pattern (Tolle et al., 1993, 1995; Laurie and Seeburg, 1994; Laurie et al., 1995). A recent immunohistochemical study has shown that nNOS-positive neurons in the forebrain lack the immunoreactivity for the C1 exon cassette and are selectively positive for the antibody against the C2′ exon cassette (Weiss et al., 1998). This result indicates that nNOS-positive neurons are enriched with the NR1–4 splice variant and lack the NR1–1 and NR1–3 splice variants. The present study predicts that nNOS-positive neurons have a higher density of NMDA receptors on their surface and are likely to be more sensitive to glutamate. Because glutamate acting through NMDA receptors is one of the most potent activators of nNOS (Iadecola, 1997), a higher sensitivity of nNOS-positive neurons to glutamate should have an important role in the nitric oxide-mediated signaling system.
Our experiments have revealed that the presence of NR2B subunit attenuates the difference of the amount of cell surface receptors among splice variants. In this sense, it is likely that neurons expressing less amounts of NR2 subunits are more sensitive to the differential composition of NR1 splice forms. Previous studies have shown that certain populations of spinal cord neurons contain very low amount of transcripts for NR2 subunits (Tolle et al., 1993, 1995). Interestingly, these neurons express higher amount of NR1–2 and NR1–4 splice forms. It is possible that the preferential expression of NR1–2 and NR1–4 splice forms compensates the low amount of NR2 molecules in these neurons and facilitates sorting of functional NMDA receptors to the cell surface.
Iwasato et al. (1997) have reported that the expression of the NR1–1a splice form can rescue the lethal phenotype of NR1 null mice. Rescued mice were not completely healthy and became wasted and spastic with age, suggesting the deteriorative effects of lacking other splice forms of NR1. Mice expressing only the NR1–1a splice form showed a normal ratio of NMDA and AMPA responses in cortical neurons. The present study predicts less NMDA response in neurons containing only NR1–1a subunits. The reason for this discrepancy is not clear at present. One possibility is that the density of NMDA receptors at the synaptic site is controlled by additional cellular mechanisms. Another possibility is that a major NR1 splice form in cortical neurons is indeed NR1–1. A previous direct cloning study has suggested that NR1–1a and NR1–1b are major NR1 splice forms in the forebrain (Sugihara et al., 1992).
In this study, the cell surface expression of NMDA receptors was analyzed in both non-neuronal and neuronal cells. The results suggest that the splicing of the C-terminal domain of the NR1 subunit regulates the cell surface expression. Further analysis of the cell surface sorting and retrieval of the NMDA receptor complex in neuronal cells may shed light on the cellular mechanisms of the formation and maintenance of the excitatory synapses in the CNS.
Footnotes
This work was supported by Special Coordination Funds of the Science and Technology Agency of the Japanese Government. We thank Dr. Michael Hollmann for providing NMDA NR1 cDNAs, Dr. Stephen Heinemann for NMDA NR2B cDNA, and Drs. Yumi Kanegae and Izumu Saito for providing materials for constructing recombinant adenoviruses.
Correspondence should be addressed to Shigeo Okabe, Department of Anatomy and Cell Biology, School of Medicine, Tokyo Medical and Dental University, 1–5-45, Yushima, Bunkyo-ku, Tokyo, 113–8519, Japan.
REFERENCES
- 1.Anegawa NJ, Lynch DR, Verdoorn TA, Pritchett DB. Transfection of N-methyl-d-aspartate receptors in a nonneuronal cell line leads to cell death. J Neurochem. 1995;64:2004–2012. doi: 10.1046/j.1471-4159.1995.64052004.x. [DOI] [PubMed] [Google Scholar]
- 2.Brose N, Huntley GW, Stern-Bach Y, Sharma G, Morrison JH, Heinemann S. Differential assembly of coexpressed glutamate receptor subunits in neurons of rat cerebral cortex. J Biol Chem. 1994;269:16780–16784. [PubMed] [Google Scholar]
- 3.Ehlers MD, Tingley WG, Huganir RL. Regulated subcellular distribution of the NR1 subunit of the NMDA receptor. Science. 1995;269:1734–1737. doi: 10.1126/science.7569904. [DOI] [PubMed] [Google Scholar]
- 4.Ehlers MD, Zhang S, Bernhadt JP, Huganir RL. Inactivation of NMDA receptors by direct interaction of calmodulin with the NR1 subunit. Cell. 1996;84:745–755. doi: 10.1016/s0092-8674(00)81052-1. [DOI] [PubMed] [Google Scholar]
- 5.Ehlers MD, Fung ET, O’Brien RJ, Huganir RL. Splice variant-specific interaction of the NMDA receptor subunit NR1 with neuronal intermediate filaments. J Neurosci. 1998;18:720–730. doi: 10.1523/JNEUROSCI.18-02-00720.1998. [DOI] [PMC free article] [PubMed] [Google Scholar]
- 6.Grynkiewicz G, Poenie M, Tsien RY. A new generation of indicators with greatly improved fluorescence properties. J Biol Chem. 1985;260:3440–3450. [PubMed] [Google Scholar]
- 7.Gu Y, Forsayeth JR, Verrall S, Yu XM, Hall ZW. Assembly of the mammalian muscle acetylcholine receptor in transfected COS cells. J Cell Biol. 1991;114:799–807. doi: 10.1083/jcb.114.4.799. [DOI] [PMC free article] [PubMed] [Google Scholar]
- 8.Hall RA, Soderling TR. Differential surface expression and phosphorylation of the N-methyl-d-aspartate receptor subunits NR1 and NR2 in cultured hippocampal neurons. J Biol Chem. 1997;272:4135–4140. doi: 10.1074/jbc.272.7.4135. [DOI] [PubMed] [Google Scholar]
- 9.Hall RA, Hansen A, Andersen PH, Soderling TR. Surface expression of the AMPA receptor subunits GluR1, GluR2, and GluR4 in stably transfected baby hamster kidney cells. J Neurochem. 1997;68:625–630. doi: 10.1046/j.1471-4159.1997.68020625.x. [DOI] [PubMed] [Google Scholar]
- 10.Hirai H, Kirsch J, Laube B, Betz H, Kuhse J. The glycine binding site of the N-methyl-d-aspartate receptor subunit NR1: identification of novel determinants of co-agonist potentiation in the extracellular M3–M4 loop region. Proc Natl Acad Sci USA. 1996;93:6031–6036. doi: 10.1073/pnas.93.12.6031. [DOI] [PMC free article] [PubMed] [Google Scholar]
- 11.Hollmann M, Boulter J, Maron C, Beasley L, Sullivan J, Pecht G, Heinemann S. Zinc potentiates agonist-induced currents at certain splice variants of the NMDA receptor. Neuron. 1993;10:943–954. doi: 10.1016/0896-6273(93)90209-a. [DOI] [PubMed] [Google Scholar]
- 12.Hollmann M, Maron C, Heinemann S. N-glycosylation site tagging suggests a three transmembrane domain topology for the glutamate receptor GluR1. Neuron. 1994;13:1331–1343. doi: 10.1016/0896-6273(94)90419-7. [DOI] [PubMed] [Google Scholar]
- 13.Iadecola C. Bright and dark side of nitric oxide in ischemic brain injury. Trends Neurosci. 1997;20:132–139. doi: 10.1016/s0166-2236(96)10074-6. [DOI] [PubMed] [Google Scholar]
- 14.Iwasato T, Erzurumlu RS, Huerta PT, Chen DF, Sasaoka T, Ulupinar E, Tonegawa S. NMDA receptor-dependent refinement of somatotopic maps. Neuron. 1997;19:1201–1210. doi: 10.1016/s0896-6273(00)80412-2. [DOI] [PubMed] [Google Scholar]
- 15.Kanegae Y, Makimura M, Saito I. A simple and efficient method for purification of infectious recombinant adenovirus. Jpn J Med Sci Biol. 1994;47:157–166. doi: 10.7883/yoken1952.47.157. [DOI] [PubMed] [Google Scholar]
- 16.Kanegae Y, Lee G, Sato Y, Tanaka M, Nakai M, Sakaki T, Sugano S, Saito I. Efficient gene activation in mammalian cells by using recombinant adenovirus expressing site-specific Cre recombinase. Nucleic Acids Res. 1995;23:3816–3821. doi: 10.1093/nar/23.19.3816. [DOI] [PMC free article] [PubMed] [Google Scholar]
- 17.Kim E, Cho KO, Rothschild A, Sheng M. Heteromultimerization and NMDA receptor-clustering activity of Chapsyn-110, a member of the PSD-95 family of proteins. Neuron. 1996;17:103–113. doi: 10.1016/s0896-6273(00)80284-6. [DOI] [PubMed] [Google Scholar]
- 18.Kornau HC, Schenker LT, Kennedy MB, Seeburg PH. Domain interaction between NMDA receptor subunits and the postsynaptic density protein PSD-95. Science. 1995;269:1737–1740. doi: 10.1126/science.7569905. [DOI] [PubMed] [Google Scholar]
- 19.Krupp JJ, Vissel B, Thomas CG, Heinemann SF, Westbrook GL. Interaction of calmodulin and α-actinin with the NR1 subunit modulate Ca2+-dependent inactivation of NMDA receptors. J Neurosci. 1999;19:1165–1178. doi: 10.1523/JNEUROSCI.19-04-01165.1999. [DOI] [PMC free article] [PubMed] [Google Scholar]
- 20.Kutsuwada T, Kashiwabuchi N, Mori H, Sakimura K, Kushiya E, Arai K, Meguro H, Masaki H, Kumanishi T, Arakawa M, Mishina M. Molecular diversity of the NMDA receptor channel. Nature. 1992;358:36–41. doi: 10.1038/358036a0. [DOI] [PubMed] [Google Scholar]
- 21.Laurie DJ, Seeburg PH. Regional and developmental heterogeneity in splicing of the rat brain NMDAR1 mRNA. J Neurosci. 1994;14:3180–3194. doi: 10.1523/JNEUROSCI.14-05-03180.1994. [DOI] [PMC free article] [PubMed] [Google Scholar]
- 22.Laurie DJ, Putzke J, Zieglgansberger W, Seeburg PH, Tolle TR. The distribution of splice variants of the NMDAR1 subunit mRNA in adult rat brain. Brain Res Mol Brain Res. 1995;32:94–108. doi: 10.1016/0169-328x(95)00067-3. [DOI] [PubMed] [Google Scholar]
- 23.Legendre P, Rosenmund C, Westbrook GL. Inactivation of NMDA channels in cultured hippocampal neurons by intracellular calcium. J Neurosci. 1993;13:674–684. doi: 10.1523/JNEUROSCI.13-02-00674.1993. [DOI] [PMC free article] [PubMed] [Google Scholar]
- 24.Levy JP, Muldoon S, Zolotukin S, Link CJ. Retroviral transfer and expression of humanized, red shifted green fluorescent protein into human tumor cells. Nat Biotechnol. 1996;14:610–614. doi: 10.1038/nbt0596-610. [DOI] [PubMed] [Google Scholar]
- 25.Lin JW, Wyszynski M, Madhavan R, Sealock R, Kim JU, Sheng M. Yotiao, a novel protein of neuromuscular junction and brain that interacts with specific splice variants of NMDA receptor subunit NR1. J Neurosci. 1998;18:2017–2027. doi: 10.1523/JNEUROSCI.18-06-02017.1998. [DOI] [PMC free article] [PubMed] [Google Scholar]
- 26.Lissin DV, Gomperts SN, Carroll RC, Christine CW, Kalman D, Kitamura M, Hardy S, Nicoll RA, Malenka RC, von Zastrow M. Activity differentially regulates the surface expression of synaptic AMPA and NMDA glutamate receptors. Proc Natl Acad Sci USA. 1998;95:7097–7102. doi: 10.1073/pnas.95.12.7097. [DOI] [PMC free article] [PubMed] [Google Scholar]
- 27.McIlhinney RA, Molnar E, Atack JR, Whiting PJ. Cell surface expression of the human N-methyl-d-aspartate receptor subunit 1a requires the co-expression of the NR2A subunit in transfected cells. Neuroscience. 1996;70:989–997. doi: 10.1016/0306-4522(95)00419-x. [DOI] [PubMed] [Google Scholar]
- 28.Miyake S, Makimura M, Kanegae Y, Harada S, Sato Y, Takamori K, Tokuda C, Saito I. Efficient generation of recombinant adenoviruses using adenovirus DNA- terminal protein complex and a cosmid bearing the full-length virus genome. Proc Natl Acad Sci USA. 1996;93:1320–1324. doi: 10.1073/pnas.93.3.1320. [DOI] [PMC free article] [PubMed] [Google Scholar]
- 29.Monyer H, Burnashev N, Laurie DJ, Sakmann B, Seeburg PH. Developmental and regional expression in the rat brain and functional properties of four NMDA receptors. Neuron. 1994;12:529–540. doi: 10.1016/0896-6273(94)90210-0. [DOI] [PubMed] [Google Scholar]
- 30.Moriyoshi K, Masu M, Ishii T, Shigemoto R, Mizuno N, Nakanishi S. Molecular cloning and characterization of the rat NMDA receptor. Nature. 1991;354:31–37. doi: 10.1038/354031a0. [DOI] [PubMed] [Google Scholar]
- 31.Nakanishi S. Molecular diversity of glutamate receptors and implications for brain function. Science. 1992;258:597–603. doi: 10.1126/science.1329206. [DOI] [PubMed] [Google Scholar]
- 32.Okabe S, Collin C, Auerbach JM, Meiri N, Bengzon J, Kennedy MB, Segal M, McKay RDG. Hippocampal synaptic plasticity in mice overexpressing an embryonic subunit of the NMDA receptor. J Neurosci. 1998a;18:4177–4188. doi: 10.1523/JNEUROSCI.18-11-04177.1998. [DOI] [PMC free article] [PubMed] [Google Scholar]
- 33.Okabe S, Vicario-Abejon C, Segal M, McKay RDG. Survival and synaptogenesis of hippocampal neurons without NMDA receptor function in culture. Eur J Neurosci. 1998b;10:2192–2198. doi: 10.1046/j.1460-9568.1998.00233.x. [DOI] [PubMed] [Google Scholar]
- 34.Rao A, Craig AM. Activity regulates the synaptic localization of the NMDA receptor in hippocampal neurons. Neuron. 1997;19:801–812. doi: 10.1016/s0896-6273(00)80962-9. [DOI] [PubMed] [Google Scholar]
- 35.Raymond LA, Moshaver A, Tingley WG, Huganir RL. Glutamate receptor ion channel properties predict vulnerability to cytotoxicity in a transfected nonneuronal cell line. Mol Cell Neurosci. 1996;7:102–115. doi: 10.1006/mcne.1996.0008. [DOI] [PubMed] [Google Scholar]
- 36.Shi G, Nakahira K, Hammond S, Rhodes KJ, Schechter LE, Trimmer JS. β subunits promote K+ channel surface expression through effects early in biosynthesis. Neuron. 1996;16:843–852. doi: 10.1016/s0896-6273(00)80104-x. [DOI] [PubMed] [Google Scholar]
- 37.Sugihara H, Moriyoshi K, Ishii T, Masu M, Nakanishi S. Structures and properties of seven isoforms of the NMDA receptor generated by alternative splicing. Biochem Biophys Res Commun. 1992;185:826–832. doi: 10.1016/0006-291x(92)91701-q. [DOI] [PubMed] [Google Scholar]
- 38.Tolle TR, Berthele A, Zieglgansberger W, Seeburg PH, Wisden W. The differential expression of 16 NMDA and non-NMDA receptor subunits in the rat spinal cord and in periaqueductal gray. J Neurosci. 1993;13:5009–5028. doi: 10.1523/JNEUROSCI.13-12-05009.1993. [DOI] [PMC free article] [PubMed] [Google Scholar]
- 39.Tolle TR, Berthele A, Laurie DJ, Seeburg PH, Zieglgansberger W. Cellular and subcellular distribution of NMDAR1 splice variant mRNA in the rat lumbar spinal cord. Eur J Neurosci. 1995;7:1235–1244. doi: 10.1111/j.1460-9568.1995.tb01114.x. [DOI] [PubMed] [Google Scholar]
- 40.Verdoorn TA, Burnashev N, Monyer H, Seeburg PH, Sakmann B. Structural determinants of ion flow through recombinant glutamate receptor channels. Science. 1991;252:1715–1718. doi: 10.1126/science.1710829. [DOI] [PubMed] [Google Scholar]
- 41.Weiss SW, Albers DS, Iadarola MJ, Dawson TM, Dawson VL, Standaert DG. NMDAR1 glutamate receptor subunit isoforms in neostriatal, neocortical, and hippocampal nitric oxide synthase neurons. J Neurosci. 1998;18:1725–1734. doi: 10.1523/JNEUROSCI.18-05-01725.1998. [DOI] [PMC free article] [PubMed] [Google Scholar]
- 42.Wood MW, VanDongen HM, VanDongen AM. Structural conservation of ion conduction pathways in K channels and glutamate receptors. Proc Natl Acad Sci USA. 1995;92:4882–4886. doi: 10.1073/pnas.92.11.4882. [DOI] [PMC free article] [PubMed] [Google Scholar]
- 43.Zang S, Ehlers MD, Bernhardt JP, Su C-T, Huganir RL. Calmodulin mediates calcium-dependent inactivation of N-methyl-d-aspartate receptors. Neuron. 1998;21:443–453. doi: 10.1016/s0896-6273(00)80553-x. [DOI] [PubMed] [Google Scholar]