

Abstract
The ability of calcium (Ca2+) to effect changes in growth cone motility requires remodeling of the actin cytoskeleton. To understand the mechanisms involved, we evaluated the effect of elevated intracellular calcium ([Ca2+]i) on actin bundle dynamics, organization, and retrograde flow in the large growth cones of identified Helisoma neurons. Depolarization with 15 mm KCl (high K+) for 30 min caused a rapid and sustained increase in [Ca2+]i and resulted in longer filopodia, shorter actin ribs, and a decrease in lamellipodia width. Time-lapse microscopy revealed that increasing [Ca2+]i affected actin bundle dynamics differently at the proximal and distal ends. Filopodial lengthening resulted from assembly-driven elongation of actin bundles whereas actin rib shortening resulted from a distal shift in the location of breakage. Buckling of ribs occurred before breakage, suggesting nonuniform forces were applied to ribs before shortening. Calcium (Ca2+) influx also resulted in a decrease in density of F-actin in bundles, as determined by contrast changes in ribs imaged by differential interference contrast microscopy and fluorescent intensity changes in rhodamine-labeled ribs. The velocity of retrograde flow decreased by 50% after elevation of [Ca2+]i. However, no significant change in retrograde flow occurred when the majority of changes in actin bundles were blocked by phalloidin. This suggests that inhibition of retrograde flow resulted from Ca2+-induced changes in the actin cytoskeleton. These results implicate Ca2+ as a regulator of actin dynamics and, as such, provide a mechanism by which Ca2+ can influence growth cone motility and behavior.
Keywords: actin dynamics, filament severing, retrograde flow, growth cone motility, calcium, cytoskeleton, Helisoma
To understand the mechanisms by which growth cones translate guidance information into directed neurite outgrowth requires knowledge of potential intracellular signaling pathways activated by guidance cues and how they affect growth cone motility. Many extracellular guidance cues, including neurotransmitters (Cohan et al., 1987; Mattson and Kater, 1987; Mattson et al., 1988;Zheng et al., 1994; Obrietan and van den Pol, 1996), neural cell adhesion molecules (Doherty and Walsh, 1994; Harper et al., 1994), proteoglycans (Snow et al., 1994), laminin (Kuhn et al., 1998), myelin-associated proteins (Bandtlow et al., 1993), and electric fields (Davenport and McCaig, 1992), use Ca2+signaling to affect growth cone behavior and motility. Depending on the magnitude, duration, and location, changes in [Ca2+]i can elicit a variety of responses from growth cones (for review, see Kater and Mills, 1991; Davenport, 1996; Zheng et al., 1996), including slower advance, faster advance, retraction, collapse, turning, induction of filopodia, filopodial elongation or retraction, and lamellipodial protrusion or retraction. Whereas these investigations have established the role of Ca2+ as a regulator of growth cone motility and behavior, little is known about the cellular mechanisms that underlie the effects of Ca2+ on growth cones.
Growth cone motility depends on the dynamics, organization, and interactions of the microtubule and actin cytoskeleton (Lin et al., 1994; Tanaka and Sabry, 1995). Filopodia are supported by parallel bundles of uniformly oriented actin filaments that extend into the lamellipodium, often ending near the central domain. Between actin bundles, lamellipodia contain a meshwork of filaments that are randomly oriented (Lewis and Bridgman, 1992). F-actin in lamellipodia turns over rapidly as a result of three dynamic processes: assembly, retrograde flow, and disassembly. At the leading edge, continuous F-actin assembly occurs onto the barbed end of filaments (Forscher and Smith, 1988;Okabe and Hirokawa, 1991). The assembled filaments move retrogradely toward the central domain as a result of interactions with myosin (Lin et al., 1996). Recycling of actin subunits occurs near the central domain, where filaments disassemble. Recent models for growth cone motility suggest that protrusive activity at the leading edge is determined by the balance between the rate of assembly and retrograde flow (Welch et al., 1997; Suter and Forscher, 1998).
Previous investigations have established that F-actin is a target of Ca2+ signaling in growth cones. Lankford and Letourneau (1989) showed that sustained Ca2+ elevation in dorsal root ganglion neurons results in retraction. Ultrastructural studies correlated this with a loss of F-actin from the lamellipodial but not filopodial regions of the growth cone. Also, in leech neurons, Ca2+ influx caused by depolarization results in neurite retraction and a loss of F-actin from the distal ends of neurites (Neely and Gesemann, 1994). In both cases, Ca2+-induced neurite retraction is blocked by phalloidin, a drug that stabilizes F-actin. Whereas these studies establish that changes in Ca2+ levels can affect the stability of the actin cytoskeleton, they do not address the mechanism by which the loss of actin filaments occurs nor can they account for Ca2+-stimulated protrusive activity at the leading edge of growth cones.
To understand the cellular mechanisms involved in Ca2+-mediated reorganization of the actin cytoskeleton, we used time-lapse microscopy to assess changes in actin dynamics and organization in identified Helisoma growth cones after elevation of [Ca2+]i.Helisoma neurons form large, axonal growth cones with a prominent radial array of actin bundles. This enabled us to examine actin bundle dynamics at both the proximal and distal ends, and facilitated the measurement of retrograde flow and optical contrast changes in actin bundles. Our study provides the first evidence that Ca2+ can affect actin dynamics in growth cones and also reveals new insight into the mechanism of actin severing.
MATERIALS AND METHODS
Cell culture and media. Identified B19 cell bodies with attached axons were removed from the buccal ganglia ofHelisoma trivalis (Williams and Cohan, 1994) and plated onto polylysine-coated coverslips in a custom-made perfusion chamber (described in Welnhofer et al., 1997). Neurons were incubated at room temperature in defined medium consisting of salt-free Liebowitz L-15 (Gibco, Grand Island, NY) supplemented with (in mm): 40 NaCl, 1.7 KCl, 4.1 CaCl2,1.5 MgCl2, 1 l-glutamine, and 10 HEPES, pH 7.4. For the following experiments, we selected neurons whose growth cones were in the early stage of maturation. This stage occurs ∼3–5 hr after plating when axonal growth cones have reached their final size (Welnhofer et al., 1997).
Stock solutions of cytochalasin B (cyt B) (Sigma, St. Louis, MO) and phalloidin (Sigma) were dissolved in DMSO and methanol, respectively.
Measurement of [Ca2+]i. The cell bodies of B19 neurons were microinjected with fura-2 (pentapotassium salt) (Molecular Probes, Eugene, OR) diluted to 1 mm in 5 mm HEPES, pH 7.1. Fluorescent images of growth cones were obtained on a Nikon-300 inverted microscope equipped with a 100 W mercury lamp, 40× 1.3 NA objective lens, and a 4 or 2.5× projector lens. The epifluorescent light path included a 10% UV transmitting neutral density filter, 340 and 380 nm excitation filters in a computer-controlled optical filter changer and shutter (Lambda 10–2; Sutter Instrument Company, Novato, CA), and a 400 nm dichroic mirror and a 510 nm barrier filter (Omega Optics, Brattleboro, VT). After a 1 sec exposure at 340 and 380 nm, fluorescent images of growth cones were captured on a cooled CCD camera containing a back-illuminated 512 × 512 CCD (TEA/CCD-512; Princeton Instruments, Trenton, NJ) binned to a 3 × 3 array. Background fluorescent images at 340 and 380 nm of regions adjacent to growth cones were subtracted from the growth cone fluorescent images before obtaining the 340:380 ratio image. Using IPLab software (Scanalytics, Fairfax, VA), we controlled image acquisition and camera operation with a Power Macintosh through a nubus interface card (Princeton Instruments).
To calculate the [Ca2+]i, we used the equation of Grynkiewicz et al. (1985). The value for Rwas the mean ratio value in a 5 × 5 pixel region of interest in the central region of the growth cone. The values obtained forRmin,Rmax, andFo/Fs on the microscope system described above were 0.23, 6.16, and 13.42. A viscosity correction factor of 0.67 was included in the calculation for [Ca2+]i based on values for Rmax that were obtained by injecting saturating levels of Ca2+ intoHelisoma neurons. We previously measured theKd for fura-2 to be 95 nm in solutions representative of the cellular ionic environment of Helisoma neurons (Cohan, 1992).
Time-lapse video enhanced differential interference contrast microscopy. To visualize actin rib dynamics, growth cones were imaged using an inverted microscope (Nikon-300 diaphot) equipped with differential interference contrast (DIC) optics, a Plan Apo 100×/1.4 NA objective lens, and a 1.4 NA condenser. For illumination, light from an HBO 100 W arc was passed through a fiber optic scrambler (Technical Video, Woods Hole, MA). To minimize specimen irradiation, a shutter (Uniblitz) was used to limit exposure of neurons to light, and an interference filter (546 nm) was inserted into the light path. Images obtained with a Newvicon camera were digitized with a Perceptics frame grabber controlled by a Power Macintosh. Using IPlab software, time-lapse images were acquired at 10–30 sec intervals and were background-subtracted.
Fluorescent imaging of neurons injected with rhodamine-labeled actin (rh-actin). Rh-actin, prepared as described previously (Welnhofer et al., 1997), was injected into the cell bodies of neurons ∼1 hr before experiments. Fluorescent images of growth cones were obtained with the microscope system consisting of a 100× 1.4 NA objective lens, a 4× projector lens, rhodamine filter cubes, a 10% neutral density filter, a shutter, and a 100 W mercury lamp. Digital images were acquired on a CCD (Princeton Instruments) and binned 2 × 2. Time-lapse images were taken at 30 sec intervals and were background-subtracted.
Phallacidin staining. Specimens were fixed in glutaraldehyde, lysed, and reduced in sodium borohydride as described in Welnhofer et al. (1997). To label F-actin, specimens were incubated with 0.33 μm Bodipy FL phallacidin (Molecular Probes) for 20 min and then washed in PBS. To reduce photobleaching, fluorescently labeled cells were mounted in Slow-Fade Light (Molecular Probes). Specimens were imaged with the fluorescent light microscope system described above, except a fluorescein filter cube and a 25% neutral density filter were inserted into the light path. Fluorescent images were recorded digitally with a CCD camera (1 sec exposure).
Data analysis. All measurements were made using IPLab Spectrum image analysis software. Filopodia lengths were measured from the edge of the lamellipodia to the distal edge of the filopodia. For measurements of lamellipodial size, we marked the proximal point as the border between the dense array of organelles from the central region and the lamellipodium.
For actin rib dynamics, we used high-resolution video-enhanced DIC microscopy to measure actin rib length. The point where the distal end of the actin rib intersected with the leading edge of the lamellipodium was marked in the first image and was used as a reference mark in subsequent frames for the distal end of the actin rib. The proximal end of the actin rib was detected by the decrease in contrast of the actin rib (generally >50% decrease in contrast). An alternative interpretation is that actin ribs extended further than this point, but consisted of fewer filaments whose net diameter was below the limit of light resolution. However, this seems unlikely because comparison of correlative DIC images with fluorescent images of phalloidin-stained growth cones showed alignment for the proximal ends of actin ribs that terminated before the central domain. For those actin ribs that extended into the transition zone, it was not possible to determine their length by DIC microscopy, because their proximal ends were often obscured by vesicles/organelles. We therefore avoided these actin ribs for our analysis.
The velocity of retrograde flow was measured from the movements of polystyrene beads (0.2 μm; Polysciences, Warrington, PA) on the surface of the growth cone as described in Welnhofer et al. (1997). A minimum of 10 beads per growth cone were analyzed to determine the velocity of retrograde flow. After treatment with high K+, bead movement was compared with fiduciary marks on DIC-imaged ribs. Fiduciary marks included small kinks (see Fig. 10b) or distinct contrast regions on the DIC-imaged rib. For each comparison, we selected bead and fiduciary marks in the same region of the growth cone and measured their movements during the same time interval.
Fig. 10.
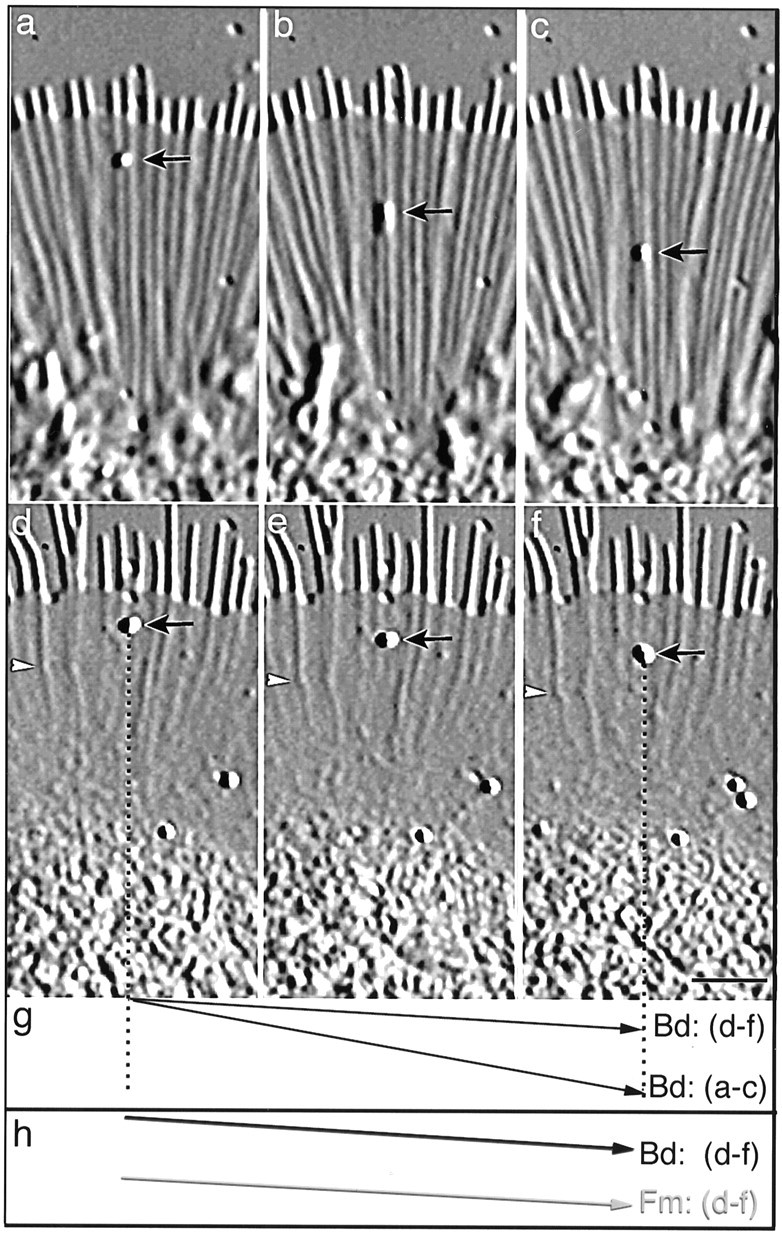
Increased [Ca2+]i results in inhibition of retrograde flow. a–c shows a region of the growth cone before treatment with high K+, andd–f shows the same region 30 min after treatment with high K+. Short arrows point to beads (200 nm polystyrene beads) on the surface of the growth cone, and thearrowheads in d–f point to a fiduciary mark on a rib. The time interval is 30 sec between each image ina–c and d–f. The displacement vectors in g and h represent the path of the bead (Bd) or fiduciary mark (Fm) relative to the leading edge over a 1 min interval, where the Δy = retrograde movement and the Δx = time. The velocity of bead movement decreases from 4.0 μm/min (a–c) to 1.1 μm/min after 30 min in high K+(d–f), as indicated by the decrease in slope of the displacement vector (g). Note the significant changes in filopodial length, rib length, and lamellipodial width that also occur after high K+(d–f). Also, the bead (arrow) ind–f moves at the same rate as the fiduciary mark on the rib (1.1 μm/min) (arrowhead), which we have previously shown to be composed of F-actin (Welnhofer et al., 1997). This is also illustrated in h by the same slopes of their displacement vectors. The Fm displacement vector was offset relative to the Bd displacement vector to ease comparison. Scale bar, 5 μm.
To measure the change in contrast of ribs imaged by DIC microscopy (Schnapp et al., 1988), we generated intensity versus distance profiles from lines (1 pixel wide) drawn perpendicular to the actin rib and within 2 μm from the leading edge. The contrast of the actin rib was measured as the difference between the peak and valley intensity, which corresponds to the highlight and shadow regions of the DIC image and is proportional to the optical path difference along the direction of shear. The change in contrast of individual ribs over time was represented as a percent change from the initial contrast. To measure the fluorescence intensity of rh-labeled actin ribs, we used the peak intensity value from the intensity versus distance profile of a line (3 pixels wide) drawn perpendicular to the actin rib and within 2 μm from the leading edge. The change in intensity of individual rh-actin ribs was evaluated over time by converting the intensity values to a percent change from the initial intensity value.
All data values are reported as mean ± SD, unless otherwise stated. We used paired and unpaired t tests to determine significant differences in data.
RESULTS
High K+ treatment increases [Ca2+]i in B19 growth cones
Using Helisoma neurons cultured in conditioned medium, we have previously shown that increasing the extracellular K+ concentration 10-fold or more results in membrane depolarization and influx of Ca2+ through voltage-activated Ca2+ channels (Cohan, 1992). To confirm that this treatment is also effective at increasing [Ca2+]i inHelisoma neurons cultured in defined medium, we measured the [Ca2+]i in growth cones of B19 neurons injected with fura-2 and treated with high K+. Depolarization with high K+ caused a rapid and sustained increase in ([Ca2+]i) in B19 growth cones in defined medium. [Ca2+]i levels in growth cones peaked at 248% (61 ± 8 nm to 191 ± 21 nm) above control levels after 2 min in high K+ and gradually decreased to 87% (121 ± 14 nm) above baseline levels after 30 min in high K+ (Fig.1). Perfusion with normal medium resulted in a rapid return to baseline [Ca2+]i levels. We therefore used this treatment to examine the effect of physiological increases in [Ca2+]i on actin organization and dynamics.
Fig. 1.

Temporal changes in [Ca2+]i in response to high K+. Perfusion with high K+occurred immediately after time 0. After 30 min, perfusion with medium alone reduced the extracellular KCl concentration to normal levels. The [Ca2+]i at 2, 5, 10, 15, 20, 30, 31, and 35 min after addition of high K+ was compared with the [Ca2+]i obtained immediately before addition of high K+ to obtain the percentage of change. The data shown represents the average and the SE of five experiments.
Physiological increases in [Ca2+]iresult in actin-related changes in growth cone morphology
To determine the effect of elevated [Ca2+]i on growth cone morphology, we imaged growth cones using phase-contrast microscopy both before and after 30 min in high K+, and subsequently fixed and stained the neurons with Bodipy-FL phallacidin to observe the effect on F-actin. Figure2a shows a B19 growth cone exhibiting the characteristic morphology of growth cones in the early stage of maturation. Phase dense linear elements (Fig. 2a), composed of F-actin bundles (Welnhofer et al., 1997), span the width of the lamellipodium and encircle the central domain. We refer to the actin bundles in the lamellipodial region as ribs. The distal ends of the actin bundles protrude from the edge of the lamellipodium and support short (majority, <2 μm) filopodia. Treatment with high K+ for 30 min resulted in dramatic changes in the growth cone morphology and actin organization (Fig. 2b,c), including an increase in filopodial length, a decrease in actin rib length, and decrease in width of the lamellipodium. Quantitative analysis showed these changes in growth cone morphology were significantly different from untreated growth cones (Table 1). The effect of high K+ on growth cone morphology was reversible; within 30–60 min after returning to normal medium, actin ribs lengthened and filopodia shortened.
Fig. 2.

Treatment with high K+ results in actin-related changes in growth cone morphology. Phase-contrast images of the same growth cone before (a) and 30 min after treatment with high K+(b). The fluorescent image in cshows the growth cone after it was fixed and stained with phallacidin. Elevation of [Ca2+]i results in lengthening of actin-supported filopodia and shortening of actin ribs. Scale bar, 5 μm.
Table 1.
High K+ affects growth cone morphology and actin organization
| Control1-a | K+ medium | |
|---|---|---|
| Filopodia length (μm) | 1.4 ± 0.4 (35) | 3.6 ± 1.2 (35)1-b |
| Actin rib length (μm) | 11.2 ± 2.1 (22) | 5.3 ± 2.5 (22)1-b |
| Lamellipodia width (μm) | 12.3 ± 1.3 (35) | 9.5 ± 1.6 (35)1-b |
From each growth cone (n= 5–7) analyzed, we measured the same filopodia, actin ribs, or lamellipodial regions just before treatment (Control) and 25 min after high K+ treatment (K+ medium). The values shown represent the mean ± SD, and the number of measurements are in parentheses.
Indicates significant difference from control data (paired t test; one-tailed; α = 0.01).
To examine whether reorganization of the actin cytoskeleton induced by high K+ could be mediated by elevation of [ Ca2+]i, we analyzed the temporal sequence of these events. Consecutive fluorescent (340/380) and phase-contrast images of fura-2-injected growth cones showed that after high K+ treatment, increases in [Ca2+]i preceded any detectable changes in growth cone morphology. We also tested whether the response of growth cones to high K+ required influx of Ca2+ by using LaCl3, a Ca2+ channel blocker. Simultaneous treatment with LaCl3 and high K+ suppressed the filopodial lengthening response observed after treatment with high K+ alone (Fig.3). To address whether the changes in growth cone morphology induced by high K+treatment were caused by increased osmolarity of the medium (Bray et al., 1991), we compared the effects of high K+ on filopodial length to that of 30 mm sucrose. No significant increase in filopodial length occurred after 20 min in 30 mm sucrose (Fig. 3). We also did not observe changes in actin rib length or lamellipodial size after treatment with high K+/LaCl3 or sucrose. These results indicate the changes in growth cone morphology induced by high K+ resulted from elevation of [Ca2+]i.
Fig. 3.

High K+-induced filopodial lengthening results from influx of calcium. The control period represents the first 20 min in normal medium, whereas the experimental period represents the following 20 min (t = 20–40 min) in which either high K+ (n= 11), 50 μm LaCl/high K+(n = 11), or 30 mm sucrose (n = 10) was added to the medium. The average filopodial length of each growth cone at time 0, 20, and 40 min was used to calculate percentage of change in filopodial length during the control and experimental period. Error bars indicate SEM.
Elevated [Ca2+]i differentially affects actin bundle dynamics
The apparent lengthening of filopodia and shortening of actin ribs after elevation of [Ca2+]i could have resulted from lamellipodial retraction, anterograde movement of actin bundles, and/or differential responses of the proximal and distal end of actin bundles. To distinguish between these possibilities, we used time-lapse microscopy to follow the dynamics of actin bundles after high K+ treatment.
The first detectable response to elevated [Ca2+]i was filopodial extension, which was initiated within 4–7 min after perfusion with high K+ (Figs.4,5a). Although small (<0.5 μm), localized fluctuations in lamellipodia sometimes occurred during this time period, the magnitude of these changes were too small to account for filopodial lengthening. Filopodia lengthened at 0.8 ± 0.3 μm/min (n = 55) for 5–10 min. As illustrated in Figure 4, adjacent filopodia sometimes moved laterally and fused together as they lengthened. In these instances, the increase in filopodial length often was greater than that of filopodia where no fusion occurred. Near the end of the lengthening response period, filopodial extension often decreased in rate and sometimes was interrupted by brief pauses (<30 sec) (Fig. 5a, see also Fig. 8b). After reaching peak length, filopodia either maintained their length or shortened.
Fig. 4.
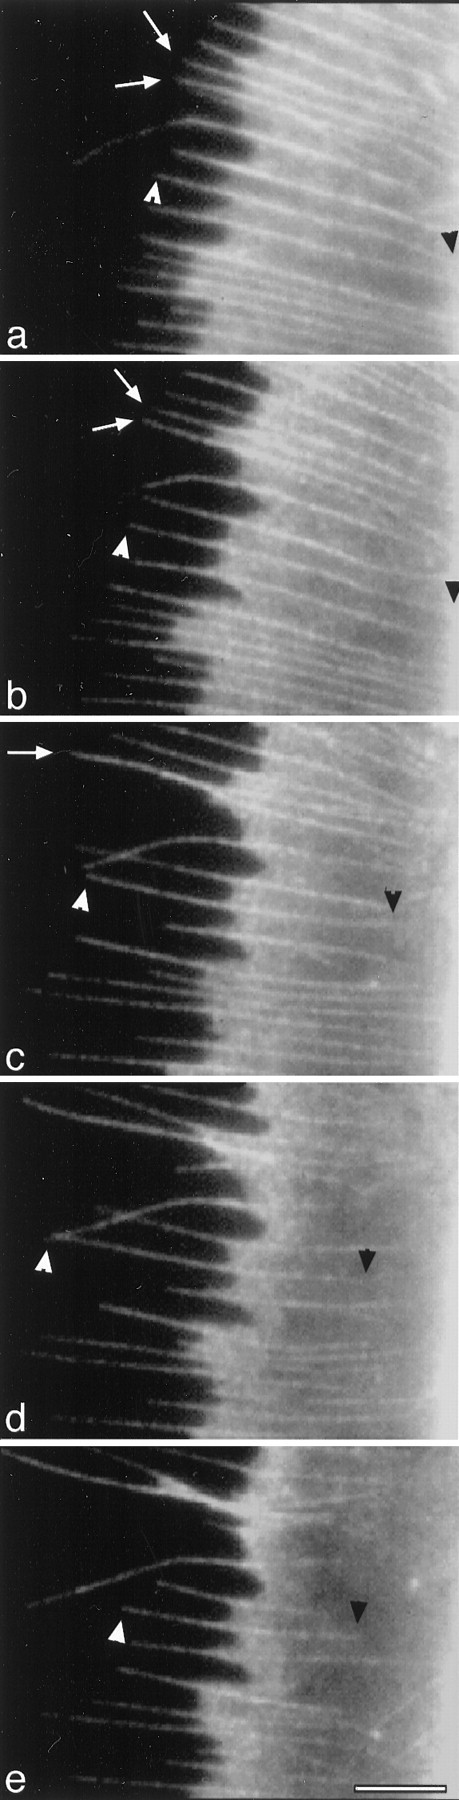
Differential effects of elevated [Ca2+]i on proximal and distal ends of actin bundles. One hour after microinjection of rh-actin into the cell body, fluorescent images of the growth cone show the filopodia and actin ribs have incorporated rh-actin (a). Perfusion with high K+ occurred immediately after (a) and the effect on rh-actin bundles is shown at (b) 5, (c) 12, (d) 18, and (e) 25 min. Time-lapse images show filopodial lengthening preceded shortening of actin ribs. The white arrowheads follow the distal end of an actin bundle, and the black arrowheads follow the proximal end of the same actin bundle. White arrows ina point to two filopodia that moved laterally (b) and fused together (c) as they lengthened. Scale bar, 5 μm.
Fig. 5.
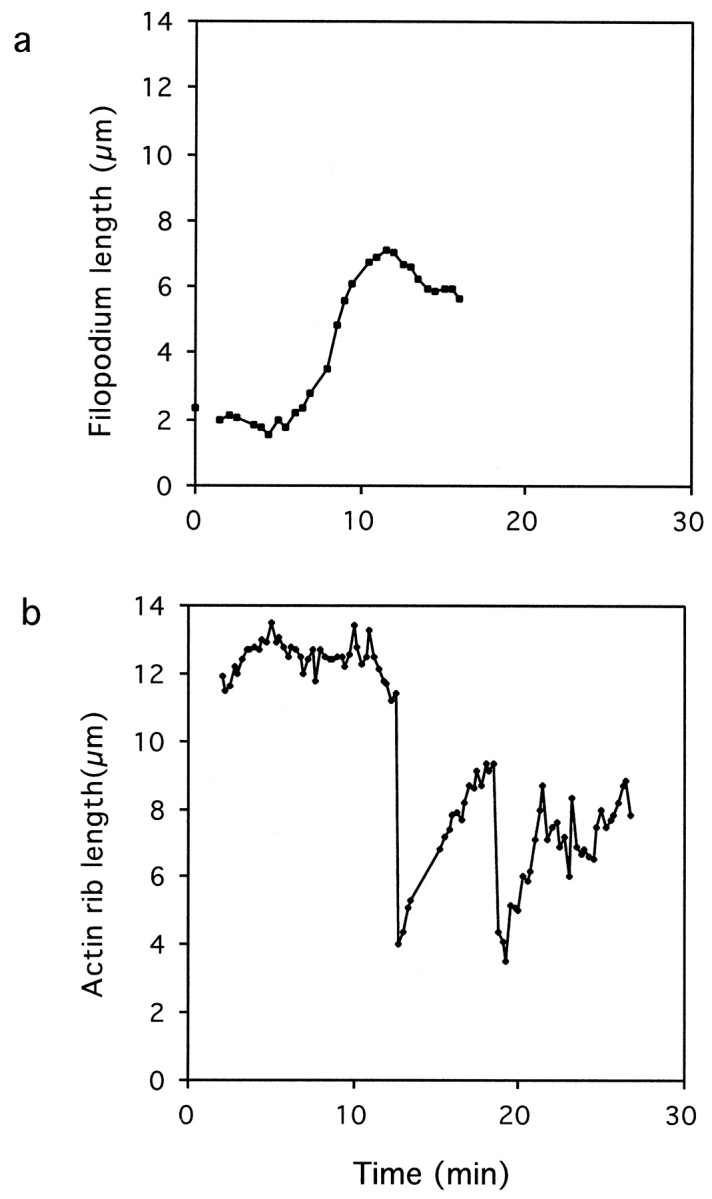
Differential effect of elevated [Ca2+]i on filopodium and rib dynamics. a, From time-lapse video-enhanced DIC movies, the length of a filopodium was measured from 0 to 20 min in high K+ at 30 sec intervals. b, From time-lapse video-enhanced DIC movies, the length of a rib was measured from sequential frames (15 sec intervals) from 2–25 min after perfusion with high K+.
Fig. 8.

Cyt B inhibits Ca2+-induced filopodial lengthening. Neurons treated with high K+for 8–10 min were briefly incubated in medium with cyt B/high K+ for 1–1.5 min before perfusion with medium containing high K+ only. From time-lapse (30 sec intervals) phase-contrast movies of growth cones, we measured filopodia length versus time. Top, To evaluate the effect of cyt B on filopodial behavior, the change in lengths of filopodia during the 1 min period before addition of cyt B and the 1 min period after treatment with cyt B were measured. For this and subsequent analysis, only those filopodia that lengthened consecutively (no pauses) for 2 min in high K+ were selected for analysis. In this way, the total time period for analysis did not exceed the average time of consecutive high K+-induced filopodia lengthening (4 min). Length changes were counted as increases or decreases if they were less than ±0.2 μm, and no change if they were between −0.2 and 0.2 μm. Bottom, The length of individual filopodia from high K+ (control, gray diamonds) and high K+/cyt B (experimental, black circles) treated growth cones as a function of time. To compare the temporal aspects of the filopodial lengthening response, the control and experimental data were set to time 0 at the point when consecutive filopodial lengthening was initiated. In the experimental data, arrows indicate time at which perfusion with either cytB/high K+ or high K+alone occurred.
The filopodia lengthening response always preceded the actin rib shortening response, which was not initiated until 10–20 min after high K+ treatment (Fig. 4). Time-lapse images showed lamellipodial retraction also did not occur during this time frame. These observations suggest that actin rib shortening and filopodia lengthening resulted from differential responses of the proximal and distal ends of actin bundles to elevated [Ca2+]i. This was confirmed by our analysis of individual actin rib dynamics, whose behavior differed markedly from filopodia (Fig. 5).
Based on our analysis of rib dynamics during high K+ treatment, we divided actin rib behavior into two distinct phases (Fig. 5b). During the initial phase (Fig. 5b; 0–11 min) after high K+ treatment, the dynamics of actin ribs were similar to those seen in control growth cones (Table2). In contrast to filopodia, actin ribs alternated between brief periods of lengthening and shortening. This behavior did not result in a significant net change in length of ribs (compare total length changes of lengthening and shortening events; Table 2). The second phase was characterized by more dramatic fluctuations in actin rib length and an increased but unequal rate of shortening and lengthening that led to a net decrease in actin rib length (Table 2). Initiation of the second phase (Fig. 5b;∼11 min) occurred with a catastrophic shortening event (18.4 ± 9.3 μm/min; n = 8), a term we used to describe length changes ≥2 μm within 15 sec. Although the catastrophic shortening events were always followed by a period of lengthening, the actin ribs never recovered their initial length. Rather, a cycle of catastrophic shortening followed by lengthening was often repeated one or more times. However, with time, less dramatic fluctuations in actin rib length occurred. Comparison of actin rib behavior between the initial and second phase showed no change in frequency of shortening events (Table 2), although the frequency of lengthening and pause events changed. Thus, these results indicate the decrease in actin rib length during the second phase occurred as a result of the catastrophic shortening events.
Table 2.
Actin rib dynamics during high K+ treatment
| Control2-a | Initial phase-high K+2-b | Second phase-high K+2-c | |
|---|---|---|---|
| Total length change (μm)2-d | |||
| Shortening | −6.1 ± 0.7 | −22.0 ± 1.72-e | |
| Lengthening | 6.4 ± 1.0 | 16.2 ± 1.82-e | |
| Average Change in Length (μm) | |||
| Shortening | 0.7 ± 0.4 | 2.0 ± 2.22-e | |
| Lengthening | 0.6 ± 0.3 | 1.2 ± 0.92-e | |
| Rate (μm/min)2-f | |||
| Shortening | 2.1 ± 0.6 | 2.0 ± 0.4 | 5.1 ± 0.92-e |
| Lengthening | 1.3 ± 0.3 | 1.7 ± 0.4 | 2.4 ± 0.02-e |
| Frequency2-g | |||
| Shortening | 0.34 ± 0.02 | 0.32 ± 0.04 | |
| Lengthening | 0.41 ± 0.03 | 0.50 ± 0.032-e | |
| Pause | 0.25 ± 0.03 | 0.18 ± 0.042-e |
For control data, we measured actin rib length (n = 10) in growth cones in normal medium at 30 sec intervals for 30 min.
During the “Initial phase,” which included the period after high K+ treatment until the first catastrophic shortening event (length change ≥2 μm/15 sec), we measured the actin rib length (n = 4) at 15 sec intervals.
During the “Second phase,” which began at the first catastrophic shortening event and lasted until 27 min after high K+ treatment, we analyzed the same actin ribs as measured during the initial phase at 15 sec intervals.
The total change in length for lengthening events (>0.2 μm/15 sec) or shortening events (greater than −0.2 μm/15 sec) was calculated for each rib, and the mean ± SD of four actin ribs is displayed above.
Indicates a statistically significant difference between the initial and second phase (Student’s pairedt test; α = 0.5).
For each rib analyzed, the average rate of shortening or lengthening was calculated from the change in length/15 sec interval.
Frequency was measured as the number of 15 sec intervals in which actin ribs displayed either lengthening, shortening, or pauses divided by the total number of 15 sec intervals. A shortening or lengthening event was defined as any actin rib length change ≥0.2 μm, and pause as any actin rib length change <0.2, which occurred during 15 sec intervals.
Catastrophic actin rib shortening results from buckling and breaking
Time-lapse images of actin ribs during high K+ treatment showed the catastrophic shortening events resulted from breakage of actin ribs (Fig.6a–c) rather than a progressive proximal to distal endwise shortening. For example, in Figure 6, a break in continuity (b, arrow), as detected by a localized decrease in contrast, occurred along the actin rib. Subsequently, the actin rib shortened from 15.2–8.0 μm, and an isolated fragment of the actin rib was generated (Fig. 6c). The actin rib fragments formed after breaking were unstable and quickly disappeared (Fig. 6c–g) as a result of rapid shortening (4.1 ± 2.8 μm/min; n = 4). These rapid rates of shortening appeared to result from progressive endwise shortening from one or both ends of the fragment. In contrast, the original actin ribs remained, alternating between periods of lengthening and shortening.
Fig. 6.

Rapid shortening involves fragmentation of the actin rib. From time-lapse (30 sec intervals) video-enhanced DIC movies, this sequence shows actin rib dynamics at (a) 8:00, (b) 10:00, (c) 10:30, (d) 11:00, (e) 11:30, (f) 12:00, (g) 12:30, and (h) 13:00 min:sec after perfusion with high K+. Black arrowheads point to the proximal end of the rib, andwhite arrowheads point to the distal end of the fragment severed from the actin rib. The white arrow inb points to a break in continuity of the rib. Fromb–d, the fragment shortens at rates of 2–3.2 μm/min, and from e–f 8.1 μm/min. Scale bar, 1 μm.
At higher temporal resolution, we observed that buckling of actin ribs often preceded rib breakage. This is illustrated in Figure7, in which a linear actin rib became progressively more bent at two regions. As the actin rib increased in length, the position of the proximal end of the actin rib (relative to the central region) did not change position (Fig. 7a–c). Breaks in continuity of actin ribs localized near the bent regions (Fig7c–e). Actin ribs bent to an angle of 134 ± 16° (n = 55) before a break in continuity. The buckling and breaking response was occasionally observed in untreated growth cones. However, in untreated neurons, breakage occurred closer to the central region compared with high K+-treated growth cones (Table 3).
Fig. 7.

Actin rib buckling occurs before breakage. From time-lapse (15 sec intervals) video-enhanced DIC movies, this sequence shows rib dynamics at (a) 11:45, (b) 12:15, (c) 12:45, (d) 13:15, and (e) 13:45 min:sec after addition of high K+. The black arrowhead points to the proximal end of the rib, and thewhite arrows point to regions where kinks develop (a–c) into breaks in continuity of the rib (d). The linear rib in a is progressively bent at two regions. Following the top bend, the angle of the rib changed from 180° (a), to 158° (b), to 147° (c) before fragmentation, whereas the angle of the rib for the bottom bend changed from 180° (a), to 140° (b), to 123° (c) before fragmentation. Scale bar, 1 μm.
Table 3.
Comparison of actin bundle buckling and breakage in control and high K+ growth cones
| Angle of kink3-a | Location of breakage3-b | |
|---|---|---|
| Control | 128 ± 15 (12)3-c | 0.69 ± 0.09 (12) |
| High K+ | 134 ± 16 (55) | 0.53 ± 0.11 (68)3-d |
The angles were measured before breakage.
The location of breakage is represented as the ratio of the distance from the leading edge where severing occurs divided by width of the lamellipodia. As such, “0” represents a location at the leading edge and “1” a location adjacent to central region.
Mean ± SD (n).
Indicates significant difference from control data (α = 0.01).
Effect of cyt B on filopodial lengthening
The filopodial lengthening response induced after elevation of [Ca2+]i could have resulted from either actin assembly or anterograde movement of actin bundles. In the former case, the filopodial lengthening response would be expected to be inhibited by cyt B, which inhibits assembly of subunits onto the end of actin filaments and prevents elongation of actin filaments (MacLean-Fletcher and Pollard, 1980; Bonder and Mooseker, 1986). Using time-lapse microscopy, we examined the response of individual filopodia that were lengthening in high K+ to brief treatment with cyt B/high K+ medium (<1.5 min). Our results show that brief exposure to cyt B (<1.5 min) had a concentration-dependent effect on filopodial lengthening. In the presence of 125–250 nm cyt B, the majority of filopodia in high K+ continued to lengthen, whereas in the presence of ≥500 nm cyt B, the majority of filopodia in high K+ remained the same length or decreased in length (Fig. 8). These results show that cyt B (>500 nm) inhibited the filopodial lengthening response induced after elevation of [Ca2+]i.
Ca2+-induced changes in optical properties of actin ribs
Time-lapse DIC images of growth cones showed that [Ca2+]i elevation also affected the contrast of actin ribs (Fig.9a,b). We quantified contrast changes in actin ribs of DIC-imaged ribs before and during high K+ treatment, as is illustrated in Figure9c. Within 10 min after high K+treatment, actin rib contrast decreased significantly compared to ribs in untreated growth cones, reaching a maximum between 20–30 min (Table4). The decrease in contrast of actin ribs could have resulted from a loss of actin filaments and/or actin-associated proteins from the rib or changes in optical properties of cytoplasm adjacent to the actin ribs.
Fig. 9.

Actin rib contrast decreases after elevation of [Ca2+]i. a andb show the same rib, imaged with video-enhanced DIC microscopy, before (time = 0 min) and 30 min after treatment with high K+. A linear intensity scan perpendicular to the rib at both time points is shown in c. The region of the actin rib scanned is outlined in black. The contrast of the rib, as measured by the difference in the peak intensity and trough intensity, decreased 51% after 30 min in high K+. In this case, a decrease in actin rib diameter was not detected at this level of resolution (∼0.2 μm). Scale bar, 1 μm.
Table 4.
Temporal changes in actin rib contrast after elevation of [Ca2+]i
| Time (min) | Average % change in contrast4-a | |
|---|---|---|
| High K+ | Control | |
| 5 | −20 ± 25 (26) | −9 ± 19 (31) |
| 104-b | −47 ± 22 (26) | −4 ± 19 (32) |
| 154-b | −53 ± 19 (26) | −10 ± 19 (28) |
| 204-b | −52 ± 19 (26) | −12 ± 20 (29) |
| 304-b | −56 ± 18 (26) | −5 ± 26 (15) |
For each rib analyzed, the contrast was measured from line intensity scans generated perpendicular to the rib at time 0, 5, 10, 15, 20, and 30 min, and the percentage change in contrast was calculated as the difference in contrast from time 0. The data is shown as mean ± SD (number of ribs analyzed).
Indicates time periods in which the change in contrast for high K+ are significantly different from controls (α = 0.01; Student’s unpaired ttest).
To distinguish between these two possibilities, we also examined the effect of elevated [Ca2+]i on fluorescence intensity of rh-actin ribs. In this situation, a decrease in actin filament number should be reflected in a decrease in fluorescence intensity of the actin ribs, whereas changes in the optical properties of the adjacent cytoplasm should not affect the fluorescence intensity of actin ribs. After 30 min in high K+, the fluorescence intensity of rh-actin ribs also significantly decreased, by 36.5 ± 13.1% (n = 32). The decrease in fluorescence intensity cannot be attributed solely to photobleaching, as in untreated cells exposed to the same light conditions, fluorescence intensity of actin ribs decreased only 6.6 ± 13.1% (n = 32) after 30 min. The decrease in contrast and fluorescence intensity after high K+ treatment suggests elevation of [Ca2+]i leads to a loss in number of actin filaments from actin ribs.
Elevated [Ca2+]i affects retrograde flow
We examined whether elevated [Ca2+]i affected retrograde flow by use of flow-coupled beads (Lin and Forscher, 1995). We have previously shown that beads on the surface of growth cones move retrogradely the same rate as fiduciary marks on rh-labeled ribs (Welnhofer et al., 1997) and therefore provide a means to measure the velocity of F-actin retrograde flow. As is illustrated in Figure10 and Table5, the velocity of retrograde bead movement decreased significantly after 12–17 min in high K+ (Period I) and further decreased to 50% of control levels after 27–32 min in high K+ (Period II). In control studies, the velocity of retrograde flow in untreated neurons did not change significantly during the 30 min observation period (Table 5).
Table 5.
Effect of elevated [Ca2+]i on velocity of retrograde flow
| Retrograde flow (μm/min)5-a | ||
|---|---|---|
| High K+ | Untreated | |
| Control5-b | 4.1 ± 0.8 (10) | 3.5 ± 0.7 (7) |
| Period I5-c | 2.6 ± 0.5 (10)5-d | 3.6 ± 0.6 (7) |
| Period II5-e | 2.0 ± 0.6 (10)5-d | 3.6 ± 0.6 (7) |
The average velocity of retrograde flow ± SD is shown. The number of growth cones analyzed is shown in parentheses.
Control includes the time from −5 to 0 min in which neurons were in normal medium.
Period I includes the time period from 12–17 min after perfusion of high K+ or normal medium (untreated).
Indicates significant difference from control data (paired; α = 0.01).
Period II includes the time period from 27–34 min after perfusion of high K+ or normal medium (untreated).
To address whether the changes in length and density of actin ribs after elevation of [Ca2+]i affected bead coupling to the actin cytoskeleton, we compared bead movements (Fig. 10d-f, arrow) to that of fiduciary marks on DIC-imaged ribs (Fig. 10d-f, arrowhead). After 30 min in high K+, beads (2.0 ± 0.6 μm/min;n = 12) continued to move at the same rate as fiduciary marks in DIC-imaged ribs (2.0 ± 0.8 μm/min; n = 12) (Fig. 10h). Also, after 30 min in high K+, beads continued to behave as predicted if coupled to the cytoskeleton; they followed linear rather than random paths (deBrabander et al., 1991) and exhibited constant velocities between observation intervals. These observations indicate that the inhibition of bead movement after high K+reflects an inhibition in retrograde F-actin flow rather than a change in bead coupling to the cytoskeleton.
The reduction in velocity of retrograde flow during high K+ treatment could have resulted directly from increased [Ca2+]i or could have been a result of Ca2+-induced changes in actin organization. To distinguish between these possibilities, we first examined the effect of elevated [Ca2+]i on retrograde flow before changes in actin organization had occurred. We measured the velocity of retrograde flow immediately after treatment with high K+ but before initiation of filopodial lengthening, which was the first detectable change in F-actin. The velocity of retrograde flow (2.9 ± 0.3 μm/min;n = 5) did not change significantly immediately after elevation of [Ca2+]i with high K+ (3.1 ± 0.5 μm/min;n = 5; paired Student’s t test; α = 0.05), suggesting influx of Ca2+ alone did not contribute to the reduction in retrograde flow.
In a second approach, we attempted to block changes in actin organization with phalloidin, a compound that binds and stabilizes actin filaments (Dancker et al., 1975; Coluccio and Tilney, 1984) and inhibits Ca2+-induced changes in actin organization in other neurons (Lankford and Letourneau, 1989; Neely and Gesemann, 1994). In control experiments, phalloidin did not alter the velocity of retrograde flow (3.5 ± 0.2 μm/min in control neurons vs 3.3 ± 0.2 μm/min after 30 min in phalloidin;n = 2; α = 0.01; paired student’s ttest). Also, phalloidin did not inhibit Ca2+ influx after high K+. Within 2 min after phalloidin/high K+ treatment, [Ca2+]i increased 470% above baseline levels (47 ± 15 to 250 ± 19 nm;n = 2) and after 20 min decreased to 116% above control levels (119 ± 5 nm). We therefore compared the velocity of retrograde flow in neurons treated with high K+ to that in neurons preincubated with phalloidin before high K+ (phalloidin/high K+) (Fig.11a). From the same growth cones, we also measured the following attributes: actin rib length, lamellipodia size, filopodia length, and actin rib contrast (Fig.11b). This allowed us to evaluate whether phalloidin was effective at blocking the changes in actin organization that occurred after high K+.
Fig. 11.

Phalloidin inhibits Ca2+-induced changes in retrograde flow and growth cone morphology. Growth cones were treated with high K+ for 30 min or preincubated with 10 μg/ml phalloidin for 1 hr before treatment with phalloidin/high K+ for 30 min. a, For each growth cone analyzed, we measured the rate of retrograde flow just before treatment (Control, −5–0 min), 12–17 min after treatment (Period I), and 25–30 min after treatment (Period II), and these values were normalized relative to the velocity during the control period. The bar graph shows the mean normalized values (n = 10 for high K+, and n = 6 for phalloidin/high K+), and the error bars indicate SD. b,From the same growth cones analyzed in a, we also measured lamellipodia width, filopodia length, rib length, and rib contrast. For each growth cone, five filopodia, actin ribs, or regions of the lamellipodia were selected and measured just before treatment (Control), 12 min after treatment (Period I), or 25 min after treatment. The average value for each of these parameters was then normalized relative to the control period. The table shows the mean normalized values for high K+ and phalloidin/high K+treatments. The asterisk indicates experimental sets significantly different from the control set (Student’s pairedt test; α = 0.05; one-tailed), and thedouble dagger indicates a significant difference between high K+- and high K+/phalloidin-treated cells (Student’s unpairedt test; α = 0.05; one-tailed).
In contrast to growth cones treated with high K+ alone, the retrograde flow velocity in phalloidin/high K+-treated growth cones did not change significantly during period I (Fig. 11a). Although a significant decrease in retrograde flow velocity from control levels occurred after 30 min in high K+/phalloidin, it was 3.5-fold less than that which occurred with high K+ alone. These results indicate phalloidin inhibited the effect of high K+ on retrograde flow.
The ability of phalloidin to inhibit the effect of high K+ on retrograde flow correlated with its ability to block changes in actin organization (Fig. 11b). During period I, three of the four attributes measured changed significantly in high K+-treated neurons, whereas only one of the attributes, actin rib contrast, changed significantly if phalloidin was also present. Thus, in addition to inhibiting a decrease in retrograde flow rates, phalloidin also blocked the filopodial lengthening and actin rib shortening response normally observed during period I in high K+-treated neurons. During period II, high K+ treatment resulted in significant changes in each of the attributes measured, whereas phalloidin/high K+ treatment resulted in significant changes in three of four attributes. As such, phalloidin was less effective at blocking high K+-induced changes in actin organization during period II, and this may account for the decreased rate in retrograde flow that occurred in phalloidin/high K+ growth cones during period II. However, the magnitude of change in growth cone morphology during period II was significantly less in phalloidin/high K+ than in high K+ alone, as was the magnitude of change in retrograde flow rates.
DISCUSSION
Physiological increases in [Ca2+]i caused remodeling of the actin cytoskeleton in Helisoma growth cones. Using time-lapse microscopy, we have shown that this results from assembly driven elongation of actin bundles distally, breakage-induced shortening of actin bundles proximally, and a decrease in F-actin density in ribs. Furthermore, we have shown that these Ca2+-induced changes in cytoskeletal organization coincide with a reduction in velocity of retrograde flow. This study provides direct evidence that Ca2+ levels in growth cones can affect actin dynamics, and thus provides a specific mechanism by which extracellular guidance cues can influence growth cone motility and behavior.
Ca2+-dependent filopodia extension requires actin assembly
The filopodial lengthening response to elevated [Ca2+]i has also been observed in other growth cones (Sobue and Kanda, 1989; Davenport and McCaig, 1992; Davenport and Kater, 1992; Rehder and Kater, 1992), but the mechanisms involved have not been elucidated. Using time-lapse microscopy, we show that filopodial lengthening after elevation of [Ca2+]i is not a passive response caused by lamellipodial retraction. Also, anterograde movement of actin bundles seems unlikely given that filopodia lengthening occurs before shortening or changes in contrast of ribs. Rather, our results from cyt B/high K+studies indicate that Ca2+-stimulated filopodia elongation requires actin assembly at the barbed end. In current models of leading edge protrusion (Welch et al., 1997; Suter and Forscher, 1998), assembly-driven filopodial elongation requires the rate of assembly to exceed the rate at which actin bundles move retrogradely. Accordingly, it is possible that filopodial lengthening results from the Ca2+-induced decrease in retrograde flow. Another possibility is that Ca2+ stimulates an increased rate of assembly at the barbed ends of actin bundles. Ca2+-sensitive molecules that have been localized to growth cones and affect actin assembly include: GAP-43 (He et al., 1997; Ohbayashi et al., 1998), α-actinin (Lankford and Letourneau, 1989; Letourneau and Shattuck, 1989; Sobue and Kanda, 1989), gelsolin (Tanaka et al., 1993; Neely and Macaluso, 1997), and actin depolymerizing factor (ADF) (Bamburg and Bray, 1987; Meberg et al., 1998).
Actin rib shortening: bundle breakage and expansion of the transition zone
Our analysis of actin rib dynamics revealed new features of their behavior. In untreated neurons, actin ribs alternated between phases of elongation and shortening, superficially resembling microtubule behavior at plus ends (dynamic instability). Assuming that actin ribs are composed of filaments with their pointed or slow-growing end toward the central domain (Lewis and Bridgman, 1992) and that elongation of F-actin by pointed-end assembly is not significant, then rib dynamics would be determined by the relationship between the rates of retrograde flow and disassembly. Specifically, we would interpret elongation of actin ribs to occur when the rate of depolymerization from the pointed end is slower than that of retrograde flow, and conversely, shortening to occur when the rate of depolymerization exceeds the rate of retrograde flow.
Catastrophic shortening events occurred after elevation of [Ca2+]i, resulting in a net decrease in length of ribs. The velocity of catastrophic shortening events exceeded the known rates for disassembly at the pointed end or barbed end of actin filaments (Pollard, 1986), and therefore indicated a mechanism other than endwise disassembly for actin rib shortening. Higher temporal resolution time-lapse movies showed that the catastrophic shortening events resulted from rib breakage and subsequent disappearance of the newly generated actin bundle fragment.
Recent models for actin turnover in growth cone lamellipodia suggest recycling of actin subunits occurs in the transition zone between the peripheral and central domain (Suter and Forscher, 1998). To accommodate the rapid rate of filament turnover, it is thought that filament severing and net disassembly are favored in this region (Welch et al., 1997). Our observation that rib breakage occurred close to the central domain in untreated growth cones supports a role for severing in recycling. We propose elevation of [Ca2+]i causes the transition zone to expand or shift distally, resulting in shorter actin ribs. This hypothesis can explain both the change in location of rib breakage and the inability of ribs to elongate to their original length after breakage.
Mechanism of actin bundle breakage
Breakage of F-actin has been difficult to observe in cells because it most frequently occurs in regions that are optically complex, such as adjacent to the central domain. However, in Helisomagrowth cones, elevation of [Ca2+]i shifted the location of breakage distally along the rib into the lamellipodial region, and therefore provided a unique opportunity to examine this process in vivo. Our observations suggest that buckling plays an important role in actin bundle breakage. One possibility is that the mechanical stress from buckling may introduce enough force to break the actin–actin bonds (600 pN) (Tsuda et al., 1996) at bends in the bundles. The progressive loss of filaments from the ribs after [Ca2+]i elevation may make the ribs more susceptible to breakage by buckling forces. Another possibility is that the bends in buckled ribs may unmask binding sites for severing proteins from the ADF/cofilin family, which have been shown to preferentially sever filaments at preexistent bends (Maciver et al., 1991). Our observations do not support the involvement of the gelsolin severing family, which cap the new barbed end of the filament after severing. In Helisoma, the rapid rates at which newly generated fragments disassembled suggest that they were not capped, but were free to disassemble from both ends. Also, phalloidin does not affect gelsolin severing activity (Bearer, 1991), but inhibited actin rib shortening in our experiments.
It will be important to elucidate the mechanism of buckling, because it appears to have an important role not only in actin bundle breakage but also microtubule breakage in the lamella of migrating epithelial cells (Waterman-Storer and Salmon, 1997). We propose that in growth cones, buckling results when nonuniform forces are applied to the rib as it moves retrogradely. In this respect, the effects would be similar to what happens when the leading car of a train derails. Buckling of the object would occur near the point where the forces differ. Evidence supporting this theory is shown in Figure 7, where the position of the kinks that form along the rib can be used as a marker to measure retrograde displacement. The kinks moved retrogradely an unequal distance over the same time period, suggesting the velocity of retrograde flow decreased along the length of the rib.
Reorganization of actin filaments in bundles
We used two quantitative approaches to detect changes in actin filament number in ribs: (1) changes in contrast of actin ribs imaged by video-enhanced DIC microscopy, and (2) changes in intensity of rh-actin ribs imaged by fluorescent digital microscopy. Our analysis showed that both the contrast and fluorescence intensity of ribs decreased after high K+, suggesting elevation of [Ca2+]i leads to a decrease in number of actin filaments in bundles. This change in actin ribs could potentially be mediated by the effect of elevated Ca2+ on actin-bundling proteins. The activity of several actin-bundling proteins is influenced by Ca2+. α-Actinin (Noegel et al., 1987;Witke et al., 1993), fimbrin (l-plastin) (de Arruda et al., 1990), and 30 kd bundling protein (Fechheimer and Furukawa, 1993) each dissociate from actin filaments in the presence of 10−6–10−7m Ca2+in vitro. In addition, fascin activity is regulated by phosphorylation (Yamakita et al., 1996) and therefore could be indirectly affected through activation of Ca2+ signaling pathways. Both α-actinin (Sobue and Kanda, 1989) and fascin (Sasaki et al., 1996) (our unpublished observations) localize to the peripheral domain of growth cones.
Inhibition of retrograde flow by Ca2+-mediated changes in actin organization
Our results implicate Ca2+ as a potential regulator of retrograde flow of actin in growth cone lamellipodia. Physiological increases in [Ca2+]i resulted in an inhibition of retrograde flow of beads on the surface of the lamellipodia. We have shown previously that under normal conditions, the beads are coupled to the actin cytoskeleton and thus can be used as a marker for retrograde flow velocity (Welnhofer et al., 1997). Despite the Ca2+-induced re- modeling of the actin cytoskeleton, we show that beads behaved as would be predicted if they were continuously coupled to the cytoskeleton. We therefore conclude that the Ca2+-induced inhibition of bead movement reflects an inhibition of the retrograde flow of actin.
We suggest the inhibition of retrograde flow resulted from Ca2+-mediated changes in the cytoskeleton rather than a direct effect of Ca2+ on myosin activity (Cheney et al., 1993). The inhibition of retrograde flow did not occur immediately after the rise in [Ca2+]i, suggesting it was not the result of a Ca2+-induced signaling cascade. When phalloidin was used to block changes in actin filament organization, there also was no significant change in velocity of retrograde flow after elevation of [Ca2+]i (Fig. 11;Period I). Furthermore, there was a correlation in magnitude of changes in actin bundle organization and inhibition of retrograde flow. (Fig. 11, Period II).
Our quantitative analysis enabled us to identify specific morphological changes correlated with an inhibition of retrograde flow. Our results suggest that neither a loss of filaments from actin ribs nor filopodial lengthening contribute to a reduction in retrograde flow. During period I, a significant decrease in actin rib contrast occurred in phalloidin/high K+ independent from a change in retrograde flow velocity. Also, during period II, a significant decrease in velocity occurred in high K+/phalloidin in the absence of filopodial lengthening. The finding that phalloidin inhibited filopodial lengthening is not surprising considering that in vitro it blocks barbed end assembly by 50% (Sampath and Pollard, 1991). We therefore suggest that changes in actin rib length and lamellipodial width may contribute to a reduction in retrograde flow velocity. We have previously shown a correlation between actin rib shortening and inhibition of retrograde flow during growth cone morphogenesis (Welnhofer et al., 1997). In addition, Ca2+-induced changes in the actin meshwork (Lankford and Letourneau, 1989), which we have not assayed here, may also contribute to a reduction in retrograde flow velocity.
How would changes in actin rib length or lamellipodial width affect retrograde flow? One possibility is that shortening of actin ribs inhibits their interaction with the myosin motor protein responsible for retrograde flow. This would occur if the myosin activity was distributed preferentially in the proximal region rather than throughout the lamellipodia. Such a differential distribution has been shown for myosin II in growth cones (Rochlin et al., 1995) and keratocytes (Svitkina et al., 1997). However, this scenario seems inconsistent with the observation of actin rib buckling, which suggests myosin to be exerting force on ribs both proximally and distally along the length of the actin rib. An alternative explanation is that the net rate of retrograde flow is faster when myosin interacts with polarized actin bundles than more randomly organized filaments in the meshwork. After a loss of ribs because of shortening, the net rate of retrograde flow would depend mainly on interactions of myosin with filaments in the meshwork and result in a slower net rate of retrograde flow. In addition, the decrease in lamellipodial width, which occurred as a result of expansion of the microtubule-dominated central domain, might also affect the velocity of retrograde flow if this increased the amount of microtubules in the lamellipodial region. Microtubules have been shown to suppress actomyosin-based cortical flow inXenopus embryos (Canman and Bement, 1997), where cortical flow rates are inversely proportional to the level of polymeric tubulin.
Footnotes
These experiments were supported by a grant from the National Institutes of Health (NS25789) to C.S.C.
Correspondence should be addressed to Christopher S. Cohan, Department of Anatomy and Cell Biology, School of Medicine, University at Buffalo, State University of New York, Buffalo, NY 14214.
REFERENCES
- 1.Bamburg JR, Bray D. Distribution and cellular localization of actin depolymerizing factor. J Cell Biol. 1987;105:2817–2825. doi: 10.1083/jcb.105.6.2817. [DOI] [PMC free article] [PubMed] [Google Scholar]
- 2.Bandtlow CE, Schmidt MF, Hassinger TD, Schwab ME, Kater SB. Role of intracellular calcium in NI-35-evoked collapse of neuronal growth cones. Science. 1993;259:80–83. doi: 10.1126/science.8418499. [DOI] [PubMed] [Google Scholar]
- 3.Bearer EL. Direct observation of actin filament severing by gelsolin and binding by gCap39 and capZ. J Cell Biol. 1991;115:1629–1638. doi: 10.1083/jcb.115.6.1629. [DOI] [PMC free article] [PubMed] [Google Scholar]
- 4.Bonder EM, Mooseker MS. Cytochalasin-B slows but does not prevent monomer addition at the barbed end of the actin filament. J Cell Biol. 1986;102:282–288. doi: 10.1083/jcb.102.1.282. [DOI] [PMC free article] [PubMed] [Google Scholar]
- 5.Bray D, Money NP, Harold F, Bamburg J. Responses of growth cones to changes in osmolarity of the surrounding medium. J Cell Sci. 1991;98:507–515. doi: 10.1242/jcs.98.4.507. [DOI] [PubMed] [Google Scholar]
- 6.Canman JC, Bement WM. Microtubules suppress actomyosin-based cortical flow in Xenopus oocytes. J Cell Sci. 1997;110:1907–1917. doi: 10.1242/jcs.110.16.1907. [DOI] [PubMed] [Google Scholar]
- 7.Cheney RE, O’Shea MK, Heuser JE, Coelho MV, Wolenski JS, Espreafico EM, Forscher P, Larson RE, Mooseker MS. Brain myosinV is a two-headed unconventional myosin with motor activity. Cell. 1993;75:13–23. doi: 10.1016/S0092-8674(05)80080-7. [DOI] [PubMed] [Google Scholar]
- 8.Cohan CS. Depolarization-induced changes in neurite elongation and intracellular calcium in isolated Helisoma neurons. J Neurobiol. 1992;23:983–996. doi: 10.1002/neu.480230805. [DOI] [PubMed] [Google Scholar]
- 9.Cohan CS, Connor JA, Kater SB. Electrically and chemically mediated increases in intracellular calcium in neuronal growth cones. J Neurosci. 1987;7:3588–3599. doi: 10.1523/JNEUROSCI.07-11-03588.1987. [DOI] [PMC free article] [PubMed] [Google Scholar]
- 10.Coluccio LM, Tilney LG. Phalloidin enhances actin assembly by preventing monomer dissociation. J Cell Biol. 1984;99:529–535. doi: 10.1083/jcb.99.2.529. [DOI] [PMC free article] [PubMed] [Google Scholar]
- 11.Dancker P, Low I, Hasselbach W, Wieland T. Interaction of actin with phalloidin: polymerization and stabilization of F-actin. Biochim Biophys Acta. 1975;400:407–414. doi: 10.1016/0005-2795(75)90196-8. [DOI] [PubMed] [Google Scholar]
- 12.Davenport RW. Functional domains and intracellular signalling: clues to growth cone dynamics. Nerve Growth and Guidance. (McCaig CD, ed), pp 55–75. Portland; London: 1996. [Google Scholar]
- 13.Davenport RW, Kater SB. Local increases in intracellular calcium elicit local filopodial responses in Helisoma neuronal growth cones. Neuron. 1992;9:405–416. doi: 10.1016/0896-6273(92)90179-h. [DOI] [PubMed] [Google Scholar]
- 14.Davenport R, McCaig C. Hippocampal growth cone responses to focally applied electric fields. J Neurobiol. 1992;24:89–100. doi: 10.1002/neu.480240108. [DOI] [PubMed] [Google Scholar]
- 15.de Arruda M, Watson S, Lin C-S, Leavitt J, Matsudaira P. Fimbrin is a homologue of the cytoplasmic phosphoprotein plastin and has domains homologous with calmodulin and actin gelatin proteins. J Cell Biol. 1990;111:1069–1079. doi: 10.1083/jcb.111.3.1069. [DOI] [PMC free article] [PubMed] [Google Scholar]
- 16.deBrabander M, Nuydens R, Ishihara A, Holifield B, Jacobson K, Geerts H. Lateral diffusion and retrograde movements of individual cell surface components on single motile cells observed with nanovid microscopy. J Cell Biol. 1991;112:111–124. doi: 10.1083/jcb.112.1.111. [DOI] [PMC free article] [PubMed] [Google Scholar]
- 17.Doherty P, Walsh FS. Signal transduction events underlying neurite outgrowth stimulated by cell adhesion molecules. Curr Opin Neurobiol. 1994;4:49–55. doi: 10.1016/0959-4388(94)90031-0. [DOI] [PubMed] [Google Scholar]
- 18.Fechheimer M, Furukawa R. A 27,000-D core of the Dictyostelium 34,000-D protein retains Ca(2+)-regulated actin cross-linking but lacks bundling activity. J Cell Biol. 1993;120:1169–1176. doi: 10.1083/jcb.120.5.1169. [DOI] [PMC free article] [PubMed] [Google Scholar]
- 19.Forscher P, Smith SJ. Actions of cytochalasins on the organization of actin filaments and microtubules in a neuronal growth cone. J Cell Biol. 1988;107:1505–1516. doi: 10.1083/jcb.107.4.1505. [DOI] [PMC free article] [PubMed] [Google Scholar]
- 20.Grynkiewicz G, Poenie M, Tsien RY. A new generation of Ca indicators with greatly improved fluorescence properties. J Biol Chem. 1985;260:3440–3450. [PubMed] [Google Scholar]
- 21.Harper SJ, Bolsover SR, Walsh FS, Doherty P. Neurite outgrowth stimulated by L1 requires calcium influx into neurons but is not associated with changes in steady state levels of calcium in growth cones. Cell Adhes Commun. 1994;2:441–453. doi: 10.3109/15419069409004454. [DOI] [PubMed] [Google Scholar]
- 22.He Q, Dent E, Meiri K. Modulation of actin filament behavior by GAP-43 (Neuromodulin) is dependent on the phosphorylation status of serine 41, the protein kinase C site. J Neurosci. 1997;17:3515–3524. doi: 10.1523/JNEUROSCI.17-10-03515.1997. [DOI] [PMC free article] [PubMed] [Google Scholar]
- 23.Kater SB, Mills LR. Regulation of growth cone behavior by calcium. J Neurosci. 1991;11:891–899. doi: 10.1523/JNEUROSCI.11-04-00891.1991. [DOI] [PMC free article] [PubMed] [Google Scholar]
- 24.Kuhn TB, Williams CV, Dou P, Kater SB. Laminin directs growth cone navigation via two temporally and functionally distinct calcium signals. J Neurosci. 1998;18:184–194. doi: 10.1523/JNEUROSCI.18-01-00184.1998. [DOI] [PMC free article] [PubMed] [Google Scholar]
- 25.Lankford KL, Letourneau PC. Evidence that calcium may control neurite outgrowth by regulating the stability of actin filaments. J Cell Biol. 1989;109:1229–1243. doi: 10.1083/jcb.109.3.1229. [DOI] [PMC free article] [PubMed] [Google Scholar]
- 26.Letourneau PC, Shattuck TA. Distribution and possible interactions of actin-associated proteins and cell adhesion molecules of nerve growth cones. Development. 1989;105:505–519. doi: 10.1242/dev.105.3.505. [DOI] [PubMed] [Google Scholar]
- 27.Lewis AK, Bridgman PC. Nerve growth cone lamellipodia contain two populations of actin filaments that differ in organization and polarity. J Cell Biol. 1992;119:1219–1244. doi: 10.1083/jcb.119.5.1219. [DOI] [PMC free article] [PubMed] [Google Scholar]
- 28.Lin C, Forscher P. Growth cone advance is inversely proportional to retrograde f-actin flow. Neuron. 1995;14:763–771. doi: 10.1016/0896-6273(95)90220-1. [DOI] [PubMed] [Google Scholar]
- 29.Lin C-H, Thompson CA, Forscher P. Cytoskeletal reorganization underlying growth cone motility. Curr Opin Neurobiol. 1994;4:640–647. doi: 10.1016/0959-4388(94)90004-3. [DOI] [PubMed] [Google Scholar]
- 30.Lin CH, Espreafico EM, Mooseker MS, Forscher P. Myosin drives retrograde F-actin flow in neuronal growth cones. Neuron. 1996;16:769–782. doi: 10.1016/s0896-6273(00)80097-5. [DOI] [PubMed] [Google Scholar]
- 31.Maciver SK, Zot H, Pollard TD. Charaterization of actin filament severing by actophorin from Acanthomoeba castellanii. J Cell Biol. 1991;115:1611–1620. doi: 10.1083/jcb.115.6.1611. [DOI] [PMC free article] [PubMed] [Google Scholar]
- 32.MacLean-Fletcher S, Pollard TD. Mechanisms of action of cytochalasin B on actin. Cell. 1980;20:329–341. doi: 10.1016/0092-8674(80)90619-4. [DOI] [PubMed] [Google Scholar]
- 33.Mattson M, Kater SB. Calcium regulation of neurite elongation and growth cone motility. J Neurosci Res. 1987;7:4034–4043. doi: 10.1523/JNEUROSCI.07-12-04034.1987. [DOI] [PMC free article] [PubMed] [Google Scholar]
- 34.Mattson MP, Guthrie PB, Kater SB. Intracellular messengers in the generation and degeneration of hippocampal neuroarchitecture. J Neurosci Res. 1988;21:447–464. doi: 10.1002/jnr.490210236. [DOI] [PubMed] [Google Scholar]
- 35.Meberg PJ, Ono S, Minamide LS, Takahashi M, Bamburg JR. Actin depolymerizing factor and cofilin phosphorylation dynamics: response to signals that regulate neurite extension. Cell Motil Cytoskel. 1998;39:172–190. doi: 10.1002/(SICI)1097-0169(1998)39:2<172::AID-CM8>3.0.CO;2-8. [DOI] [PubMed] [Google Scholar]
- 36.Neely MD, Gesemann M. Disruption of microfilaments in growth cones following depolarization and calcium influx. J Neurosci. 1994;14:7511–7520. doi: 10.1523/JNEUROSCI.14-12-07511.1994. [DOI] [PMC free article] [PubMed] [Google Scholar]
- 37.Neely MD, Macaluso E. Motile areas of leech neurites are rich in microfilaments and two actin-binding proteins: gelsolin and profilin. Proc Royal Soc Lond B Biol Sci. 1997;264:1701–1706. doi: 10.1098/rspb.1997.0236. [DOI] [PMC free article] [PubMed] [Google Scholar]
- 38.Noegel A, Witke W, Schleicher M. Calcium-sensitive nonmuscle α-actinin contains EF-hand structures and highly conserved regions. FEBS Lett. 1987;221:391–396. doi: 10.1016/0014-5793(87)80962-6. [DOI] [PubMed] [Google Scholar]
- 39.Obrietan K, van den Pol AN. Growth cone calcium elevation by GABA. J Comp Neurol. 1996;372:167–175. doi: 10.1002/(SICI)1096-9861(19960819)372:2<167::AID-CNE1>3.0.CO;2-1. [DOI] [PubMed] [Google Scholar]
- 40.Ohbayashi K, Fukura H, Inoue HK, Komiya Y, Igarashi M. Stimulation of L-type Ca2+ channel in growth cones activates two independent signaling pathways. J Neurosci Res. 1998;51:682–696. doi: 10.1002/(SICI)1097-4547(19980315)51:6<682::AID-JNR3>3.0.CO;2-7. [DOI] [PubMed] [Google Scholar]
- 41.Okabe S, Hirokawa N. Actin dynamics in growth cones. J Neurosci. 1991;11:1918–1929. doi: 10.1523/JNEUROSCI.11-07-01918.1991. [DOI] [PMC free article] [PubMed] [Google Scholar]
- 42.Pollard TD. Rate constants for the reactions of ATP-and ADP-actin with the ends of actin filaments. J Cell Biol. 1986;103:2747–2754. doi: 10.1083/jcb.103.6.2747. [DOI] [PMC free article] [PubMed] [Google Scholar]
- 43.Rehder V, Kater SB. Regulation of neuronal growth cone filopodia by intracellular calcium. J Neurosci. 1992;12:3175–3186. doi: 10.1523/JNEUROSCI.12-08-03175.1992. [DOI] [PMC free article] [PubMed] [Google Scholar]
- 44.Rochlin MW, Itoh K, Adelstein RS, Bridgman PC. Localization of myosin II A and B isoforms in cultured neurons. J Cell Sci. 1995;108:3661–3670. doi: 10.1242/jcs.108.12.3661. [DOI] [PubMed] [Google Scholar]
- 45.Sampath P, Pollard TD. Effect of cytochalasin, phalloidin, and pH on the elongation of actin filaments. Biochemistry. 1991;30:1973–1980. doi: 10.1021/bi00221a034. [DOI] [PubMed] [Google Scholar]
- 46.Sasaki Y, Hayashi K, Shirao T, Ishikawa R, Kohama K. Inhibition by drebrin of the actin-bundling activity of brain fascin, a protein localized in filopodia of growth cones. J Neurochem. 1996;66:980–988. doi: 10.1046/j.1471-4159.1996.66030980.x. [DOI] [PubMed] [Google Scholar]
- 47.Schnapp BJ, Gelles J, Sheetz MP. Nanometer-scale measurements using video light microscopy. Cell Motil Cytoskel. 1988;10:47–53. doi: 10.1002/cm.970100109. [DOI] [PubMed] [Google Scholar]
- 48.Snow DM, Atkinson PB, Hassinger TD, Letourneau PC, Kater SB. Chondroitin sulfate proteoglycan elevates cytoplasmic calcium in DRG neurons. Dev Biol. 1994;166:87–100. doi: 10.1006/dbio.1994.1298. [DOI] [PubMed] [Google Scholar]
- 49.Sobue K, Kanda K. α-Actinins, calspectin (brain spectrin or fodrin), and actin participate in adhesion and movement of growth cones. Neuron. 1989;3:311–319. doi: 10.1016/0896-6273(89)90255-9. [DOI] [PubMed] [Google Scholar]
- 50.Suter D, Forscher P. An emerging link between cytoskeletal dynamics and cell adhesion molecules in growth cone guidance. Curr Opin Neurobiol. 1998;8:106–116. doi: 10.1016/s0959-4388(98)80014-7. [DOI] [PubMed] [Google Scholar]
- 51.Svitkina TM, Verkhovsky AB, McQuade KM, Borisy GG. Analysis of the actin-myosin II system in fish epidermal keratocytes: mechanism of cell body translocation. J Cell Biol. 1997;139:397–415. doi: 10.1083/jcb.139.2.397. [DOI] [PMC free article] [PubMed] [Google Scholar]
- 52.Tanaka E, Sabry J. Making the connection: cytoskeletal rearrangements during growth cone guidance. Cell. 1995;83:171–176. doi: 10.1016/0092-8674(95)90158-2. [DOI] [PubMed] [Google Scholar]
- 53.Tanaka J, Kira M, Sobue K. Gelsolin is localized in neuronal growth cones. Dev Brain Res. 1993;76:268–271. doi: 10.1016/0165-3806(93)90217-x. [DOI] [PubMed] [Google Scholar]
- 54.Tsuda Y, Hironori Y, Ishijima A, Yanagida T. Torsional rigidity of single actin filaments and actin-actin breaking force under torsion measured directly by in vitro micromanipulation. Proc Natl Acad Sci USA. 1996;93:12937–12942. doi: 10.1073/pnas.93.23.12937. [DOI] [PMC free article] [PubMed] [Google Scholar]
- 55.Waterman-Storer CM, Salmon ED. Actomyosin-based retrograde flow of microtubules in the lamella of migrating epithelial cells influences microtubule dynamic instability and turnover and is associated with microtubule breakage and treadmilling. J Cell Biol. 1997;139:417–434. doi: 10.1083/jcb.139.2.417. [DOI] [PMC free article] [PubMed] [Google Scholar]
- 56.Welch M, Mallavarapu A, Rosenblatt J, Mitchison TJ. Actin dynamics in vivo. Curr Opin Cell Biol. 1997;9:54–61. doi: 10.1016/s0955-0674(97)80152-4. [DOI] [PubMed] [Google Scholar]
- 57.Welnhofer EA, Zhao L, Cohan CS. Actin dynamics and organization during growth cone morphogenesis in Helisoma neurons. Cell Motil Cytoskel. 1997;37:54–71. doi: 10.1002/(SICI)1097-0169(1997)37:1<54::AID-CM6>3.0.CO;2-H. [DOI] [PubMed] [Google Scholar]
- 58.Williams DK, Cohan CS. The role of conditioning factors in the formation of growth cones and neurites from the axon stump after axotomy. Dev Brain Res. 1994;81:89–104. doi: 10.1016/0165-3806(94)90071-x. [DOI] [PubMed] [Google Scholar]
- 59.Witke W, Hofmann A, Koppel B, Schleicher M, Noegel AA. The Ca(2+)-binding domains in non-muscle type α-actinin: biochemical and genetic analysis. J Cell Biol. 1993;121:599–606. doi: 10.1083/jcb.121.3.599. [DOI] [PMC free article] [PubMed] [Google Scholar]
- 60.Yamakita Y, Ono S, Matsumura F. Phosphorylation of human fascin inhibits its actin binding and bundling activities. J Biol Chem. 1996;271:12632–12638. doi: 10.1074/jbc.271.21.12632. [DOI] [PubMed] [Google Scholar]
- 61.Zheng JQ, Felder M, Conner JA, Poo M. Turning of nerve growth cones induced by neurotransmitters. Nature. 1994;368:140–143. doi: 10.1038/368140a0. [DOI] [PubMed] [Google Scholar]
- 62.Zheng JQ, Poo MM, Conner JA. Calcium and chemotropic turning of nerve growth cones. Perspect Dev Neurobiol. 1996;4:205–213. [PubMed] [Google Scholar]