

Abstract
mRNA for the α-subunit of CaMKII is abundant in dendrites of neurons in the forebrain (Steward, 1997). Here we show that tetanic stimulation of the Schaffer collateral pathway causes an increase in the concentration of α-CaMKII in the dendrites of postsynaptic neurons. The increase is blocked by anisomycin and is detected by both quantitative immunoblot and semiquantitative immunocytochemistry. The increase in dendritic α-CaMKII can be measured 100–200 μm away from the neuronal cell bodies as early as 5 min after a tetanus. Transport mechanisms for macromolecules from neuronal cell bodies are not fast enough to account for this rapid increase in distal portions of the dendrites. Therefore, we conclude that dendritic protein synthesis must produce a portion of the newly accumulated CaMKII. The increase in concentration of dendritic CaMKII after tetanus, together with the previously demonstrated increase in autophosphorylated CaMKII (Ouyang et al., 1997), will produce a prolonged increase in steady-state kinase activity in the dendrites, potentially influencing mechanisms of synaptic plasticity that are controlled through phosphorylation by CaMKII.
Keywords: long-term potentiation, protein phosphorylation, synapse, synaptic regulation, synaptic plasticity, immunocytochemistry, hippocampal slices
The presence of polyribosomes in neuronal dendrites in the CNS has been recognized for some time (Steward and Banker, 1992; Steward, 1997). Recent studies have shown that these polyribosomes can carry out protein synthesis (Crino and Eberwine, 1996; Torre and Steward, 1996), and that membrane vesicles containing protein components of the Golgi apparatus are also found in dendrites (Gardiol et al., 1999). Furthermore, synaptic stimulation in the presence of carbachol can increase incorporation of tritiated leucine into dendrites in area CA1 (Feig and Lipton, 1993). It has been postulated that proteins synthesized in dendrites might contribute to the input-specific nature of long-term potentiation (LTP) (Schuman, 1997).
A subset of mRNAs is present at high concentration far out into the dendrites and is not selectively concentrated in neuronal cell bodies (Steward, 1997). One of the most abundant of these in forebrain neurons is the message encoding the α-subunit of CaMKII (Burgin et al., 1990;Mackler et al., 1992; Martone et al., 1996; Steward, 1997). The CaM kinase II holoenzyme is an oligomer comprising two homologous catalytic subunits, a 50 kDa α-subunit and a 60 kDa β-subunit (Bennett et al., 1983). The CaMKII protein is expressed at high levels in excitatory principal neurons in the forebrain (Benson et al., 1992; Sik et al., 1998; Zhang et al., 1999), particularly in the hippocampus where it is ∼2% of total protein (Erondu and Kennedy, 1985). Its high concentration in forebrain is the result of a high level of expression of the α-subunit (Miller and Kennedy, 1985). The kinase is present in cell bodies, axon terminals, and dendrites, where it concentrates in postsynaptic densities opposite glutamatergic terminals (Kennedy, 1998).
CaMKII becomes autophosphorylated upon activation by Ca2+/calmodulin. The autophosphorylated form remains active even in the absence of high Ca2+ until it is dephosphorylated by cellular phosphatases (Miller and Kennedy, 1986; Miller et al., 1988;Hanson et al., 1989). In a recent study, we made use of a semiquantitative immunohistochemical method for visualizing autophosphorylated CaMKII (P-CaMKII) in fixed hippocampal slices (Kindler and Kennedy, 1996; Ouyang et al., 1997) to demonstrate that 30 min after tetanization of the Schaffer collateral pathway, substantial increases in autophosphorylation of CaMKII can be seen in dendrites and cell bodies of principal neurons in the portion of area CA1 located near the stimulating electrode (Ouyang et al., 1997). In the course of that study, we also made the unexpected observation that immunostaining for nonphospho-CaMKII (NP-CaMKII) was increased at 30 min after tetanus but only in apical dendrites in stratum radiatum, not in neuronal cell bodies. The increase in both P-CaMKII and NP-CaMKII was blocked by APV, a blocker of NMDA-type glutamate receptors, and did not occur in slices in which LTP did not develop after tetanus (Ouyang et al., 1997). We postulated that the increase in staining for NP-CaMKII triggered by the tetanic stimulation might reflect either accumulation of α-subunit of CaMKII synthesized in dendrites or a change in the disposition of the kinase holoenzyme making it more accessible to antibody labeling.
Here we have tested in two ways the hypothesis that the increase reflects accumulation of newly synthesized α-CaMKII. We examined the effect of the protein synthesis inhibitor anisomycin on the increase in staining for NP-CaMKII after tetanus. We also directly measured the amounts of α-subunit of CaMKII in tetanized and control halves of stratum radiatum after microdissection of the slices. Both tests support the conclusion that the increased staining for NP-CaMKII 30 min after tetanus results from synthesis of new CaMKII in the stimulated neurons. Furthermore, we report that an increase in CaMKII protein can be visualized 100–200 μm out into the dendrites 5 min after the tetanic stimulation. This result rules out the neuronal cell body as the sole source of new CaMKII in the dendrites, because transport from the cell body is not rapid enough to account for the increase in CaMKII protein ≥100 μm from the cell body 5 min after tetanus (Brady and Lasek, 1982; see Discussion). These experiments demonstrate for the first time that tetanic stimulation of synapses can rapidly increase the concentration of a signaling molecule in postsynaptic dendrites via dendritic protein synthesis.
MATERIALS AND METHODS
Antibodies. Mouse monoclonal antibody 22B1 (anti-P-CaMKII; Affinity Bioreagents, Golden, CO; www.bioreagents.com) recognizes CaM kinase II only when it is autophosphorylated at threonine 286 (Patton et al., 1993). A rabbit polyclonal antibody that recognizes CaM kinase II only when it is not phosphorylated at threonine 286 (anti-NP-CaMKII) was prepared by injection of a synthetic peptide into rabbits and was affinity-purified as described (Patton et al., 1993). Fluorescein-conjugated goat anti-mouse antibody (Cappel, Organon Teknika, Durham, NC) was used to visualize bound 22B1. Cy3-conjugated goat anti-rabbit antibody (Chemicon International, Temecula, CA) was used to visualize bound anti-NP-CaMKII. Dilutions of reagents were as described previously (Ouyang et al., 1997).
Electrophysiology. Electrophysiological experiments were conducted as described previously (Ouyang et al., 1997). Briefly, young adult male Sprague Dawley rats (6–8 weeks old) were anesthetized with halothane and then decapitated, and the brains were placed in ice-cold, oxygenated artificial CSF (ACSF; 119 mm NaCl, 2.5 mm KCl, 1.3 mm MgSO4, 2.5 mm CaCl2, 1.0 mmNaH2PO4, 26.2 mm NaHCO3, and 11.0 mmd-glucose). Hippocampal slices (500 μm) were prepared with a manual tissue chopper and maintained in an interface chamber gassed with 95% O2 plus 5% CO2 at room temperature for at least 2 hr before recording. Experiments were performed with slices from the middle third of the hippocampus. For electrophysiological manipulations, slices were transferred to a submersion chamber and superfused continuously with oxygenated ACSF at room temperature. Electrophysiology was performed according to a standard “two-pathway” paradigm. Two bipolar stimulating electrodes were placed about 800 μm apart in stratum radiatum of area CA1. A glass recording electrode filled with ACSF was placed in the tissue between them to monitor synaptic potentials. Both stimulating electrodes delivered a monitoring stimulus (single shock) every 30 sec, and the slope of the field EPSPs was recorded. The baseline slope was monitored for at least 30 min or until it became stable, and then tetanic stimulation (four trains of 100 Hz for 1 sec with an intertrain interval of 30 sec) was delivered through one of the stimulating electrodes. Responses were monitored for an additional 5 or 30 min, after which the slices were fixed in ice-cold fixative as described below. An adjacent slice from the same animal was placed in the recording chamber but received no electrical stimulation (chamber control). For some experiments, 40 μm anisomycin (Sigma, St. Louis, MO) was added to the ACSF 30 min before the tetanus was applied.
Data from six slices stimulated in the absence of anisomycin were reported previously (Ouyang et al., 1997); four test slices from the same animals as those used for recording in the presence of anisomycin were tetanized in the absence of anisomycin, developed LTP measured at 30 min, and were processed through the immunocytochemical analysis for P- and NP-CaMKII. The results from these four slices were not statistically different from the previously reported experiments, and thus the two sets of numbers were pooled.
We found that the depth of placement of the stimulating electrodes influenced the extent to which increases in staining were confined to one region of area CA1 (data not shown). In a series of experiments, stimulating electrodes were lowered toward the surface of the slice in the half of stratum radiatum nearest area CA3, until the point at which a small EPSP could first be recorded from a test pulse through the electrode, and then advanced 100, 150, or 250 μm further into the slice. Tetanic stimulation from electrodes advanced 100 μm into the slice usually produced increased staining for phosphokinase largely confined to the tetanized half of area CA1; those advanced 150 μm produced increased staining that usually extended into the “nontetanized” half of area CA1; and finally, electrodes advanced 250 μm often produced increased staining throughout area CA1; in superficial sections of these slices, the increased staining was often more pronounced in the half of CA1 opposite the tetanizing electrode. We interpret our findings to mean that in slices cut in our laboratory, from approximately the middle third of the hippocampus, the average trajectory of Schaffer collateral axons through area CA1 is not quite parallel to the plane of the slice; rather, axons tend to travel from one face of the slice in the region of stratum radiatum near CA3 toward the other face of the slice as they move toward the region of CA1 near the subiculum. Thus, on average, axons in stratum radiatum near area CA3 stimulated more superficially (by electrodes advanced 100 μm) would be cut at the surface of the slice before traversing to the opposite region of the slice near the subiculum. In contrast, axons stimulated at a deeper level (by electrodes advanced 250 μm) more often traverse the full-length of area CA1 before reaching the top of the slice. For this reason, in most of the experiments reported here, stimulating electrodes were advanced only 100 μm into the slice to take advantage of the anatomical arrangement of axons.
Immunohistochemistry. Immunohistochemical staining was performed as described previously (Ouyang et al., 1997). Briefly, slices were fixed by rapid immersion in ice-cold 4% paraformaldehyde plus 0.2% glutaraldehyde in 0.1 m sodium phosphate buffer, pH 7.4, and kept on ice for 1 hr. Fixed slices were stored in ice-cold 0.02 m phosphate buffer, pH 7.4, and 0.9% NaCl (PBS) overnight. Five to six 50 μm sections were cut from each slice with a vibratome (Pelco; Ted Pella, Redding, CA). Sections were permeabilized with 0.7% Triton X-100 in PBS for 1 hr and then rinsed with 0.1m glycine in PBS for another hour followed by 1% Na borohydride in distilled water for 20 min. Sections were preblocked by incubation with 5% normal goat serum in phosphate buffer plus 0.45m NaCl (HSP) for 90 min. Sections were incubated with a mixture of the two primary antibodies overnight at 4°C. After washing, the sections were incubated with a mixture of two secondary antibodies (fluorescein-labeled for P-CaMKII and Cy3-labeled for NP-CaMKII) for 1 hr and washed free of unbound antibodies. Sections were mounted with an anti-fade medium (4% n-propyl gallate in 100 mm NaHCO3, pH 8.7, plus 80% glycerol).
Fluorescein and Cy3 fluorescence images of the CA1 region were obtained from the central plane of each section with a Zeiss (Thornwood, NY) 310 laser-scanning confocal microscope with a 10× lens [numerical aperture (NA), 0.3; pinhole, 20; theoretical optical section (OS), ∼20 μm], 20× lens (NA, 0.6; pinhole, 20; OS, ∼5 μm), or 40× lens (NA, 1.3; pinhole, 20; OS, ∼1.2 μm), as described previously (Ouyang et al., 1997). Contrast and brightness settings were optimized in each experiment for the image with the brightest staining so the data filled the dynamic range of 256 brightness units without saturation. The settings were then kept constant for all images in a single experiment. Contrast and brightness settings must be determined separately for the Cy3 and fluorescein channels; thus absolute image brightnesses are not directly comparable between the NP and P images. All data were analyzed as a ratio between the tetanized and nontetanized region of each section (Ouyang et al., 1997). Images were saved as tagged image file format (TIFF) files and transferred to a Macintosh computer. For illustration, images were colorized and assembled into montages with Photoshop software (Adobe Systems, Mountain View, CA).
Occasionally staining for P- and/or NP-CaMKII in a chamber control slice showed >10% difference between the two regions of area CA1 in three or more sections. When this occurred, slices from the same animal were not analyzed further, and the data were not included in the pooled data.
Semiquantitative image analysis. Semiquantitative analysis was carried out as described previously (Ouyang et al., 1997). Each TIFF image obtained with the confocal microscope is composed of 512 × 512 pixels. Each pixel has a brightness value ranging from 0 to 255. To obtain quantitative data we used MacPhase software (Otter Solution, Whitesboro, NY) to draw regions of interest (ROIs) in the tetanized and control regions of the original images and calculate the average brightness value of the pixels within each ROI. For data from stratum radiatum, each ROI was a rectangle of 50 × 100 pixels positioned as described previously (Ouyang et al., 1997). For data from pyramidal cell bodies, each ROI was drawn free hand to encircle a region of cell bodies. The data were transferred to Excel (Microsoft, Redmond, WA) for statistical analysis. The ratio of average brightness in the tetanized region of area CA1 to that in the control region was calculated after summing averaged brightness data (Bave) from three adjacent sections that showed the highest ratios. A corresponding ratio was calculated from each chamber control slice. The normalized ratio was obtained by dividing the ratio for the tetanized slice by the ratio for the chamber control slice.
Quantitative immunoblots. Thirty minutes after a tetanus slices were flash frozen. Stratum radiatum of area CA1 (lacking cell bodies) was microdissected under a dissecting microscope by one investigator (Y.O.) and cut in half so that one half contained the region surrounding the tetanizing electrode and the other half contained the region surrounding the control electrode. Halves of stratum radiatum were homogenized in SDS-PAGE sample buffer containing 3% SDS, 2% β-mercaptoethanol, and 5% glycerol in 60 mmTris buffer, pH 6.7. The homogenates of individual halves of stratum radiatum were labeled with a code number, boiled for 5 min, and stored at −20°C. A second investigator (A.R.) then determined the protein concentration by a modified Lowry method (Peterson, 1983). Equal amounts of protein were loaded in triplicate on gels for SDS-PAGE. Electrophoresed proteins were transferred to polyvinylidene difluoride membranes. After incubation with a primary antibody, 6G9 (1:1000; Affinity Bioreagents), that recognizes both phosphorylated and nonphosphorylated α-CaMKII, the membranes were labeled with secondary antibody conjugated to fluorescein (1:100; Amersham, Arlington Heights, IL). After washing and drying, the membranes were scanned with a STORM system (Molecular Dynamics; Sunnyvale, CA). The resultant data were digitized and then analyzed with ImageQuant software provided by Molecular Dynamics. Data from lanes containing an unknown sample were compared with standard curves made with forebrain CaMKII purified as previously described (Miller and Kennedy, 1985), and the amount of α-subunit (nanograms per microgram of total protein) was determined. Finally, the data were decoded, and the ratios of α-subunit in tetanized and nontetanized regions of slices were calculated (see Table 2).
Table 2.
Measurement of α-subunit of CaMKII by quantitative immunoblot
| α-CaMKII (ng/μg total protein) | Immunofluorescence ratio | ||||||
|---|---|---|---|---|---|---|---|
| Condition | Tetanized | Control | Ratio | Normalized | Sister | Ratio | Normalized |
| LTP (29%) | 58 | 41 | 1.42 | 1.60 | LTP (13%) | 1.16 | 1.19 |
| Chamber | 45 | 50 | 0.89 | Chamber | 0.98 | ||
| LTP (47%) | 39 | 27 | 1.45 | 1.45 | LTP (42%) | 1.07 | 1.07 |
| Chamber | 39 | 39 | 1.00 | Chamber | 1.00 | ||
| LTP (27%) | 36 | 40 | 0.91 | 0.96 | LTP (11%) | 0.94 | 1.02 |
| Chamber | 44 | 46 | 0.95 | Chamber | 0.93 | ||
| LTP (18%) | 31 | 45 | 0.70 | 1.14 | LTP (19%) | 1.33 | 1.29 |
| Chamber | 16 | 26 | 0.62 | Chamber | 1.03 | ||
| LTP (26%) | 24 | 24 | 1.00 | 1.61 | LTP (43%) | 1.03 | 0.99 |
| Chamber | 28 | 42 | 0.62 | Chamber | 1.04 | ||
| LTP (54%) | 38 | 25 | 1.52 | 1.27 | LTP (18%) | 1.03 | 1.03 |
| Chamber | 39 | 33 | 1.20 | Chamber | 1.00 | ||
| LTP (17%) | 59 | 50 | 1.19 | 1.12 | LTP (13%) | 1.22 | 1.16 |
| Chamber | 38 | 36 | 1.06 | Chamber | 1.05 | ||
The amount of α-subunit of CaMKII in each sample was calculated from immunoblots as described in Materials and Methods. Raw values were multiplied by 0.75 to correct for the fact that the α-subunit makes up ∼75% of the mass of CaMKII holoenzymes in the forebrain. Changes in immunofluorescent staining for NP-CaMKII were calculated in sister slices as described in Materials and Methods.
RESULTS
The protein synthesis inhibitor anisomycin blocks the increase in NP-CaMKII in dendrites 30 min after a tetanus
Seven slices were tetanized in the presence of anisomycin, and 10 were tetanized in the absence of anisomycin in a two-pathway paradigm as described in Materials and Methods. All 17 of the control and anisomycin-perfused slices developed LTP of magnitude ≥15% in the tetanized pathway measured 30 min after tetanus, whereas the EPSP in the nontetanized pathway remained stable. “Chamber control” slices (16 slices) were superfused alongside the stimulated slices from the same animal but received no electrical stimulation. Slices were fixed, stained, and examined by laser-scanning confocal microscopy to visualize the distribution of P-CaMKII and NP-CaMKII as described previously (Ouyang et al., 1997).
Figure 1 is an example of images obtained with a 10× lens. The slice shown in Figure 1, A andB, was not treated with anisomycin. The slice shown in Figure 1, C and D, was incubated in anisomycin before and during the tetanus. The presence of anisomycin did not affect the increase in staining for P-CaMKII in the tetanized region of the slice (compare tetanized with control regions), but it suppressed the increased staining for NP-CaMKII. These results were analyzed semiquantitatively as described previously (Ouyang et al., 1997) and in Materials and Methods (Table 1, Fig.2). In the absence of anisomycin, the increase in staining for both P-CaMKII and NP-CaMKII in the tetanized region of stratum radiatum 30 min after the tetanus is statistically significant, as observed previously (Ouyang et al., 1997). In neuronal cell bodies, again as observed previously, only staining for P-CaMKII is significantly increased in the tetanized region. In the presence of anisomycin, the increase in staining for P-CaMKII is similar to that in the absence of anisomycin. However, the increase in staining for NP-CaMKII in stratum radiatum is abolished, consistent with the notion that the increase of NP-CaMKII in dendrites requires protein synthesis.
Fig. 1.
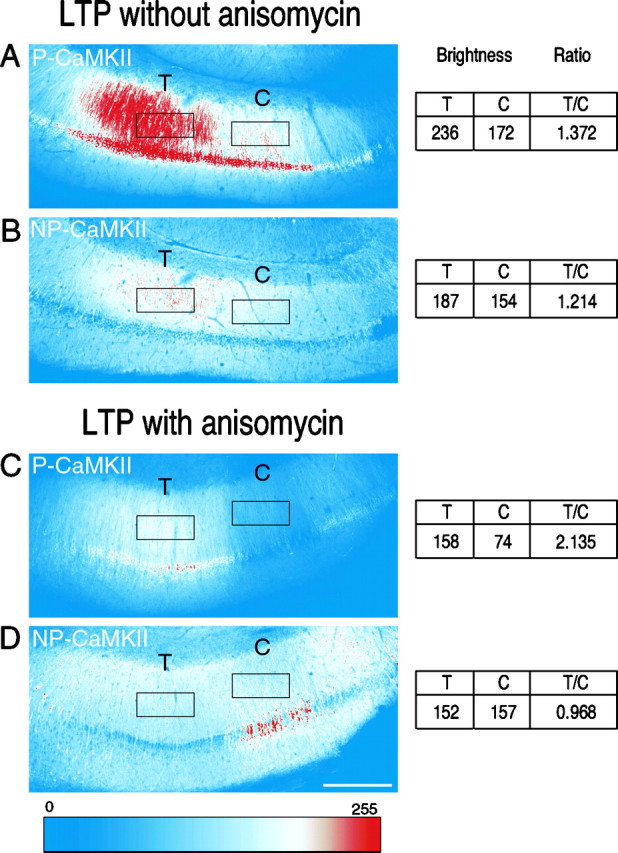
Staining for P-CaMKII and NP-CaMKII in area CA1 from representative sections of hippocampal slices fixed 30 min after tetanic stimulation in the absence or presence of anisomycin.A, B, Slices were fixed 30 min after a tetanus was delivered (see Materials and Methods) through a stimulating electrode located in the regions of area CA1 marked T. A stimulating electrode that delivered only test stimulation was located in regions marked c. Sections (50 μm) cut from the slices were double-immunolabeled for P-CaMKII (A) and NP-CaMKII (B) as described in Materials and Methods. Montages of images were converted into color according to the color look-up table depicted at the bottom. The figure shows labeling of one representative section with rectangular ROIs used to compute the ratio of staining between tetanized and control regions (see below and Materials and Methods). Increased labeling for both P-CaMKII (A) and NP-CaMKII (B) is visible in dendrites in stratum radiatum in the region that received tetanic stimulation, decreasing with distance from the tetanizing electrode as described previously (Ouyang et al., 1997). (Compare the region of stratum radiatum labeledT with that labeled c.) The cell bodies of pyramidal neurons in the tetanized region also show stronger labeling for P-CaMKII but not for NP-CaMKII. C,D, Images of a section from a different slice tetanized in the presence of anisomycin. Labeling for P-CaMKII (C) is increased in cell bodies and dendrites in the tetanized region of the section (Compare the region of stratum radiatum labeled T with that labeled c.) In contrast, no increase in labeling for NP-CaMKII (D) is visible in dendrites or cell bodies in the tetanized region compared with those in the control region. Note inD that staining for NP-CaMKII is higher in cell bodies in the control region than in the tetanized region. This pattern was observed occasionally and is the complement of the pattern of staining for P-CaMKII in the same section (C); it likely reflects a reduction in staining for NP-CaMKII in the tetanized cell bodies caused by increased autophosphorylation of CaMKII without a net increase in amount of CaMKII. It is important to note that absolute brightness is not directly comparable between sections, because the microscope contrast settings were chosen in each experiment to fill the 8 bit scale in the brightest of all the sections and then held constant for that experiment. Furthermore, contrast settings are set separately for each fluorophore. Comparison of brightness values is only meaningful between tetanized and control regions of the individual sections averaged over many sections. To make this comparison, ROIs shown as black rectangles were chosen as described in Materials and Methods. The average brightness value in each ROI was recorded as shown to the right. The ratiosT/C were calculated for the three brightest sections from each slice and averaged (Table 1, Fig. 2). Scale bar, 250 μm.
Table 1.
Ratio of staining in tetanized region to that in control region in slices fixed 30 min after tetanus
| Experimental condition | n | P-CaMKII | NP-CaMKII | ||
|---|---|---|---|---|---|
| Ratio | SEM | Ratio | SEM | ||
| Dendrites | |||||
| Chamber control | 9 | 1.018 | 0.022 | 0.997 | 0.022 |
| Tetanized (LTP) | 10 | 1.153 | 0.044 | 1.178 | 0.032 |
| Chamber + anisomycin | 7 | 1.007 | 0.023 | 0.987 | 0.015 |
| LTP + anisomycin | 7 | 1.218 | 0.079 | 1.015 | 0.015 |
| Cell bodies | |||||
| Chamber control | 9 | 1.102 | 0.060 | 1.007 | 0.082 |
| Tetanized (LTP) | 10 | 1.269 | 0.065 | 0.973 | 0.073 |
| Chamber + anisomycin | 7 | 1.015 | 0.057 | 0.961 | 0.043 |
| LTP + anisomycin | 7 | 1.271 | 0.120 | 0.960 | 0.061 |
Data are calculated from brightness values collected from images of area CA1 in sections of slices fixed 30 min after tetanus, as described in Materials and Methods and by Ouyang et al. (1997).
Fig. 2.

Quantitative analysis of the ratio of staining in the tetanized region of area CA1 to that in the control region 30 min after tetanic stimulation in the presence and absence of anisomycin. The data from Table 1 are plotted as percent deviation from 1.0 of the ratio of brightness in the tetanized region to brightness in the control region in stratum radiatum and in the cell body layer of area CA1. Ratios from chamber control slices and from slices in which LTP was induced by tetanus in the presence and absence of anisomycin are shown side by side. The data are the average ± SEM of 27 sections from nine chamber control slices and 30 sections from 10 tetanized slices treated in the absence of anisomycin and 14 sections each from seven chamber control slices and seven tetanized slices treated in the presence of anisomycin. A, Percent change in NP-CaMKII between tetanized and control regions of sections. ANOVA followed byt test showed that the change in NP-CaMKII in stratum radiatum after induction of LTP by tetanus is abolished in the presence of anisomycin. B, Percent change in P-CaMKII between tetanized and control regions of sections. No significant differences were observed between brightness values for P-CaMKII in the presence and absence of anisomycin. Solid bars, Control without anisomycin; open bars, with anisomycin; *p < 0.002.
The amount of α-subunit of CaMKII increases in dendrites 30 min after a tetanus as measured by quantitative Western blot
To substantiate that the increase in staining for NP-CaMKII after tetanus reflects a true increase in amount of CaMKII rather than, for example, unmasking of the antibody epitope, we measured the amount of CaMKII in microdissected halves of hippocampal slices after physiological treatments. Experiments were performed to generate pairs of tetanized slices and chamber controls as described above. Thirty minutes after the tetanus, stratum radiatum was dissected from these slices and divided in half. The amount of α-CaMKII in each half was determined by comparison with standard lanes containing CaMKII purified from forebrain as described in Materials and Methods. Figure3 shows an example of one such immunoblot, demonstrating that measurements of standard α-CaMKII and α-CaMKII in the unknown samples were made in the linear range of the assay. Ratios of α-CaMKII concentration in the tetanized and control regions of each slice were determined for seven pairs of experimental and chamber control slices (Table 2, Fig.4). In six of the seven slices, an increase in the amount of α-CaMKII in the tetanized region was measured when compared with chamber controls. The data reveal a statistically significant increase in the amount of α-CaMKII induced by tetanus. Indeed the average percent increase (29%) measured by this technique is higher than the average percent increase calculated from the immunocytochemical data gathered from sister slices (11%). In performing the quantitative immunoblots, we were able to ensure that measurements were obtained in the linear range of the assay. It is more difficult to make a determination of the full linear range for the immunocytochemical assay, and it may be that immunocytochemical measurements move out of the linear range above a 10–15% increase. The antibody that we used for immunocytochemistry detects only NP-CaMKII, whereas the antibody used for quantitative blots detects the total α-subunit of CaMKII. Although previous measurements suggest that NP-CaMKII varies from ∼70 to 97% of total CaMKII (Molloy and Kennedy, 1991), this percentage may fall lower in dendrites or cell bodies after tetanic stimulation. Therefore, immunocytochemical measurements of NP-CaMKII may underestimate the amount of total CaMKII in the tetanized region of the slice. For this reason, we continue to describe the immunocytochemical method as semiquantitative. Nevertheless, the quantitative immunoblots confirm that we are detecting a true increase in total α-CaMKII in dendrites induced by tetanic stimulation.
Fig. 3.

Quantitative immunoblot of the α-subunit of CaMKII. A, Example of a quantitative immunoblot. Slices were tetanized as described in Materials and Methods and then frozen. Tetanized and control halves of individual slices were dissected and homogenized separately in SDS sample buffer. After determination of the protein concentration of each homogenate, samples of each (0.25 and 0.5 μg) were loaded in triplicate onto SDS-PAGE gels as described in Materials and Methods. CaMKII purified from forebrain (40 and 80 ng of α-subunit) was loaded in triplicate onto adjacent lanes as a standard. Immunoblots were prepared with a fluorescein-conjugated secondary antibody and imaged with a FluorImager. Immunoblot of a homogenate from a tetanized half of stratum radiatum is labeledT. The immunoblot of the corresponding control half of stratum radiatum is labeled C. B, Standard curve of fluorescence intensity plotted against nanograms of purified CaMKII. Quantitative measurements of fluorescence were made as described in Materials and Methods. C, Fluorescence intensity of α-subunit bands from tetanized (T) and control (C) samples shown inA, plotted against a microgram protein sample. The concentration of α-subunit in each homogenate (Fig. 4) was calculated as nanograms per microgram of protein by comparison with the standard curve. Both the standard curve (B) and values for the unknown samples (C) were measured in the linear range of the assay.
Fig. 4.
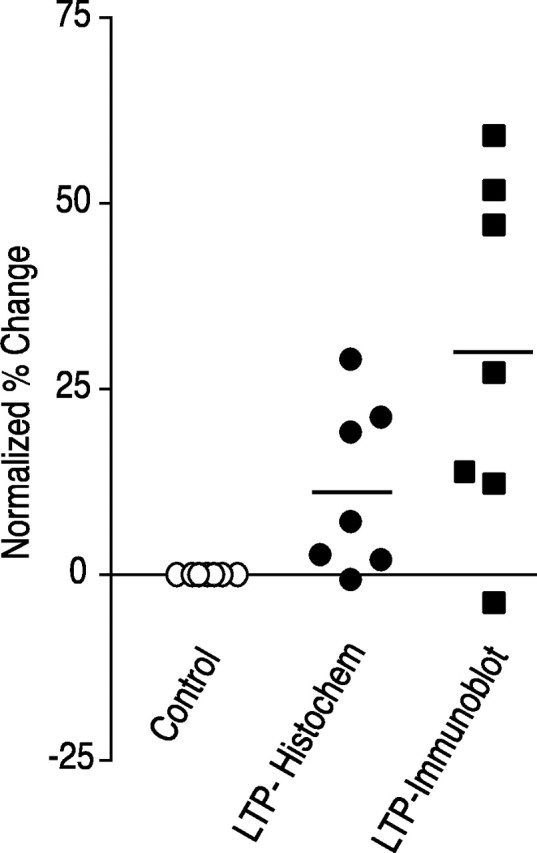
Comparison of increase in CaMKII in tetanized regions of slices measured by immunofluorescence and by quantitative immunoblot. Data from the seven experiments summarized in Table 2 are plotted after normalization to chamber controls. The average percent change measured by immunofluorescent labeling is 11.5 ± 4.0 (p < 0.02 compared with chamber controls). The average percent change measured by quantitative immunoblot is 29.6 ± 8.3 (p < 0.01 compared with chamber controls).
An increase of NP-CaMKII is visible in dendrites 5 min after tetanus
How soon after a tetanus can we detect the increase in amount of α-CaMKII in dendrites? We performed a set of experiments identical to those reported in Figures 1 and 2, except that slices were placed in ice-cold fixative 5 min after delivery of the tetanus. To control for general health of the slices, in each experiment a slice from the same animal was first tested for development of LTP by recording for 30 min after a tetanus. If LTP was not observed in the test slice, the experiment was not continued with slices from that animal. After we obtained LTP in the test slice, successive slices that showed an increase over baseline in slope of the EPSP at 5 min after the tetanus, as shown in Figure 5, were fixed and processed for immunocytochemistry. Examples of images of slices taken with a 10× lens in these experiments are shown in Figure6. The semiquantitative imaging data from 11 experiments performed without anisomycin, and seven experiments performed in the presence of anisomycin are summarized in Table3 and Figure7. The results show that increases in NP- and P-CaMKII are both visible 5 min after a tetanus. Increased staining in the tetanized region of the slice can be seen throughout the length of dendrites from near the cell bodies to >200 μm way from the cell bodies (Fig. 8, middle). The magnitude of the effect on NP-CaMKII appears lower at 5 min than at 30 min (compare Figs. 2, 7). In contrast to 30 min after tetanus, staining for NP-CaMKII 5 min after tetanus is higher in both cell bodies and dendrites in the tetanized region. The increase at 5 min in NP-CaMKII in both cell bodies and dendrites is blocked in the presence of anisomycin. Examination at high magnification of sections of slices fixed 5 min after tetanus reveals that the increases in NP-CaMKII are confined to patches along dendrites and are occasionally visible in spines (Fig. 8A). This distribution of high NP-CaMKII in tetanized neurons 100–200 μm from the cell bodies is consistent with new synthesis of α-subunit by polyribosomes in dendrites near sites of synaptic activation followed by movement of some of the newly synthesized subunit into adjacent spines.
Fig. 5.

Electrophysiological recording from a slice that was fixed for immunolabeling 5 min after tetanic stimulation. The stimulation paradigm was as described in Materials and Methods. Baseline EPSPs were monitored for 30 min, and then four trains of tetanic stimulation (100 Hz, 1.0 sec; 30 sec intertetanus interval) were applied to one pathway (top). The slice was fixed 5 min after the first tetanus as described in Materials and Methods. The response of the control pathway (bottom) remained stable.
Fig. 6.

Staining for P-CaMKII and NP-CaMKII in area CA1 from representative sections of hippocampal slices fixed 5 min after tetanic stimulation in the absence or presence of anisomycin. Experimental treatment and analyses were exactly as described in Figure1, except that slices were fixed 5 min after a tetanus was delivered through one electrode (see Materials and Methods). A,B, Images of a section tetanized in the absence of anisomycin and fixed 5 min after the tetanus. Increased labeling for P-CaMKII (A) and NP-CaMKII (B) is measured in both cell bodies and in dendrites in stratum radiatum in the region that received tetanic stimulation. C, D, Images of a section from a different slice tetanized in the presence of anisomycin and fixed 5 min after the tetanus. Labeling for P-CaMKII (C) is increased in cell bodies and dendrites in the tetanized region of the section. In contrast, no increase in labeling for NP-CaMKII (D) is measurable in dendrites or cell bodies in the tetanized region compared with those in the control region. Scale bar, 250 μm.
Table 3.
Ratio of staining in tetanized region to that in control region in slices fixed 5 min after tetanus
| Experimental condition | n | P-CaMKII | NP-CaMKII | ||
|---|---|---|---|---|---|
| Ratio | SEM | Ratio | SEM | ||
| Dendrites | |||||
| Chamber control | 11 | 0.996 | 0.017 | 1.003 | 0.017 |
| Tetanized | 11 | 1.132 | 0.058 | 1.096 | 0.017 |
| Chamber + anisomycin | 7 | 0.99 | 0.019 | 0.998 | 0.012 |
| Tetanized + anisomycin | 7 | 1.106 | 0.033 | 0.996 | 0.009 |
| Cell bodies | |||||
| Chamber control | 11 | 0.975 | 0.030 | 1.022 | 0.043 |
| Tetanized | 11 | 1.180 | 0.082 | 1.128 | 0.065 |
| Chamber + anisomycin | 7 | 1.032 | 0.042 | 0.992 | 0.040 |
| Tetanized + anisomycin | 7 | 1.137 | 0.044 | 0.979 | 0.038 |
Data are calculated from brightness values collected from images of area CA1 in sections of slices fixed 5 min after tetanus, as described in Materials and Methods.
Fig. 7.

Quantitative analysis of the ratio of staining in the tetanized region of area CA1 to that in the control region 5 min after tetanic stimulation in the presence and absence of anisomycin. The data from Table 3 are plotted as percent deviation from 1.0 of the ratio of brightness in the tetanized region to brightness in the control region in stratum radiatum and in the cell body layer. Ratios from chamber control slices and from slices fixed 5 min after tetanus in the presence and absence of anisomycin are shown side by side. The data are the average ± SEM of 33 sections each from 11 chamber control slices and 11 tetanized slices treated in the absence of anisomycin and 21 sections each from seven chamber control slices and seven tetanized slices treated in the presence of anisomycin as described in Materials and Methods. A, Percent change in NP-CaMKII between tetanized and control regions of sections. ANOVA followed by t test indicated that staining for NP-CaMKII was significantly brighter in tetanized regions of stratum radiatum and in tetanized cell bodies 5 min after tetanus. The increases in NP-CaMKII 5 min after tetanus in the absence of anisomycin were abolished in the presence of anisomycin. B, Percent change in P-CaMKII between tetanized and control regions of sections. No significant differences were observed between brightness values for P-CaMKII in the presence and absence of anisomycin. Solid bars, Control without anisomycin; open bars, with anisomycin; *p < 0.005; **p < 0.04.
Fig. 8.
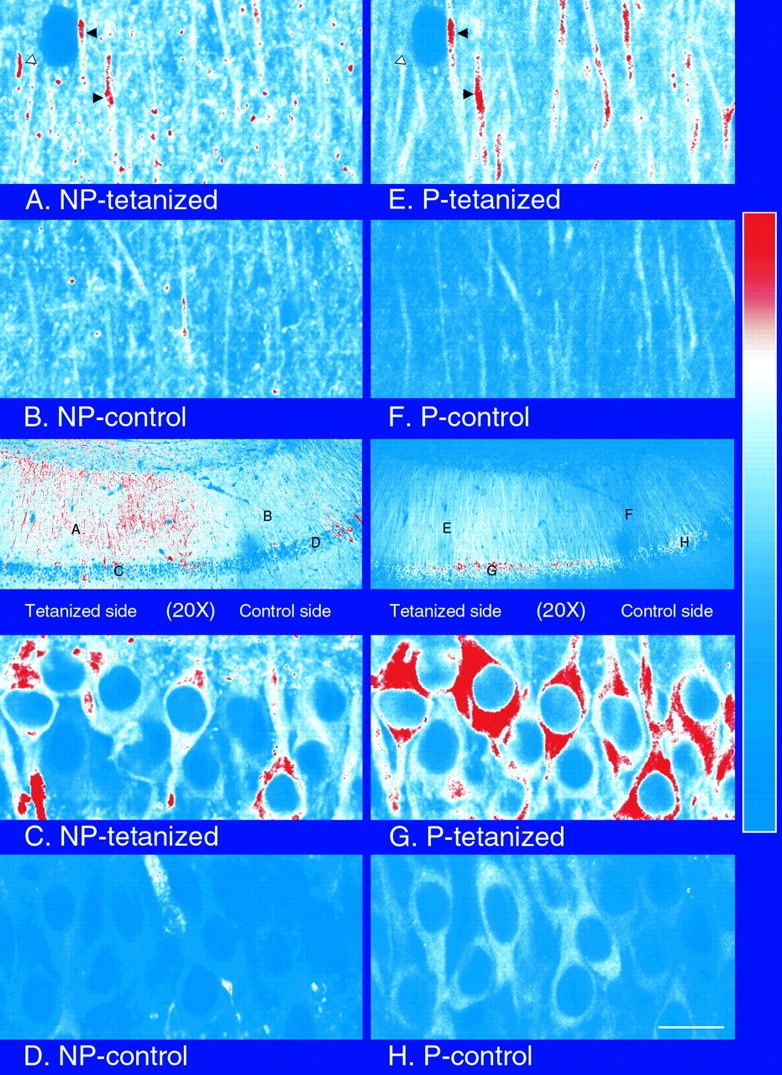
High-resolution images of staining for P-CaMKII and NP-CaMKII from a section of a slice fixed 5 min after tetanus. Images were recorded with a 40× lens (NA, 1.3) from several areas of a section from a tetanized slice fixed 5 min after tetanus and double-labeled for P- and NP-CaMKII as described in Materials and Methods. Images of the section recorded with a 20× lens are shown for reference (middle); letters(A–H) on the reference images mark the locations where the corresponding 40× images were recorded. Staining for NP-CaMKII is shown on the left; staining for P-CaMKII of the same area is shown on the right. Note that high levels of immunolabeling for P- and NP-CaMKII coincide in some segments of dendrites (A, E, black arrowheads) in the tetanized region but not in others (A, E, white arrowheads). Scale bar: A–H, 15 μm; 20× reference images (middle), 200 μm.
DISCUSSION
Here we show that strong tetanic stimulation of the Schaffer collateral pathway stimulates accumulation of newly synthesized α-subunit of CaMKII in the dendrites of the postsynaptic neurons. The increase can be visualized in patches along dendrites by immunocytochemistry just 5 min after the tetanus and persists for at least 30 min. Suppression of protein synthesis by anisomycin blocks the increased accumulation, showing that it is dependent on synthesis of new protein. The increase is corroborated by quantitative immunoblots by which we detect an average 29% increase in α-CaMKII protein in the tetanized region of hippocampal slices 30 min after tetanus. We have previously shown that the increased staining for CaMKII is abolished after addition of NMDA receptor blockers (Ouyang et al., 1997); thus the increase requires activation of NMDA receptors.
The increase in CaMKII is clearly visible in dendrites 100–200 μm from the cell bodies by 5 min after the tetanus (Fig. 8). A well established body of evidence on protein transport mechanisms has established that proteins associated with the cytoskeleton are transported into axons at a rate of 2–4 mm/d, or 1.4–2.8 μm/min. Only membrane-bound organelles are transported at a faster rate (Brady and Lasek, 1982). The molecular machinery subserving dendritic transport is identical or homologous to that involved in axonal transport (Saito et al., 1997). One difference is that dendrites contain a mixture of microtubules polarized in opposite directions, whereas axons contain microtubules polarized primarily in one direction (Baas et al., 1989). This difference would not produce faster rates of transport into dendrites, and indeed the few measurements made of dendritic transport rates for macromolecules in hippocampal neurons have yielded rates similar to those of axonal transport (Davis et al., 1987, 1990; Overly et al., 1996). Axonal transport rates of proteins are not increased by neuronal activity (Edwards and Grafstein, 1984;Hammerschlag and Bobinski, 1992). The CaMKII holoenzyme is associated with the cytoskeleton in dendrites and is not associated with membranous organelles (Kennedy, 1998; Shen et al., 1998). Thus, it would be transported at rates not exceeding 2.8 μm/min; therefore, protein synthesis in the cell body cannot be the source of the increased dendritic CaMKII observed 100–200 μm away from the cell body 5 min after a tetanus. The α-subunit of CaMKII is not expressed in glial cells or in interneurons (Sik et al., 1998; Zhang et al., 1999); thus, protein synthesis in these cells cannot be the source of new α-CaMKII.
In this issue, Steward and Halpain (1999) report that stimulation of a pathway ending in synapses that are confined to one lamina of the dentate gyrus in live rats increases immunostaining intensity for MAP2 and CaMKII only in the portion of dendrites in the stimulated lamina. The increase in staining for MAP2 was reduced in the presence of cycloheximide, suggesting the involvement of dendritic protein synthesis. Increased staining for CaMKII was not measurably reduced by cycloheximide in this study; thus it is not clear whether synaptic activity can alter accumulation of newly synthesized CaMKII in the dentate gyrus. In contrast, our results indicate that tetanic activity of the Schaffer-collateral pathway can increase accumulation of newly synthesized CaMKII in dendrites in area CA1 via dendritic protein synthesis. The synaptic input into stratum radiatum via the Schaffer collateral pathway is not highly laminated (Ishizuka et al., 1990). Individual axons take tortuous paths through stratum radiatum, making en passant synapses along their lengths. Therefore, strong stimulation of the Schaffer collateral pathway in slices would not be expected to produce laminar activation of synapses within stratum radiatum. The increase in CaMKII that we observe in stimulated pyramidal neurons at 30 min after tetanus is, however, confined to the portion of apical dendrites in stratum radiatum. At 5 min after tetanus, small increases in total CaMKII that are blocked by anisomycin are also observed in the cell bodies. No significant changes in CaMKII are observed at any time in the basal dendrites in stratum oriens.
Increased accumulation of CaMKII could result, in theory, from a direct increase in biosynthetic rate in the dendrites, from a decrease in degradation rate, or from a combination of the two. Each of these mechanisms would require dendritic protein synthesis to produce the observed increased accumulation in dendrites 100–200 μm away from the cell body 5 min after tetanic stimulation. Wu et al. (1998)recently presented evidence that binding of CPEB protein to CPE sites located in the 3′-end of the RNA message for α-CaMKII can stimulate its translation rate. Thus, one possible mechanism by which tetanic stimulation might increase α-CaMKII synthesis is via phosphorylation of the CPEB protein, which is indeed present in hippocampal dendrites (Wu et al., 1998). An important next step will be to determine whether this mechanism is involved in the effect of tetanus on CaMKII concentration in CA1 pyramidal neurons and whether the degradation rate of the α-subunit is slowed after tetanus.
Regulation of the concentration of dendritic CaMKII will influence control of synaptic plasticity in the hippocampus. Mutant mice lacking the α-subunit or bearing an α-subunit gene that cannot be autophosphorylated at threonine 286 show severely impaired plasticity at Schaffer collateral synapses (Silva et al., 1992; Stevens et al., 1994; Giese et al., 1998). Several potential mechanisms by which phosphorylation by activated CaMKII could mediate a change in synaptic efficacy have been postulated, including modification of the current through AMPA receptors (Barria et al., 1997) and potentiation of MAP kinase activation at the synapse (Chen et al., 1998). An increase in concentration of CaMKII in dendrites would contribute to a relatively long-lasting increase in the steady-state activity of CaMKII and would thus influence the magnitude and time course of all regulatory processes controlled by CaMKII.
Protein synthesis during tetanic stimulation is necessary for development of long-lasting or “late” LTP (Krug et al., 1984; Frey and Morris, 1997). Frey and Morris (1997) found evidence that late LTP requires both a synapse-specific “tag” induced by relatively weak tetanus and one or more proteins whose synthesis is stimulated more globally in the neuron during a strong tetanus. They reported that strong tetanus to one pathway onto a neuron permits the development of late LTP when a weak tetanus is applied 35 min later at a second pathway after addition of protein synthesis inhibitors. The synthesis and increased accumulation of α-CaMKII in dendrites that we report here may contribute to such a non-synapse-specific protein synthesis-dependent mechanism. Frey and Morris (1997) suggest that the required protein synthesis could be occurring in the neuronal cell body; however, their data do not exclude a contribution from dendritic protein synthesis. Proteins synthesized within dendrites, like those synthesized in the cell body, could move away from their site of synthesis in the dendritic shaft and become concentrated at tagged synapses. The data presented here indicate that CaMKII is one protein whose accumulation by new protein synthesis is induced by tetanic stimulation and may be necessary for late LTP.
Footnotes
This work was supported by National Institutes of Health Research Service Award NS10660 (Y.O.), Grants MH49176 and NS17660 (M.B.K.) and NS32792 (E.M.S.), and grants from the Alfred P. Sloan Foundation, Beckman Foundation, John Merck Fund, and PEW Charitable Trusts (E.M.S.). We thank Dr. Scott Fraser, director of the Caltech Biological Imaging Resource Center, for valuable technical advice and for use of the confocal microscope.
Correspondence should be addressed to Mary B. Kennedy, Division of Biology 216-76, California Institute of Technology, Pasadena, CA 91125.
REFERENCES
- 1.Barria A, Muller D, Derkach V, Griffith LC, Soderling TR. Regulatory phosphorylation of AMPA-type glutamate receptors by CaMKII during long term potentiation. Science. 1997;276:2042–2045. doi: 10.1126/science.276.5321.2042. [DOI] [PubMed] [Google Scholar]
- 2.Baas PW, Black MM, Banker GA. Changes in microtubule polarity orientation during the development of hippocampal neurons in culture. J Cell Biol. 1989;109:3085–3094. doi: 10.1083/jcb.109.6.3085. [DOI] [PMC free article] [PubMed] [Google Scholar]
- 3.Bennett MK, Erondu NE, Kennedy MB. Purification and characterization of a calmodulin-dependent protein kinase that is highly concentrated in brain. J Biol Chem. 1983;258:12735–12744. [PubMed] [Google Scholar]
- 4.Benson DL, Isackson PJ, Gall CM, Jones EG. Contrasting patterns in the localization of glutamic acid decarboxylase and Ca2+/calmodulin protein kinase gene expression in the rat central nervous system. Neuroscience. 1992;46:825–849. doi: 10.1016/0306-4522(92)90188-8. [DOI] [PubMed] [Google Scholar]
- 5.Brady S, Lasek R. Axonal transport: a cell-biological method for studying proteins that associate with the cytoskeleton. In: Wilson L, editor. Methods in cell biology. Academic; New York: 1982. pp. 365–398. [DOI] [PubMed] [Google Scholar]
- 6.Burgin KE, Waxham MN, Rickling S, Westgate SA, Mobley WC, Kelly PT. In situ hybridization histochemistry of Ca 2+ calmodulin-dependent protein kinase in developing rat brain. J Neurosci. 1990;10:1788–1798. doi: 10.1523/JNEUROSCI.10-06-01788.1990. [DOI] [PMC free article] [PubMed] [Google Scholar]
- 7.Chen H-J, Rojas-Soto M, Oguni A, Kennedy MB. A synaptic Ras-GTPase activating protein (p135SynGAP) inhibited by CaM kinase II. Neuron. 1998;20:895–904. doi: 10.1016/s0896-6273(00)80471-7. [DOI] [PubMed] [Google Scholar]
- 8.Crino PB, Eberwine J. Molecular characterization of the dendritic growth cone: regulated mRNA transport and local protein synthesis. Neuron. 1996;17:1173–1187. doi: 10.1016/s0896-6273(00)80248-2. [DOI] [PubMed] [Google Scholar]
- 9.Davis L, Banker GA, Steward O. Selective dendritic transport of RNA in hippocampal neurons in culture. Nature. 1987;330:477–479. doi: 10.1038/330477a0. [DOI] [PubMed] [Google Scholar]
- 10.Davis L, Burger B, Banker GA, Steward O. Dendritic transport—quantitative analysis of the time course of somatodendritic transport of recently synthesized RNA. J Neurosci. 1990;10:3056–3068. doi: 10.1523/JNEUROSCI.10-09-03056.1990. [DOI] [PMC free article] [PubMed] [Google Scholar]
- 11.Edwards DL, Grafstein B. Intraocular injection of tetrodotoxin in goldfish decreases fast axonal transport of [3H]glucosamine-labeled materials in optic axons. Brain Res. 1984;299:190–194. doi: 10.1016/0006-8993(84)90807-2. [DOI] [PubMed] [Google Scholar]
- 12.Hammerschlag R, Bobinski J. Does nerve impulse activity modulate fast axonal transport? Mol Neurobiol. 1992;6:191–201. doi: 10.1007/BF02780552. [DOI] [PubMed] [Google Scholar]
- 13.Erondu NE, Kennedy MB. Regional distribution of type II Ca2+/calmodulin-dependent protein kinase in rat brain. J Neurosci. 1985;5:3270–3277. doi: 10.1523/JNEUROSCI.05-12-03270.1985. [DOI] [PMC free article] [PubMed] [Google Scholar]
- 14.Feig S, Lipton P. Pairing the cholinergic agonist carbachol with patterned Schaffer collateral stimulation initiates protein synthesis in hippocampal CA1 pyramidal cell dendrites via a muscarinic, NMDA-dependent mechanism. J Neurosci. 1993;13:1010–1021. doi: 10.1523/JNEUROSCI.13-03-01010.1993. [DOI] [PMC free article] [PubMed] [Google Scholar]
- 15.Frey U, Morris RG. Synaptic tagging and long-term potentiation. Nature. 1997;385:533–536. doi: 10.1038/385533a0. [DOI] [PubMed] [Google Scholar]
- 16.Gardiol A, Racca C, Triller A. Dendritic and postsynaptic protein synthetic machinery. J Neurosci. 1999;19:168–179. doi: 10.1523/JNEUROSCI.19-01-00168.1999. [DOI] [PMC free article] [PubMed] [Google Scholar]
- 17.Giese KP, Fedorov NB, Filipkowski RK, Silva AJ. Autophosphorylation at Thr286 of the alpha calcium-calmodulin kinase II in LTP and learning. Science. 1998;279:870–873. doi: 10.1126/science.279.5352.870. [DOI] [PubMed] [Google Scholar]
- 18.Hanson PI, Kapiloff MS, Lou LL, Rosenfeld MG, Schulman H. Expression of a multifunctional Ca2+/calmodulin-dependent protein kinase and mutational analysis of its autoregulation. Neuron. 1989;3:59–70. doi: 10.1016/0896-6273(89)90115-3. [DOI] [PubMed] [Google Scholar]
- 19.Ishizuka N, Weber J, Amaral DG. Organization of intrahippocampal projections originating from CA3 pyramidal cells in the rat. J Comp Neurol. 1990;295:580–623. doi: 10.1002/cne.902950407. [DOI] [PubMed] [Google Scholar]
- 20.Kennedy MB. Signal transduction molecules at the glutamatergic postsynaptic membrane. Brain Res Rev. 1998;26:243–257. doi: 10.1016/s0165-0173(97)00043-x. [DOI] [PubMed] [Google Scholar]
- 21.Kindler S, Kennedy MB. Visualization of autophosphorylation of Ca2+/calmodulin-dependent protein kinase II in hippocampal slices. J Neurosci Methods. 1996;68:61–70. doi: 10.1016/0165-0270(96)00074-x. [DOI] [PubMed] [Google Scholar]
- 22.Krug M, Lossner B, Ott T. Anisomycin blocks the late phase of long-term potentiation in the dentate gyrus of freely moving rats. Brain Res Bull. 1984;13:39–42. doi: 10.1016/0361-9230(84)90005-4. [DOI] [PubMed] [Google Scholar]
- 23.Mackler SA, Brooks BP, Eberwine JH. Stimulus-induced coordinate changes in mRNA abundance in single postsynaptic hippocampal CA1 neurons. Neuron. 1992;9:539–548. doi: 10.1016/0896-6273(92)90191-f. [DOI] [PubMed] [Google Scholar]
- 24.Martone ME, Pollock JA, Jones YZ, Ellisman MH. Ultrastructural localization of dendritic messenger RNA in adult rat hippocampus. J Neurosci. 1996;16:7437–7446. doi: 10.1523/JNEUROSCI.16-23-07437.1996. [DOI] [PMC free article] [PubMed] [Google Scholar]
- 25.Miller SG, Kennedy MB. Distinct forebrain and cerebellar isozymes of type II Ca2+/calmodulin-dependent protein kinase associate differently with the postsynaptic density fraction. J Biol Chem. 1985;260:9039–9046. [PubMed] [Google Scholar]
- 26.Miller SG, Kennedy MB. Regulation of brain type II Ca2+/calmodulin-dependent protein kinase by autophosphorylation: a Ca2+-triggered molecular switch. Cell. 1986;44:861–870. doi: 10.1016/0092-8674(86)90008-5. [DOI] [PubMed] [Google Scholar]
- 27.Miller SG, Patton BL, Kennedy MB. Sequences of autophosphorylation sites in neuronal type II CaM kinase that control Ca2+-independent activity. Neuron. 1988;1:1593–1604. doi: 10.1016/0896-6273(88)90109-2. [DOI] [PubMed] [Google Scholar]
- 28.Molloy SS, Kennedy MB. Autophosphorylation of type II Ca2+/calmodulin-dependent protein kinase in cultures of postnatal rat hippocampal slices. Proc Natl Acad Sci USA. 1991;88:4756–4760. doi: 10.1073/pnas.88.11.4756. [DOI] [PMC free article] [PubMed] [Google Scholar]
- 29.Ouyang Y, Kantor D, Harris KM, Schuman EM, Kennedy MB. Visualization of the distribution of autophosphorylated calcium/calmodulin-dependent protein kinase II after tetanic stimulation in the CA1 area of the hippocampus. J Neurosci. 1997;17:5416–5427. doi: 10.1523/JNEUROSCI.17-14-05416.1997. [DOI] [PMC free article] [PubMed] [Google Scholar]
- 30.Overly CC, Rieff HI, Hollenbeck PJ. Organelle motility and metabolism in axons vs dendrites of cultured hippocampal neurons. J Cell Sci. 1996;109:971–980. doi: 10.1242/jcs.109.5.971. [DOI] [PubMed] [Google Scholar]
- 31.Patton BL, Molloy SS, Kennedy MB. Autophosphorylation of type II CaM kinase in hippocampal neurons: localization of phospho- and dephosphokinase with complementary phosphorylation site-specific antibodies. Mol Biol Cell. 1993;4:159–172. doi: 10.1091/mbc.4.2.159. [DOI] [PMC free article] [PubMed] [Google Scholar]
- 32.Peterson GL. Determination of total protein. Methods Enzymol. 1983;91:95–119. doi: 10.1016/s0076-6879(83)91014-5. [DOI] [PubMed] [Google Scholar]
- 33.Saito N, Okada Y, Noda Y, Kinoshita Y, Kondo S, Hirokawa N. KIFC2 is a novel neuron-specific C-terminal type kinesin superfamily motor for dendritic transport of multivesicular body-like organelles. Neuron. 1997;18:425–438. doi: 10.1016/s0896-6273(00)81243-x. [DOI] [PubMed] [Google Scholar]
- 34.Schuman EM. Synapse specificity and long-term information storage. Neuron. 1997;18:339–342. doi: 10.1016/s0896-6273(00)81234-9. [DOI] [PubMed] [Google Scholar]
- 35.Shen K, Teruel MN, Subramanian K, Meyer T. CaMKII beta functions as an F-actin targeting module that localizes CaMKII alpha/beta heterooligomers to dendritic spines. Neuron. 1998;21:593–606. doi: 10.1016/s0896-6273(00)80569-3. [DOI] [PubMed] [Google Scholar]
- 36.Sik A, Hajos N, Gulacsi A, Mody I, Freund TF. The absence of a major Ca2+ signaling pathway in GABAergic neurons of the hippocampus. Proc Natl Acad Sci USA. 1998;95:3245–3250. doi: 10.1073/pnas.95.6.3245. [DOI] [PMC free article] [PubMed] [Google Scholar]
- 37.Silva AJ, Stevens CF, Tonegawa S, Wang Y. Deficient hippocampal long-term potentiation in α-calcium-calmodulin kinase II mutant mice. Science. 1992;257:201–206. doi: 10.1126/science.1378648. [DOI] [PubMed] [Google Scholar]
- 38.Stevens CF, Tonegawa S, Wang Y. The role of calcium-calmodulin kinase II in 3 forms of synaptic plasticity. Curr Biol. 1994;4:687–693. doi: 10.1016/s0960-9822(00)00153-6. [DOI] [PubMed] [Google Scholar]
- 39.Steward O. mRNA localization in neurons—a multipurpose mechanism? Neuron. 1997;18:9–12. doi: 10.1016/s0896-6273(01)80041-6. [DOI] [PubMed] [Google Scholar]
- 40.Steward O, Banker GA. Getting the message from the gene to the synapse—sorting and intracellular transport of RNA in neurons. Trends Neurosci. 1992;15:180–186. doi: 10.1016/0166-2236(92)90170-d. [DOI] [PubMed] [Google Scholar]
- 41.Steward O, Halpain S. Lamina-specific synaptic activation causes domain-specific alterations in dendritic immunostaining for MAP2 and CAM kinase II. J Neurosci. 1999;19:7834–7845. doi: 10.1523/JNEUROSCI.19-18-07834.1999. [DOI] [PMC free article] [PubMed] [Google Scholar]
- 42.Torre ER, Steward O. Protein synthesis within dendrites—glycosylation of newly synthesized proteins in dendrites of hippocampal neurons in culture. J Neurosci. 1996;16:5967–5978. doi: 10.1523/JNEUROSCI.16-19-05967.1996. [DOI] [PMC free article] [PubMed] [Google Scholar]
- 43.Wu L, Wells D, Tay J, Mendis D, Abbott M-A, Barnitt A, Quinlan E, Heynen A, Fallon JR, Richter JD. CPEB-mediated cytoplasmic polyadenylation and the regulation of experience-dependent translation of alpha-CaMKII mRNA at synapses. Neuron. 1998;21:1129–1139. doi: 10.1016/s0896-6273(00)80630-3. [DOI] [PubMed] [Google Scholar]
- 44.Zhang W, Vazquez L, Apperson M, Kennedy MB. Citron binds to PSD-95 at glutamatergic synapses on inhibitory neurons in the hippocampus. J Neurosci. 1999;19:96–108. doi: 10.1523/JNEUROSCI.19-01-00096.1999. [DOI] [PMC free article] [PubMed] [Google Scholar]