Abstract
The visual system is continually inundated with information received by the eyes. Only a fraction of this information appears to reach visual awareness. This process of selection is one of the functions ascribed to visual attention. Although many studies have investigated the role of attention in shaping neuronal representations in cortical areas, few have focused on attentional modulation of neuronal signals related to visual motion. We recorded from 89 direction-selective neurons in middle temporal (MT) and medial superior temporal (MST) visual cortical areas of two macaque monkeys using identical sensory stimulation under various attentional conditions. Neural responses in both areas were greatly influenced by attention. When attention was directed to a stimulus inside the receptive field of a neuron, responses in MT and MST were enhanced an average of 20 and 40% compared with a condition in which attention was directed outside the receptive field. Even stronger average enhancements (70% in MT and 100% in MST) were observed when attention was switched from a stimulus moving in the nonpreferred direction inside the receptive field to another stimulus in the receptive field that was moving in the preferred direction. These findings show that attention modulates motion processing from stages early in the dorsal visual pathway by selectively enhancing the representation of attended stimuli and simultaneously reducing the influence of unattended stimuli.
Keywords: attention, macaque monkey, MT, MST, vision, motion, neurophysiology
The visual cerebral cortex in primates consists of many distinct areas that can be grouped into a hierarchy containing multiple levels that represent increasingly complex information about the visual scene (Felleman and Van Essen, 1991; Van Essen et al., 1992). Over the last decade there has been growing interest in understanding how inputs arising from sources other than the retina influence representations in these various areas. Many studies have demonstrated that neurons in extrastriate visual cortex can be modulated by such “extraretinal” influences and therefore convey signals that are not purely visual. Examples of such influences include signals related to eye position or eye velocity, memory, motor planning, and attention.
The extraretinal effect addressed in this study is the influence of attention on the processing of visual motion. There is an extensive psychophysical literature on attention (for review, see Johnston and Dark, 1986; Kinchla, 1992; Pashler, 1997). Two common features of attentional influences on sensory information processing have emerged from these studies. Attention has a modulatory influence, and this modulation is selective (James, 1890; Posner, 1980; Broadbent, 1982;Julesz, 1984; Eriksen and St. James, 1986). The latter aspect is what differentiates attention from arousal, which also modulates neural activity. Neurophysiological studies have also revealed changes in neural representations associated with attention. These include single-unit recordings from trained, behaving animals (Colby, 1991;Desimone and Duncan, 1995; Maunsell, 1995) and studies of attentional effects in human information processing using noninvasive imaging methods like magnetic resonance imaging (MRI) and positron emission tomography (PET) (Corbetta et al., 1990, 1991, 1993; Orban et al., 1996, Beauchamp et al., 1997; O’Craven et al., 1997; Rees et al., 1997; Shulman et al., 1997; Vandenberghe et al., 1997; Cornette et al., 1998; Watanabe et al., 1998; Wojciulik et al., 1998).
Neurophysiological studies have found attentional modulation in both the dorsal and ventral pathways of visual cortex. In the ventral pathway, neurons in inferotemporal cortex and area V4 are strongly modulated by the attentional state of the animal (Desimone and Duncan, 1995). Recent studies also have provided increasing evidence for attentional modulation of form and color processing in areas V2 and even V1 (Motter, 1993; Luck et al., 1997; Press and Van Essen, 1997;McAdams and Maunsell, 1998). In contrast to these findings in the ventral pathway, most previous studies along the dorsal pathway have failed to find extraretinal effects before the medial superior temporal (MST) area. Notably, most studies of the middle temporal visual area (MT) have failed to find modulations related to the behavioral significance of the stimulus (Wurtz et al., 1982; Newsome et al., 1988). One exception is a study by Ferrera et al. (1994) who showed that ∼30% of MT cells show some extraretinal modulation in a motion match-to-sample task.
Most previous studies of extraretinal effects within the dorsal pathway have examined aspects of oculomotor control, such as signals related to the planning and execution of eye movements. Because motion analysis is an important aspect of visual information processing and an understanding of its neural basis would be incomplete without knowing how it is influenced by behavioral state, we designed an experimental paradigm for examining attentional modulation of visual motion signals. We decided to record from MT and MTS, the two areas in the primate visual cortex that have been most strongly linked to the processing of visual motion. Elegant studies from Newsome and his colleagues (Britten et al., 1992, 1996; Salzman et al., 1992) have demonstrated a tight association between the neuronal responses in these areas and the behavioral performance of the animal. Although this has been interpreted as evidence for a causal bottom-up relationship between the responses in these areas and perceptual decisions, the experiments described here show that the responses in these areas also reflect substantial top-down attentional influences.
A brief report of this work has appeared previously (Treue and Maunsell, 1996).
MATERIALS AND METHODS
We used moving stimuli and a motion task to match both the sensory input and the behavioral task to the cells under study. We further designed the behavioral task to hold the animals’ attention on the stimulus for an extended period of time.
The first experiment tested the effect of shifting attention between a pair of moving dots, only one of which was within the receptive field of the cell being recorded. A second experiment tested whether attention would differentially influence the activity of neurons when the animal is attending to different moving stimuli, both of which were inside the receptive field.
Task and data analysis. Using standard extracellular techniques (Gibson and Maunsell, 1997), we recorded from isolated neurons in MT and MST in two behaving macaque monkeys. The neuronal response properties of both areas have been extensively studied, and each contains a high proportion of direction-selective cells (Logothetis, 1994).
The animals performed a task that allowed us to compare the responses of neurons to identical visual stimuli under different attentional conditions. By using identical visual stimulation we ensured that the differences in neural response between the various attentional conditions were attributable solely to changes in the behavioral state of the animal.
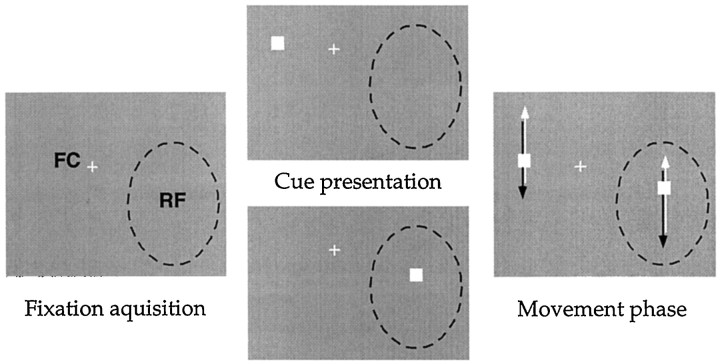
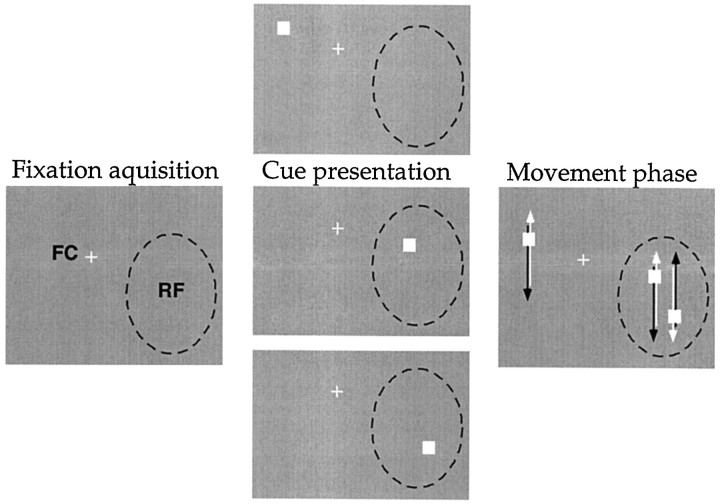
Each trial started with the presentation of a small fixation cross on an otherwise dark computer monitor (75 Hz, 29 pixel/°) 57 cm in front of the animal. After the animal fixated this cross, a single small, bright, 0.3° by 0.3° stationary square dot (the “target”) appeared somewhere on the display. The animal had to respond to this dot by pushing a lever. As soon as the lever was depressed, one (experiment 1; Fig. 1) or two (experiment 2; Fig. 2) additional dots (“distractors”) appeared on the screen, and all the dots started to move back and forth on the display. Each dot traveled the same distance along straight, noncrossing paths at the same speed, but not necessarily in the same direction. They reversed direction in synchrony. After a random period (between ∼1 and 5 sec) the target increased its speed (by 30–55% in experiment 1 and 40–70% in experiment 2), and the monkey had to respond to this speed change by releasing the lever. A response within the reaction time window (beginning ∼150 msec and ending ∼700 msec after the target change) was rewarded with a drop of apple juice.
Fig. 1.
Stimulus conditions used in experiment 1. The two middle panels show the difference between the two experimental conditions used in this experiment. The left panel shows the screen at the beginning of the trial, themiddle panels show the layout of the screen until the monkey initiates a trial by depressing the lever, and the right panel shows the period of data collection, during which the dots moved back and forth across the screen. All data presented here come from the movement period, i.e., when the two experimental conditions had identical sensory stimulation. The dashed line is the circumference of the classical receptive field (RF), plotted by hand using a moving dot or light bar while the animal fixated a small spot. The cross(FC) is the spot the animal had to fixate for the duration of each trial. In experiment 1, one dot traveled back and forth through the receptive field along the preferred and anti-preferred directions of the cell while the other dot moved outside the receptive field. Although this example shows a parallel movement of the two dots, the relative direction of motion between them varied from cell to cell.
Fig. 2.
Stimulus conditions used in experiment 2. As in Figure 1, the panels from left to rightshow the progression from the screen appearance before fixation, before initiating a trial by depressing the lever, and during the actual trial. Experiment 2 differed from experiment 1 in that two dots were presented inside the receptive field, moving in parallel but out of phase (mean track separation: 1.9° for MT cells and 2.6° for MST cells). Because each of the three dots could be designated the target during the cue presentation, there are now three different trial types, although the display differed only during the cue presentation. In both of the two bottom panels for cue presentation, attention is inside the receptive field. As in experiment 1, the direction of motion of the dot outside the receptive field bore no consistent relationship to the direction of the dot inside the receptive field. It was generally chosen so that it would remain in the other visual hemifield and not leave the display screen. The whiteand black arrows are intended to illustrate the two alternating movement directions of the dots.
The dot speeds approximated the preferred speed of a cell and ranged from ∼5–20°/sec. Movement trajectories ranged from ∼6 to 14° in length and stayed within the bounds of the classical receptive field, except for those MT cells with small receptive fields close to the fovea. The duration of the movement epochs ranged from ∼700 to 1200 msec. As all dots initially appeared between the middle and end position of their trajectory, the first (complete) epoch did not start until the first movement reversal (∼150–350 msec after the distractor appearance and movement onset).
The distractor dot or dots also changed speed at random times, often before the target dot, but the trial was terminated without reward if the animal responded to a speed change of a distractor. The animal had to maintain its gaze on the fixation cross throughout the trial. The animal’s eye position was measured every 5 msec using a scleral search coil (Robinson, 1963; Judge et al., 1980), and trials were aborted without reward if the monkey moved its gaze >1–1.5° from the center of the fixation cross. Except as noted, only correctly completed trials were included in the analysis, and only the time periods before any dot had changed speed were analyzed. By excluding data after the first speed change in the display we could compare periods of identical visual stimulation between trials in which different dots were attended. The responses of the neurons were analyzed by computing the average rate of firing during the central part (∼500–1000 msec) of the movement epoch of interest. The first 150 msec and the last 100 msec of each epoch were excluded to account for response latencies and possibly diminished responses as the dots reached the extremes of the receptive field.
Cells. When a neuron was isolated, one (experiment 1) or two (experiment 2) dots were positioned to move back-and-forth within its receptive field, with their axis of motion aligned with the preferred direction of the cell.
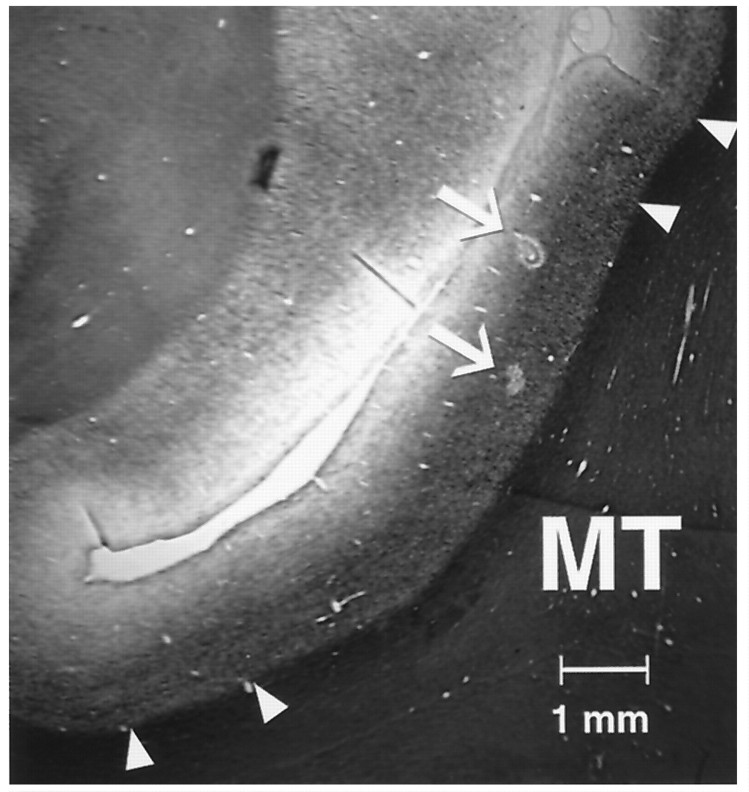
We used a vertical approach with a recording chamber implanted over the superior temporal sulcus. When recordings were completed in each animal, the recording sites were identified in histological section. The borders of MT were identified using myelin-stained sections (Gallyas, 1979; Van Essen et al., 1981). Recording sites were assigned to MT and MST based on electrolytic lesions made during the final few recording sessions, gray and white matter boundaries identified physiologically during recordings, and microdrive readings. Figure3 shows a photomicrograph of a myelin-stained section through the superior temporal sulcus of one animal. Two electrolytic lesions made near recording sites in MT are marked with arrows.
Fig. 3.
Parasagittal myelin-stained section of the superior temporal sulcus. Dorsal is up, and anterior is to the left. The borders of MT were assigned based on its distinctive myelination. Small triangles mark the range of uncertainty in locating the borders of MT in this section.Arrows mark two electrolytic lesions that were made with a recording microelectrode.
Behavioral performance. Ignoring those trials that were aborted because of eye movements, the average proportion of correctly completed trials in experiment 1 was ∼90% (∼70% of all trials). The majority of the error trials resulted from the animal responding before a stimulus change or not at all. Based on response timing, an estimated 2% of the trials in experiment 1 and ∼10% of those in experiment 2 ended with the animal responding to the change of the distractor. Animal “S” performed better (average hit rate 93%) than animal “D” (average hit rate 83%). Hit rates for both animals dropped to 70% (55% of all trials) in experiment 2, although we used a larger speed change.
RESULTS
Histological reconstruction showed that 65 cells were in MT, 21 in MST, and 3 were near the border between MT and MST. The remaining seven cells were excluded from the analysis because they were near the MT/V4 border and could not be assigned to MT unequivocally. Eccentricities of receptive field centers were ∼5–20° for MT and 10–20° for MST cells.
Experiment 1: one stimulus in the receptive field
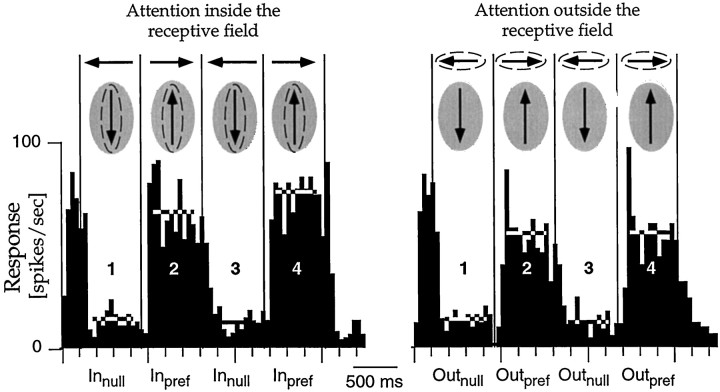
Experiment 1 was designed to test the effect of switching attention between stimuli inside and outside of the receptive field of a cell (Fig. 1). Figure 4 shows the responses of a neuron in MST to the back-and-forth motion of the dot in its receptive field under the two conditions. The left panel is a histogram of the response of the cell when the animal was attending to the dot inside the receptive field, and the right panel shows the response when the animal was attending to the dot outside the receptive field. Both dots were present and made the same movements in both conditions. Vertical lines mark the times when the dots reversed direction. In this example the dot inside the receptive field moved in the anti-preferred direction during the first and third epoch (marked Innull and Outnull), whereas during the second and fourth epoch the dot moved in the preferred direction (marked Inpref and Outpref). The modulation between successive epochs reflects the direction selectivity of the cell. The effect of attention can be seen by comparing the two histograms. Like most cells we encountered, this neuron responded more strongly when the animal was attending to the stimulus inside its receptive field.
Fig. 4.
Effects of attention on responses in experiment 1. Both histograms show the responses from one neuron in MST, while the animal attended either to the dot in the receptive field (left panel) or to the one outside the receptive field (right panel). Sketchesabove each histogram schematize the stimulus motions in the four trial epochs, with the attended stimulus (the target) circledwith the dashed line and the shaded areasymbolizing the receptive field. The preferred direction is represented by upward motion. Vertical lines in the histograms mark the times when the dots reversed direction. The activity to theleft of the first reversal is the response of the cell to preferred direction motion in the receptive field from the starting point of the dot to the first reversal. Horizontal linesmark the periods in which data were analyzed and the average firing rate for those periods. Because the target changed after a random time in-terval, and only data before any speed change are averaged into this histogram, the number of trials contributing to the bins decreases with time. For a number of cells we also or only collected data in a condition with reversed direction order, i.e., where the first and third epoch contained preferred direction motion. For this cell, the response when attention was directed to the receptive field stimulus moving in the preferred direction (Inpref) was ∼20% larger in the second epoch and ∼35% larger in the fourth epoch compared to the identical stimulus conditions when attention was directed to the stimulus outside the receptive field (Outpref epochs 2 and 4).
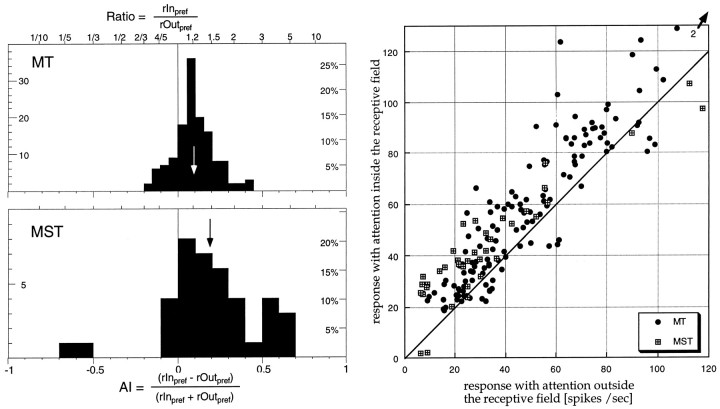
To quantify the effect of attention we computed an attentional index AI = (rInpref − rOutpref)/(rInpref+ rOutpref) for each trial epoch containing preferred motion in the receptive field, where rInpref is the average rate of firing when the animal was attending to the stimulus inside the receptive field and rOutpref is the average rate of firing to the same visual stimulation when the animal was attending to the stimulus outside the receptive field. This index resembles the Michelson contrast formula, representing all ratios in a bounded range between −1 and 1. Positive index values indicate a stronger response when attention was directed into the receptive field, whereas values near zero indicate no attentional modulation. The histogram in Figure5 plots the distribution of this index for all MT and MST cells.
Fig. 5.
Histogram of the strength of attentional modulation for all neurons and for each preferred direction motion epoch. The top histogram shows the data for 137 preferred motion epochs from 66 MT cells (mean of the distribution: 0.10, marked by the arrow), the bottomhistogram shows the indexes based on 39 epochs from 21 MST cells (mean, 0.19). Binning is based on the attentional index (bottom axis). The top edge of the histogram frames shows the corresponding values when taking the ratio of the responses in the two conditions. The scatterplot on the rightplots the individual mean firing rates used to compute the index values in the histograms on the left. Thediagonal is the line connecting points where the responses in the two conditions are identical, i.e., points above the line signify cells whose responses were larger when the stimulus inside the receptive field was the target.
The median values were 0.09 and 0.17 for MT and MST, corresponding to enhancements of ∼20% for MT cells, and 40% for MST cells. Some cells showed enhancements as strong as threefold to fourfold. The difference between the areas was significant (p< 0.01; Mann–Whitney U test). Animal S, which had higher hit rates in experiment 1 also showed significantly (p < 0.05; two-tailed t test) higher modulations for MT (25 vs 11% for animal D). For MST attentional modulation were not significantly different between the two animals. Because the firing rates of the MT cells tended to be higher than those of the MST cells, it is conceivable that the difference between the attentional modulations of MT and MST neurons is caused by this difference in response rates rather than be a genuine difference between areas. To examine this possibility, we excluded from the analysis all MT neurons with firing rates of >55 spikes/sec when attention was outside the receptive field (x-axis in the Fig. 5 scatterplot) from the analysis. This equated average firing rates between MT and MST neurons. The attentional modulation of MST neurons was still significantly higher (p < 0.05).
Could the observed modulation be based on eye position or eye movement artifacts?
It is important to consider whether these differences in responses might arise from systematic differences in the visual stimulation. Although the same stimuli were presented in both conditions, a systematic difference in eye position between the conditions could in principle affect neural responses by changing the retinal stimulation. Because the targets were offset from fixation in different directions in our different behavioral conditions, it is possible that the animals had slight offsets in their fixation between the conditions. Any such shift would have to be small given the constraints of our fixation window, and its effects would be further minimized by the relatively large size of the receptive fields compared to the size of the fixation window.
We determined the average eye position during the epochs that were used for computing neural responses in experiments 1 and 2. Across all cells, the median offset in eye position associated with shifting attention was 0.15° for experiment 1 and 0.10° for experiment 2. The direction of the shift was not consistently related to the location of the dots on the screen. Consequently, the average offsets in eye position in the direction of target position were only 0.05° and 0.03° for the two experiments. Given the large size of receptive fields in MT and MST and their lack of fine spatial structure (Britten, 1995), such stimulus offsets cannot account for the effects we observed.
Because the distractor in our experiments often moved in a different direction than the target, we also must consider whether the response modulation might be caused by small eye movements that tracked the eccentric targets with a low gain. Although small eye movements would not be expected to cause systematic variations in neural responses, we nevertheless included a trial condition in some of our recordings that was designed to maximize any such effects. In these trials the animal was required to track a fixation point that moved slowly back and forth on a track parallel to the dot inside the receptive field, either in phase or out of phase with its motion. This was intended to simulate an exaggerated version of potential eye movements in trials in which the animal attended to the stimulus inside the receptive field and those trials in which the animal was attending to the other dot moving in anti-phase. The dot in the receptive field was moving back and forth as in experiment 1, and these trials were run interleaved with the standard trial conditions of that experiment. No dot was presented outside the receptive field and the animal was rewarded for keeping its gaze on the fixation cross. While the excursions of the fixation cross were small relative to the movement of the dot inside the receptive field (gain ∼10%) they were much larger than eye drifts during normal trials. Twenty-three neurons were tested in this way. The responses were analyzed by comparing the activities of the cells during movement of the dot inside the receptive field in the preferred directions of the cells, just as for the data in Figure 4.
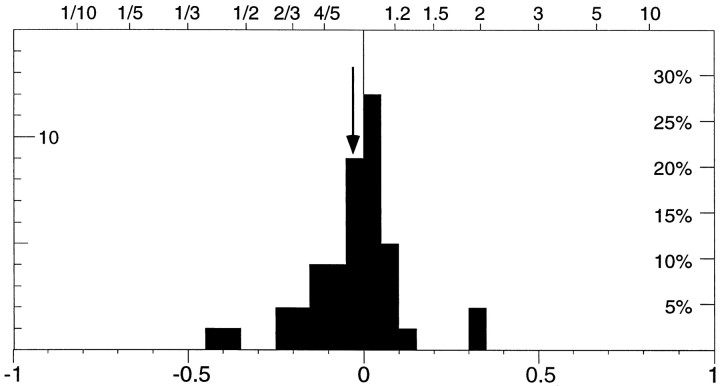
Figure 6 shows the relative activity between the two conditions, one while the monkey was tracking in-phase with the dot and the other while it was tracking in anti-phase to the dot movement. The effect of tracking the fixation point was assessed using an index like the one used in Figure 5. The distribution is centered on 0 (median, −0.01), i.e., we found no significant change in firing rate when comparing the two conditions (p> 0.8, paired t test). Thus low-gain tracking movements during the standard experiment could not account for the attentional effects we observed.
Fig. 6.
Histogram of the relative activity between epochs of control conditions in which the monkey tracked the fixation point in phase with the dot moving in the preferred direction inside the receptive field, and periods when the monkey tracked the fixation point in anti-phase to that motion. The distribution is based on 43 cells (31 MT, 10 MST, 2 either MT or MST) and is not significantly shifted from 0 (mean, −0.03; marked by the arrow).
Simple fixation
Some studies of the effects of attention on the responses of visual cortical neurons have compared activity in a fixation condition with a condition in which attention was directed at the stimulus (Maunsell et al., 1991; Beauchamp et al., 1997; Seidemann et al., 1998). Such a paradigm has the potential of confounding the effects of arousal and attention (because attending to a peripheral stimulus is a more difficult task) or to underestimate the magnitude of attentional modulation (if attentional resources are directed at the stimulus even in those trials where only fixation is required). We included a fixation condition in some of our recordings to examine this issue further. In a variation of experiment 1, the animal was presented only with the moving dot in the receptive field. We compared a condition in which the animal was simply required to fixate without using the lever with one in which it had to attend to the moving dot. The animal knew on which trials no attention was required because the fixation point in these trials was a small circle rather than the cross indicating an attentional trial. Reward on fixation trials was given after a randomized period, with timing similar to that in trials where the animal had to respond to the stimulus change. Trials were randomly interleaved with the regular trials.
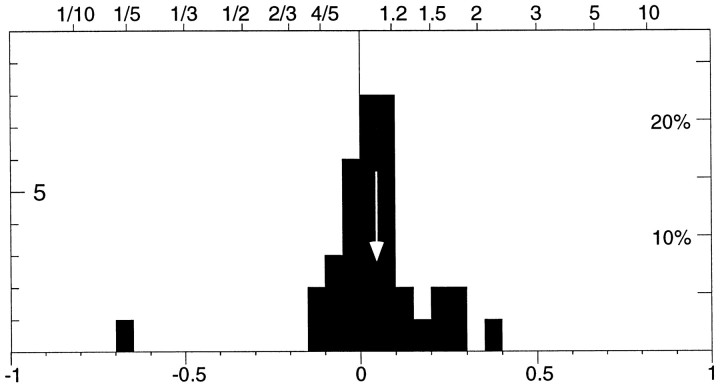
Figure 7 is a histogram of the relative activity between the two conditions for the epochs in which the dot inside the RF was travelling in the preferred direction. The histogram shows a shift to the right (p < 0.01, pairedt test), with a median index of 0.04 (i.e., an 9% enhancement). Thus, responses were weaker on trials that required only fixation compared to those where attention was directed into the receptive field, but not as weak as on trials when the animal had to attend to a target outside the receptive field (as demonstrated by the larger modulation shown in Fig. 5). There are several explanations for this reduced modulation in the simple fixation condition compared to the condition in which attention was directed toward a moving stimulus outside the receptive field. Because no explicit attentional task was required from the animal on the fixation trials, it might have been attending the stimulus inside the receptive field even on those trials. Alternatively, the result is consistent with the idea that the representations of unattended stimuli are suppressed as attentional load at distant sites is increased (Rees et al., 1997).
Fig. 7.
Histogram of the relative activity between trial epochs in which the animal was just required to maintain fixation and those trials epochs in which the animal was required to respond to a speed change of the dot moving inside the receptive field. The distribution is based on 36 cells (30 MT, 5 MST, 1 either MT or MST) and is significantly shifted to the right of 0 (mean, 0.04; marked by the arrow), indicating that responses were ∼9% higher when attending inside the receptive field than during the fixation-only epochs.
Effect of attention on the response to the anti-preferred direction
The data presented so far have concentrated on the effect of attention on the response of a cell to the preferred direction. We also looked at the effect of attention on responses to the anti-preferred direction of motion. We asked whether directing attention to a stimulus moving in the anti-preferred direction in the receptive field increases or decreases the response of a neuron. Changes in the response to the nonpreferred stimulus are important because they can affect the directionality of the cell, i.e., the ability to distinguish between stimulation by the preferred or the nonpreferred direction.
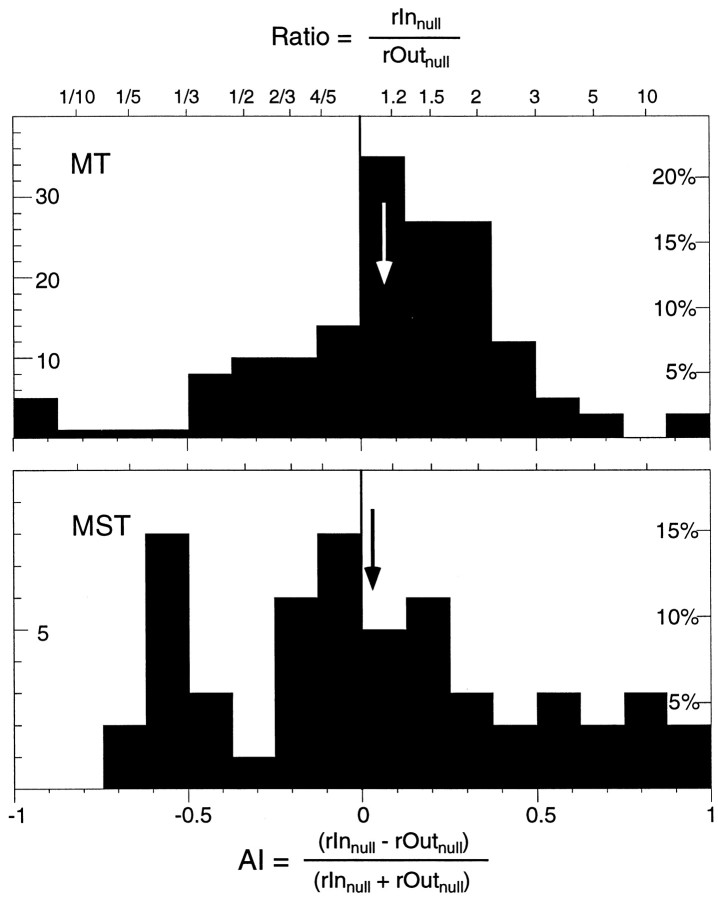
Figure 8 shows the histograms of the attentional index when the dot inside the receptive field was moving in the anti-preferred direction for cells in MT and MST. The distributions are much broader than those for the preferred direction of motion (Fig.5) because responses to nonpreferred directions are generally small and their ratios correspondingly noisier. The median attentional index was 0.1 (i.e., a 20% enhancement) for MT cells, whereas MST cells show no significant change of their response (median attentional index, 0.0) to the nonpreferred direction when moving attention from outside to inside of the receptive field. Recall that the mean attentional modulation for preferred direction stimuli was ∼20% for MT and 40% for MST cells. The difference in the attentional modulation between preferred and anti-preferred stimulation was not significant for MT cells and only weakly significant (p < 0.05, Mann–WhitneyU test) for the MST cells. The difference between MT and MST cells was not significant (Mann–Whitney U test). It has been suggested that attention modulates firing rates in a multiplicative fashion (McAdams and Maunsell, 1998; Treue and Martinez Trujillo, 1999), increasing responses not only to preferred but also to suboptimal stimuli. This would suggest that for a given cell there would be a correlation between the strength of the attentional modulation that we observed with preferred and anti-preferred stimuli. Unfortunately the scatter of the anti-preferred modulation is too large to see any trend in the data.
Fig. 8.
Histograms of the attentional modulation when the dot inside the receptive field was moving in the anti-preferred direction and the animal was either attending inside (Innull) or outside (Innull) the receptive field. The top histogram shows the distribution of 162 indices from 66 MT cells. It is shifted significantly to the right (mean, 0.07; i.e., a 15% enhancement, marked by the arrow), indicating a larger response when the animal was attending inside the receptive field. Thebottom histogram plots the 54 indices from 21 MST cells, showing no significant shift.
Experiment 2: two stimuli inside the receptive field
In the second experiment two dots were placed inside the receptive field and a third dot outside. The dots inside the receptive field moved parallel to one another in the opposite direction (counterphase) with their tracks slightly offset (median displacement 2.0 and 2.8° for MT and MST compared to median stimulus movement excursions of 10 and 12°). On a given trial any one of the three dots could be the target. The target was designated in the same way as in experiment 1 (Fig. 2).
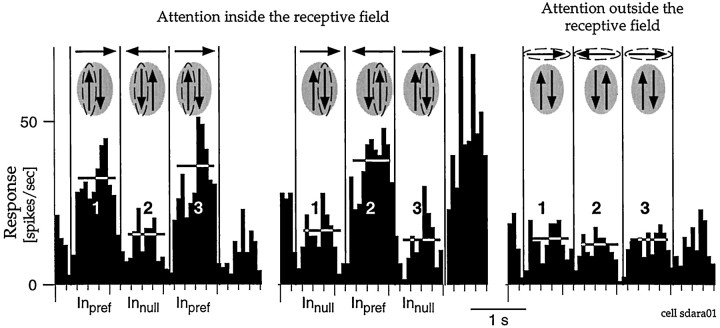
The responses of most neurons depended greatly on which of the dots the animal attended to. Figure 9 shows the responses of one MST cell. When the animal attended to either of the dots in the receptive field, the neuron responded most strongly when that dot moved in the preferred direction of the cell (symbolized by an upward arrow, Inpref epochs, i.e., first and third epoch left panel and second and fourth epoch middle panel). When the animal attended to the other dot in the receptive field, the phase of the response changed, so that the neuron was again most strongly driven when the target was moving in the preferred direction. Thus, the neuron encoded the movements of whichever dot the animal was attending to. When the animal attended to the dot outside the receptive field, the neuron maintained a comparatively steady, intermediate level of activity. Attending to the dot moving in the anti-preferred direction inside the receptive field depressed the response of the neuron below that evoked when the animal was directing its attention outside the receptive field.
Fig. 9.
Responses with two stimuli inside the receptive field. The histograms show the responses of an MST neuron during experiment 2. The sketches above the histograms represent the movement of the three dots presented, and thedashed ellipses denote the target stimulus in the respective trials. The left two histograms show responses while the animal attended to either the left or the right dot in the receptive field, and the right histogram plots responses when the animal attended to the dot outside the receptive field. The direction of the dot outside the receptive field relative to the axis of motion inside the receptive field varied from cell to cell. The vertical lines in each histogram mark the reversals of the directions of the dots. When one of the receptive field stimuli was the attended dot, the response of the neuron was strong whenever that dot moved in the preferred direction (epochs marked Inpref). The activity was relatively unmodulated when the animal was attending to the dot outside the receptive field (right histogram). For this cell, the response when directing attention to the receptive field stimulus moving in the preferred direction (Inpref) was ∼94% larger in the first epoch, ∼135% larger in the second epoch, and ∼164% larger in the third epoch compared to the identical stimulus conditions when attention was directed to the stimulus moving in the anti-preferred direction inside the receptive field (Innull). These values are typical for MST cells (see also Figs. 10, 12).
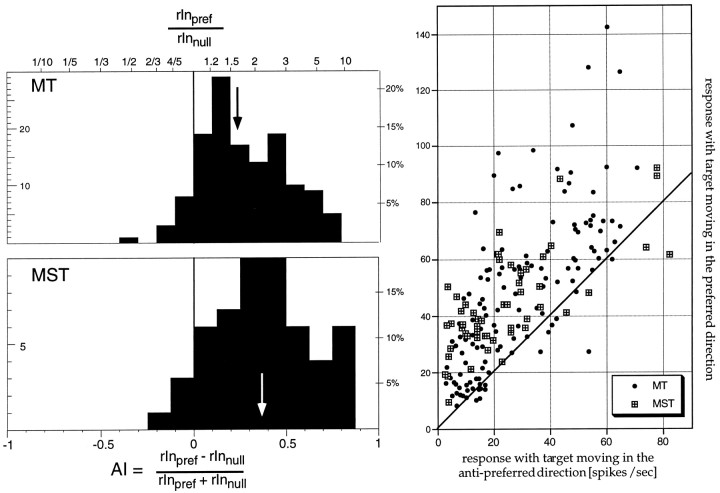
We measured the strength of the attentional modulation in this experiment by comparing for each neuron and each movement epoch the response while the animal was attending to the dot moving in the preferred direction inside the receptive field (rInpref) with the response during the same epoch while the animal was attending to the receptive field dot moving in the anti-preferred direction (rInnull) by again computing an attentional index AI = (rInpref− rInnull)/(rInpref+ rInnull). The index distributions in Figure10 show that almost all MT and MST neurons responded more strongly when the attended dot traveled in the preferred direction. The median attentional indices were 0.25 and 0.33 for MT and MST cells corresponding to enhancements of ∼67 and 100%. Thus, responses were strongly enhanced when attention was on the stimulus moving in the preferred direction. Attentional modulation was significantly stronger in MST (p < 0.05, Mann–Whitney U test). See the top panels of Figure 13 for an example of a particularly strong modulation in an MST cell.
Fig. 10.
Histogram of the attention index in experiment 2 (labels as in Fig. 5) for all epochs. The top histogram shows the distribution of indices based on 134 epochs from 46 MT cells, the bottom histogram the distribution of 53 indices from 16 MST cells. Both distributions are significantly shifted to the right (mean for MT cells, 0.24; i.e., an ∼60% higher response when attention was directed toward the preferred motion stimulus; mean for MST cells, 0.37, i.e., an ∼100% stronger response). The scatter plot on the right plots the actual firing rates when attention was directed toward the anti-preferred motion on thex-axis versus the responses when attention was on the preferred direction on the y-axis. Thediagonal is the line that connects all points where the responses in the two conditions are identical. Points above this line signify stronger responses when the target was the dot moving in the preferred direction.
Fig. 13.
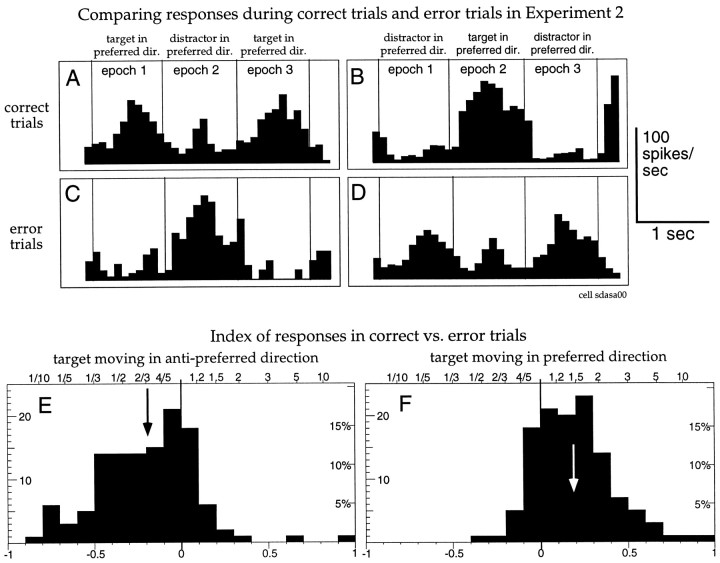
A–D, Spike histograms from one MST cell with recordings from experiment 2. The top panels (A, B) show correct trials with the animal attending either to the right or left dot inside the receptive field. The middle panels (C, D) show responses on trials in which the animal released the lever prematurely within a few hundred milliseconds after a speed change in the distractor. These trials were not rewarded and where normally not included into the analysis. This example shows that the response in C is very similar to the one inB, and the one in D is very similar to the one in A, indicating that the animal was attending to the distractor. E, F, The index histograms show the relative activities in corresponding epochs for error trials (like the ones in C and D) and correctly completed trials (like the ones in A and B) whenever at least one error trial was recorded. This was the case for 57 cells and for 122 epochs when the target was moving in the anti-preferred direction and 121 epochs when the target was moving in the preferred direction. Negative values indicate responses that are larger in error trials. The left histogram compares activity in epochs in which the designated target was moving in the anti-preferred direction (such as epoch 2 in panels Aand C and epochs 1 and 3 in panels B andD). The right histogram compares activity in epochs in which the designated target was moving in the preferred direction (such as epochs 1 and 3 in panels A andC and epoch 2 in panels B andD).
Experiment 2 yielded much stronger modulations than those seen in experiment 1. One explanation for this difference could be that experiment 2 was more difficult. The animal had more trouble performing the task with two closely spaced dots inside the receptive field. Excluding trials in which the animal broke fixation, the animal completed ∼90% of trials correctly in experiment 1, but only ∼70% in experiment 2. Several studies have shown that attentional modulation increases with more difficult tasks (Richmond and Sato, 1987; Spitzer et al., 1988).
Another possible reason for stronger modulations in experiment 2 is that the indices used to measure modulations in the two experiments were not equivalent. For experiment 2 we compared responses when the animal attended to an optimal stimulus (preferred direction of motion in the receptive field) with a nonpreferred stimulus (anti-preferred direction of motion in the receptive field). For experiment 1 we compared responses when the animal attended to an optimal stimulus (preferred direction of motion in the receptive field) with attention to a neutral stimulus (motion outside the receptive field). To examine this issue further, we computed for experiment 2 a modulation index that compared attention to preferred motion inside the receptive field to attention outside the receptive field.
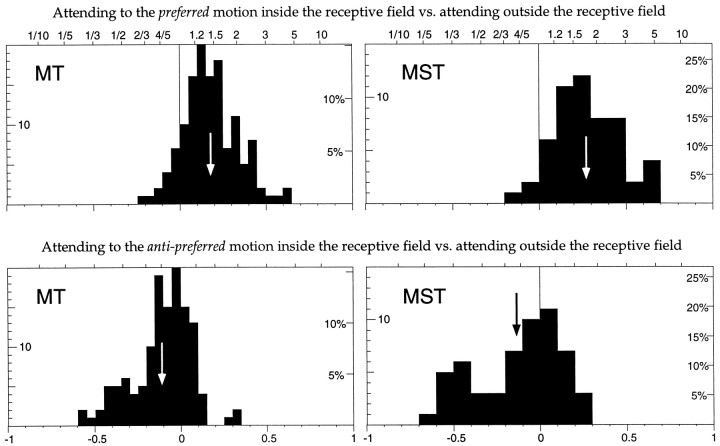
The top panels in Figure 11 plot the attentional indices based on comparing Inprefwith the response when the animal was attending outside the receptive field under the same stimulus configurations as in Inpref, and the bottom panels show the indices comparing Innull with the response when the animal was attending outside the receptive field under the same stimulus configurations as in Innull. The top histograms show a shift to the right, indicating an enhanced response when the dot moving through the receptive field in the preferred direction was the target. The median enhancement was 40% for MT neurons and 65% for MST neurons. For MT, but not for MST neurons, this was a significantly stronger modulation than the one we observed in experiment 1. The lower histograms show a shift to the left indicating that the neurons response was reduced when the target was moving through the receptive field in the anti-preferred direction. The median shift was a 16 and 14% response reduction, neither of which was a significantly stronger shift than in experiment 1 (p > 0.05, Mann–Whitney Utest).
Fig. 11.
The same two attentional conditions that were compared in Figure 10 are here compared against a neutral condition where both stimuli inside the receptive field are behaviorally irrelevant. The top panels show histograms of the change in responses seen when the response while the animal attended to the dot moving in the preferred direction (rInpref) is compared to the response when the animal was presented with the exact same stimulus condition but was instructed to attend to the dot outside the receptive field (Fig. 9, right panel). Both distributions are shifted significantly to the right[MT, mean 0.18 (∼44% enhancement); MST, mean 0.27 (∼74% enhancement)], indicating a larger response when attention is directed onto the preferred motion stimulus inside the receptive field. Thebottom panels show histograms of the change in responses seen when the response while the animal attended to the dot moving in the anti-preferred direction (rInnull) is compared to the response when the animal was presented with the exact same stimulus condition but was instructed to attend to the dot outside the receptive field. Both distributions are shifted significantly to the left [MT, mean −0.11 (∼10% suppression); MST, mean −0.13 (∼12% suppression)], indicating a reduced response when attention is directed onto the anti-preferred motion stimulus inside the receptive field.
Temporal aspects of attentional modulation
Because the animal was cued to the target stimulus before any motion began there is little basis for asking whether the effect of attention has a different time course than the sensory response to a stimulus. We can, however, ask whether the effects of attention changed during the several seconds of stimulus presentation.
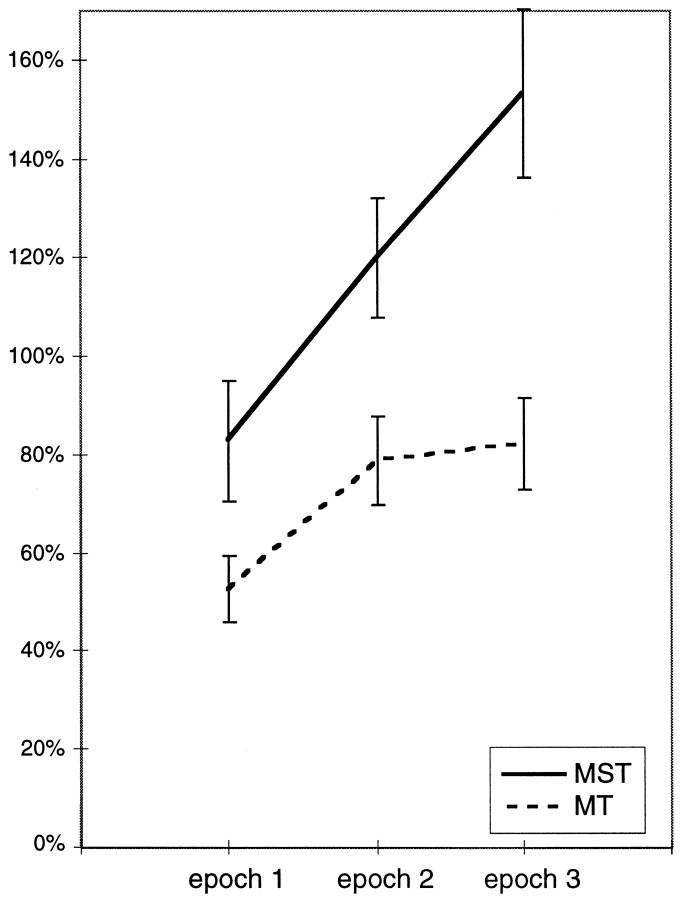
In Figure 12 we plot the attentional index in experiment 2 as a function of stimulus epoch for those MT and MST cells for which we have data spanning three stimulus epochs. The curves show that attentional modulation grew across epochs. Both for MT and MST the overall increase was significant (ANOVA, effect of phase,p < 0.005 for MT, p < 0.05 for MST). Because the target change occurred randomly between a minimal and a maximal time, the probability of a speed change in the immediate future increased with time during each trial. It is possible that the animal therefore increased his attention to the stimuli with increasing time during a trial, contributing to the increase in attentional modulation.
Fig. 12.
Mean attentional enhancement as a function of trial epoch, i.e., time for MT and MST cells in experiment 2. Included are data from the 33 MT cells and 16 MST cells for which the data span three movement epochs (such as the MST neuron shown in Fig. 9). The duration of the epochs varied between cells (range, ∼700–1200 msec). The first complete epoch began with the first movement reversal, i.e., 150–350 msec into the motion (see Materials and Methods for details). Error bars indicate SEM.
This finding also rules out an unlikely but possible artifact in our data. Because the target location was cued by presenting one dot before the others, the instruction stimulus might have caused a lasting activation of the cell, seemingly increasing responses when the target was inside the receptive field. An activation of this sort should decay over time, but the modulations we observe increase with time after the instruction presentation.
Responses during trials ending with incorrect responses
To further explore how tightly linked the response of the neurons are to the mental state of the animal we looked at neural responses during trials in which the animal made a mistake.
The two top panels of Figure 13 show the responses of a neuron in experiment 2 when the animal was instructed to attend to the left (A) or the right dot (B) inside the receptive field. As in all previous analyses, only correctly completed trials are included in these panels. The middle panels (C, D) show trials in which the animal responded within a few hundred milliseconds after the dot in the receptive field that was not the target changed speed. These were incorrect responses and were consequently not rewarded. By including only those error trials in which the animal responded within a few hundred milliseconds after a speed change of the distractor in the receptive field we presumably selected trials in which the animal had lost track of which dot was the target and had been attending to the distractor. The sensory stimulation by moving dots was the same for all the panels, only the instructions to the animal varied between trials in A, C and B, D, respectively. Nevertheless, the activity of the cell follows the movement of the dot to which the animal eventually responded.
We compared the response in all epochs of these error trials to the corresponding epochs of trials that the animal correctly completed. The bottom left histogram shows the distribution of these indices for epochs in which the target was moving in the anti-preferred direction and the right histogram for epochs in which the target was moving in the preferred direction. As suggested by the example cell, the response was strongly reduced in trials in which the target was moving in the anti-preferred direction if the monkey correctly completed the trials. The right histogram shows the corresponding shift to higher responses in trials in which the target was moving in the preferred direction if the monkey correctly completed the trials. Both effects would be predicted if the attentional enhancement of attending to the preferred motion and the attentional suppression of attending to the anti-preferred motion were reduced or inverted by mistakenly attending to the distractor.
DISCUSSION
Our results demonstrate a pronounced effect of attention on the neural processing of visual motion information. These response changes reflect both the modulatory and the selective aspects of attention. Neurons in area MT and MST of macaque visual cortex increase their response when attention is directed into their receptive field (experiment 1). Also, when attention is directed toward one of two competing stimuli inside the receptive field, the response of the cells depends primarily on the movement of the attended dot (experiment 2). The influence of the ignored stimulus is much reduced, even when this stimulus is a powerful sensory stimulus, suggesting that the visual system is more concerned about creating a representation of the visual input that reflects the behavioral relevance of its various aspects than about an accurate reflection of its exact sensory properties.
Attention can both enhance and reduce responses
Although experiment 1 demonstrated that cells whose receptive field overlap the attended portion of visual space (often referred to as the “spotlight of attention”) show an enhanced response, the results from our experiment 2 demonstrate that the response of a cell can also decrease when attention is directed into the receptive field. When the animal was attending to the anti-preferred of two directions in the receptive field, the response was below the one evoked by the same stimulation when attention was directed outside the receptive field.
The attentional effects in experiment 2 were much stronger than in experiment 1. The greater difficulty of the task in experiment 2 might have contributed to this increased attentional modulation (Richmond and Sato, 1987; Spitzer et al., 1988; Rees et al., 1997). Furthermore, by combining an enhanced response to the target stimulus with a reduced responsiveness to the distractor dot experiment 2 effectively combines two influences in a push-pull fashion. This suggests that attentional effects within and from outside the receptive field might not represent different processes. Instead, rather than nonselectively enhancing all responses within the receptive field, attention appears to act as a selective processing mechanism that increases the influence of attended and decreases the influence of unattended stimuli even within the scale of the receptive field.
Relationship to other studies of attentional modulation
The results from experiment 2 are similar to those reported byMoran and Desimone (1985) and Luck et al. (1997) in V4, a visual area in the ventral pathway that lies at the same level of the cortical hierarchy as MT (Maunsell and Van Essen, 1983; Ungerleider and Desimone, 1986). They placed two colored or oriented stimuli inside the receptive field and found that responses were largely determined by the stimulus to which the animal was attending. This finding is consistent with the results of our experiment 2. In their experiment, however, responses to a stimulus in the receptive field were largely unaffected when attention was shifted between a stimulus inside the receptive field and one outside, whereas we found an attentional enhancement under these circumstances (our experiment 1). Although this seems to suggest that attention acts differently in the dorsal pathway than it does in areas more involved in processing color and form, a recent study has shown response modulations when switching attention from the outside to the inside of V4 neurons’ receptive fields that are comparable to the modulation we observed in area MT (McAdams and Maunsell, 1998).
In the dorsal pathway, several studies have described attentional and other extraretinal effects beyond area MT (MST, 7 and 7a: Bushnell et al., 1981; Mountcastle et al., 1981; Newsome and Paré, 1988;Andersen et al., 1990; Assad and Maunsell, 1994; and in PET studies of human parietal cortex: Corbetta et al., 1990, 1991). Although recent imaging studies have shown attentional modulation of the activity of the presumed human homolog of monkey MT (O’Craven et al., 1997;Beauchamp et al., 1997), previous physiological studies failed to find evidence for appreciable systematic extraretinal effects in MT (Newsome and Paré, 1988; Ferrera et al., 1994). In contrast, we found pronounced attentional effects in almost every neuron we encountered in this area. It is likely that this difference is attributable to differences in the tasks used.
Recently Seidemann and Newsome (1999) examined attentional modulation in MT using a design similar in some aspects to the current study. They used two 50% coherent random dot patterns and placed either one or both inside the receptive field. However, they found only a 6–12% attentional modulation. A number of differences in task design might account for this discrepancy, several of which have been discussed bySeidemann and Newsome (1999). For example, our design required the animal to maintain a high level of attention on the target while waiting for the stimulus change. In the other task, the animal may have made its decision early in the stimulus presentation and then removed its attention from the stimulus, waiting for the signal to make its report. Both the data from Seidemann and Newsome (1999) and the current data show a marked increase of attentional modulation as the trial progresses. Most of our data are further from the time of movement onset than their data (which were collected within the first second) increasing the difference in attentional modulation observed in the two studies. In our task, the animal always knew in which direction the target was moving, and the stimulus moving in the preferred direction was a powerful sensory stimulus. The other stimuli (containing 50% coherent motion) typically generated weaker responses. Finally, the other task required the animal to report the direction of target motion. This meant that the monkey was not directing its attention to a particular direction, but rather had to simultaneously monitor two opposing directions for evidence of predominance, removing the possible influence of attention to a particular direction (Treue and Martinez Trujillo, 1999).
Reshaping receptive fields and feature-based attention
Moran and Desimone (1985) suggested that the effects they observed with two stimuli placed inside the receptive field of V4 neurons could be explained by a shrinking of the receptive field around the attended stimulus, thereby reducing the influence of the unattended stimulus and causing the response of the cell to be dominated by the attended stimulus. Such spatial modulation is consistent with changes in the receptive field shape shown directly by recent work of Connor et al. (1996, 1997).
Another possible mechanism would be that the response of a cell to any stimulus is enhanced when the animal directs its attention toward stimulus features that the cell prefers. Such a nonspatial, feature-based attentional mechanism would for example enhance the responses of a cell that prefers red whenever the target is red and would cause a lower response from the same cell to any stimulus when the target has another, nonpreferred color.
The results from experiment 2 can be explained by either spatial or featural mechanisms. A spatial mechanism would require precise control of receptive field borders, because the two dots were separated by only a small distance. The most likely implementation of such a fine-scaled reshaping of the receptive field would be a manipulation of the inputs from earlier levels. The first cells in the primate visual system that are direction-selective are in area V1, and there is increasing evidence for attentional modulation in area V1 (Motter, 1993; Watanabe et al., 1998).
The large MT and MST receptive fields are build up by combining inputs from neurons with smaller receptive fields in V1, V2, and V3. As suggested recently by McAdams and Maunsell (1998), attention could primarily act in areas whose spatial resolution (represented by their receptive field sizes) best matches the current task of the animal. Neurons in these areas would be upregulated or downregulated in their entirety. In the case of experiment 2 this would enhance the response from input neurons whose receptive fields lay along the path of the target while neurons encoding the movement of the distractor would be silenced, creating a MT or MST neuron whose response would reflect primarily the movement of the target.
Nonspatial mechanisms, such as the feature-based mechanism proposed above, could also account for the current results. The existence of such attentional mechanisms is supported by recent physiological studies (Patzwahl et al., 1998; Treue and Martinez Trujillo, 1999) as well as by psychophysical evidence that a spatial mechanism such as a shrinking of the receptive field cannot explain all the selective modulation caused by attention. In expanding on an experiment byChaudhuri (1990), Lankheet and Verstraten (1995) demonstrated that switching attention from one direction to the other in a transparent random dot patterns containing two superimposed, oppositely moving sets of dots caused changes in the motion aftereffect, presumably because attention reduced the influence of the nonattended direction. Because the two patterns were completely spatially coincident, no spatial filtering could have teased them apart (although a filtering based on illusory separation in depth might be possible).
Similarly, a recent MRI study by O’Craven et al. (1997)demonstrated attentional modulation in the human homolog of area MT/MST in a motion attention task using spatially coincident patterns and a recent ERP study by Valdes-Sosa et al. (1998) has demonstrated differential effects when attending to the different motion components in transparently moving random-dot patterns.
In summary, our demonstration of robust attentional effects as early as MT, an area that receives direct input from V1 (Maunsell and Van Essen, 1983; Ungerleider and Desimone, 1986), suggests that responses of neurons throughout extrastriate cortex are profoundly influenced by behavioral state and that the sensory qualities of the visual input are but one factor in our understanding of visual information processing.
Footnotes
This work was supported by National Institutes of Health Grant R01 EY05911 and the Department of Science, Research, and Arts of Baden-Württemberg. J.H.R.M. is an investigator with the Howard Hughes Medical Institute. We thank B. Noerager for excellent technical assistance, and J. Assad and D. Leopold for helpful discussions and insightful comments on preliminary versions of this manuscript.
Correspondence should be addressed to Dr. Stefan Treue, Cognitive Neuroscience Laboratory, Department of Neurology, University of Tübingen, Auf der Morgenstelle 15, 72076 Tübingen, Germany.
REFERENCES
- 1.Andersen RA, Graziano MSA, Snowden R. Translational invariance and attentional modulation of MST cells. Soc Neurosci Abstr. 1990;16:7. [Google Scholar]
- 2.Assad JA, Maunsell JHR. Neuronal correlates of inferred motion in primate posterior parietal cortex. Nature. 1994;373:518–521. doi: 10.1038/373518a0. [DOI] [PubMed] [Google Scholar]
- 3.Beauchamp MS, Cox RW, DeYoe EA. Graded effects of spatial and featural attention on human area MT and associated motion processing areas. J Neurophysiol. 1997;78:516–520. doi: 10.1152/jn.1997.78.1.516. [DOI] [PubMed] [Google Scholar]
- 4.Britten KH. Spatial interactions within monkey middle temporal (MT) receptive fields. Soc Neurosci Abstr. 1995;21:663. [Google Scholar]
- 5.Britten KH, Shadlen MN, Newsome WT, Movshon JA. The analysis of visual motion: a comparison of neuronal and psychophysical performance. J Neurosci. 1992;12:4745–4765. doi: 10.1523/JNEUROSCI.12-12-04745.1992. [DOI] [PMC free article] [PubMed] [Google Scholar]
- 6.Britten KH, Newsome WT, Shadlen MN, Celebrini S, Movshon JA. A relationship between behavioral choice and the visual responses of neurons in macaque MT. Vis Neurosci. 1996;13:87–100. doi: 10.1017/s095252380000715x. [DOI] [PubMed] [Google Scholar]
- 7.Broadbent DE. Task combination and selective intake of information. Acta Psychologia. 1982;50:253–290. doi: 10.1016/0001-6918(82)90043-9. [DOI] [PubMed] [Google Scholar]
- 8.Bushnell C, Goldberg ME, Robinson DL. Behavioral enhancement of visual responses in monkey cerebral cortex. I. Modulation in posterior parietal cortex related to selective visual attention. J Neurophysiol. 1981;46:755–772. doi: 10.1152/jn.1981.46.4.755. [DOI] [PubMed] [Google Scholar]
- 9.Chaudhuri A. Modulation of the motion aftereffect by selective attention. Nature. 1990;344:60–62. doi: 10.1038/344060a0. [DOI] [PubMed] [Google Scholar]
- 10.Colby CL. The neuroanatomy and neurophysiology of attention. J Child Neurol. 1991;6:S90–S118. doi: 10.1177/0883073891006001s11. [DOI] [PubMed] [Google Scholar]
- 11.Connor CE, Gallant JL, Preddie DC, Van Essen DC. Responses in area V4 depend on the spatial relationship between stimulus and attention. J Neurophysiol. 1996;75:1306–1309. doi: 10.1152/jn.1996.75.3.1306. [DOI] [PubMed] [Google Scholar]
- 12.Connor CE, Preddie DC, Gallant JL, Van Essen DC. Spatial attention effects in macaque area V4. J Neurosci. 1997;17:3201–3214. doi: 10.1523/JNEUROSCI.17-09-03201.1997. [DOI] [PMC free article] [PubMed] [Google Scholar]
- 13.Corbetta M, Miezin FM, Dobmeyer S, Shulman GL, Petersen SE. Attentional modulation of neural processing of shape, color, and velocity in humans. Science. 1990;248:1556–1559. doi: 10.1126/science.2360050. [DOI] [PubMed] [Google Scholar]
- 14.Corbetta M, Miezin FM, Dobmeyer S, Shulman GL, Petersen SE. Selective and divided attention during visual discriminations of shape, color, and speed: functional anatomy by positron emission tomography. J Neurosci. 1991;1:2383–2402. doi: 10.1523/JNEUROSCI.11-08-02383.1991. [DOI] [PMC free article] [PubMed] [Google Scholar]
- 15.Corbetta M, Miezin FM, Shulman GL, Petersen SE. A PET study of visuospatial attention. J Neurosci. 1993;13:1202–1226. doi: 10.1523/JNEUROSCI.13-03-01202.1993. [DOI] [PMC free article] [PubMed] [Google Scholar]
- 16.Cornette L, Dupont P, Rosier A, Sunaert S, Van Hecke P, Michiels J, Mortelmans L, Orban GA. Human brain regions involved in direction discrimination. J Neurophysiol. 1998;79:2749–2765. doi: 10.1152/jn.1998.79.5.2749. [DOI] [PubMed] [Google Scholar]
- 17.Desimone R, Duncan J. Neural mechanisms of selective visual attention. Annu Rev Neurosci. 1995;18:193–222. doi: 10.1146/annurev.ne.18.030195.001205. [DOI] [PubMed] [Google Scholar]
- 18.Eriksen CW, St. James JD. Visual attention within and around the field of focal attention: a zoom lens model. Percept Psychophys. 1986;40:225–240. doi: 10.3758/bf03211502. [DOI] [PubMed] [Google Scholar]
- 19.Felleman DJ, Van Essen DC. Distributed hierarchical processing in the primate cerebral cortex. Cereb Cortex. 1991;1:1–47. doi: 10.1093/cercor/1.1.1-a. [DOI] [PubMed] [Google Scholar]
- 20.Ferrera VP, Rudolph KK, Maunsell JHR. Responses of neurons in the parietal and temporal visual pathways during a motion task. J Neurosci. 1994;14:6171–6186. doi: 10.1523/JNEUROSCI.14-10-06171.1994. [DOI] [PMC free article] [PubMed] [Google Scholar]
- 21.Gallyas F. Silver staining of myelin by means of physical development. Neurol Res. 1979;1:203–209. doi: 10.1080/01616412.1979.11739553. [DOI] [PubMed] [Google Scholar]
- 22.Gibson JR, Maunsell JHR. Sensory modality specificity of neural activity related to memory in visual cortex. J Neurophysiol. 1997;78:1263–1275. doi: 10.1152/jn.1997.78.3.1263. [DOI] [PubMed] [Google Scholar]
- 23.James W. The principles of psychology. Henry Holt; New York: 1890. [Google Scholar]
- 24.Johnston WA, Dark VJ. Selective attention. Annu Rev Psychol. 1986;37:43–75. [Google Scholar]
- 25.Judge SJ, Richmond BJ, Shu FC. Implantation of magnetic search coils for measurement of eye position: an improved method. Vision Res. 1980;20:535–537. doi: 10.1016/0042-6989(80)90128-5. [DOI] [PubMed] [Google Scholar]
- 26.Julesz B. Toward an axiomatic theory of preattentive vision. In: Edelman GM, Gall WE, Cowan WM, editors. Dynamic aspects of neocortical function. Neurosciences Research Foundation; New York: 1984. pp. 585–612. [Google Scholar]
- 27.Kinchla RA. Attention. Annu Rev Psychol. 1992;43:711–742. doi: 10.1146/annurev.ps.43.020192.003431. [DOI] [PubMed] [Google Scholar]
- 28.Lankheet MJM, Verstraten FAJ. Attentional modulation of adaptation to two-component transparent motion. Vision Res. 1995;35:1401–1412. doi: 10.1016/0042-6989(95)98720-t. [DOI] [PubMed] [Google Scholar]
- 29.Logothetis NK. Physiological studies of motion inputs. In: Smith AT, Snowden RJ, editors. Visual detection of motion. Academic; New York: 1994. pp. 177–216. [Google Scholar]
- 30.Luck SJ, Chelazzi L, Hillyard SA, Desimone R. Neural mechanisms of spatial selective attention in areas V1, V2, and V4 of macaque visual cortex. J Neurophysiol. 1997;77:24–42. doi: 10.1152/jn.1997.77.1.24. [DOI] [PubMed] [Google Scholar]
- 31.Maunsell JHR. The brain’s visual world: representation of visual targets in cerebral cortex. Science. 1995;270:764–769. doi: 10.1126/science.270.5237.764. [DOI] [PubMed] [Google Scholar]
- 32.Maunsell JHR, Van Essen DC. The connections of the middle temporal visual area (MT) and their relationship to a cortical hierarchy in the macaque monkey. J Neurosci. 1983;3:2563–2586. doi: 10.1523/JNEUROSCI.03-12-02563.1983. [DOI] [PMC free article] [PubMed] [Google Scholar]
- 33.Maunsell JHR, Sclar G, Nealey TA, De Priest DD. Extraretinal representations in area V4 in the macaque monkey. Vis Neurosci. 1991;7:561–573. doi: 10.1017/s095252380001035x. [DOI] [PubMed] [Google Scholar]
- 34.McAdams CJ, Maunsell JHR. Effects if attention on orientation-tuning functions of single neurons in macaque cortical area V4. J Neurosci. 1998;19:431–441. doi: 10.1523/JNEUROSCI.19-01-00431.1999. [DOI] [PMC free article] [PubMed] [Google Scholar]
- 35.Moran J, Desimone R. Selective attention gates visual processing in the extrastriate cortex. Science. 1985;229:782–784. doi: 10.1126/science.4023713. [DOI] [PubMed] [Google Scholar]
- 36.Motter BC. Focal attention produces spatially selective processing in visual cortical areas V1, V2, and V4 in the presence of competing stimuli. J Neurophysiol. 1993;70:909–919. doi: 10.1152/jn.1993.70.3.909. [DOI] [PubMed] [Google Scholar]
- 37.Mountcastle VB, Andersen RA, Motter BC. The influence of attentive fixation upon the excitability of light-sensitive neurons of the posterior parietal cortex. J Neurosci. 1981;1:1218–1235. doi: 10.1523/JNEUROSCI.01-11-01218.1981. [DOI] [PMC free article] [PubMed] [Google Scholar]
- 38.Newsome WT, Paré EB. A selective impairment of motion perception following lesions of the middle temporal visual area (MT). J Neurosci. 1988;8:2201–2211. doi: 10.1523/JNEUROSCI.08-06-02201.1988. [DOI] [PMC free article] [PubMed] [Google Scholar]
- 39.Newsome WT, Wurtz RH, Komatsu H. Relation of cortical areas MT and MST to pursuit eye movements. II. Differentiation of retinal from extraretinal inputs. J Neurophysiol. 1988;60:604–620. doi: 10.1152/jn.1988.60.2.604. [DOI] [PubMed] [Google Scholar]
- 40.O’Craven KM, Rosen BR, Kwong KK, Treisman A, Savoy RL. Voluntary attention modulates fMRI activity in human MT-MST. Neuron. 1997;18:591–598. doi: 10.1016/s0896-6273(00)80300-1. [DOI] [PubMed] [Google Scholar]
- 41.Orban GA, Dupont P, Vogels R, De Bruyn B, Bormans G, Mortelmans L. Task dependency of visual processing in the human visual system. Behav Brain Res. 1996;76:215–223. doi: 10.1016/0166-4328(95)00195-6. [DOI] [PubMed] [Google Scholar]
- 42.Pashler HE. The psychology of attention. MIT; Cambridge: 1997. [Google Scholar]
- 43.Patzwahl DR, Ilg UJ, Treue S. Switching attention between transparent motion components modulates responses of MT and MST neurons. Soc Neurosci Abstr. 1998;24:649. [Google Scholar]
- 44.Posner MI. Orienting of attention. Q J Exp Psychol. 1980;32:3–25. doi: 10.1080/00335558008248231. [DOI] [PubMed] [Google Scholar]
- 45.Press WA, Van Essen DC. Attentional modulation of neuronal responses in macaque area V1. Soc Neurosci Abstr. 1997;23:1026. [Google Scholar]
- 46.Rees G, Frith CD, Lavie N. Modulating irrelevant motion perception by varying attentional load in an unrelated task. Science. 1997;278:1616–1619. doi: 10.1126/science.278.5343.1616. [DOI] [PubMed] [Google Scholar]
- 47.Richmond BJ, Sato T. Enhancement of inferior temporal neurons during visual discrimination. J Neurophysiol. 1987;58:1292–1306. doi: 10.1152/jn.1987.58.6.1292. [DOI] [PubMed] [Google Scholar]
- 48.Robinson DA. A method of measuring eye movement using a scleral search coil in a magnetic field. IEEE Trans Biomed Eng. 1963;10:137–145. doi: 10.1109/tbmel.1963.4322822. [DOI] [PubMed] [Google Scholar]
- 49.Salzman CD, Murasugi CM, Britten KH, Newsome WT. Microstimulation in visual area MT: effects on direction discrimination performance. J Neurosci. 1992;12:2331–2355. doi: 10.1523/JNEUROSCI.12-06-02331.1992. [DOI] [PMC free article] [PubMed] [Google Scholar]
- 50.Seidemann E, Newsome WT. Effect of spatial attention on the responses of area MT neurons. J Neurophysiol. 1999;81:1783–1794. doi: 10.1152/jn.1999.81.4.1783. [DOI] [PubMed] [Google Scholar]
- 51.Seidemann E, Zohary E, Newsome WT. Temporal gating of neural signals during performance of a visual discrimination task. Nature. 1998;394:72–73. doi: 10.1038/27906. [DOI] [PubMed] [Google Scholar]
- 52.Shulman GL, Corbetta M, Buckner RL, Raichle ME, Fiez JA, Miezin FM, Petersen SE. Top-down modulation of early sensory cortex. Cereb Cortex. 1997;7:193–206. doi: 10.1093/cercor/7.3.193. [DOI] [PubMed] [Google Scholar]
- 53.Spitzer H, Desimone R, Moran J. Increased attention enhances both behavioral and neuronal performance. Science. 1988;240:338–340. doi: 10.1126/science.3353728. [DOI] [PubMed] [Google Scholar]
- 54.Treue S, Maunsell JHR. Attentional modulation of visual motion processing in cortical areas MT and MST. Nature. 1996;382:539–541. doi: 10.1038/382539a0. [DOI] [PubMed] [Google Scholar]
- 55.Treue S, Martinez Trujillo JC. Feature-based attention influences motion processing gain in macaque visual cortex. Nature. 1999;399:575–579. doi: 10.1038/21176. [DOI] [PubMed] [Google Scholar]
- 56.Ungerleider LG, Desimone R. Cortical connections of visual area MT in the macaque. J Comp Neurol. 1986;248:190–222. doi: 10.1002/cne.902480204. [DOI] [PubMed] [Google Scholar]
- 57.Valdes-Sosa M, Bobes MA, Rodriguez V, Pinilla T. Switching attention without shifting the spotlight: object-based attentional modulation of brain potentials. J Cog Neurosci. 1998;10:137–151. doi: 10.1162/089892998563743. [DOI] [PubMed] [Google Scholar]
- 58.Van Essen DC, Maunsell JHR, Bixby JL. The middle temporal visual area in the macaque: myeloarchitecture, connections, functional properties and topographic organization. J Comp Neurol. 1981;199:293–326. doi: 10.1002/cne.901990302. [DOI] [PubMed] [Google Scholar]
- 59.Van Essen DC, Anderson CH, Felleman DJ. Information processing in the primate visual system: an integrated systems perspective. Science. 1992;255:419–423. doi: 10.1126/science.1734518. [DOI] [PubMed] [Google Scholar]
- 60.Vandenberghe R, Duncan J, Dupont P, Ward R, Poline JB, Bormans G, Michiels J, Mortelmans L, Orban GA. Attention to one or two features in left and right visual field: a positron emission tomography study. J Neurosci. 1997;17:3739–3750. doi: 10.1523/JNEUROSCI.17-10-03739.1997. [DOI] [PMC free article] [PubMed] [Google Scholar]
- 61.Watanabe T, Sasaki Y, Miyauchi S, Putz B, Fujimaki N, Nielsen M, Takino R, Miyakawa S. Attention-regulated activity in human primary visual cortex. J Neurophysiol. 1998;79:2218–2221. doi: 10.1152/jn.1998.79.4.2218. [DOI] [PubMed] [Google Scholar]
- 62.Wojciulik E, Kanwisher N, Driver J. Covert visual attention modulates face-specific activity in the human fusiform gyrus: fMRI study. J Neurophysiol. 1998;79:1574–1578. doi: 10.1152/jn.1998.79.3.1574. [DOI] [PubMed] [Google Scholar]
- 63.Wurtz RH, Richmond BJ, Newsome WT. Modulation of cortical visual processing by attention, perception, and movement. In: Edelman GE, editor. Dynamical aspects of neocortical function. Wiley; New York: 1982. pp. 195–217. [Google Scholar]


