

Abstract
Studies on the development of synaptic specificity, embryonic activity, and neuronal specification in the spinal cord have all been limited by the absence of a functionally identified interneuron class (defined by its unique set of connections). Here, we identify an interneuron population in the embryonic chick spinal cord that appears to be the avian equivalent of the mammalian Renshaw cell (R-interneurons). These cells receive monosynaptic nicotinic, cholinergic input from motoneuron recurrent collaterals. They make predominately GABAergic connections back onto motoneurons and to other R-interneurons but project rarely to other spinal interneurons. The similarity between the connections of the developing R-interneuron, shortly after circuit formation, and the mature mammalian Renshaw cell raises the possibility that R-interneuronal connections are formed precisely from the onset. Using a newly developed optical approach, we identified the location of R-interneurons in a column, dorsomedial to the motor nucleus. Functional characterization of theR-interneuron population provides the basis for analyses that have so far only been possible for motoneurons.
Keywords: spinal interneuron, Renshaw cell, spontaneous activity, imaging, synaptic specificity, spinal cord, chick embryo
The motor output of the spinal cord is generated, in large part, by circuits of interneurons. Despite the importance of these cells, almost nothing is known about their development and incorporation into functional networks. Instead, the ontogeny of spinal neurons has been predominantly focused on motoneurons, which can be readily identified by the muscle they innervate. For example, motoneurons and their muscle afferent synapses have provided the model system for studying the mechanisms underlying the development of synaptic specificity in the spinal cord (Frank and Wenner, 1993). In addition, Jessell and collaborators have used spinal motoneurons to examine the role of transcription factors in the specification of neuronal identity (Goulding, 1998; Lin et al., 1998;Tanabe et al., 1998). In contrast, little is known about interneuronal specification or the formation of interneuronal synaptic connections. This is because interneurons are difficult to identify and, as a result, there are no functionally identified interneurons in the developing spinal cord.
Even in the mature spinal cord, only a few interneuronal types have been functionally identified. The first interneuronal class to be recognized in the adult was the Renshaw cell, which is unique in receiving direct cholinergic input from motoneuron recurrent collaterals and is therefore comparatively easy to identify electrophysiologically (Renshaw, 1946; Eccles et al., 1954; Haase et al., 1975; Baldissera et al., 1981; Windhorst, 1990). These cells make direct glycinergic, and possibly GABAergic, connections with motoneurons and with other Renshaw cells (Renshaw, 1946; Eccles et al., 1954; Ryall, 1970; Cullheim and Kellerth, 1981). In the adult cat, Renshaw cells are located in a column medial to the motor nucleus (Jankowska and Lindstrom, 1971; Baldissera et al., 1981). One previous study showed that some spinal interneurons in the fetal cat received direct input from motoneurons, but only a few cells were examined and they were not studied in any detail (Naka, 1964). In the chick spinal cord, Renshaw-like interneurons are likely to exist because stimulation of the ventral roots results in motoneuron synaptic potentials that have a similar pharmacology to the Renshaw pathway of adult mammals (Velumian, 1982; Ritter et al., 1999). Furthermore, motoneurons in the chick embryo are known to possess recurrent collaterals (Velumian and Poliakova, 1992).
Therefore, we have documented the synaptic connections and properties of a ventrally located interneuron population in the developing chick cord (R-interneurons) and provide evidence that this population is the avian equivalent of the mammalian Renshaw cell. Shortly after the connections form, they are similar to those of adult mammalian Renshaw cells, suggesting that they may be generated correctly from the outset. Characterization of these interneurons provides the foundation for future study of the mechanisms controlling specification of interneuronal identity, connectivity, and their role in embryonic rhythmic activity.
Preliminary reports of this work have been published in abstracts and discussed in reviews (O’Donovan et al., 1998; Wenner et al., 1998).
MATERIALS AND METHODS
Physiology. Chick embryos were removed from the egg at embryonic day 9 (E9) to E11 (stage 35–37) and staged according to the criteria of Hamburger and Hamilton (1951). Embryos were decapitated, and the spinal cords were isolated as described previously (O’Donovan, 1987, 1989) in recirculating cold (12–15°C) Tyrode’s solution (in mm: NaCl 139, KCl 2.9, NaHCO3 17, glucose 2.2, CaCl2 3, and MgCl2 1). The spinal cord was isolated together with certain muscle nerves (adductor, adductors and obturator; femorotibialis, external and medial head). The perfusion solution was slowly brought to room temperature (∼21°C), and then the cord was transferred to a recording chamber and left there for at least 2 hr before raising the temperature to ∼27°C for the remainder of the experiment. For overnight experiments (using retrograde labeling with calcium dyes), the temperature was brought to 17°C and left for up to 12 hr before beginning the experiment. Muscle nerves (with either cut ventral or dorsal roots), ventral roots, and ventrolateral funiculus (VLF) were drawn into suction electrodes for recording and/or stimulating. In the first set of experiments, whole-cell electrodes [4–8 MΩ, with a K gluconate solution (in mm): NaCl 10, K gluconate 130, HEPES 10, EGTA 1.1, CaCl2 0.1, MgCl2 1, and Na2ATP) were driven through the ventral white matter (after the pia was removed) as described previously (Sernagor and O’Donovan, 1991; Chub and O’Donovan, 1998). In the second set of experiments, a three-segment (LS1–LS3) piece of cord was isolated, and a whole-cell electrode was driven through the caudal face of the cord that had been cut transversely between LS3 and LS4. All whole-cell recordings were obtained using an Axoclamp 2B amplifier (Axon Instruments, Foster City, CA) and custom written data acquisition software (LabView 4.0; National Instruments, Austin, TX). Extracellular suction electrode recordings from ventral roots or muscle nerves were amplified 10,000 times and filtered at DC to 1 kHz. Cells were only accepted for further study if their membrane potential was more negative than −40 mV. Single-pulse and stimulus trains (usually seven stimuli at 20 Hz) of 30–50 μA were delivered for a 0.5 msec duration.
Spike-triggered averaging. For this purpose, we depolarized the membrane potential of the interneuron by ∼5–10 mV to produce action potentials at a steady rate of ∼1–2 Hz. The spikes were used to trigger an averaging program running on a Macintosh computer (Apple Computers, Cupertino, CA). Extracellular suction electrode recordings from ventral roots or muscle nerves were amplified 10,000 times and filtered at DC to 100 Hz. Up to 400 traces were obtained for each spike-triggered average.
Optical recordings. To visualize the interneurons activated by stimulation of the ventral roots or muscle nerves, we loaded a calcium dye, Ca-green1 dextran (10,000 MW; Molecular Probes, Eugene, OR) into ventrally located spinal interneurons. The lumbosacral cord was first cut transversely at LS6, and the cord surface over the lateral motor column (LMC) and the adjacent VLF was drawn into a suction electrode containing ∼20% of the dye in 0.2% Triton X-100 detergent (O’Donovan et al., 1993). This configuration was left overnight to allow retrograde transport of the calcium-sensitive dye back to the interneuronal cell bodies. After this loading period, the cords were again cut transversely between two adjacent ventral roots (typically at the LS3/LS4 border) to expose the labeled cell bodies. The cord was then positioned in a recording chamber on an inverted microscope (Diaphot; Nikon, Tokyo, Japan) viewing the caudal face of LS3, as described previously (O’Donovan et al., 1994). Single shocks or trains of stimuli (seven stimuli at 20 Hz) were applied to the ventral root or muscle nerve, and images were continuously acquired to videotape using an intensified video camera (Stanford Photonics, Palo Alto, CA). Specimens were illuminated using a 75 W Xenon Arc lamp with an excitation filter of 450–490 nm, dichroic of 510 nm, and a barrier filter of 520 nm. Various neutral density filters were used to reduce photodynamic damage. Images were magnified 10–20×.
Image analysis. During the experiment, video data (30 frames per second) were stored on S-VHS tape (SVO-9500MD; Sony, Tokyo, Japan). Images were digitized off-line, frame by frame, and processed on MetaMorph software (Universal Imaging Corp., West Chester, PA). To display regions activated by stimulation or spontaneous activity, we constructed difference images. These were generated by selecting and averaging eight consecutive frames (selected as those with the greatest intensity changes) and subtracting a 30-frame average obtained under control conditions (background image). The difference images were displayed in false color and were expanded to occupy the full range (0–255) of the frame store. Quantification of fluorescence changes was performed on specific regions of interest (ROI) as described previously (O’Donovan et al., 1994). Time series were generated by measuring the average intensity within a particular ROI in each frame of the video data. The series were then normalized to the background fluorescence and expressed as a percent change in fluorescence. The region corresponding to the R-interneuron region was defined as the area that showed an increase in fluorescence six SDs above the background fluorescence of the same region under control conditions.
RESULTS
Identification of spinal interneurons receiving recurrent synaptic input from motoneurons
The goal of the first part of the study was to identify interneurons receiving direct synaptic input from the recurrent collaterals of motoneurons (R-interneurons) (Fig.1A). Whole-cell recordings were obtained either “blind” by driving the patch electrode through the ventral white matter or by inserting the electrode into the cut transverse face of the cord (see below). The blind ventral approach allowed us to estimate the proportion of interneurons contacted directly by motoneuron collaterals in the ventral part of the lumbosacral cord. We found that a small minority of the ventral interneurons (7 of 136; 5.1% plus three additional cells) received short-latency (≤5 msec) depolarizing synaptic input after a single shock to the ventral roots (Fig. 1A). Because of the small yield of interneurons directly activated by motoneuron stimulation, we targeted a region dorsomedial to the lateral motor column that generated ventral root-evoked optical responses from interneurons labeled by calcium-sensitive dyes (see below). This targeting technique allowed us to record from R-interneurons more reliably than with the blind approach, although we did not document this quantitatively. Nevertheless, we recorded from an additional 20 R-interneurons in this region, for a total of 30 cells. The mean input impedance for R-interneurons was 578 ± 213 MΩ. The time constant computed in six of the cells was 31.0 ± 15.3 msec. The average amplitude of the potential evoked by a single stimulus applied to the ventral root or a motor nerve was 10.3 ± 5.8 mV (n = 30), and the average latency from the stimulus to the onset of the potential was 3.8 ± 0.8 msec (n = 23; in seven cells, the stimulus artifact obscured the latency measurement) (Fig. 1B,asterisk). In many R-interneurons, a single stimulus triggered a brief burst of action potentials (Fig.1A, bottom). Such behavior is reminiscent of the high-frequency (>1000 Hz) burst fired by mammalian Renshaw cells after a single shock applied to the ventral roots but at a much lower frequency (∼50 Hz). This difference may reflect the immaturity of the R-interneurons, although nothing is known about their behavior in adult animals.
Fig. 1.

Synaptic input from motoneurons toR-interneurons. A, Blind whole-cell recording from two R-interneurons after stimulating motoneuron (mn) axons in either the ventral root or a muscle nerve. The top shows the potential recorded in response to stimulation of the femorotibialis motor nerve and reveals the short latency of the evoked response. The bottomshows the potential in another R-interneuron induced by ventral root stimulation. Arrowheads marks the stimulus artifact. The experimental configuration, including theR-interneuron circuit diagram, is shown in the schematic on the right. The arrowhead on the schematic shows the synaptic connection examined. B, Histogram of the latency distribution for a subset of sixR-interneurons that received both short- and long-latency input and three additional interneurons that received only long-latency input after stimulation of motor axons. The latencies for the early (≤5 msec; mono) and late (polysynaptic) potentials are plotted separately for the six cells (black bars). The latencies for the three cells receiving only late potentials are plotted as gray bars. The asterisk under thearrow indicates the average (± SD) latency for monosynaptic potentials for all recorded R-interneurons in the study (3.8 ± 0.8 msec; n = 23).di-syn, Disynaptic.
Although latencies can sometimes be difficult to interpret, the short latency of the evoked potentials (3.8 msec) strongly suggests that the motoneuronal input to these interneurons was monosynaptic. In comparison, muscle afferent-evoked monosynaptic potentials in lumbosacral motoneurons have an average latency of ∼5 msec after the afferent volley recorded in the dorsal root ganglion (Lee et al., 1988). Further evidence in support of this conclusion comes from examining the distribution of latencies observed in a set of six interneurons that received both short- and long-latency potentials (Fig. 1B, black bars) and three that received only polysynaptic input (Fig. 1B,gray bars). There was a clear separation between the shortest latency potentials (≤5 msec, presumed monosynaptic) and longer latency potentials that are probably polysynaptic. Within the polysynaptic group, the shortest latencies are likely to be disynaptic (9–14 msec) (Fig. 1B, di-syn).
Synaptic connections of interneurons receiving monosynaptic input from motoneurons
The observation that a subset of ventral interneurons receives direct input from motoneuron recurrent collaterals makes them excellent candidates as the avian homolog of the mammalian Renshaw cell. To obtain further support for this idea, we established whether they made synaptic connections with motoneurons, as do adult mammalian Renshaw cells. For this purpose, we averaged the potentials recorded extracellularly from the ventral root or a motor nerve, time-locked to the R-interneuron spike (see Materials and Methods). A depolarizing potential was detected in the ventral root or muscle nerve recordings averaged from the spikes from 25 of 29R-interneurons (Fig. 2). Chloride-mediated conductances are depolarizing and can be functionally excitatory at this stage in the chick embryo (Sernagor et al., 1995). To quantify and compare the strength of the projections, the amplitude of the averaged potential was normalized to the amplitude of the ventral root or motor nerve potential during an episode of spontaneous activity. A spontaneous episode represents a maximal output of the spinal network and provides an internal reference for comparing the amplitude of the spike-triggered averaged electrotonic potentials recorded in the muscle nerves (Ritter et al., 1999). The mean amplitude of the averaged ventral root potential was 0.23 ± 0.08% of the episode amplitude with a mean latency from the trigger spike of 7.2 ± 1.9 msec (n = 5 cells). Spike-triggered averages recorded from the femorotibialis and adductor motor nerves were 0.72 ± 0.42% (n = 12) and 0.42 ± 0.23% (n = 13) of the episode amplitude, respectively. The corresponding latencies were 9.8 ± 1.7 msec (n = 10) and 10.3 ± 1.8 msec (n = 11). Such averaged potentials are strong evidence that theseR-interneurons project monosynaptically to motoneurons and are, therefore, similar to the mammalian Renshaw cell.
Fig. 2.

Synaptic projection fromR-interneurons to motoneurons. Evidence thatR-interneurons project to motoneurons is demonstrated by the presence of R-interneuron spike-triggered averaged potentials in the adductor and femorotibialis motor nerves (200 traces averaged). Whole-cell recordings were made in the region dorsomedial to the lateral motor column, which was shown by calcium imaging to contain interneurons activated by motoneuron stimulation. The averaged interneuronal spike is shown at the bottom. Suction electrodes were used for extracellular recordings. The calibration on the motor nerve potentials indicates the amplitude of the potential as a percentage of the motor nerve potential recorded during a spontaneous episode (see Results). The schematic to the right of thetraces indicates the recording arrangement, and thearrowhead shows the synaptic connection examined.
In the adult cat, Renshaw cells do not appear to receive monosynaptic input from muscle afferents (Ryall and Piercey, 1971). However, three of four R-interneurons in our study appeared to receive direct input from muscle afferents. The latency of these inputs (7.3 ± 1.2 msec; 4.1 ± 0.9 mV) was as brief as the monosynaptic inputs from muscle afferents to motoneurons located in the same segment (Lee and O’Donovan, 1991), indicating that the connection was likely to be monosynaptic. This apparent difference in connectivity between the mammalian Renshaw cell and chick R-interneurons is addressed in Discussion.
Pharmacology of R-interneuron synaptic connections
It has been demonstrated previously that the potentials recorded in a ventral root by stimulation of the adjacent root are blocked by the nicotinic, cholinergic antagonist mecamylamine (Chub and O’Donovan, 1998; Fedirchuk et al., 1999; Ritter et al., 1999), the GABAA antagonist bicuculline, and the glycine antagonist strychnine (O’Donovan, 1989). These studies suggest that the avian recurrent pathway has a similar pharmacology to the mammalian Renshaw circuit. In the next set of experiments, we established whether the inputs and outputs of the R-interneurons exhibited the appropriate pharmacology for the Renshaw pathway. We first tested the ability of the nicotinic, cholinergic antagonist mecamylamine to block the synaptic potentials evoked in R-interneurons by motoneuron stimulation. In three cells, bath-applied mecamylamine (30–50 μm) reduced the potential to 5.8 ± 10.0% of the control amplitude, although muscle afferent stimulation was still capable of triggering an episode in the presence of the drug (Fig. 3). In two cells, a partial washout was achieved (11.7 and 50.0% of the control potential). The motoneuron-evoked potentials were not affected by bath-applied bicuculline (5–50 μm; 91.8 ± 24.4% of predrug amplitude; n = 7). Collectively, these findings indicate that the ventral root–motor nerve-evoked depolarization is mediated by nicotinic, cholinergic receptors.
Fig. 3.

Pharmacology of the recurrent inputs toR-interneurons. The top traces show control recordings from an R-interneuron in response to stimulation of the ventral roots (left traces) or muscle afferents (right traces). The ventral root-evoked potential was abolished in the presence of the bath-applied nicotinic, cholinergic antagonist mecamylamine (bottom left trace). In contrast, the amplitude of the potential associated with an episode, triggered by dorsal root stimulation, was unaffected by the drug (bottom right trace). Traces are averages of five, except where noted. Arrows mark the stimulus artifact.
We then tested the pharmacology of the synaptic connection from theR-interneurons to motoneurons. This was done by establishing the effects of GABAA and glycine antagonists on the spike-triggered potentials averaged from the ventral root or motor nerve recording (Fig. 4). In the presence of the GABAA antagonist bicuculline (10–50 μm), the spike-triggered potential was abolished in six of six averages recorded from four cells (two of the cells produced potentials in two different muscle nerves). The spike-triggered potential was reduced to 24.9 ± 17.3% of the control amplitude in five cells in the presence of 5 μm bicuculline. We next tested the effects of the glycine antagonist strychnine (5 μm) on the spike-triggered potentials recorded in the muscle nerves. In three cases (triggered from spikes in two different cells), the amplitude of the potential was reduced to 65.3 ± 9.8% (Fig. 4,right). In one of the experiments, a similar depression (to 76% of the control amplitude) was observed in the ventral root potentials evoked by stimulation of the adjacent ventral root, suggesting that the pharmacological behavior of thisR-interneuron was representative of the population as a whole. Spike-triggered potentials were unaffected by bath application of AP-5 and CNQX (50 and 20 μm, respectively; 5.2 ± 35.2% increase; n = 6 averages from 3 cells; data not shown). Collectively, these results suggest that GABA is the predominant neurotransmitter of the R-interneuron population but do not rule out a role for glycine.
Fig. 4.

Pharmacology of the synaptic projections ofR-interneurons. The pharmacology of the connection between R-interneurons and motoneurons was examined by testing the dependence of the R-interneuron spike-triggered averaged muscle nerve potential to GABAA or glycine antagonists. The traces at theleft show the abolition of averaged potential recorded in the femorotibialis muscle nerve by the GABAA antagonist bicuculline. The averaged femorotibialis muscle nerve potential from a different R-interneuron is shown in the right traces and was only partially reduced by the glycine antagonist strychnine. The averaged interneuronal spikes are shown in thebottom traces. n, Number oftraces averaged.
Evidence for mutual connectivity amongR-interneurons
We next performed experiments to establish whetherR-interneurons are mutually interconnected, as are adult mammalian Renshaw cells (Ryall, 1970). We reasoned that ifR-interneurons were mutually interconnected, then someR-interneurons might receive direct projections from one muscle nerve and indirect projections from another (Fig.5A, right). Consistent with this hypothesis, we found that 55% (6 of 11) of theR-interneurons receiving monosynaptic input from either the adductor or femorotibialis muscle nerves also received long-latency (>5 msec), but not short-latency (<5 msec), depolarizing input from the other motor nerve (average amplitude of 2.3 ± 1.1 mV). We found that single shocks were not a reliable way to evoke these long-latency potentials and that a brief train was more effective. An example of this is illustrated in Figure 5A, which compares the potentials recorded in an R-interneuron in response to trains applied to the femorotibialis or adductor motor nerves. A large monosynaptic potential was produced in this cell by femorotibialis nerve stimulation (Fig. 5A, top green trace), whereas only the later stimuli of the adductor train produced a potential in the cell (Fig. 5A, bottom green trace). Also, consistent with the hypothesis of mutual connectivity between R-interneurons, we found that the adductor-evoked polysynaptic potential was abolished in the presence of a GABAA antagonist (n = 2) (Fig.5A, red trace). Train-induced polysynaptic potentials were much less common in interneurons that did not receive monosynaptic input from motoneuron recurrent collaterals (non-R-interneurons; 2 of 38 cells; 5.3%). Moreover, the two cells that did receive such input did not fire after the motoneuron stimulus, in contrast to R-interneurons. We examined the motoneuron inputs to such interneurons 10–15 min after an episode, when network excitability was high, to maximize the chance of detecting polysynaptic potentials (Fedirchuk et al., 1999).
Fig. 5.

Evidence for mutual interconnectivity between R-interneurons. Potentials recorded fromR-interneurons in response to stimulus trains (5–7 stimuli at 20 Hz; arrowheads mark the stimulus artifacts) applied to the adductor (st. add) or femorotibialis (st. fem) motor nerves under control conditions (green traces), in the presence of the GABAA antagonist bicuculline (Bic,red traces), and during washout of the drug (blue trace). The schematics to the right illustrate the corresponding circuit in control and drug conditions.Mn, Motoneuron; R-I,R-interneuron. A, AnR-interneuron that received monosynaptic input from the femorotibialis motor nerve (top trace) received late, polysynaptic input when the stimulus train was applied to the adductor motor nerve (middle trace). This late adductor-evoked polysynaptic response was abolished in the presence of bicuculline.B, An R-interneuron receiving both monosynaptic and polysynaptic input after a stimulus train delivered to the femorotibialis motor nerve (green traces). Only the polysynaptic component of the potential was abolished in the presence of bicuculline (red traces). See Results for more details.
We also found that trains applied to a particular muscle nerve resulted in a progressive potentiation throughout the train (five of sevenR-interneurons) (Fig. 5B). Under control conditions, the evoked potential after the final stimulus of the train was 221 ± 124% of the potential after the first stimulus. Bath application of bicuculline (5–50 mm) (Fig.5B) blocked the potentiation during the stimulus train so that the amplitude of the potential after the final stimulus was only 127 ± 68% of the first.
The simplest interpretation of the findings above is that the train-induced potentials are a combination of direct cholinergic inputs from motoneurons (unaffected by bicuculline) and indirect GABAergic potentials (Fig. 5B, right). At present, the source of these GABAergic potentials is unknown. We hypothesize that they are derived from other R-interneurons and note that a progressive recruitment within such a recurrently connected population could account for the train-induced potentiation of the bicuculline-sensitive potentials.
Optical identification of interneurons activated after motoneuron stimulation
In the next set of experiments, we used calcium imaging to identify the location, distribution, and pharmacology of theR-interneuron population. For this purpose, we retrogradely labeled many ventrally located interneurons with a calcium-sensitive dye applied to the VLF (see Materials and Methods). We knew that some of the labeled cells should be R-interneurons because, in three of six whole-cell recordings, their axons could be antidromically activated from the VLF, one to two segments away (Fig.6A). Figure6Ba shows an epifluorescence videomicrograph of the transversely cut face of the spinal cord (LS3/LS4) after the dye was applied to the VLF between LS5 and LS6. Labeled interneurons were distributed over most of the ventral part of the spinal cord, but no labeled cells were observed in the LMC. To visualize theR-interneurons, we stimulated the LS3 ventral root (Fig.6Bb). We could not detect optical signals in response to a single shock but were successful when using short trains. In this and in other experiments, we found that the cells activated by the ventral root stimulus train were located dorsomedial to the LMC. We examined the spatial distribution of this population by comparing difference images generated at different levels of the spinal cord (LS1/LS2–LS3/LS4, Fig. 6C) and established that the cells were located in this characteristic position throughout the rostral lumbosacral cord (n = 8).
Fig. 6.
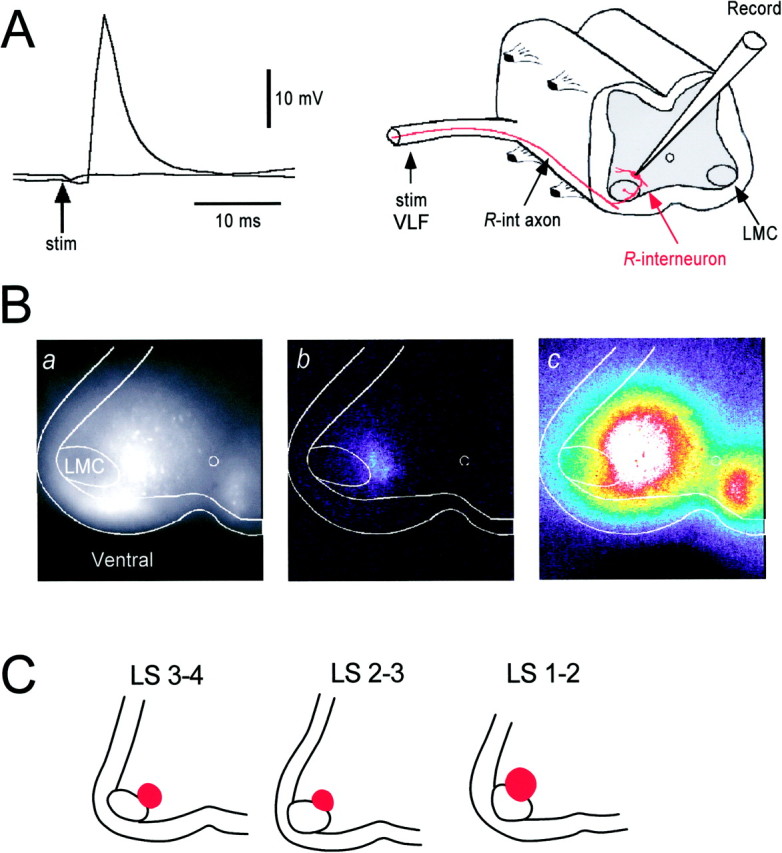
Optical imaging and whole-cell recording of interneurons activated by motoneuron stimulation. A, Evidence that R-interneurons project their axons several segments into the VLF was obtained by recording an all-or-none short-latency action potential in an R-interneuron (located in the LS1 segment) in response to antidromic stimulation of the VLF at T7. Two traces are shown corresponding to stimulation at 10 mA (subthreshold for the spike) and 15 mA (suprathreshold for the spike). The recording arrangement is shown to the right of the traces.B, Visualization of interneurons activated by ventral root stimulation. a, An averaged epifluorescence image (30 frames) of labeled interneurons in the cut transverse face of the spinal cord (at LS3) after applying calcium green dextran to the VLF at LS4/LS5 several hours previously (see Materials and Methods). The borders of the spinal cord, white matter, and LMC are shown.b, During stimulation of the LS3 ventral root (7 stimuli at 20 Hz) optical signals were restricted to a region dorsomedial to the lateral motor column. c, Activation of the labeled interneurons during the occurrence of a spontaneous episode of activity displayed at the same gain as the image in shown in b. The images in b and c were generated by subtracting an eight-frame average obtained during the stimulation or activity from a 30-frame control image obtained in the absence of stimulation or activity. These images were stretched to occupy the full range of the frame store and pseudocolored. C, The regions in which optical signals were recorded after ventral root stimulation are shown at several levels (LS1–LS4) of the anterior lumbosacral cord. The regions are shown in red and were defined by a stimulus-induced increase in fluorescence six SDs above the prestimulus control fluorescence.
To establish whether the optically active population had the pharmacological properties appropriate for R-interneurons, we determined the dependence of the optical signals on a nicotinic, cholinergic antagonist. Mecamylamine (10–50 μm) reduced the optical response to 3.6 ± 7.2% of the control values (n = 4) (Fig.7A). These results suggest that a nucleus of VLF-projecting interneurons dorsomedial to the motor column is activated through stimulation of motoneuron recurrent collaterals. To determine whether the cells contributing to the optical activity received monosynaptic and/or polysynaptic input (relayed through R-interneurons), we blocked the output of the R-interneuron population by bath application of bicuculline. Optical signals were dramatically reduced (10.8 ± 8.0%; n = 5) in the presence of the GABAA antagonist (5–50 μm) (Fig. 7B). The residual optical signal is presumably derived from the direct, cholinergic motoneuronal inputs to R-interneurons. However, these results emphasize that the majority of the optical signal is likely to be derived from interneurons activated indirectly by the motoneuron stimulus.
Fig. 7.

Pharmacology of the optical signals evoked by motor axon stimulation. Time series of the fluorescence changes averaged over the optically active region in response to a brief train of stimuli applied to the ventral root (arrow; 7 stimuli at 20 Hz) in the presence of neurotransmitter antagonists. The optical signals were abolished in the presence of the bath-applied cholinergic antagonist mecamylamine (A) and substantially reduced in the presence of the GABAA antagonist bicuculline (B).
Two additional observations reinforced this suggestion. First, optical signals were only observed in response to stimulus trains and not single stimuli, despite the fact that whole-cell recordings showed thatR-interneurons often spiked after a single ventral root stimulus. Because optical methods are capable of resolving single spikes, at least in motoneurons (O’Donovan et al., 1993, 1994), this finding suggests that a large part of the optical signal was derived from polysynaptically recruited interneurons. Second, whole-cell recordings showed that cells within the R-interneuron region, but in the superficial layers of the cut face (that would generate most of the optical signal), received polysynaptic (>10 msec latency), but not monosynaptic, input from motoneurons. In contrast, deeper cells within the optically active region were activated monosynaptically by motor nerve stimulation. Figure8 shows a whole-cell recording from a superficially located cell within the optically active region. The first stimulus did not produce a potential but the second, third, and fourth stimuli of the train resulted in potentials of disynaptic latency (Fig. 8, gray arrowheads). This observation indicates that the cell was not activated directly by motoneuron collaterals but was likely to be activated disynaptically through otherR-interneurons. Collectively, these findings suggest that the optical signals are derived from superficially lyingR-interneurons that have been deprived of their direct motoneuronal input because of damage resulting from the cut but can still be driven indirectly from R-interneurons deep to the surface (see Discussion).
Fig. 8.

Whole-cell recording from superficially lying interneuron in the optically active region. Whole-cell recording obtained from an interneuron in the superficial layer of the transversely cut face demonstrates that this cell did not receive short-latency, monosynaptic input during a stimulus train applied to the muscle nerve. The cell did, however, receive polysynaptic potentials, including some that were probably disynaptic (gray arrowheads), in response to the stimulus train (arrows mark stimulus artifacts). A schematic representation of the likely circuit is shown on theleft.
DISCUSSION
In this report, we have, for the first time, characterized an interneuronal species in the developing spinal cord based on its unique set of connections (R-interneurons). The cells receive monosynaptic cholinergic input from motoneuron recurrent collaterals, and they make direct GABAergic connections with motoneurons and otherR-interneurons. This pattern of connectivity and the predominantly GABAergic pharmacology of the projections suggest that this interneuronal population is the avian equivalent of the mammalian Renshaw cell.
Are the interneurons receiving direct input from motoneurons the avian equivalent of mammalian Renshaw cells?
Several lines of evidence support the hypothesis that the interneurons receiving short-latency input from motoneuron recurrent collaterals are the avian equivalent of the mammalian Renshaw cell, the only class of interneuron known to receive such input. First, the cells receive monosynaptic nicotinic, cholinergic input from motoneurons, which often resulted in spiking activity. Second, the majority (25 of 29; 86%), and possibly all of these cells, projected monosynaptically to motoneurons as revealed by spike-triggered averaging of muscle nerve or ventral root potentials. Third, the projection appears to be predominantly GABAergic (see below), consistent with the inhibitory nature of mammalian Renshaw cells. Fourth, we obtained indirect, pharmacological, and physiological evidence thatR-interneurons project to each other, as do adult mammalian Renshaw cells (Ryall, 1970).
One characteristic of the population that differs from adult mammalian Renshaw cells is the presence of monosynaptic input from muscle afferents (Ryall and Piercey, 1971). The significance of these inputs is not clear because only a small number of cells have been examined, but there are several possibilities. First, mammalian Renshaw cells and chicken R-interneurons may differ in their muscle afferent input. Second, this connection may be a transient one that disappears later in development. Another possibility, but one we consider unlikely, is that the R-interneurons we have identified are not in fact homologs of mammalian Renshaw cells but of another interneuronal class.
Although there is no other known spinal interneuron that receives monosynaptic motoneuronal input, the interneurons mediating reciprocal inhibition in the mammal (1a inhibitory interneurons) also make inhibitory monosynaptic connections with motoneurons. Furthermore, they receive direct input from Renshaw cells and from muscle afferents. As a result, the cells we have recorded from could be a precursor interneuron that will ultimately diverge into distinct classes of Renshaw and 1a inhibitory interneurons later in development. Although we have not presented detailed information on the connections of individual R-interneurons in this paper, we did observe that homonymous R-interneurons (those driven by the same motor nerve) appear to be mutually interconnected (Fig. 5B). This is not the case for 1a inhibitory interneurons (Hultborn et al., 1976) but is consistent with reported Renshaw cell connectivity in the adult cat (Ryall et al., 1971). Although not definitive, this pattern of connectivity and the fact that the cells receive direct motoneuronal input favors a Renshaw-like identity.
Transmitter phenotype of R-interneurons
Our evidence suggests that the dominant transmitter ofR-interneurons is GABA at the ages we have studied (E10–E11). At concentrations likely to be specific for GABAA receptors (Jonas et al., 1998), bicuculline either abolished or greatly depressed the amplitude of the ventral root or muscle nerve potentials resolved by spike-triggered averaging. Bicuculline was also effective in reducing the potentiation of synaptic potentials during motoneuron stimulus trains and in blocking ventral root-evoked optical signals. Some R-interneurons may also release glycine, because strychnine also depressed the spike-triggered averaged potentials in motoneurons. In general, however, strychnine was less effective than bicuculline, and it is possible that the drug was influencing GABAA receptors (Jonas et al., 1998).
Adult Renshaw cells in the mammal are believed to be predominantly glycinergic, although some evidence supports a GABAergic component to the pathway (Cullheim and Kellerth, 1981; Schneider and Fyffe, 1992). In the mature chick, GABA-immunoreactive interneurons are very rare in the ventral spinal cord in which R-interneurons are located. In contrast, glycine-immunoreactive interneurons are common, suggesting that in the mature chick as in the mammal, R-interneurons are glycinergic. In the chick, a population of GABA-immunoreactive interneurons appears early in the development of the ventral spinal cord, to be replaced later by glycine-immunoreactive interneurons (Antal et al., 1994). This has led to the proposal that the ventrally located GABA-immunoreactive interneurons undergo a transmitter switch from GABA to glycine (Berki et al., 1995). Thus, it is possible that developing R-interneurons initially use GABA as their transmitter and later switch to glycine. Consistent with these ideas are studies in the neonatal rat cord, which show that recurrent IPSPs in motoneurons can be depressed by both strychnine and bicuculline (Schneider and Fyffe, 1992) and evidence that some inhibitory interneurons can release both transmitters (Jonas et al., 1998).
Optical identification of R-interneurons
Stimulation of ventral roots or motor nerves resulted in fluorescence changes in a column of calcium green-labeled interneurons located dorsomedial to the lateral motor column. We believe these cells to be predominantly R-interneurons, although they could not be activated by a single ventral root stimulus and required a train. First, we know that this region contains R-interneurons because at least some of the optically active cells remained active after GABA blockade, suggesting they are monosynaptically driven from recurrent motoneuron collaterals. In addition, whole-cell recordings were obtained from R-interneurons within this region, deep to the cut face. Second, R-interneurons should be generating optical signals in response to motoneuron stimulation because they are likely to be labeled with the calcium dye (whole-cell recordings indicate that at least part of the population projects into the VLF in which the dye is placed) and they fire in response to the motoneuron stimulus. This is in marked contrast to the small population of non-R-interneurons that received polysynaptic input from motoneurons and that did not fire after a motoneuron stimulus. Third, the optical signals exhibit the appropriate pharmacology for polysynaptically activated R-interneurons because they are blocked by either mecamylamine or greatly depressed by bicuculline. Finally, we know that the cells giving rise to the optical signals must be driven by R-interneurons because only 5.3% of non-R-interneurons received any polysynaptic input from motoneurons and that R-interneurons are a primary target of other R-interneurons. Although we cannot eliminate the possibility that some of the motoneuron-evoked optical signal is derived from non-R-interneurons, it seems likely that their contribution is small.
We suggest that our inability to activate this population by a single stimulus is because many of the R-interneurons in the superficial layer of the cut face are likely to have lost their monosynaptic recurrent motoneuronal input through damage caused by the cutting procedure.
Development of the R-interneuron circuit
The most comprehensively studied developing spinal circuit has been the connection between muscle spindle afferents and motoneurons. In this pathway, the pattern of connections between spindle afferents and motoneurons appears to be appropriate from the onset of circuit formation (Frank and Westerfield, 1983; Lee and O’Donovan, 1991). Experiments in the chick embryo have provided compelling evidence that the muscle afferent input that a motoneuron receives is retrogradely specified by the muscle that the sensory neuron innervates (Wenner and Frank, 1995). It is not clear, however, whether other spinal circuits use a retrograde specification of their connections because interneurons do not have a unique synaptic target, projecting instead to many different neuronal types. After our identification of R-interneurons, it is now possible to establish whether the same principles of circuit formation apply to interneuronal spinal circuits.
It had been shown earlier that ventral root-evoked potentials can first be recorded from an adjacent ventral root at E7, suggesting that this is when the recurrent circuit first forms (O’Donovan, 1989). In the present work, we examined the connections at E9–E11, shortly after circuit formation, and found that a high degree of specificity exists in the projections to and from R-interneurons. Only 5.1% of ventrally located interneurons received monosynaptic input from motoneurons, indicating that motoneuron axon collaterals project to a limited number of interneurons at this stage of development. In addition, we found that R-interneurons project to motoneurons and other R-interneurons, whereas connections to non-R- interneurons were relatively rare. Further experiments will be required to establish whether this early pattern of connectivity persists into the mature animal and whether the detailed connections of R-interneurons are appropriate from the onset of circuit formation.
Significance for future studies of interneuronal development
The functional characterization of an accessible interneuron subclass provides us with different model systems, in addition to muscle afferent connections with motoneurons, to study the development of the spinal neurons and their synaptic connections. Further, we can now investigate the role of these interneurons in the patterning of motoneuron discharge during spontaneous episodes of activity. We have hypothesized that R-interneurons may be critically involved in the timing of flexor and extensor motoneuron alternation in the developing chick cord (Ritter et al., 1999), and we can examine this idea by comparing the timing of the activity inR-interneurons with that of flexor–extensor muscle nerves. Finally, identification of R-interneurons should allow studies of the role of transcription factors in interneuronal development, similar to those performed for motoneurons (Tsuchida et al., 1994; Tanabe and Jessell, 1996; Lin et al., 1998; Sharma et al., 1998).
Footnotes
This study was supported by the National Institute of Neurological Disorders and Stroke Intramural Research Program. We are grateful to Robert Burke, Eric Frank, Mike Matise, Kamal Sharma, and Patrick Whelan for their comments on this manuscript.
Correspondence should be addressed to Dr. Peter Wenner, Laboratory of Neural Control, National Institute of Neurological Disorders and Stroke, National Institutes of Health, 49 Convent Drive, Building 49, Room 3A50, Bethesda, MD 20892-4455.
REFERENCES
- 1.Antal M, Berki AC, Horvath L, O’Donovan MJ. Developmental changes in the distribution of γ-aminobutyric acid- immunoreactive neurons in the embryonic chick lumbosacral spinal cord. J Comp Neurol. 1994;343:228–236. doi: 10.1002/cne.903430204. [DOI] [PubMed] [Google Scholar]
- 2.Baldissera F, Hultborn H, Illert M. Integration in spinal neuronal systems. In: Brooks VB, editor. Handbook of physiology. American Physiology Society; Bethesda, MD: 1981. pp. 509–595. [Google Scholar]
- 3.Berki AC, O’Donovan MJ, Antal M. Developmental expression of glycine immunoreactivity and its colocalization with GABA in the embryonic chick lumbosacral spinal cord. J Comp Neurol. 1995;362:583–596. doi: 10.1002/cne.903620411. [DOI] [PubMed] [Google Scholar]
- 4.Chub N, O’Donovan MJ. Blockade and recovery of spontaneous rhythmic activity after application of neurotransmitter antagonists to spinal networks of the chick embryo. J Neurosci. 1998;18:294–306. doi: 10.1523/JNEUROSCI.18-01-00294.1998. [DOI] [PMC free article] [PubMed] [Google Scholar]
- 5.Cullheim S, Kellerth JO. Two kinds of recurrent inhibition of cat spinal α-motoneurones as differentiated pharmacologically. J Physiol (Lond) 1981;312:209–224. doi: 10.1113/jphysiol.1981.sp013624. [DOI] [PMC free article] [PubMed] [Google Scholar]
- 6.Eccles JC, Fatt P, Koketsu K. Cholinergic and inhibitory synapses in a pathway from motor–axon collaterals to motoneurons. J Physiol (Lond) 1954;126:524–562. doi: 10.1113/jphysiol.1954.sp005226. [DOI] [PMC free article] [PubMed] [Google Scholar]
- 7.Fedirchuk B, Wenner P, Whelan PJ, Ho S, Tabak J, O’Donovan MJ. Spontaneous network activity transiently depresses synaptic transmission in the embryonic chick spinal cord. J Neurosci. 1999;19:2102–2112. doi: 10.1523/JNEUROSCI.19-06-02102.1999. [DOI] [PMC free article] [PubMed] [Google Scholar]
- 8.Frank E, Wenner P. Environmental specification of neuronal connectivity. Neuron. 1993;10:779–785. doi: 10.1016/0896-6273(93)90194-v. [DOI] [PubMed] [Google Scholar]
- 9.Frank E, Westerfield M. Development of sensory-motor synapses in the spinal cord of the frog. J Physiol (Lond) 1983;343:593–610. doi: 10.1113/jphysiol.1983.sp014912. [DOI] [PMC free article] [PubMed] [Google Scholar]
- 10.Goulding M. Specifying motor neurons and their connections. Neuron. 1998;21:943–946. doi: 10.1016/s0896-6273(00)80612-1. [DOI] [PubMed] [Google Scholar]
- 11.Haase J, Cleveland S, Ross HG. Problems of postsynaptic autogenous and recurrent inhibition in the mammalian spinal cord. Rev Physiol Biochem Pharmacol. 1975;73:73–129. doi: 10.1007/BFb0034660. [DOI] [PubMed] [Google Scholar]
- 12.Hamburger V, Hamilton HL. A series of normal stages in the development of the normal chick embryo. J Morphol. 1951;88:49–92. [PubMed] [Google Scholar]
- 13.Hultborn H, Illert M, Santini M. Convergence on interneurones mediating the reciprocal Ia inhibition of motoneurones. I. Disynaptic Ia inhibition of Ia inhibitory interneurones. Acta Physiol Scand. 1976;96:193–201. doi: 10.1111/j.1748-1716.1976.tb10188.x. [DOI] [PubMed] [Google Scholar]
- 14.Jankowska E, Lindstrom S. Morphological identification of Renshaw cells. Acta Physiol Scand. 1971;81:428–430. doi: 10.1111/j.1748-1716.1971.tb04918.x. [DOI] [PubMed] [Google Scholar]
- 15.Jonas P, Bischofberger J, Sandkuhler J. Corelease of two fast neurotransmitters at a central synapse. Science. 1998;281:419–424. doi: 10.1126/science.281.5375.419. [DOI] [PubMed] [Google Scholar]
- 16.Lee MT, O’Donovan MJ. Organization of hindlimb muscle afferent projections to lumbosacral motoneurons in the chick embryo. J Neurosci. 1991;11:2564–2573. doi: 10.1523/JNEUROSCI.11-08-02564.1991. [DOI] [PMC free article] [PubMed] [Google Scholar]
- 17.Lee MT, Koebbe MJ, O’Donovan MJ. The development of sensorimotor synaptic connections in the lumbosacral cord of the chick embryo. J Neurosci. 1988;8:2530–2543. doi: 10.1523/JNEUROSCI.08-07-02530.1988. [DOI] [PMC free article] [PubMed] [Google Scholar]
- 18.Lin JH, Saito T, Anderson DJ, Lance-Jones C, Jessell TM, Arber S. Functionally related motor neuron pool and muscle sensory afferent subtypes defined by coordinate ETS gene expression. Cell. 1998;95:393–407. doi: 10.1016/s0092-8674(00)81770-5. [DOI] [PubMed] [Google Scholar]
- 19.Naka K. Electrophysiology of the fetal spinal cord. II. Interaction among peripheral inputs and recurrent inhibition. J Gen Physiol. 1964;47:1023–1038. doi: 10.1085/jgp.47.5.1023. [DOI] [PMC free article] [PubMed] [Google Scholar]
- 20.O’Donovan M, Ho S, Yee W. Calcium imaging of rhythmic network activity in the developing spinal cord of the chick embryo. J Neurosci. 1994;14:6354–6369. doi: 10.1523/JNEUROSCI.14-11-06354.1994. [DOI] [PMC free article] [PubMed] [Google Scholar]
- 21.O’Donovan MJ. Developmental approaches to the analysis of vertebrate central pattern generators. J Neurosci Methods. 1987;21:275–286. doi: 10.1016/0165-0270(87)90122-1. [DOI] [PubMed] [Google Scholar]
- 22.O’Donovan MJ. Motor activity in the isolated spinal cord of the chick embryo: synaptic drive and firing pattern of single motoneurons. J Neurosci. 1989;9:943–958. doi: 10.1523/JNEUROSCI.09-03-00943.1989. [DOI] [PMC free article] [PubMed] [Google Scholar]
- 23.O’Donovan MJ, Ho S, Sholomenko G, Yee W. Real-time imaging of neurons retrogradely and anterogradely labelled with calcium-sensitive dyes. J Neurosci Methods. 1993;46:91–106. doi: 10.1016/0165-0270(93)90145-h. [DOI] [PubMed] [Google Scholar]
- 24.O’Donovan MJ, Wenner P, Chub N, Tabak J, Rinzel J. Mechanisms of spontaneous activity in the developing spinal cord and their relevance to locomotion. Ann NY Acad Sci. 1998;860:130–141. doi: 10.1111/j.1749-6632.1998.tb09044.x. [DOI] [PubMed] [Google Scholar]
- 25.Renshaw B. Central effects of centripetal impulses in axons of spinal ventral roots. J Neurophysiol. 1946;9:191–204. doi: 10.1152/jn.1946.9.3.191. [DOI] [PubMed] [Google Scholar]
- 26.Ritter A, Wenner P, Ho S, Whelan P, O’Donovan MJ. Behavior and synaptic organization of ventrally located spinal cord interneurons during rhythmic activity in the chick embryo. J Neurosci. 1999;19:3457–3471. doi: 10.1523/JNEUROSCI.19-09-03457.1999. [DOI] [PMC free article] [PubMed] [Google Scholar]
- 27.Ryall RW. Renshaw cell mediated inhibition of Renshaw cells: patterns of excitation and inhibition from impulses in motor axon collaterals. J Neurophysiol. 1970;33:257–270. doi: 10.1152/jn.1970.33.2.257. [DOI] [PubMed] [Google Scholar]
- 28.Ryall RW, Piercey MF. Excitation and inhibition of Renshaw cells by impulses in peripheral afferent nerve fibers. J Neurophysiol. 1971;34:242–251. doi: 10.1152/jn.1971.34.2.242. [DOI] [PubMed] [Google Scholar]
- 29.Ryall RW, Piercey MF, Polosa C. Intersegmental and intrasegmental distribution of mutual inhibition of Renshaw cells. J Neurophysiol. 1971;34:700–707. doi: 10.1152/jn.1971.34.4.700. [DOI] [PubMed] [Google Scholar]
- 30.Schneider SP, Fyffe RE. Involvement of GABA and glycine in recurrent inhibition of spinal motoneurons. J Neurophysiol. 1992;68:397–406. doi: 10.1152/jn.1992.68.2.397. [DOI] [PubMed] [Google Scholar]
- 31.Sernagor E, O’Donovan MJ. Whole-cell patch clamp recordings from rhythmically active motoneurons in the isolated spinal cord of the chick embryo. Neurosci Lett. 1991;128:211–216. doi: 10.1016/0304-3940(91)90263-s. [DOI] [PubMed] [Google Scholar]
- 32.Sernagor E, Chub N, Ritter A, O’Donovan MJ. Pharmacological characterization of the rhythmic synaptic drive onto lumbosacral motoneurons in the chick embryo spinal cord. J Neurosci. 1995;15:7452–7464. doi: 10.1523/JNEUROSCI.15-11-07452.1995. [DOI] [PMC free article] [PubMed] [Google Scholar]
- 33.Sharma K, Sheng HZ, Lettieri K, Li H, Karavanov A, Potter S, Westphal H, Pfaff SL. LIM homeodomain factors Lhx3 and Lhx4 assign subtype identities for motor neurons. Cell. 1998;95:817–828. doi: 10.1016/s0092-8674(00)81704-3. [DOI] [PubMed] [Google Scholar]
- 34. Tanabe Y, Jessell TM. Diversity and pattern in the developing spinal cord. Science 274 1996. 1115 1123[Erratum (1997) 276:21]. [DOI] [PubMed] [Google Scholar]
- 35.Tanabe Y, William C, Jessell TM. Specification of motor neuron identity by the MNR2 homeodomain protein. Cell. 1998;95:67–80. doi: 10.1016/s0092-8674(00)81783-3. [DOI] [PubMed] [Google Scholar]
- 36.Tsuchida T, Ensini M, Morton SB, Baldassare M, Edlund T, Jessell TM, Pfaff SL. Topographic organization of embryonic motor neurons defined by expression of LIM homeobox genes. Cell. 1994;79:957–970. doi: 10.1016/0092-8674(94)90027-2. [DOI] [PubMed] [Google Scholar]
- 37.Velumian AA. [Feedback inhibition in the motor neurons of the avian spinal cord.] Dokl Akad Nauk SSSR. 1982;263:1500–1502. [PubMed] [Google Scholar]
- 38.Velumian AA, Poliakova LA. [The demonstration of recurrent motor axon collaterals in the chick embryo by using horseradish peroxidase axonal transport.] Zh Evol Biokhim Fiziol. 1992;28:240–243. [PubMed] [Google Scholar]
- 39.Wenner P, Frank E. Peripheral target specification of synaptic connectivity of muscle spindle sensory neurons with spinal motoneurons. J Neurosci. 1995;15:8191–8198. doi: 10.1523/JNEUROSCI.15-12-08191.1995. [DOI] [PMC free article] [PubMed] [Google Scholar]
- 40.Wenner P, Matise MP, Joyner A, O’Donovan MJ. Physiological and molecular characterization of interneurons in the developing spinal cord. Ann NY Acad Sci. 1998;860:425–427. doi: 10.1111/j.1749-6632.1998.tb09066.x. [DOI] [PubMed] [Google Scholar]
- 41.Windhorst U. Activation of Renshaw cells. Prog Neurobiol. 1990;35:135–179. doi: 10.1016/0301-0082(90)90020-h. [DOI] [PubMed] [Google Scholar]