

Abstract
The surge of Ca2+ that triggers vesicle fusion is shaped by the distribution of Ca2+ channels and the physical relationship between those channels and the exocytotic apparatus. Although channels and the release apparatus are thought to be tightly associated at fast synapses, the arrangement at neuroendocrine cells is less clear.
The distribution of Ca2+ influx near release sites is difficult to determine because of spatial and temporal limitations on Ca2+ imaging techniques. We now present spatially resolved images of Ca2+ influx into rat neuroendocrine terminals on a millisecond time scale. Images of voltage-dependent Ca2+ influx into neurohypophysial terminals were captured after excitation of Ca2+-sensitive dyes with pulses of laser light lasting a fraction of a microsecond. Submembranous Ca2+ increases were detected during the first millisecond of an evoked Ca2+ tail current. Steep gradients of Ca2+ were evident, with concentrations near the membrane reaching above 1 μm during a 30 msec depolarization. Ca2+ influx appeared evenly distributed, even when diffusion was restricted with an exogenous Ca2+ chelator. During longer depolarizations, mean and peak Ca2+ concentrations reached an asymptote in parallel, suggesting that Ca2+ binding proteins near the membrane rapidly buffer Ca2+ and do not become saturated during prolonged influx. These data support the hypothesis that exocytosis is activated in these terminals by the summation of influx through multiple, randomly spaced Ca2+channels.
Keywords: calcium channel, calcium current, neurohypophysis, calcium imaging, secretion, neuroendocrine, neuropeptide
Axon terminals from the neurohypophysis are responsible for releasing the neuropeptide hormones vasopressin (VP) and oxytocin (OT) in response to action potentials generated by their somata in the hypothalamus (Poulain and Wakerley, 1982). These terminals fire action potentials (1–2 msec in duration) in response to axonal stimulation at rates as high as 30 Hz during brief trains (Bourque, 1990). Neuropeptide secretion is mediated by influx through N- and P/Q-type Ca2+channels (Lemos and Nowycky, 1989; Fisher and Bourque, 1995, 1996; Wang et al., 1997), as is neurotransmission at most fast synapses (Dunlap et al., 1995). Voltage-dependent influx of Ca2+ into these terminals rapidly activates an increase in membrane capacitance that may reflect the exocytotic release of neuropeptides (Lim et al., 1990; Lindau et al., 1992; Seward et al., 1995; Hsu and Jackson, 1996; Giovannucci and Stuenkel, 1997). Such evoked release is largely inhibited by inclusion of EGTA in the patch pipette (Lim et al., 1990; Seward et al., 1995;Giovannucci and Stuenkel, 1997), suggesting that Ca2+ must diffuse significant distances to trigger exocytotic release (Schweizer et al., 1995). There is, however, a rapidly releasable component of granules (Hsu and Jackson, 1996;Giovannucci and Stuenkel, 1997) that is not blocked by internal EGTA but is sensitive to the addition of BAPTA (Giovannucci and Stuenkel, 1997). Furthermore, experiments in which terminals were dialyzed with Ca2+-containing solutions (Rosenboom and Lindau, 1994) indicated that capacitance increases were evoked only when Ca2+ concentrations were >30 μm. Elevations of this magnitude would be likely to occur only within nanometers of an open Ca2+channel (Schweizer et al., 1995; Neher, 1998), suggesting that neuropeptide granules are closely associated with Ca2+ channels.
Although Ca2+ channels and the exocytotic apparatus are colocalized in synaptic terminals at active zones (Pumplin et al., 1981; Robitaille et al., 1990), less is known about the distribution of Ca2+ channels in neuroendocrine cells. Ca2+ imaging experiments using pulsed laser excitation have shown that Ca2+ influx in bovine adrenal chromaffin cells is concentrated in a small number of discrete “hot spots” (Monck et al., 1994). Furthermore, amperometric studies of release using a carbon-fiber electrode have demonstrated that these areas of elevated Ca2+ correspond to sites of preferential exocytotic release (Robinson et al., 1995). Localized release is also seen after Ca2+ release from internal stores (Schroeder et al., 1994) and is supported by the observation that visualized chromaffin granules fuse with the cell membrane in a heterogeneous pattern during depolarizations (Steyer et al., 1997; Oheim et al., 1999). The presence of specialized release sites in chromaffin cells suggests that the colocalization of Ca2+ channels and the exocytotic machinery may be important in the evocation of neuroendocrine release. We therefore have used the pulsed laser technique to image voltage-dependent Ca2+ influx in acutely isolated neurohypophysial axon terminals. In contrast to chromaffin cells, Ca2+ influx in these terminals is not localized. This supports a model in which release is dependent on influx of Ca2+ through multiple dispersed Ca2+ channels.
MATERIALS AND METHODS
The axon terminals of the neurohypophysis were isolated as described previously (Fisher and Bourque, 1995), with minor modifications. Briefly, male Long–Evans rats (150–300 gm) were killed by decapitation using a small rodent guillotine (model 51330; Stoelting Company, Wood Dale, IL) after anesthesia with chloroform. The neurohypophysis was extracted and incubated for 90 min at 34°C in 10 ml of an oxygenated (100% O2) PIPES saline containing (in mm): NaCl 120, KCl 5, MgCl2 1, CaCl2 1, PIPES 20,d-glucose 25, with a pH of 7.1 and containing trypsin (0.7 mg/ml; Sigma type XI, Sigma, St. Louis, MO). The neurohypophysis was then rinsed in trypsin-free oxygenated PIPES saline (up to 2 hr), triturated with fire-polished pipettes (0.2–0.5 mm in diameter), and plated onto untreated glass-bottomed Petri dishes. Terminals 10–15 μm in diameter were chosen for study. Terminals could also be isolated without trypsin treatment (although with much lower yield); experiments on such terminals gave similar results (data not shown).
Terminals were patch-clamped in the whole-cell mode (Hamill et al., 1981) at room temperature. Electrodes had a resistance of 4–8 MΩ and were filled with a solution containing (in mm): Tris-HCl 100, TEABr 40, MgCl2 2, Na2ATP 2, phosphocreatine (di-Tris salt) 10, and rhod-2 0.3, with a pH of 7.2. Rhod-2 was chosen as the indicator dye for its large fluorescence change in the presence of Ca2+ and its rapid rate of association with Ca2+, both of which contribute to its ability to detect influx rapidly. The on-rate of the Ca2+–rhod-2 association (0.7 × 10⁸m/sec) (Escobar et al., 1997) corresponds to a τ of 50 μsec based on the equation 1/τ = kon[buffer] +koff. Estimates of Ca2+ concentrations achieved from fluorescence ratios are based on a calibration curve constructedin vitro (see Fig. 1C); the validity of this curve is supported by the similar ratios achieved at high levels of Ca2+ in vitro and in the terminal cytoplasm (compare with Fig. 2E). Rhod-2 had no discernible effect on evoked currents. For the Ca2+ uncaging experiments, the solution also included DM-nitrophen 10 mm and CaCl2 5 mm. The external medium comprised (in mm): NaCl 110, TEABr 20, HEPES 10, 4-aminopyridine 4, CaCl2 10,dglucose 10, and tetrodotoxin 0.001, with a pH of 7.4. Rhod-2, rhod-2 AM, and DM-nitrophen were obtained from Molecular Probes (Eugene, OR); all other chemicals were obtained from Sigma.
Fig. 1.

Pulsed laser Ca2+ imaging of voltage-activated Ca2+ influx. A,Trace showing currents evoked in a patch-clamped terminal by a 30 msec step from a holding potential of −80 to 0 mV in the presence of K+ and Na+channel blockers. The terminal was illuminated by a pulse of laser light (arrow) to excite the Ca2+indicator rhod-2 (300 μm). The resultant fluorescence image (depolarization) was compared with that obtained from a laser pulse triggered 1 sec earlier (control). The ratio of the two images indicates the spatial distribution of Ca2+ elevation. Light measured outside of the terminal has been digitally subtracted. Scale bar (in this and subsequent Figures): 5 μm. B, A series of binary images of the same ratio image created by using the indicated threshold values (pixels above the threshold arered, below are blue). The red pixels are enlarged ninefold for panels 3 and4, and 16-fold for panel 5.C, The relationship between fluorescence and [Ca2+] observed in vitro. This graph has been normalized such that a ratio of 1 is equal to a resting [Ca2+]i of 250 nm [based on 10 mm external Ca2+ (Stuenkel, 1994)]. The concentrations of Ca2+ corresponding to the indicated ratios are shown to the right of thetrace.
Fig. 2.
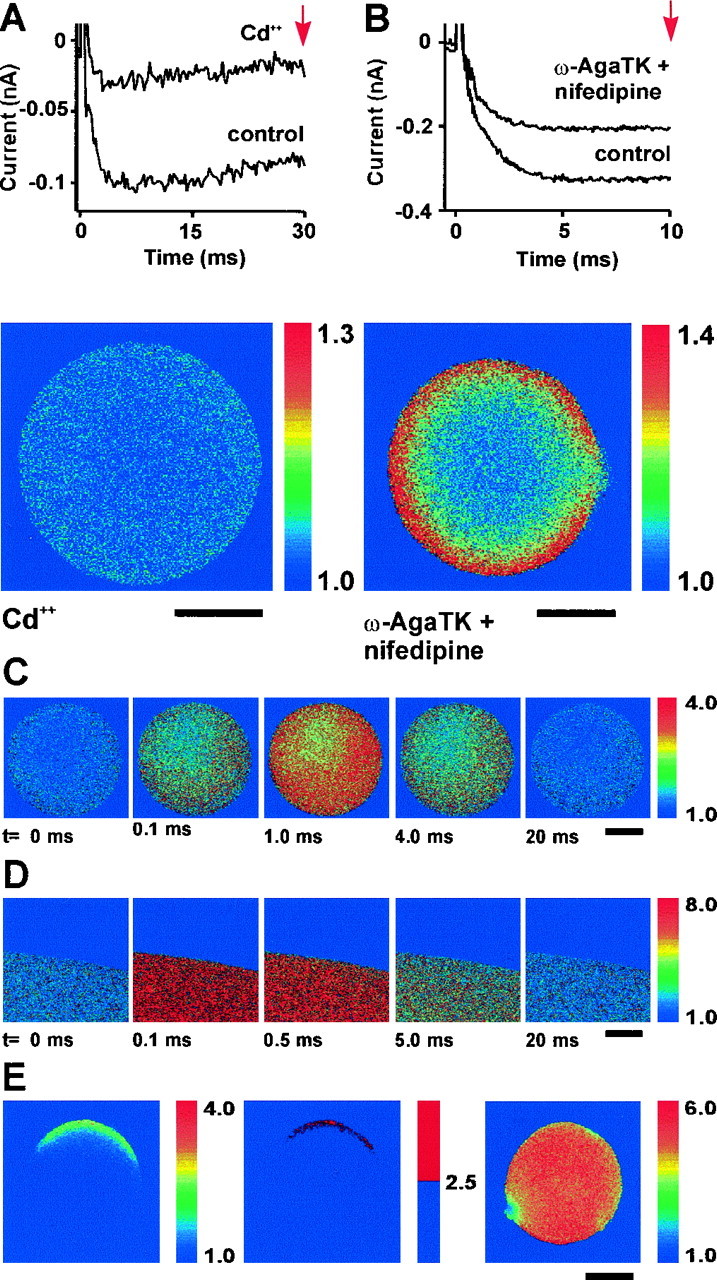
Imaging increases in Ca2+.A, Currents evoked by 30 msec steps from a holding potential of −80 to 0 mV before and after addition of 1 mmCd2+. The image below shows the ratio of control and depolarization fluorescence images after the addition of Cd2+. Note the complete block of the evoked Ca2+ elevation. B, Currents evoked by a 10 msec step from a holding potential of −80 to 0 mV before and 5 min after addition of 0.5 μm ω-agatoxin TK and 5 μm nifedipine. The ratio image below shows the ratio of control and depolarization fluorescence images after the addition of these antagonists. Note the sharp and homogeneous ring of elevated Ca2+. C, A series of images illustrating the fluorescence ratios in a terminal at different times after the release of Ca2+ from DM-nitrophen by a pulse of light from a UV laser. D, A similar experiment carried out in a droplet of aqueous solution surrounded by mineral oil.E, Ca2+ elevations evoked by electroporation of the terminal membrane. The ratio image on theleft shows elevations of Ca2+ ∼1 msec after electroporation; the adjacent image is a binary version. The image on the right shows the elevation of Ca2+ in the terminal several seconds later.
The imaging and recording system used in this study is a modified version of a system described previously (Monck et al., 1994; Robinson et al., 1995, 1996). It is composed of an inverted epifluorescence microscope (Axiovert, Carl Zeiss, Oberkochen, Germany), a cooled charge couple device (CCD) camera (Photometrics, Tucson, AZ), and a microcomputer (Gateway Pentium 75 MHz, Sioux City, ND). Fluorescence images were transferred to the computer and analyzed using software from Photometrics. Patch-clamp data were acquired with an Axopatch 200A amplifier via an AT-MIO-16X interface board (National Instruments, Austin, TX), and the acquisition program that was used was written in Labview (v 4.0, National Instruments). Evoked Ca2+ currents were sampled at 20 kHz and filtered at 10 kHz. Illumination in the imaging system was achieved by coupling a high-intensity pulsed coaxial flash lamp dye laser (LumenX model LS-1400, Phase-R Corporation, New Durham, NH) via a quartz fiber light guide and a custom-made adapter to the epifluorescence path of the microscope. The duration of each pulse was 350 nsec. The lasing dye was coumarin 525 (0.1 mm in methanol), which emits laser light with a wavelength of 525 nm. A beam splitter (50:50) was used to divert energy from the beam to a pulsed energy meter (Oriel Corporation, Stratford, CT), and the measured amplitudes were used to normalize the beam intensity during analysis. The custom-made adapter also housed a dichroic mirror, held at a 45° angle, that reflected UV light from a frequency-doubled ruby laser, output 347 nm (Lumonix, Rugby, UK) into the same epifluorescence light path as the visible laser (duration 30 nsec). The use of this UV light-emitting laser made it possible to uncage Ca2+ from the photolabile Ca2+ chelator DM-nitrophen and image the resultant changes in Ca2+concentrations (see Fig. 2C,D). The epifluorescence block contained a 545 nm DCRX mirror and a 570 nm EFLP emission filter. A Zeiss 100× Neofluar oil immersion objective was used both to photolyze DM-nitrophen and to obtain Ca2+ images (except for Fig.3A, for which we used a 40× objective). Pairs of control and test images were recorded, and the ratio of the test image divided by the control images was calculated digitally. The fractional change in fluorescence reflects the change in Ca2+ concentration. The ratio images were multiplied by binary images of the control fluorescence to remove the spurious ratios of light scattered beyond the boundary of the terminal. In each case the patch pipette was attached to the terminal from the right side.
Fig. 3.
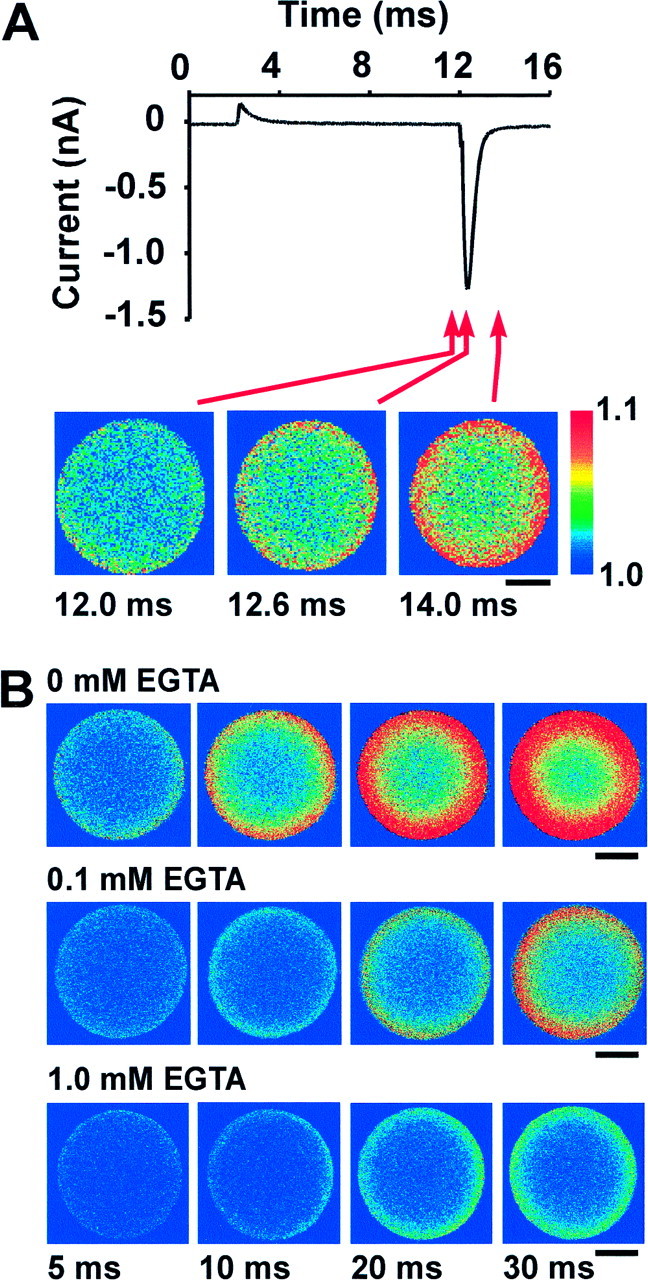
Influx of Ca2+ during a tail current and in the presence of EGTA. A, Thetrace shows currents evoked in a terminal by stepping from a holding potential of −80 to +40 mV for 10 msec. Little or no current was evoked during the step, but a large inward tail current followed it. A fluorescent image obtained at the end of the step showed little or no increase, whereas images 0.6 or 2 msec later showed distinct submembranous rings of increased Ca2+. Note that there is no evidence for localized sites of Ca2+ influx. These images were acquired with a 40× objective. B, Endogenous and exogenous buffers compete with the rhod-2 for binding of Ca2+ and therefore limit the apparent diffusion of Ca2+ away from influx sites. In the presence of added EGTA, the rings of elevated Ca2+ were smaller and had lower intensity. The pattern of Ca2+ influx, however, remained homogeneous, supporting the conclusion that Ca2+channels are not clustered in large numbers.
For the poration experiments, rhod-2 was loaded into cells by incubation with rhod-2 AM (10 μm) for 1–2 hr. A custom-built poration device was used [for method of construction and theory of use see Marszalek et al. (1997)]. The ends of two platinum electrodes (which had a gap of ∼100 μm) were placed over a terminal using a micromanipulator. A signal generated from the computer caused discharge of a capacitor between the electrodes (τ ∼100 μsec), causing dielectric breakdown of the membrane, preferentially at the pole of the terminal nearest the positive electrode. The area of membrane disruption depends on the strength of the applied electric field and on the size and shape of the terminal.
RESULTS
Acutely isolated terminals were patch-clamped in the “whole-terminal” mode. With internal and external media designed to block K+ and Na+ currents, depolarization evoked rapidly activating Ca2+ currents (Fig.1). Biophysical and pharmacological experiments have shown that these currents include contributions from N-, Q-, and L-type Ca2+ currents (Lemos and Nowycky, 1989; Fisher and Bourque, 1995; Wang et al., 1997). They are largely inactivating, although little inactivation is seen during the brief depolarizations shown here. Figure 1Aillustrates the protocol for imaging voltage-dependent Ca2+ influx. The top trace shows the currents evoked during a 30 msec step from a holding potential of −80 mV to 0 mV. The pulsed laser was fired 1 sec before the depolarization, and the resultant fluorescence was measured with the cooled CCD camera to give a control image (control). A second pulse was applied at a specific time relative to the depolarization, in this case at the end of the pulse (red arrow), to give the test image (depolarization). The ratio of the two images (ratio) is shown in false color with the scale shown to the right. The pixel values are proportional to the Ca2+ concentration; values near 1.0 represent areas where there was no increase in Ca2+ (blue), whereas pixels in red represent areas where the highest ratio was seen (in this case twofold or greater). A submembranous ring of elevated Ca2+, such as that shown here, was invariably seen in terminals after depolarization (n = 64 terminals).
Figure 1B illustrates the gradient of Ca2+ concentration that occurs during a depolarization. Each panel is a binary image of the ratio shown in Figure 1A, with pixel ratios that exceed a threshold value (given by the scales to the right of the images) shown in red. Pixels have been enlarged (ninefold for panels 3 and 4 and 16-fold for panel 5) for easier detection. In each case the distribution of elevated Ca2+ around the terminal membrane appeared homogeneous; the minor irregularities that are visible were not reproducible. (The reduced number of pixels on the right side of the terminal at the highest ratios is likely to reflect diffusion into the pipette). The concentration of Ca2+corresponding to these ratios can be estimated using a calibration curve constructed by measuring the fluorescence of rhod-2 in aqueous solution in the presence of different concentrations of Ca2+ (Fig. 1C) (Robinson et al., 1996). If the resting Ca2+ in the terminal is assumed to be 250 nm [based on the measurements of Stuenkel (1994) for an external Ca2+ concentration of 10 mm], the ratios 1.5, 1.8, 2.0, 2.5, and 3.0 correspond to Ca2+ concentrations of 500, 620, 710, 930, and 1250 nm, respectively. Because the relationship between fluorescence and Ca2+ concentration may be different in the terminal cytoplasm than it is in vitro, these values may be underestimated. The concentration immediately beneath the membrane should also be underestimated because the highest levels of Ca2+ are confined to a band too narrow to be resolved by the microscope.
To demonstrate that this increase in Ca2+is caused by influx through Ca2+ channels, we imaged Ca2+ levels in a terminal at the end of a 30 msec depolarizing pulse to 0 mV before and after block of the Ca2+ current using 1 mmCd2+ (Fig.2A). The fluorescent ratio below shows that the increase in internal Ca2+ was completely eliminated. To test the possibility that N-type Ca2+ channels might be clustered, we imaged Ca2+ influx in the presence of channel antagonists. N-type channels were of particular interest because they carry the largest component of Ca2+ current in most terminals, are found in both VP and OT terminals (unlike P/Q-type channels), and are responsible for the greatest proportion of voltage-dependent neuropeptide release in both types (Wang et al., 1997). P/Q- and L-type currents were blocked by the addition of 0.5 μmω-agatoxin IVA or ω-agatoxin TK and 5 μm nifedipine, respectively (n= 7). Under these conditions, the current evoked should be mainly N-type current (Wang et al., 1997). Ca2+currents evoked before and after addition of these antagonists is shown in Fig. 2B. As is seen in the fluorescent ratio below, Ca2+ influx through N-type channels during a 10 msec depolarization results in a distinct and homogeneous submembranous ring of elevated Ca2+.
The observed pattern of Ca2+ elevation in response to depolarization could be influenced by a heterogeneous distribution in the terminal of either rhod-2 or a rapid endogenous Ca2+ buffer. To test this possibility, we triggered a general increase in Ca2+concentration by causing release of Ca2+bound to the photosensitive Ca2+ chelator DM-nitrophen. When Ca2+/DM-nitrophen was included in the pipette solution, a flash from a UV laser caused a rapid increase in internal Ca2+(n = 6). Figure 2C illustrates the increase in Ca2+ observed at a series of times after UV flashes. The increase in Ca2+ was evident after 100 μsec, peaked at ∼1 msec, and returned to resting levels by ∼20 msec. The kinetics of the decay of the Ca2+ transient is determined in part by the slow dissociation of Ca2+ from rhod-2 (which has a rate constant of 0.13 msec) (Escobar et al., 1997) and the subsequent binding of Ca2+ to endogenous buffers and DM-nitrophen. The homogeneity of the Ca2+ elevation at all time points, however, suggests that rhod-2 and rapidly acting endogenous Ca2+ buffers are evenly distributed throughout the terminal. A similar time course was seen after the uncaging of Ca2+ from DM-nitrophen in a drop of aqueous solution in mineral oil (Fig. 2D). Under these conditions Ca2+ increased rapidly, showed a plateau between 0.1 and 2 msec, and then declined. In bovine chromaffin cells, however, a delay of several milliseconds was observed between uncaging of Ca2+ from DM-nitrophen and the peak of the Ca2+signal (Robinson et al., 1996). The shorter delay in the terminals may reflect differences in cytosolic components that retard the photolytic reaction.
The homogeneous increases after Ca2+uncaging contrast with localized increases seen after electroporation (Fig. 2E). Transient pores in the membrane were evoked by brief pulses of current passed between electrodes held on either side of a terminal loaded with indicator dye by incubation with rhod-2 AM. The image on the left shows the increase in Ca2+ in a terminal ∼1 msec after poration in Ca2+ current media. A binary image (middle) demonstrates the localization of Ca2+ influx in an arc near the positive pole of the electrode. The area of increase likely reflects the area of the membrane on the focal plane that was disrupted. Although this disruption was transient, the influx of Ca2+ overwhelmed the Ca2+ buffers of the terminal, resulting in high levels throughout the cytoplasm. Most terminals, however, remained intact for minutes (data not shown). The image on the right shows the same terminal several seconds after poration. Ca2+ is elevated homogeneously with a mean ratio of 5.1, indicating that the rhod-2 is near saturation, with a Ca2+ concentration in excess of 10 μm (Fig. 1C).
Figure 3 illustrates two strategies to identify hot spots of voltage-gated Ca2+influx. One potential difficulty in identifying microdomains of Ca2+ is that as the influx proceeds during a depolarization, multiple microdomains may overlap and appear as a continuous submembranous ring. This occurs slowly in chromaffin cells, because hot spots of Ca2+ entry that are evident after depolarizations of 50 msec tend to become obscured only after 100 msec or longer (Monck et al., 1994). In the presence of less Ca2+ buffering, however, or with a greater number of channel clusters, the appearance of a ring of Ca2+ could occur more quickly. We therefore sought to image Ca2+ influx at the earliest possible time after the opening of Ca2+ channels. This was accomplished by causing a sudden influx of Ca2+ through channels during a Ca2+ tail current (n = 19). Figure 3A shows Ca2+ ratios before, during, and after a tail current evoked by returning the potential to −80 mV after a 10 msec step to +40 mV. This protocol evoked a current that was transient (<2 msec in duration), but larger in amplitude than currents evoked by depolarization to lower potentials (compare with Fig. 1). Although very little influx had occurred at the end of the step to +40 mV (left image), there was a detectable increase 0.6 msec after the repolarization to −80 mV (middle image), and this was greatly enhanced 2.0 msec after the repolarization, after the tail current had finished (right image). The highest 1% of pixels in this ratio image had values corresponding to a Ca2+ concentration of 320 nm (data not shown). Both of the latter two ratio images showed Ca2+ increases that appeared as homogeneous submembranous rings, and repeated stimulation revealed no specific pattern of influx. These images give no indication of localized influx even when elevations were confined to an area 1 μm or less from the terminal membrane. The uniformity of submembranous Ca2+ influx at a time when Ca2+ had diffused such a short distance strongly supports the hypothesis that Ca2+channels do not exist in large clusters in these terminals.
The images of Ca2+ influx in Figures 1-3are strikingly different from what was seen in chromaffin cells. Ca2+ elevations in those cells were frequently concentrated in a small number of hot spots even after depolarizations as long as 50 msec. This phenomenon could be accentuated by cytoplasmic buffering, which would enforce a steep gradient of Ca2+ near the sites of influx. We therefore sought to determine whether localized Ca2+ influx would become visible in the neurohypophysial terminals after addition of the exogenous Ca2+ chelator EGTA (Fig. 3B). Images show the time course of Ca2+elevation after depolarizations of 5, 10, 20, and 30 msec, in typical terminals perfused with no EGTA (n = 6), 0.1 mm EGTA (n = 3), or 1.0 mm EGTA (n = 3). The presence of EGTA severely diminishes the size and intensity of the evoked Ca2+ rings in a dose-dependent manner. This is likely to occur as Ca2+ is transferred to EGTA after binding to either the endogenous buffer or rhod-2, because EGTA has a longer length-constant and will thus “trap” Ca2+ ions (Naraghi and Neher, 1997). Even when the fluorescent signal was severely limited in this manner, however, elevations of submembranous Ca2+ were homogeneous.
By repeatedly depolarizing a terminal, it is possible to image the increases in Ca2+ evoked by a series of depolarizations of different lengths. Figure4A illustrates such an experiment. Submembranous increases in Ca2+ were visible after 5 msec of depolarization, and Ca2+ levels throughout the entire cytoplasm were elevated by 40 msec. The ring of elevated Ca2+ grows deeper and more intense with longer periods of depolarization but appears to be homogeneous at all time points. This experiment also supports the hypothesis that the neurohypophysial terminals lack large clusters of Ca2+ channels. It must be noted, however, that this is not an accurate reflection of the rate of diffusion of Ca2+ because the rhod-2/Ca2+ complex is likely to diffuse more rapidly (Zhou and Neher, 1993).
Fig. 4.
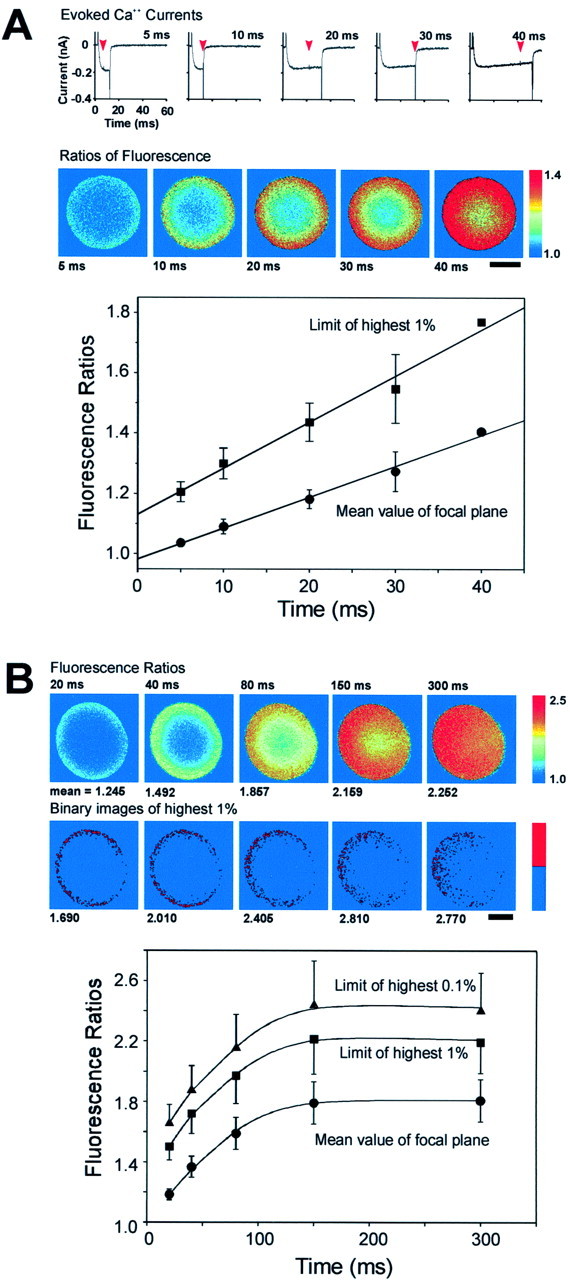
Time course of [Ca2+]i elevation. A,Traces show Ca2+ currents evoked in a single terminal by depolarizations of different duration. Laser pulses were applied at the moments indicated by the arrows, and the resultant ratios of fluorescence are shown in the images below. Thegraph shows plots of the mean value of the image focal plane and the threshold value defining the highest 1% of pixels in that plane, versus the period of depolarization (n= 5, ±SEM; except for the final points in each of the lines, which are averages of 2). Both plots are linear, suggesting that neither the mean elevation nor the elevation nearest the membrane reaches saturation during short pulses. B, Saturation of [Ca2+]i elevations during step depolarizations of longer duration. Images show fluorescence ratios obtained in a terminal after step depolarizations of the indicated duration. The ring pattern of elevated Ca2+ is no longer visible at 300 msec. Beneath are binary images showing the location of the 1% of pixels having the highest ratio values. Pixels were enlarged ninefold. The graph shows plots of the mean value of the image focal plane, the threshold value defining the highest 1%, and the threshold value defining the highest 0.1% of pixels in that plane, versus the duration of depolarization (n = 5). All three plots reach an asymptote with pulses longer than ∼150 msec. The fact that the plots are parallel suggests that this mechanism effectively limits the [Ca2+] elevation beneath the membrane as well as in the bulk cytoplasm.
The relationship between the length of depolarization and the elevation of Ca2+ levels is plotted at the bottom of Figure 4A. The bottom line shows the mean ratio (±SEM) of all the pixels on the focal plane as a function of the time of depolarization, whereas the top line shows the threshold that defines the highest 1% of pixel values at each time point to estimate the concentration of Ca2+ near the terminal membrane (n = 5 for both plots, except for the last point in each which are averages of two). The observed relationship is consistent with work showing that measured elevations of bulk Ca2+ in these terminals have a linear relationship with lengths of depolarization up to 50 msec (Stuenkel, 1994). The calibration curve shown in Figure 1Csuggests that the mean Ca2+ concentration achieved after a 40 msec step is ∼350 nm. This value is far less than would be expected if there were no Ca2+ buffering, because if [Ca2+] =Q/2FV, with Q being the influx in coulombs (8 pC for a 40 msec influx of 200 pA), F being the Faraday constant (9.648 × 10⁴C/mol), and V being the terminal volume (0.9 pl for a terminal with a diameter of 12 μm), the expected increase should be 46 μm. This suggests that most Ca2+ ions entering the terminal bind to a rapid endogenous Ca2+ buffer rather than to rhod-2 (Stuenkel, 1994). The similarity of the slopes of the two lines suggests that for short depolarizations and within the resolution of the technique, the Ca2+ near the membrane is buffered to an extent similar to that in the bulk cytoplasm.
We next sought to determine whether this relationship holds for greater Ca2+ loads (Fig. 4B). During longer depolarizations, the ring of elevated Ca2+ becomes less pronounced and is not visible at 300 msec. This is also evident in the dispersal from the membrane of the pixels with the highest values, as is seen in the binary images shown below. The lower level of Ca2+ visible on the right side of the terminal is likely to reflect diffusion of Ca2+ and Ca2+/rhod-2 into the pipette. The graph below shows that the plot of the mean ratio of Ca2+ in the terminal reaches an asymptote at a ratio of ∼1.8, which corresponds to a Ca2+ concentration of ∼600 nm. This value is similar to the value that was obtained for increases in bulk cytoplasm in these terminals as measured by fura-2 AM (Stuenkel, 1994). The author reported that Ca2+ increases were limited to that value by the activation of mitochondrial uptake. Plots of the thresholds that define the highest 1 or 0.1% of pixels are both parallel to the plot of mean fluorescence. This suggests that the endogenous buffer does not saturate locally near the membrane during prolonged depolarizations (despite a Ca2+ concentration of >1.4 μm in the top 0.1% of pixels in terminals shown in Fig. 4B), and that the mitochondrial uptake effectively limits the concentration of Ca2+ near the membrane, albeit at a higher concentration than in the center of the terminal.
DISCUSSION
We have used pulsed laser imaging to measure the spatial distribution of Ca2+ influx into isolated neuroendocrine axon terminals from the neurohypophysis. The sensitivity and rapidity of the pulsed laser technique has allowed us to image Ca2+ increases after influx of only 0.6 msec during a tail current. Despite efforts to identify localized entry of Ca2+ by imaging influx after brief or extended periods of depolarization, and in the presence of various Ca2+ channel blockers or intracellular Ca2+ chelators, the influx into the neurohypophysial terminals was always homogeneously distributed over the terminal membrane. Localized influx, however, was clearly seen after electroporation of the terminal membrane and when similar experiments were performed on bovine chromaffin cells (Monck et al., 1994; Robinson et al., 1995, 1996). These data support the hypothesis that Ca2+ channels in the terminals do not possess the large clusters of Ca2+channels seen at specialized release sites in the presynaptic terminal of the squid giant synapse (Llinas et al., 1992), in auditory hair cells (Issa and Hudspeth, 1994; Tucker and Fettiplace, 1995), and in chromaffin cells (Monck et al., 1994; Robinson et al., 1995, 1996), nor is Ca2+ influx in the terminals polarized as it is in pancreatic β cells (Bokvist et al., 1995).
Three distinct scenarios may be proposed for the relationship between Ca2+ channels and sites of exocytotic release (Schweizer et al., 1995). Ca2+ channels may be physically associated with a component of the exocytotic apparatus, and therefore release may be triggered by the very high concentration of Ca2+ achieved in a “nanodomain” near a single channel mouth. Ca2+ channels may not be linked to exocytotic proteins but may exist, to some extent, in large clusters. Release of granules in the vicinity of such clusters would be triggered by a “microdomain” of elevated Ca2+ created by the summation of Ca2+ influx through channels in the cluster. If, however, Ca2+ channels and release sites are randomly distributed over a cell membrane, release would be dependent on a “radial shell” of elevated submembranous Ca2+ caused by influx through multiple dispersed channels. In the neurohypophysial terminals, it appears unlikely that Ca2+ channels are physically associated with exocytotic proteins because the majority of evoked secretion is sensitive to the addition of EGTA (Lim et al., 1990;Giovannucci and Stuenkel, 1997), which suggests that Ca2+ must diffuse a significant distance to its site of action (Schweizer et al., 1995; Neher, 1998). Furthermore, such an association would predict that release should occur rapidly on depolarization [because the Ca2+ concentration at the channel mouth should increase rapidly after channel opening (Neher, 1998)], whereas short depolarizations of these terminals (≤5 msec) do not evoke capacitance increases (Giovannucci and Stuenkel, 1997). These data do not, however, eliminate the microdomain scenario as a possibility. Large clusters of Ca2+ channels associated with preferential sites of release were demonstrated in bovine chromaffin cells (Monck et al., 1994; Robinson et al., 1995, 1996). This suggests that such release site architecture could be important in secretion from other types of endocrine cells. The neurohypophysial terminals in particular appeared to be a good candidate for such an organization because of their dependence on N- and P/Q-type Ca2+ channels for evoking release (Lemos and Nowycky, 1989; Fisher and Bourque, 1995, 1996; Wang et al., 1997) and because of the relatively high concentration of internal Ca2+ required to evoke release in dialysis experiments (Rosenboom and Lindau, 1994). Large clusters of Ca2+ channels on terminal membranes were not observed using cell attached recordings (Wang et al., 1993), but the probability of detecting a highly focused cluster with this technique may be small. Pulsed laser Ca2+imaging of depolarization-evoked influx therefore offers a uniquely effective method to test this hypothesis. Our clear demonstration that large clusters do not occur in the neurohypophysial terminals supports the hypothesis that release in these terminals is dependent on a Ca2+ elevation mediated by influx through multiple dispersed Ca2+ channels.
Ca2+ imaging techniques cannot rule out the clustering of small numbers of Ca2+channels; however, this would be unlikely to influence the concentration of Ca2+ achieved at release sites, unless Ca2+ channels are physically associated. If Ca2+ channels are not significantly clustered in these terminals, the interchannel distance is likely to be relatively large. Single L-type channels have a current of ∼0.1 pA at 0 mV in 10 mmCa2+ (Worley et al., 1991). Single-channel recordings in the neurohypophysial terminals have identified openings of two sizes, with the larger corresponding to L-type channels and the smaller having a conductance roughly one-half as large (Wang et al., 1993). This suggests that a terminal with a diameter of 15 μm (area = 236 μm2) and a peak current of 200 pA should have between 2000 and 4000 open channels during a depolarization or 8–16 channels per μm2. If 12 channels per μm2 is assumed, the mean distance between Ca2+ channels would be ∼300 nm, and only ∼4–5% would be closer than 30 nm. A random distribution of channels and releasable granules would therefore imply that fusion of most granules would therefore depend on Ca2+ influx through multiple channels.
If exocytotic release depends on a cloud of elevated Ca2+ of near micrometer dimensions, a comparison of Ca2+ elevations near the membrane with those in the bulk cytoplasm should reveal the extent to which levels of Ca2+ near the membrane are subject to the control of intracellular Ca2+ buffers. If the buffers were to become saturated during large Ca2+ loads, for example, the concentration of Ca2+near the membrane would increase relative to the concentration in the bulk cytoplasm. This could explain the observation that a “threshold” of Ca2+ influx must occur in the neurohypophysial terminals before secretion begins (Seward et al., 1995). Such saturation, however, was not seen in the terminals, because the relative fluorescence ratios of the highest 1 or 0.1% of pixels increased in parallel with the mean of the focal plane during depolarizations as long as 300 msec. Although our measurements are likely to underestimate the true concentrations of Ca2+, it suggests that the interchannel level is in the low micromolar range. This is consistent with models estimating the interchannel concentration in chromaffin cells, assuming regularly spaced Ca2+ channels (Klingauf and Neher, 1997). This fine control of influx-evoked Ca2+ increases, and the low proportion of Ca2+ ions that bind to rhod-2 in our conditions (see Results), suggests that endogenous buffers bind Ca2+ very rapidly and have a high capacity.
The pattern of Ca2+ influx in the neurohypophysial terminals contrasts sharply with that seen in chromaffin cells (Monck et al., 1994; Robinson et al., 1995, 1996). Depolarization of these cells frequently results in a small number of distinct hot spots of Ca2+ influx that are robust, reproducible, and evident after depolarizations as long as 50 msec (Monck et al., 1994; Robinson et al., 1995). These hot spots correspond to regions on the cell surface at which there is a preferential release of catecholamines from large dense-core vesicles during 50 msec depolarizations. Localized release is also seen after increases in intracellular Ca2+ activated by agents that activate Ca2+ release from internal stores (Schroeder et al., 1994) and is supported by the observation that visualized chromaffin granules appear to fuse with the cell membrane in a heterogeneous pattern during depolarizations (Steyer et al., 1997). Furthermore, the latencies between depolarization and release suggest that although most chromaffin granules are 300 nm from the nearest Ca2+ channel, a small proportion of the granules are situated within 30 nm (Klingauf and Neher, 1997). Thus although most chromaffin cell granules are randomly distributed throughout the cytoplasm, a small proportion may exist in close apposition to clusters of Ca2+channels. Specialized release sites would be unlikely to be important for reasons of secretory rapidity, because transport to the sites of action via the blood stream takes much longer than release. Rather, chromaffin cells may be designed to use two modes of release, a reliable low level of release of catecholamine in response to infrequent, single action potentials, and a slower but larger release in response to sustained stimulation.
In the neurohypophysial terminals, by contrast, our evidence suggests that specialized release sites do not exist. Electrical stimulation of isolated neurohypophyses shows that the probability of neuropeptide secretion is low in response to infrequent single action potentials and is optimized by bursts of action potentials interspersed between periods of quiescence (Bicknell, 1988). Action potentials in the terminals are very brief (1–2 msec) (Bourque, 1990), and the interval between spikes is relatively large, even during bursts (firing during bursts in vasopressin-releasing terminals is typically at a rate of 7–12 Hz) (Poulain and Wakerley, 1982). It therefore appears that the architecture of exocytotic release in the neurohypophysial terminals is designed for a slow release of neuropeptide that reflects the integration of Ca2+ influx over many action potentials.
Footnotes
This work was funded by Grant RO1 NS 35866 from the National Institutes of Health to J.M.F. We thank Piotr E. Marszalek for his expert advice on the electroporation experiments and Mitsuhiko Yamada for construction of the rhod-2 calibration plot shown in Figure 1.
Correspondence should be addressed to Thomas E. Fisher, Department of Physiology and Biophysics, Mayo Foundation, 1–117 Medical Sciences Building, Rochester, MN 55905.
REFERENCES
- 1.Bicknell RJ. Optimizing release from peptide hormone secretory nerve terminals. J Exp Biol. 1988;139:51–65. doi: 10.1242/jeb.139.1.51. [DOI] [PubMed] [Google Scholar]
- 2.Bokvist K, Eliasson L, Ammala C, Renstrom E, Rorsman P. Co-localization of L-type Ca2+ channels and insulin-containing secretory granules and its significance for the initiation of exocytosis in mouse pancreatic B-cells. EMBO J. 1995;14:50–57. doi: 10.1002/j.1460-2075.1995.tb06974.x. [DOI] [PMC free article] [PubMed] [Google Scholar]
- 3.Bourque CW. Intraterminal recordings from the rat neurohypophysis in vitro. J Physiol (Lond) 1990;421:247–262. doi: 10.1113/jphysiol.1990.sp017943. [DOI] [PMC free article] [PubMed] [Google Scholar]
- 4.Dunlap K, Luebke JI, Turner TJ. Exocytotic Ca2+ channels in mammalian central neurons. Trends Neurosci. 1995;18:89–98. [PubMed] [Google Scholar]
- 5.Escobar AL, Velez P, Kim AM, Cifuentes F, Fill M, Vergara JL. Kinetic properties of DM-nitrophen and calcium indicators: rapid transient response to flash photolysis. Pflügers Arch. 1997;434:615–631. doi: 10.1007/s004240050444. [DOI] [PubMed] [Google Scholar]
- 6.Fisher TE, Bourque CW. Distinct omega-agatoxin-sensitive calcium currents in somata and axon terminals of rat supraoptic neurones. J Physiol (Lond) 1995;489:383–388. doi: 10.1113/jphysiol.1995.sp021059. [DOI] [PMC free article] [PubMed] [Google Scholar]
- 7.Fisher TE, Bourque CW. Calcium-channel subtypes in the somata and axon terminals of magnocellular neurosecretory cells. Trends Neurosci. 1996;19:440–444. doi: 10.1016/0166-2236(96)10034-5. [DOI] [PubMed] [Google Scholar]
- 8.Giovannucci DR, Stuenkel EL. Regulation of secretory granule recruitment and exocytosis at rat neurohypophysial nerve endings. J Physiol (Lond) 1997;498:735–751. doi: 10.1113/jphysiol.1997.sp021898. [DOI] [PMC free article] [PubMed] [Google Scholar]
- 9.Hamill OP, Marty A, Neher E, Sakmann B, Sigworth FJ. Improved patch-clamp techniques for high-resolution current recording from cells and cell-free membrane patches. Pflügers Arch. 1981;391:85–100. doi: 10.1007/BF00656997. [DOI] [PubMed] [Google Scholar]
- 10.Hsu SF, Jackson MB. Rapid exocytosis and endocytosis in nerve terminals of the rat posterior pituitary. J Physiol (Lond) 1996;494:539–553. doi: 10.1113/jphysiol.1996.sp021512. [DOI] [PMC free article] [PubMed] [Google Scholar]
- 11.Issa NP, Hudspeth AJ. Clustering of Ca2+ channels and Ca2+-activated K+ channels at fluorescently labeled presynaptic active zones of hair cells. Proc Natl Acad Sci USA. 1994;91:7578–7582. doi: 10.1073/pnas.91.16.7578. [DOI] [PMC free article] [PubMed] [Google Scholar]
- 12.Klingauf J, Neher E. Modeling buffered Ca2+ diffusion near the membrane: implications for secretion in neuroendocrine cells. Biophys J. 1997;72:674–690. doi: 10.1016/s0006-3495(97)78704-6. [DOI] [PMC free article] [PubMed] [Google Scholar]
- 13.Lemos JR, Nowycky MC. Two types of calcium channels coexist in peptide-releasing vertebrate nerve terminals. Neuron. 1989;2:1419–1426. doi: 10.1016/0896-6273(89)90187-6. [DOI] [PubMed] [Google Scholar]
- 14.Lim NF, Nowycky MC, Bookman RJ. Direct measurement of exocytosis and calcium currents in single vertebrate nerve terminals. Nature. 1990;344:449–451. doi: 10.1038/344449a0. [DOI] [PubMed] [Google Scholar]
- 15.Lindau M, Stuenkel EL, Nordmann JJ. Depolarization, intracellular calcium and exocytosis in single vertebrate nerve endings. Biophys J. 1992;61:19–30. doi: 10.1016/S0006-3495(92)81812-X. [DOI] [PMC free article] [PubMed] [Google Scholar]
- 16.Llinas R, Sugimori M, Silver RB. Microdomains of high calcium concentration in a presynaptic terminal. Science. 1992;256:677–679. doi: 10.1126/science.1350109. [DOI] [PubMed] [Google Scholar]
- 17.Marszalek PE, Farrell B, Verdugo P, Fernandez JM. Kinetics of release of serotonin from isolated secretory granules. I. Amperometric detection of serotonin from electroporated granules. Biophys J. 1997;73:1160–1168. doi: 10.1016/S0006-3495(97)78148-7. [DOI] [PMC free article] [PubMed] [Google Scholar]
- 18.Monck JR, Robinson IM, Escobar AL, Vergara JL, Fernandez JM. Pulsed laser imaging of rapid Ca2+ gradients in excitable cells. Biophys J. 1994;67:505–514. doi: 10.1016/S0006-3495(94)80554-5. [DOI] [PMC free article] [PubMed] [Google Scholar]
- 19.Naraghi M, Neher E. Linearized buffered Ca2+ diffusion in microdomains and its implications for calculation of [Ca2+] at the mouth of a calcium channel. J Neurosci. 1997;17:6961–6973. doi: 10.1523/JNEUROSCI.17-18-06961.1997. [DOI] [PMC free article] [PubMed] [Google Scholar]
- 20.Neher E. Vesicle pools and Ca2+ microdomains: new tools for understanding their roles in neurotransmitter release. Neuron. 1998;20:389–399. doi: 10.1016/s0896-6273(00)80983-6. [DOI] [PubMed] [Google Scholar]
- 21.Oheim M, Loerke D, Stühmer W, Chow RH. Multiple stimulation-dependent processes regulate the size of the releasable pool of vesicles. Eur Biophys J. 1999;28:91–101. doi: 10.1007/s002490050188. [DOI] [PubMed] [Google Scholar]
- 22.Poulain DA, Wakerley JB. Electrophysiology of hypothalamic magnocellular neurones secreting oxytocin and vasopressin. Neuroscience. 1982;7:773–808. doi: 10.1016/0306-4522(82)90044-6. [DOI] [PubMed] [Google Scholar]
- 23.Pumplin DW, Reese TS, Llinas R. Are the presynaptic membrane particles the calcium channels? Proc Natl Acad Sci USA. 1981;78:7210–7213. doi: 10.1073/pnas.78.11.7210. [DOI] [PMC free article] [PubMed] [Google Scholar]
- 24.Robinson IM, Finnegan JM, Monck JR, Wightman RM, Fernandez JM. Colocalization of calcium entry and exocytotic release sites in adrenal chromaffin cells. Proc Natl Acad Sci USA. 1995;92:2474–2478. doi: 10.1073/pnas.92.7.2474. [DOI] [PMC free article] [PubMed] [Google Scholar]
- 25.Robinson IM, Yamada M, Carrion-Vazquez M, Lennon VA, Fernandez JM. Specialized release zones in chromaffin cells examined with pulsed- laser imaging. Cell Calcium. 1996;20:181–201. doi: 10.1016/s0143-4160(96)90106-2. [DOI] [PubMed] [Google Scholar]
- 26.Robitaille R, Adler EM, Charlton MP. Strategic location of calcium channels at transmitter release sites of frog neuromuscular synapses. Neuron. 1990;5:773–779. doi: 10.1016/0896-6273(90)90336-e. [DOI] [PubMed] [Google Scholar]
- 27.Rosenboom H, Lindau M. Exo-endocytosis and closing of the fission pore during endocytosis in single pituitary nerve terminals internally perfused with high calcium concentrations. Proc Natl Acad Sci USA. 1994;91:5267–5271. doi: 10.1073/pnas.91.12.5267. [DOI] [PMC free article] [PubMed] [Google Scholar]
- 28.Schroeder TJ, Jankowski JA, Senyshyn J, Holz RW, Wightman RM. Zones of exocytotic release on bovine adrenal medullary cells in culture. J Biol Chem. 1994;269:17215–17220. [PubMed] [Google Scholar]
- 29.Schweizer FE, Betz H, Augustine GJ. From vesicle docking to endocytosis: intermediate reactions of exocytosis. Neuron. 1995;14:689–696. doi: 10.1016/0896-6273(95)90213-9. [DOI] [PubMed] [Google Scholar]
- 30.Seward EP, Chernevskaya NI, Nowycky MC. Exocytosis in peptidergic nerve terminals exhibits two calcium-sensitive phases during pulsatile calcium entry. J Neurosci. 1995;15:3390–3399. doi: 10.1523/JNEUROSCI.15-05-03390.1995. [DOI] [PMC free article] [PubMed] [Google Scholar]
- 31.Steyer JA, Horstmann H, Almers W. Transport, docking and exocytosis of single secretory granules in live chromaffin cells. Nature. 1997;388:474–478. doi: 10.1038/41329. [DOI] [PubMed] [Google Scholar]
- 32.Stuenkel EL. Regulation of intracellular calcium and calcium buffering properties of rat isolated neurohypophysial nerve endings. J Physiol (Lond) 1994;481:251–271. doi: 10.1113/jphysiol.1994.sp020436. [DOI] [PMC free article] [PubMed] [Google Scholar]
- 33.Tucker T, Fettiplace R. Confocal imaging of calcium microdomains and calcium extrusion in turtle hair cells. Neuron. 1995;15:1323–1335. doi: 10.1016/0896-6273(95)90011-x. [DOI] [PubMed] [Google Scholar]
- 34.Wang G, Dayanithi G, Kim S, Hom D, Nadasdi L, Kristipati R, Ramachandran J, Stuenkel EL, Nordmann JJ, Newcomb R, Lemos JR. Role of Q-type Ca2+ channels in vasopressin secretion from neurohypophysial terminals of the rat. J Physiol (Lond) 1997;502:351–363. doi: 10.1111/j.1469-7793.1997.351bk.x. [DOI] [PMC free article] [PubMed] [Google Scholar]
- 35.Wang X, Treistman SN, Lemos JR. Single channel recordings of Nt- and L-type Ca2+ currents in rat neurohypophysial terminals. J Neurophysiol. 1993;70:1617–1628. doi: 10.1152/jn.1993.70.4.1617. [DOI] [PubMed] [Google Scholar]
- 36.Worley JF, Quayle JM, Standen NB, Nelson MT. Regulation of single calcium channels in cerebral arteries by voltage, serotonin, and dihydropyridines. Am J Physiol. 1991;261:H1951–1960. doi: 10.1152/ajpheart.1991.261.6.H1951. [DOI] [PubMed] [Google Scholar]
- 37.Zhou Z, Neher E. Mobile and immobile calcium buffers in bovine adrenal chromaffin cells. J Physiol (Lond) 1993;469:245–273. doi: 10.1113/jphysiol.1993.sp019813. [DOI] [PMC free article] [PubMed] [Google Scholar]