

Abstract
Auditory spatial information is processed in parallel forebrain and midbrain pathways. Sensory experience early in life has been shown to exert a powerful influence on the representation of auditory space in the midbrain space-processing pathway. The goal of this study was to determine whether early experience also shapes the representation of auditory space in the forebrain.
Owls were raised wearing prismatic spectacles that shifted the visual field in the horizontal plane. This manipulation altered the relationship between interaural time differences (ITDs), the principal cue used for azimuthal localization, and locations of auditory stimuli in the visual field. Extracellular recordings were used to characterize ITD tuning in the auditory archistriatum (AAr), a subdivision of the forebrain gaze fields, in normal and prism-reared owls.
Prism rearing altered the representation of ITD in the AAr. In prism-reared owls, unit tuning for ITD was shifted in the adaptive direction, according to the direction of the optical displacement imposed by the spectacles. Changes in ITD tuning involved the acquisition of unit responses to adaptive ITD values and, to a lesser extent, the elimination of responses to nonadaptive (previously normal) ITD values. Shifts in ITD tuning in the AAr were similar to shifts in ITD tuning observed in the optic tectum of the same owls.
This experience-based adjustment of binaural tuning in the AAr helps to maintain mutual registry between the forebrain and midbrain representations of auditory space and may help to ensure consistent behavioral responses to auditory stimuli.
Keywords: sound localization, experience-dependent plasticity, archistriatum, forebrain, gaze control, barn owl
The forebrain plays an essential role in directing complex sound localization behaviors (Ravizza and Diamond, 1974;Heffner and Masterton, 1975; Jenkins and Merzenich, 1984; Heffner and Heffner, 1990; Clarey et al., 1992; Brainard, 1994; Knudsen and Knudsen, 1996a). Accurate sound localization requires that the auditory system establishes associations between localization cues, such as interaural time differences (ITDs) and interaural level differences (ILDs), and the locations in space that produce them. Behavioral experiments in barn owls have demonstrated that these associations are shaped by experience (Knudsen et al., 1982, 1984, 1991; Knudsen and Knudsen, 1989). In addition, physiological experiments in several species have demonstrated that early sensory experience exerts a powerful influence on neural representations of auditory space in the midbrain (Knudsen, 1983, 1988; King et al., 1988; Knudsen and Brainard, 1991; Withington, 1992; King and Carlile, 1993). These findings predict that the forebrain representation of auditory space is similarly shaped by early experience. The goal of this study was to test this prediction.
In barn owls, an output structure of the forebrain auditory space-processing pathway is the archistriatal gaze fields (AGFs) (Knudsen et al., 1995; Cohen et al., 1998). The AGF projects directly to premotor nuclei in the brainstem that mediate changes in gaze and can mediate orienting responses to auditory stimuli independently of the midbrain space-processing pathway (Knudsen and Knudsen, 1996b). In addition, the AGF plays an important role in complex tasks, such as directing the owl’s gaze to the location of remembered auditory targets (Knudsen and Knudsen, 1996a).
The representation of auditory space that underlies the contribution of the AGF to localization behavior is contained in a subdivision of the AGF, the auditory archistriatum (AAr) (Cohen and Knudsen, 1995). Sites in the AAr, like those in the midbrain optic tectum, have spatially restricted auditory receptive fields that result from their tuning for ITD, the principal cue for azimuthal localization, and ILD, the principal cue used for elevational localization. ITD and ILD tuning in the AAr is derived independently of auditory space maps in the midbrain (Cohen et al., 1998)
To assess the influence of experience on the representation of auditory space in the AAr, we characterized unit tuning for ITD and ILD in the AAr of owls raised wearing prismatic spectacles that displaced the visual field in the horizontal plane. Because the owl’s eyes are essentially stationary in the head, the spectacles altered the relationships between ITD values and locations in the visual field. Prism rearing caused adjustments in ITD tuning that tended to realign the representation of auditory space in the AAr with the optically displaced visual field. This experience-based adjustment of binaural tuning in the AAr helps to maintain mutual registry between the forebrain and midbrain representations of auditory space.
MATERIALS AND METHODS
Visual experience. Visual experience was altered by raising owls with prismatic spectacles that shifted the visual field 23° to the left (L23 spectacles) or 23° to the right (R23 spectacles). Wearing prismatic spectacles did not alter the range of ITD or ILD values experienced by the owl (Knudsen and Knudsen, 1989). However, because the eyes of the owl are essentially stationary in the head, the optical displacement caused by the spectacles changed the relationships between ITD and sound source location in the visual field. Spectacle frames with prismatic Fresnel lenses (Vision Care/3M) were attached at ∼60 d of age, when the owls had reached adult size. At this time, owls were anesthetized with halothane (1.5%) in a mixture of oxygen and nitrous oxide (55:45), and a plate was cemented to the skull. The spectacles were attached to this plate and centered in front of the eyes. Owls were then returned to a large flight cage that contained several other owls and provided an environment rich in auditory and visual stimuli. Lenses were cleaned several times per week and adjusted as needed to maintain alignment with the visual axes. Owls wore the spectacles for at least 60 d before any electrophysiological measurements were made.
Adjustments in ITD tuning that tended to realign the auditory representation of space with the optically displaced visual field were considered “adaptive.” Thus, for owls raised with right-shifting spectacles (R23 owls), shifts toward left-ear leading values were adaptive, and for owls raised with left-shifting spectacles (L23 owls), shifts toward right-ear leading values were adaptive.
Electrophysiology. Owls were prepared for multiple experiments. Before electrophysiological recordings, an owl was anesthetized with halothane and nitrous oxide, and a headpiece was mounted to the skull. At the same time, a craniotomy was made over the optic tectum and AAr. Chloramphenical antibiotic (0.5%) was applied to the exposed brain surface, and the craniotomy was sealed with dental acrylic. All skin wounds were infused with Xylocaine (2%), and the owl was allowed to recover fully from the anesthetic before being returned to the aviary.
On the day of an experiment, the owl was anesthetized with halothane and nitrous oxide. The owl was then wrapped in a leather harness, suspended in a prone position inside a sound-attenuating chamber (AD2000, Eckel Industries), and secured to a stereotaxic device by its headpiece. The head was positioned using retinal landmarks so that the visual axes were in the horizontal plane, and the dental acrylic was removed from the craniotomy. Light anesthesia was maintained throughout the experiment with the nitrous oxide/oxygen mixture or, occasionally, with nitrous oxide and halothane.
Insulated tungsten microelectrodes (1–3 MΩ at 1.0 kHz) were positioned stereotaxically and advanced through the brain with a microdrive. A level discriminator was used to isolate units, and the timing of action potentials elicited by auditory stimuli was stored on a computer. To calibrate the position of the electrode in the brain, the electrode was first advanced into the optic tectum. Because the visual map in the optic tectum is precise and well characterized, the position of the electrode within the tectum can be determined from the location of the visual receptive field (VRF) of the recorded units. The AAr is a small structure, ∼1 mm3, located approximately 2.0 mm rostral, 0.5 mm lateral, and 3.0 mm dorsal to the representation of 0° azimuth and 0° elevation in the superficial layers of the optic tectum (Cohen and Knudsen, 1995).
Throughout an experiment, chloramphenical antibiotic was applied to the exposed brain surface. At the conclusion of an experiment, the craniotomy was resealed with dental acrylic, and an intramuscular injection (2–3 cc) of 2.5% dextrose saline solution was administered. Owls were allowed to recover from the anesthetic before being returned to the aviary.
Auditory stimuli and assessment of binaural tuning. Auditory stimuli were generated digitally and delivered dichotically via earphones (Knowles earphones, model 1914, coupled to damping assemblies BF-1743) placed in the external ear canals. Each earphone was aligned parallel to the long axis of the ear canal and centered within the canal ∼5 mm from the tympanic membrane. The timing and level of sound presented at the two ears was under computer control.
Noise-burst (50 msec duration, bandpass 3–12 kHz) stimuli with various ITDs were presented at an average binaural level (the sum of the sound level, in decibels, presented at the two ears divided by two) of 20 dB above threshold. A series of binaural stimuli consisted of noise bursts with different ITD values presented in random order. For each tuning curve, at least 10 series of stimuli were presented. Net response to a noise burst was quantified by subtracting the baseline discharge rate during the 100 msec interval before stimulus presentation from the number of spikes occurring during the 100 msec after stimulus onset. The “best ITD” of a site was defined as the midpoint of the range of ITD values that elicited at least 50% of the maximal response of the site. The range of ITD values that elicited at least 50% of the maximal response defined the “ITD tuning width” of the site (see Fig. 1). The left-ear leading endpoint of this range defined the “left 50% cutoff” of the site, and the right-ear leading endpoint defined the “right 50% cutoff.” Tuning for ILD was determined and quantified in an analogous manner. ITD tuning was assessed with ILD held constant at the best ILD value of the site, and vice versa.
Fig. 1.

ITD tuning curve collected at a single site in the AAr of an owl raised with normal visual experience. The black line indicates the range of ITD values that elicited at least 50% of the maximal response for this site (the “ITD tuning width” of the site). The endpoints of this range defined the “left 50% cutoff” and “right 50% cutoff” for this site.
Optic tectum sampling. Assessments of experience-dependent shifts in ITD tuning in the optic tectum were made according to a method reported previously (Brainard and Knudsen, 1993). VRFs were mapped by projecting dark or light bars onto a calibrated translucent hemisphere placed in front of the owl, and the magnitude of prism-induced shifts in ITD tuning for individual sites was quantified by comparing the measured best ITD value with the value predicted by the normal relationship between best ITD and VRF azimuth: predicted ITD = VRF azimuth * 2.5 μsec/° (Brainard and Knudsen, 1993). Tectal samples were restricted to sites representing frontal space (VRF azimuth within 10° of the midsagittal plane and VRF elevation between 10° up and 15° down). This region of the tectal map contains sites that shift ITD tuning reliably. The shift in ITD tuning for a single tectum was calculated as the shift in best ITD averaged across all sampled sites. Sample sizes in the tectum ranged from 14 to 23 sites (median, 19).
AAr sampling. Unit tuning for ITD and ILD was sampled in five left and seven right AArs in eight owls raised with normal visual experience, in two left and two right AArs in two owls raised with L23 spectacles, and in four left and five right AArs in five owls raised with R23 spectacles.
In contrast to the topographic maps of ITD and ILD found in the midbrain space-processing pathway (Moiseff and Konishi, 1981; Olsen et al., 1989; Mogdans and Knudsen, 1993), the representation of binaural cues in the AAr has a clustered organization (Cohen and Knudsen, 1995). Clusters of neighboring sites in the AAr tend to be tuned to similar values of ITD and ILD, but sites in different clusters are tuned to dissimilar values. As a result of this organizational scheme, it is not possible to infer the normal tuning of a site in the AAr based on its location in the structure. In addition, because sites in the AAr do not respond to visual stimuli, the method used to infer normal ITD tuning in the optic tectum (see previous section) could not be used.
Therefore, to assess the effect of prism rearing on the representation of ITD in the AAr, it was necessary to compare ITD tuning across populations of sites in the AAr of prism-reared and normal owls. The technique used for sampling ITD tuning in the AAr was identical for prism-reared and normal owls and was designed to obtain a sample of sites that was representative of the entire population. In each owl, a coarse grid of electrode penetrations was made to determine the extent of the AAr. These grids consisted of series of penetrations separated by 500 μm along the rostrocaudal or mediolateral axis. In some cases, additional penetrations were made at locations between the penetrations of the initial grid. All penetrations were separated by at least 250 μm along the rostrocaudal or mediolateral axis. Within a dorsoventral penetration through the AAr, ITD tuning was assessed at 150–250 μm increments. This method typically produced a sample of 10–30 AAr sites (median, 17).
Composite response curves. Composite response curves were constructed as a graphic representation of population ITD or ILD tuning in the AAr. Composite ITD response curves were constructed by calculating the percentage of sampled sites that responded at or above 50% of their maximal response for each of 21 ITD values that spanned the physiological range of ITDs (200 μsec left-ear leading to 200 μsec right-ear leading) in 20 μsec increments. Composite ITD response curves were constructed for each AAr in which a sample of more than 10 sites was obtained (three left and four right AArs in normal owls; two left and two right AArs in L23 owls; two left and four right AArs in R23 owls). Grand composite ITD response curves were calculated in the same manner and included data from all owls in each condition (i.e., left and right sides of the brain in normal, R23, and L23 owls). Grand composite ILD response curves were constructed by calculating the percentage of sampled sites that responded at or above 50% of their maximal response for each of 13 ILD values that spanned the physiological range of ILDs (30 dB left-ear greater to 30 dB right-ear greater) in 5 dB increments. The weighted averages of composite response curves were calculated and used as an indicator of population ITD (or ILD) tuning.
RESULTS
Representation of ITD in the optic tectum
Recordings were made first in the optic tectum of prism-reared owls to verify that prism rearing had altered the representation of ITD in the midbrain space-processing pathway of each owl. Shifts in ITD tuning for single tecta ranged from 14 to 51 μsec (median shift, 28 μsec) and were always in the adaptive direction.
Representation of ITD in the AAr of owls raised with normal visual experience
As reported previously (Cohen and Knudsen, 1995), sites in the AAr were tuned for specific values of ITD (Fig.1). In normal owls, the vast majority of sites responded maximally to ITD values near 0 μsec, corresponding to locations in frontal space (Fig.2A,B). The representation of ITD had a slight contralateral bias: most sites on the left side of the brain responded preferentially to small right-ear leading ITD values, and most sites on the right side of the brain responded preferentially to small left-ear leading ITD values. The mean best ITD was statistically different from 0 μsec on both sides of the brain (two-tailed, one-sample t test; left side, p = 0.003; right side, p < 0.0001). Grand composite ITD response curves for normal owls were sharply peaked (Fig. 2C,D). Approximately 60% of sites on both sides of the brain responded at or above 50% of their maximal response to 0 μsec ITD. The weighted averages of the grand composite response curves for the left and right AAr of normal owls were 16 μsec right-ear leading and 27 μsec left-ear leading, respectively. Although the weighted average of the grand composite ITD response curve for the right AAr was slightly more contralateral than the weighted average for the left AAr, there was not a significant difference in the distribution of contralateral or ipsilateral 50% ITD cutoff values for the left and right AAr (two-tailed t test; contralateral 50% cutoff, p = 0.45; ipsilateral 50% cutoff, p = 0.059).
Fig. 2.

Representation of ITD in the AAr of owls raised with normal visual experience. A, B, Horizontal lines indicate the ranges of ITD values that elicited at least 50% of the maximal response for sites in the left (n = 61) and right (n = 76) AAr. The endpoints of each line indicate the left and right 50% cutoffs. Gray barsindicate the range of ITDs that elicited ≥50% of the maximal response for ≥50% of sites recorded in the AAr of normal owls. C, D, Grand composite ITD response curves for the left (C) and right (D) AAr indicate the percentage of sites that responded at or above 50% of their maximal response for ITD values in the physiological range.
Representation of ITD in the AAr of prism-reared owls
The representation of ITD in the left and right AAr of an owl raised wearing R23 spectacles is shown in Figure3. On both sides of the brain, an increased percentage of sites responded strongly to left-ear leading ITD values. For example, the percentage of sites that responded at or above 50% of their maximal response to 60 μsec left-ear leading ITD was increased relative to normal (52 vs 11% in the left AAr; 59 vs 32% in the right AAr). In contrast, the percentage of sites that responded at or above 50% of their maximal response to 0 μsec ITD was smaller in both AArs (31 vs 64% in the left AAr; 24 vs 58% in the right AAr). The weighted averages of the composite ITD response curves for the left and right AAr in this owl were shifted toward left-ear leading by 54 and 18 μsec, respectively, relative to the weighted averages of the corresponding normal grand composite response curves. The direction of this shift was adaptive for R23 spectacles.
Fig. 3.

Representation of ITD in the left and right AAr of an owl raised with R23 spectacles. A, B,Horizontal lines indicate the ranges of ITD values that elicited at least 50% of the maximal response for sites in the left (n = 29) and right (n = 17) AAr. Dark circles indicate the 50% cutoff values on the adaptive flank of the ITD tuning curve (the left 50% cutoffs) for each site, and open circles indicate the 50% cutoff values on the nonadaptive flank (the right 50% cutoffs). Gray bars indicate the range of ITDs that elicited ≥50% of the maximal response for ≥50% of sites recorded in the AAr of normal owls for the corresponding sides of the brain (from Fig.2A,B). C, D, Composite ITD response curves for the left and right AAr of this owl. The gray curves are the grand composite response curves for normal owls for the corresponding sides of the brain and are the same as those in Figure 2, C and D.
The representation of ITD in the left and right AAr of an owl raised wearing L23 spectacles is shown in Figure4. Relative to normal, a greater percentage of sites responded strongly to right-ear leading ITD values in this owl. In the left AAr, 89% of sites responded at or above 50% of their maximal response to 60 μsec right-ear leading ITD, compared with only 31% in normal owls. In the right AAr, 36% of sites responded at or above 50% of their maximal response to 60 μsec right-ear leading ITD, compared with only 3% in normal owls. The percentage of sites that responded at or above 50% of their maximal response to 0 μsec ITD was smaller in both AArs (35 vs 64% in the left AAr; 43 vs 58% in the right AAr). The weighted averages of the composite ITD response curves for the left and right AArs were shifted toward right-ear leading by 42 and 37 μsec, respectively, relative to the weighted averages of the corresponding normal grand composite response curves. The direction of this shift was adaptive for L23 spectacles.
Fig. 4.

Representation of ITD in the left and right AAr of an owl raised with L23 spectacles. A, B,Horizontal lines indicate the ranges of ITD values that elicited at least 50% of the maximal response for sites in the left (n = 26) and right (n = 14) AAr. Dark circles indicate the 50% cutoff values on the adaptive flank of the ITD tuning curve (the right 50% cutoffs) for each site, and open circles indicate the 50% cutoff values on the nonadaptive flank (the left 50% cutoffs). Thegray bar indicates the range of ITDs that elicited ≥50% of the maximal response for ≥50% of sites recorded in the left AAr of normal owls (from Fig.2A,B). C, D, Composite ITD response curves for the left and right AAr of this owl. The gray curves are the grand composite response curves for normal owls for the corresponding sides of the brain and are the same as those in Figure 2, C and D.
Although the weighted averages of all composite ITD response curves for prism-reared owls were shifted in the adaptive direction relative to the weighted averages of the corresponding normal grand composite response curve, we observed considerable variability in the composite response curves obtained from different owls (Fig.5). The shapes of the curves varied from owl to owl, as did the magnitude of ITD shifts in prism-reared owls. To determine whether shifts in ITD tuning had occurred in the AAr of individual prism-reared owls, we compared distributions of left and right 50% ITD cutoff values from the AAr of each prism-reared owl to the corresponding distributions of 50% ITD cutoff values for all normal owls. For all four AArs sampled in L23 owls, the distributions of left and right 50% cutoffs were shifted in the adaptive direction relative to normal (Mann–Whitney U test, p< 0.05). For four of the six AArs sampled in R23 owls, the distributions of left and right 50% ITD cutoffs were shifted in the adaptive direction relative to normal (Mann–Whitney U test,p < 0.05). Thus, of the 20 distributions of 50% ITD cutoff values obtained in prism-reared owls (left and right cutoffs for 10 AArs), 16 were shifted in the adaptive direction. The same analysis was also applied to normal owls. Distributions of 50% ITD cutoff values for each normal owl were compared with the corresponding distributions of 50% ITD cutoff values for all other normal owls. Of the 14 distributions of 50% ITD cutoff values obtained in normal owls (left and right cutoffs for seven AArs), only two differed significantly from the distributions of cutoff values for the other normal owls.
Fig. 5.

Individual variability of ITD representation in the AAr. Composite ITD response curves for each AAr in which a sample of more than 10 sites was obtained. A,D, Normal owls (3 left AArs, 4 right AArs). B,E, L23 owls (2 left AArs, 2 right AArs). C,F, R23 owls (2 left AArs, 4 right AArs). The gray curve in each panel is the normal grand composite ITD response curve for the corresponding side of the brain (from Fig. 2C,D).
Grand composite ITD response curves were constructed using data from all sites recorded in the AAr of all prism-reared owls (Fig.6). In prism-reared owls, weighted averages for the grand composite response curves were shifted in the adaptive direction for the optical displacement imposed by the spectacles. In the left AAr (Fig. 6A), the weighted average of the grand composite curve for L23 owls was shifted toward right-ear leading (54 μsec right-ear leading vs 16 μsec right-ear leading for normal owls), and the weighted average for R23 owls was shifted toward left-ear leading (1 μsec left-ear leading vs 16 μsec right-ear leading). Similarly, in the right AAr (Fig.6B), the weighted average of the grand composite curve for L23 owls was shifted toward right-ear leading (17 μsec right-ear leading vs 27 μsec left-ear leading for normal owls), and the weighted average for R23 owls was shifted toward left-ear leading (58 μsec left-ear leading vs 27 μsec left-ear leading).
Fig. 6.

Summary of ITD representation by condition. Grand composite response curves constructed with data from all sites recorded in prism-reared owls. Gray curves are the grand composite ITD response curves for all normal owls for the corresponding sides of the brain (from Fig. 2C,D).A, Left AAr (normal owls, 61 sites from 5 AArs; L23 owls, 46 sites from 2 AArs; and R23 owls, 91 sites from 4 AArs).B, Right AAr (normal owls, 76 sites from 7 AArs; L23 owls, 25 sites from 2 AArs; and R23 owls, 84 sites from 5 AArs).
Shifts of the adaptive and nonadaptive flanks of ITD tuning curves
The observed shifts in the composite response curves of prism-reared owls could result from the acquisition of responses to adaptive ITD values, the elimination of responses to nonadaptive (previously normal) ITD values, or both. Inspection of composite response curves from individual owls (Figs. 3-5) and from all owls combined (Fig. 6) suggests that both processes were involved, although to different degrees. In nearly all cases, the shift appeared to be greater for the adaptive flank (the right-ear leading flank for owls raised with L23 spectacles; the left-ear leading flank for owls raised with R23 spectacles).
To quantify the relative shifts of the adaptive and nonadaptive flanks, we examined distributions of 50% ITD cutoff values for normal and prism-reared owls (Fig. 7). In each of the four prism-reared conditions (L23 spectacles, left AAr; L23 spectacles, right AAr; R23 spectacles, left AAr; and R23 spectacles, right AAr), the distribution of 50% cutoff values on the adaptive flank was shifted in the adaptive direction (Fig. 7A; two-tailed t test). For L23 owls, the distribution of right 50% cutoff values was shifted toward right-ear leading relative to normal on both the left (p < 0.0001) and right (p < 0.0001) sides of the brain (Fig.7A, striped bars). On the left side of the brain, the mean right 50% cutoff value was 94 μsec right-ear leading (SD = 47 μsec; n = 46 sites) compared with 45 μsec right-ear leading (SD = 41 μsec; n = 61 sites) in normal owls; on the right side of the brain, the mean right 50% cutoff value was 57 μsec right-ear leading (SD = 61 μsec;n = 25 sites) compared with 5 μsec right-ear leading (SD = 33 μsec; n = 76 sites) in normal owls. For R23 owls, the distribution of left 50% cutoff values was shifted toward left-ear leading relative to normal on the left (p = 0.006) and right (p< 0.0001) sides of the brain (Fig. 7A,cross-hatched bars). On the left side of the brain, the mean left 50% cutoff value was 40 μsec left-ear leading (SD = 60 μsec; n = 91 sites) compared with 16 μsec left-ear leading (SD = 38 μsec; n= 61 sites) in normal owls; on the right side of the brain, the mean left 50% cutoff value was 92 μsec left-ear leading (SD = 46 μsec; n = 84 sites) compared with 50 μsec left-ear leading (SD = 39 μsec; n = 76 sites) in normal owls. Averaged across all prism-reared conditions, the mean 50% cutoff value on the adaptive side was shifted 42 μsec in the adaptive direction.
Fig. 7.

Shifts of adaptive and nonadaptive flanks of ITD tuning curves. Bars indicate the mean 50% cutoff values of all ITD tuning curves recorded in the AAr of normal (gray bars), L23 (striped bars), and R23 owls (cross-hatched bars).A, The adaptive flank is the side of the ITD tuning curve in the adaptive direction (the left-ear leading flank for owls raised wearing R23 spectacles and the right-ear leading flank for owls raised wearing L23 spectacles). B, The nonadaptive flank is the side of the ITD tuning curve opposite to the adaptive direction (the right-ear leading flank for owls raised with L23 spectacles and the left-ear leading flank for owls raised with R23 spectacles). Error bars indicate SEM. Asterisks indicate conditions for which flanks in prism-reared owls were significantly different from normal.
For three of the four prism-reared conditions, the distribution of 50% cutoff values on the nonadaptive side of the tuning curve was also shifted in the adaptive direction (Fig. 7B; two-tailedt test). For L23 owls, the distribution of left 50% cutoff values was shifted toward right-ear leading relative to normal on the left (p = 0.0003) and right (p = 0.0002) sides of the brain (Fig.7B, striped bars). On the left side of the brain, the mean left 50% cutoff value was 13 μsec right-ear leading (SD = 43 μsec; n = 46 sites) compared with 16 μsec left-ear leading (SD = 38 μsec; n = 61 sites) in normal owls; on the right side of the brain, the mean left 50% cutoff value was 8 μsec left-ear leading (SD = 70 μsec;n = 25 sites) compared with 50 μsec left-ear leading (SD = 39 μsec; n = 76 sites) in normal owls. For R23 owls, the distribution of right 50% cutoff values was shifted toward left-ear leading relative to normal on the right side of the brain (Fig. 7B, cross-hatched bars; p = 0.0003). On the right side of the brain, the mean right 50% cutoff value was 17 μsec left-ear leading (SD = 41 μsec; n = 84 sites), compared with 5 μsec right-ear leading (SD = 33 μsec; n = 76 sites) in normal owls. On the left side of the brain, the distribution of 50% cutoff values was not significantly shifted relative to normal (p = 0.13). The mean right 50% cutoff value was 31 μsec right-ear leading (SD = 62 μsec; n = 91 sites) compared with 45 μsec right-ear leading (SD = 41 μsec; n = 61 sites) in normal owls. Averaged across all prism-reared conditions, the mean 50% cutoff value on the nonadaptive side was shifted 27 μsec in the adaptive direction.
The difference in the degree of shift observed for the adaptive and nonadaptive flanks of ITD tuning curves predicts that ITD-tuning widths in prism-reared owls were increased relative to normal. Indeed, tuning widths were significantly broader in prism-reared owls (Fig.8; Mann–Whitney U test,p < 0.0001). The median ITD tuning width in normal owls was 52 μsec (n = 137), and the median ITD tuning width in prism-reared owls was 71 μsec (n = 246).
Fig. 8.
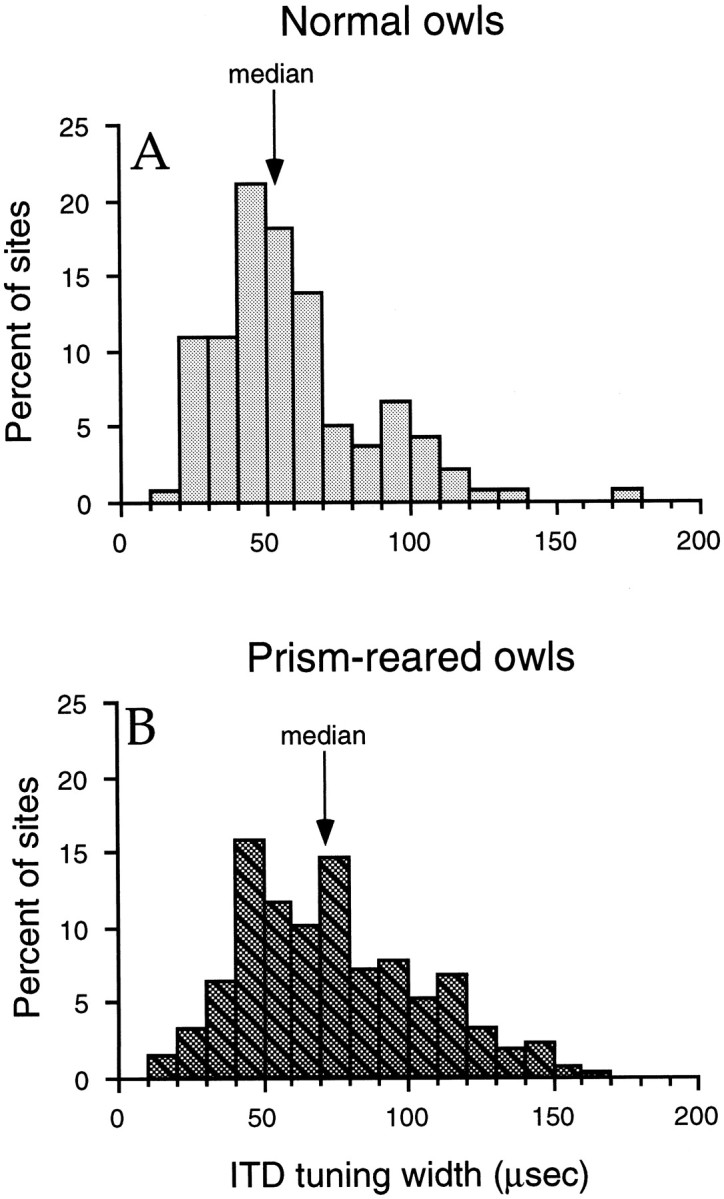
Distributions of ITD tuning widths in normal (A) and prism-reared (B) owls.
The representation of ILD in the AAr of prism-reared owls
For frequencies <4 kHz, ILD, like ITD, varies with sound source azimuth. For frequencies >4 kHz, however, ILDs vary primarily with sound source elevation (because of the asymmetrical orientation of the owl’s ears) and are the principal cues for elevational localization. Because the majority of sites in the AAr are tuned to frequencies >4 kHz (Cohen and Knudsen, 1995), we did not expect that the horizontally displacing spectacles used in this study would cause substantial changes in ILD tuning in the AAr.
Grand composite ILD response curves for the left and right AAr in normal and prism-reared owls are shown in Figure9. For owls raised wearing R23 spectacles, the grand composite ILD response curves on both sides of the brain were shifted toward left-ear greater ILDs relative to normal by 3 and 5 dB, respectively. No shift in ILD tuning was apparent in L23 owls.
Fig. 9.

Summary of ILD representation by condition. Grand composite response curves constructed with data from all sites recorded in prism-reared owls. Gray curves are the grand composite ILD response curves for all normal owls for the corresponding sides of the brain. A, Left AAr (normal owls, 41 sites from 4 AArs; L23 owls, 42 sites from 2 AArs; and R23 owls, 96 sites from 4 AArs). B, Right AAr (normal owls, 63 sites from 7 AArs; L23 owls, 26 sites from 2 AArs; and R23 owls, 85 sites from 5 AArs).
Analysis of the 50% cutoffs for ILD tuning curves was consistent with this trend (Fig. 10). For R23 owls, the distribution of left 50% cutoff values was significantly shifted toward left-ear greater on the right side of the brain (Fig.10A, cross-hatched bars; two-tailed ttest, p = 0.001; n = 85 sites from R23 owls; n = 63 sites from normal owls). No shift was observed on the left side of the brain (p = 0.13; n = 96 sites from R23 owls; n = 41 sites from normal owls). Distributions of right 50% cutoff values for R23 owls were significantly shifted toward left-ear greater on both the left (p = 0.0015; n = 85 sites from R23 owls; n = 63 sites from normal owls) and the right (p < 0.0001; n = 96 sites from R23 owls; n = 41 sites from normal owls) sides of the brain (Fig. 10B, cross-hatched bars). For L23 owls, there was no significant difference in the distributions of 50% cutoffs on either side of the brain (Fig. 10A,B, striped bars; left cutoff, left side of the brain: p = 0.89, n = 42 sites from L23 owls, n = 41 sites from normal owls; left cutoff, right side of the brain:p = 0.68, n = 26 sites from L23 owls,n = 63 sites from normal owls; right cutoff, left side of the brain: p = 0.34, n = 42 sites from L23 owls, n = 41 sites from normal owls; and right cutoff, right side of the brain: p = 0.42,n = 26 sites from L23 owls, n = 63 sites from normal owls).
Fig. 10.

Effect of prism rearing on the flanks of ILD tuning curves. Bars indicate the mean 50% cutoff values of all ILD tuning curves recorded in the AAr of normal (gray bars), L23 (striped bars), and R23 (cross-hatched bars) owls.A, Left-ear greater flanks. B, Right-ear greater flanks. Error bars indicate SEM. Asterisksindicate conditions for which flanks in the prism-reared owls were significantly different from those in normal owls.
DISCUSSION
These results demonstrate that the representation of auditory space in the barn owl forebrain is shaped by visual experience during early life. Raising owls with prismatic spectacles that displaced the visual field in the horizontal plane altered the ITD tuning of units in the AAr, an output structure of the forebrain space-processing pathway. Shifts in ITD tuning were dependent on the direction of optical displacement imposed by the spectacles and were in the direction appropriate to align the representation of auditory space with the owls’ optically displaced visual fields (Figs. 3-7).
The effect of prism rearing on ILD tuning in the AAr was less consistent. Some evidence of an ILD tuning shift toward left-ear greater values was observed for R23 owls, but no shift was apparent for L23 owls (Figs. 9, 10). We did not expect that the horizontally displacing spectacles used in this study would cause substantial changes in ILD tuning. The majority of sites in the AAr are tuned to frequencies >4 kHz (Cohen and Knudsen, 1995), for which ILDs do not vary substantially with sound source azimuth. The small effect of prism rearing on the representation of ILD could reflect shifts in ILD tuning at the minority of AAr sites that respond to frequencies <4 kHz. For frequencies <4 kHz, the spectacles used in this study altered the relationship between experienced ILD values and locations in the visual field. The changes in ILD tuning observed in the AAr of R23 owls were in the direction appropriate to compensate for this effect. Alternatively, shifts in ILD tuning could reflect the slight dependence of ILD on sound source azimuth for some higher frequencies (Olsen et al., 1989; Brainard et al., 1992). Our data cannot distinguish between these possibilities. Similar adaptive changes in ILD tuning in response to prism rearing have been described in the optic tectum (Brainard and Knudsen, 1993).
Limitations of the sampling technique
Because of the clustered organization of auditory space in the AAr, it was not possible to assess changes in binaural tuning caused by prism rearing at individual sites. Therefore, the argument that prism rearing shapes the representation of auditory space in the AAr must be based on changes in binaural tuning across a population of sites.
In principle, the observed differences in ITD tuning could result from a bias in the sampling of sites within the AAr. For several reasons, we believe that this is not likely to be the case. First, the sampling technique was designed to minimize the likelihood that samples of ITD tuning data recorded from individual AAr would be dominated by data from one or two clusters of similarly tuned sites: electrode penetrations were distributed throughout the extent of the AAr, and ITD tuning was assessed at sites that were separated by at least 150 μm along the dorsoventral axis and at least 250 μm along the rostrocaudal and mediolateral axes. Second, the sampling technique used in normal and prism-reared owls was identical. Finally, both leftward and rightward shifts in ITD tuning were observed on both sides of the brain in prism-reared owls, and these shifts were always in the direction that was adaptive for the experienced displacement of the visual field.
In these experiments, it was not possible to determine whether prism rearing affected different regions of the auditory space representation differently. In the optic tectum, spatial tuning is consistently altered only for sites that represent the region of space displaced by the prismatic spectacles (Knudsen et al., 1991). The tuning of sites that represent regions of space outside of the displaced zone is altered much less, if at all. If this is also the case in the AAr, then the analyses used here, which include sites representing regions of space outside the displaced zone, underestimate the magnitude of the adaptive shifts in ITD tuning in the AAr.
Inferred changes in ITD tuning at individual sites
The observed shifts in ITD tuning could reflect the acquisition of responses to adaptive ITD values, the elimination of responses to nonadaptive ITD values, or both. Our data suggest that both processes are involved, although to different degrees. In prism-reared owls, the adaptive flanks of ITD tuning curves, as indicated by 50% cutoff values, shifted 42 μsec in the adaptive direction on average, whereas the nonadaptive flanks shifted only 27 μsec. For each of the four prism-reared conditions, adaptive flanks shifted more than nonadaptive flanks (Fig. 7). The finding that ITD tuning widths were greater in prism-reared owls (Fig. 8) is consistent with the interpretation that, on average, sites in the AAr of prism-reared owls expanded the range of ITDs to which they responded in the adaptive direction more than they eliminated responses to ITDs in the nonadaptive direction.
Adaptive nature of observed plasticity
Adaptive adjustments of auditory space coding occurred in the presence of essentially normal auditory experience: prism rearing changed the relationships between specific cue values and locations in the visual field, but did not alter the range of cue values experienced. This finding is consistent with the proposed involvement of the AAr in gaze control (Knudsen et al., 1995; Knudsen and Knudsen 1996a,b). If the role of the AAr is to direct the owl’s gaze to the location of sound sources, then accurate association of cue values with locations in visual space is critical. The ability to make visually based adjustments of binaural tuning may be necessary to ensure the accuracy of orienting behaviors mediated by the AAr.
Comparison to experience-dependent plasticity in the midbrain
Prism rearing causes adaptive changes in unit tuning for ITD in the midbrain space-processing pathway of the barn owl (Brainard and Knudsen, 1993). Adaptive ITD tuning shifts were also observed in the optic tecta of the owls used in this study. Thus, both forebrain and midbrain representations of ITD were shifted in the adaptive direction in these owls. Because the global organization of auditory space in the midbrain and forebrain is fundamentally different, however, it is not possible to compare quantitatively the relative magnitudes of ITD tuning shifts in the two pathways. Nonetheless, the observation that prism rearing caused qualitatively similar adaptive changes in the representation of ITD in the optic tectum and the AAr suggests that the midbrain and forebrain representations of auditory space may be kept in mutual register. Parallel adjustment of the two pathways may help to ensure the consistency of spatially guided behaviors that involve contributions from both the midbrain and forebrain.
Implications for site of plasticity
The representation of auditory space in the AAr is derived independently of input from auditory space maps in the midbrain. Bilateral ablation of the external nucleus of the inferior colliculus (ICX), the structure where the midbrain map of auditory space is first synthesized, does not alter binaural tuning in the AAr (Cohen et al., 1998). Thus, the ICX, which is the primary site of plasticity in the midbrain space-processing pathway (Brainard and Knudsen, 1993), is not likely to be the site of the plasticity underlying the modification of ITD tuning in the AAr of prism-reared owls. Experience-dependent adjustment of ITD tuning could occur in the AAr itself or at any previous stage in the ascending pathway from the central nucleus of the inferior colliculus to the AAr.
Comparison to other models of experience-dependent plasticity in the auditory forebrain
Many previous studies of experience-dependent plasticity in the auditory forebrain have focused on changes in frequency tuning or tonotopic organization in the primary auditory cortex that are induced by deprivation of afferent input or by behavioral training in adult animals (e.g., Bakin and Weinberger, 1990; Edeline and Weinberger, 1993; Kilgard and Merzenich, 1998). Our results differ from these experimental models in that they demonstrate plasticity in the representation of a high-order stimulus parameter that is not represented at the level of the sensory epithelium. In addition, plasticity in the AAr may be developmentally regulated: prism rearing only alters sound localization behavior during a sensitive period early in life (which ends at ∼200 d), and the capacity for adaptive adjustments of ITD tuning in the optic tectum is limited to a similar sensitive period (Brainard and Knudsen, 1998).
Another excellent example of developmental, experience-dependent plasticity in the representation of high-order stimulus parameters in the auditory forebrain is the emergence of song-selective neurons in the forebrain of songbirds (Margoliash, 1983; Volman, 1993; Doupe, 1997). Similar plasticity may also be critical for the development of call-specific neurons in monkey auditory cortex (Rauschecker et al., 1995; Wang et al., 1995). The current results, along with these models, demonstrate the influence of early sensory experience on the representation of complex, behaviorally relevant auditory stimulus parameters in the forebrain. Experience-dependent shaping of the neural representations of such complex features is likely to play an important role in the development of many forebrain pathways.
Footnotes
This work was supported by National Research Service Award MH11238 to G.L.M., by the National Institute on Deafness and Other Communication Disorders, National Institutes of Health Grant R01 DC00155–188, and by a McKnight Senior Investigator Award to E.I.K. We are grateful to Yale E. Cohen and members of the Knudsen laboratory for thoughtful comments on an earlier version of this manuscript.
Correspondence should be addressed to Greg L. Miller, Department of Neurobiology, Fairchild Building, Stanford University School of Medicine, Stanford, CA 94305.
REFERENCES
- 1.Bakin JS, Weinberger NM. Classical conditioning induces CS-specific receptive field plasticity in the auditory cortex of the guinea pig. Brain Res. 1990;536:271–286. doi: 10.1016/0006-8993(90)90035-a. [DOI] [PubMed] [Google Scholar]
- 2.Brainard MS. Neural substrates of sound localization. Curr Opin Neurobiol. 1994;4:557–562. doi: 10.1016/0959-4388(94)90057-4. [DOI] [PubMed] [Google Scholar]
- 3.Brainard MS, Knudsen EI. Experience-dependent plasticity in the inferior colliculus: a site for visual calibration of the neural representation of auditory space in the barn owl. J Neurosci. 1993;13:4589–4608. doi: 10.1523/JNEUROSCI.13-11-04589.1993. [DOI] [PMC free article] [PubMed] [Google Scholar]
- 4.Brainard MS, Knudsen EI. Sensitive periods for visual calibration of the auditory space map in the barn owl optic tectum. J Neurosci. 1998;18:3929–3942. doi: 10.1523/JNEUROSCI.18-10-03929.1998. [DOI] [PMC free article] [PubMed] [Google Scholar]
- 5.Brainard MS, Knudsen EI, Esterly SD. Neural derivation of sound source location: resolution of spatial ambiguity in binaural cues. J Acoust Soc Am. 1992;91:1015–1027. doi: 10.1121/1.402627. [DOI] [PubMed] [Google Scholar]
- 6.Clarey JC, Barone P, Imig TJ. Physiology of thalamus and cortex. In: Popper AN, Fay RR, editors. The mammalian auditory pathway: neurophysiology. Springer; New York: 1992. pp. 232–334. [Google Scholar]
- 7.Cohen YE, Knudsen EI. Binaural tuning of auditory units in the forebrain archistriatal gaze fields of the barn owl: local organization but no space map. J Neurosci. 1995;15:5152–5168. doi: 10.1523/JNEUROSCI.15-07-05152.1995. [DOI] [PMC free article] [PubMed] [Google Scholar]
- 8.Cohen YE, Miller GL, Knudsen EI. Forebrain pathway for auditory space processing in the barn owl. J Neurophysiol. 1998;79:891–902. doi: 10.1152/jn.1998.79.2.891. [DOI] [PubMed] [Google Scholar]
- 9.Doupe AJ. Song- and order-selective neurons in the songbird anterior forebrain and their emergence during vocal development. J Neurosci. 1997;17:1147–1167. doi: 10.1523/JNEUROSCI.17-03-01147.1997. [DOI] [PMC free article] [PubMed] [Google Scholar]
- 10.Edeline JM, Weinberger NM. Receptive field plasticity in the auditory cortex during frequency discrimination training: selective retuning independent of task difficulty. Behav Neurosci. 1993;107:82–103. doi: 10.1037//0735-7044.107.1.82. [DOI] [PubMed] [Google Scholar]
- 11.Heffner H, Heffner RS. Effect of bilateral auditory cortex lesions on sound localization in Japanese macaques. J Neurophysiol. 1990;64:915–931. doi: 10.1152/jn.1990.64.3.915. [DOI] [PubMed] [Google Scholar]
- 12.Heffner H, Masterton B. Contribution of auditory cortex to sound localization in the monkey (Macaca mulatta). J Neurophysiol. 1975;38:1340–1358. doi: 10.1152/jn.1975.38.6.1340. [DOI] [PubMed] [Google Scholar]
- 13.Jenkins WM, Merzenich MM. Role of cat primary auditory cortex for sound-localization behavior. J Neurophysiol. 1984;52:819–847. doi: 10.1152/jn.1984.52.5.819. [DOI] [PubMed] [Google Scholar]
- 14.Kilgard MP, Merzenich MM. Cortical map reorganization enabled by nucleus basalis activity. Science. 1998;279:1714–1718. doi: 10.1126/science.279.5357.1714. [DOI] [PubMed] [Google Scholar]
- 15.King AJ, Carlile S. Changes induced in the representation of auditory space in the superior colliculus by rearing ferrets with binocular eyelid suture. Exp Brain Res. 1993;94:444–455. doi: 10.1007/BF00230202. [DOI] [PubMed] [Google Scholar]
- 16.King AJ, Hutchings ME, Moore DR, Blakemore C. Developmental plasticity in the visual and auditory representations in the mammalian superior colliculus. Nature. 1988;332:73–76. doi: 10.1038/332073a0. [DOI] [PubMed] [Google Scholar]
- 17.Knudsen EI. Early auditory experience aligns the auditory map of space in the optic tectum of the barn owl. Science. 1983;222:939–942. doi: 10.1126/science.6635667. [DOI] [PubMed] [Google Scholar]
- 18.Knudsen EI. Early blindness results in a degraded auditory map of space in the owl’s optic tectum. Proc Natl Acad Sci USA. 1988;85:6211–6214. doi: 10.1073/pnas.85.16.6211. [DOI] [PMC free article] [PubMed] [Google Scholar]
- 19.Knudsen EI, Brainard MS. Visual instruction of the neural map of auditory space in the developing optic tectum. Science. 1991;253:85–87. doi: 10.1126/science.2063209. [DOI] [PubMed] [Google Scholar]
- 20.Knudsen EI, Knudsen PF. Vision calibrates sound localization in developing barn owls. J Neurosci. 1989;9:3306–3313. doi: 10.1523/JNEUROSCI.09-09-03306.1989. [DOI] [PMC free article] [PubMed] [Google Scholar]
- 21.Knudsen EI, Knudsen PF. Disruption of auditory spatial working memory by inactivation of the forebrain archistriatum in barn owls. Nature. 1996a;383:428–431. doi: 10.1038/383428a0. [DOI] [PubMed] [Google Scholar]
- 22.Knudsen EI, Knudsen PF. Contribution of the forebrain archistriatal gaze fields to auditory orienting behavior in the barn owl. Exp Brain Res. 1996b;108:23–32. doi: 10.1007/BF00242901. [DOI] [PubMed] [Google Scholar]
- 23.Knudsen EI, Knudsen PF, Esterly SD. Early auditory experience modifies sound localization in barn owls. Nature. 1982;295:238–240. [Google Scholar]
- 24.Knudsen EI, Esterly SD, Knudsen PF. Monaural occlusion alters sound localization during a sensitive period in the barn owl. J Neurosci. 1984;4:1001–1011. doi: 10.1523/JNEUROSCI.04-04-01001.1984. [DOI] [PMC free article] [PubMed] [Google Scholar]
- 25.Knudsen EI, Esterly SD, du Lac S. Stretched and upside-down maps of auditory space in the optic tectum of blind-reared owls: acoustic basis and behavioral correlates. J Neurosci. 1991;11:1727–1747. doi: 10.1523/JNEUROSCI.11-06-01727.1991. [DOI] [PMC free article] [PubMed] [Google Scholar]
- 26.Knudsen EI, Cohen YE, Masino T. Characterization of a forebrain gaze field in the archistriatum of the barn owl: microstimulation and anatomical connections. J Neurosci. 1995;15:5139–5151. doi: 10.1523/JNEUROSCI.15-07-05139.1995. [DOI] [PMC free article] [PubMed] [Google Scholar]
- 27.Margoliash D. Acoustic parameters underlying the responses of song-specific neurons in the white-crowned sparrow. J Neurosci. 1983;3:1039–1057. doi: 10.1523/JNEUROSCI.03-05-01039.1983. [DOI] [PMC free article] [PubMed] [Google Scholar]
- 28.Mogdans J, Knudsen EI. Early monaural occlusion alters the neural map of interaural level difference in the inferior colliculus of the barn owl. Brain Res. 1993;619:29–38. doi: 10.1016/0006-8993(93)91593-h. [DOI] [PubMed] [Google Scholar]
- 29.Moiseff A, Konishi M. Neuronal and behavioral sensitivity to binaural time differences in the owl. J Neurosci. 1981;1:40–48. doi: 10.1523/JNEUROSCI.01-01-00040.1981. [DOI] [PMC free article] [PubMed] [Google Scholar]
- 30.Olsen JF, Knudsen EI, Esterly SD. Neural maps of interaural time and intensity differences in the optic tectum of the barn owl. J Neurosci. 1989;9:2591–2605. doi: 10.1523/JNEUROSCI.09-07-02591.1989. [DOI] [PMC free article] [PubMed] [Google Scholar]
- 31.Rauschecker JP, Tian B, Haurser M. Processing of complex sounds in the macaque nonprimary auditory cortex. Science. 1995;268:111–114. doi: 10.1126/science.7701330. [DOI] [PubMed] [Google Scholar]
- 32.Ravizza R, Diamond IT. Role of auditory cortex in sound localization: a comparative ablation study of hedgehog and bushbaby. Fed Proc. 1974;33:1917–1919. [PubMed] [Google Scholar]
- 33.Volman SF. Development of neural selectivity for birdsong during vocal learning. J Neurosci. 1993;13:4737–4747. doi: 10.1523/JNEUROSCI.13-11-04737.1993. [DOI] [PMC free article] [PubMed] [Google Scholar]
- 34.Wang X, Merzenich M, Beitel R, Schreiner C. Representation of a species-specific vocalization in the primary auditory cortex of the common marmoset: temporal and spectral characteristics. J Neurophysiol. 1995;74:2685–2706. doi: 10.1152/jn.1995.74.6.2685. [DOI] [PubMed] [Google Scholar]
- 35.Withington DJ. The effect of binocular lid suture on auditory responses in the guinea-pig superior colliculus. Neurosci Lett. 1992;136:153–156. doi: 10.1016/0304-3940(92)90037-8. [DOI] [PubMed] [Google Scholar]