

Abstract
Pyramidal cells in the dorsal cochlear nucleus (DCN) show three distinct temporal discharge patterns in response to sound: “pauser,” “buildup,” and “chopper.” Similar discharge patterns are seen in vitro and depend on the voltage from which the cell is depolarized. It has been proposed that an inactivating A-type K+ current (IKI) might play a critical role in generating the three different patterns. In this study we examined the characteristics of transient currents in DCN pyramidal cells to evaluate this hypothesis. Morphologically identified pyramidal cells in rat brain slices (P11–P17) exhibited the three voltage-dependent discharge patterns. Two inactivating currents were present in outside-out patches from pyramidal cells: a rapidly inactivating (IKIF, τ ∼11 msec) current insensitive to block by tetraethylammonium (TEA) and variably blocked by 4-aminopyridine (4-AP) with half-inactivation near −85 mV, and a slowly inactivating TEA- and 4-AP-sensitive current (IKIS, τ ∼145 msec) with half-inactivation near −35 mV. Recovery from inactivation at 34°C was described by a single exponential with a time constant of 10–30 msec, similar to the rate at which first spike latency increases with the duration of a hyperpolarizing prepulse. Acutely isolated cells also possessed a rapidly activating (<1 msec at 22°C) transient current that activated near −45 mV and showed half-inactivation near −80 mV. A model demonstrated that the deinactivation ofIKIF was correlated with the discharge patterns. Overall, the properties of the fast inactivating K+ current were consistent with their proposed role in shaping the discharge pattern of DCN pyramidal cells.
Keywords: hearing, auditory system, cochlear nucleus, transient potassium currents, potassium channels, voltage-clamp, intrinsic discharge patterns, inactivation, outside-out patches
The intrinsic electrical properties of cochlear nucleus neurons are allied closely with their roles in sensory information processing. In the dorsal cochlear nucleus (DCN) the principal neurons respond to acoustic stimulation with three temporal firing patterns that have been termed “chopper,” “pauser,” and “buildup” (Pfeiffer, 1966; Godfrey et al., 1975;Rhode et al., 1983). Although the precise functional significance of these different patterns remains unclear, it has been shown that the patterns depend on the membrane potential of the cell just before excitation (Rhode et al., 1983; Manis, 1990). We previously proposed (Manis, 1990) that a transient A-type K+ current (IKI) (Connor and Stevens, 1971) could account for the voltage dependence of the different discharge patterns. Subsequent modeling studies (Kim et al., 1994; Hewitt and Meddis, 1995) have confirmed that the presence of a transient K+current is sufficient to generate these discharge patterns. Although currents sensitive to the blockers of noninactivating and inactivating K+ channels [tetraethylammonium (TEA) and 4-aminopyridine (4-AP)] appear to be present in DCN pyramidal cells (Hirsch and Oertel, 1988; Agar et al., 1997), direct experimental evidence for IKI in these cells is lacking.
In the present study we sought experimental evidence for the existence of IKI in DCN pyramidal cells. ForIKI to participate in the generation of the different discharge patterns in DCN pyramidal cells, the channels must activate and inactivate over appropriate voltage ranges as well as have the appropriate time courses for activation, inactivation, and recovery from inactivation. However, IKI currents examined in other neuronal preparations exhibit a wide range of kinetic behaviors. Activation may begin anywhere between −80 and −10 mV, although the range of inactivation can lie as far as 60 mV negative to the activation threshold (Solc et al., 1987; Bossu et al., 1988; Rudy, 1988; Rudy et al., 1991; Schroter et al., 1991; Rizzo and Nonner, 1992;Vega-Saenz de Miera et al., 1992; Wu and Barish, 1992). The variable behavior of these currents presumably reflects a diversity ofIKI channel structures, including the specific assembly of α and β subunits, as well as the phosphorylation or redox state of the channels (Ruppersberg et al., 1991; Duprat et al., 1995; Stephens et al., 1996). Because the discharge patterns of cells depend critically on the voltage dependence of ion channels, we sought to determine the voltage dependence of potassium conductances in DCN pyramidal cells.
We recorded from morphologically and physiologically identified pyramidal cells in DCN slices and confirmed their intrinsic discharge patterns by using whole-cell recording. To investigate the properties of IKI in DCN pyramidal cells, we obtained voltage-clamp recordings from two different preparations. First, we pulled outside-out patches from the somata of morphologically identified pyramidal cells in slices. Second, we obtained whole-cell recordings from large (diameter, >20 μm) acutely isolated cells from rat DCN, which we presumed were pyramidal cells. The results of these experiments show that DCN pyramidal cells in neonatal rats express a fast A-type current with kinetic properties appropriate to support their voltage-dependent firing patterns.
MATERIALS AND METHODS
Slice preparation. Sprague Dawley rat pups (aged P11–P17; n = 52) were anesthetized deeply with ketamine (44 mg/kg) and decapitated with a guillotine. The auditory nerves were transected, and the brainstem was removed rapidly from the skull. The brainstem was washed in ice-cold dissection solution (HEPES-low Cl−; see below for solution composition). The cochlear nucleus and the adjacent brainstem were isolated with scissors, and slices 250 μm thick were cut in the trans-strial plane (Blackstad et al., 1984; Manis, 1990). The slices were incubated at 31°C for 1–2 hr in a HEPES-buffered recording solution. Slices were transferred to a recording chamber on a fixed stage microscope (Zeiss Axioskop FS, Oberkochen, Germany). In the recording chamber the slice was held in place by a net and superfused (3–5 ml/min) with the incubation/recording solution at 31–33°C. Some early experiments used a normal Cl− dissection solution and a bicarbonate-buffered incubation and recording solution. No differences were evident in currents recorded from cells in these slices versus those prepared as described above.
After an initial characterization of the cell, different pharmacological agents were added alone or in combination to the recording bath: TTX (0.5 μm), Cd2+(100–200 μm), Cs+ (2 mm), tetraethylammonium chloride (TEA; 10 mm), or 4-aminopyridine (4-AP; 0.5–2 mm).
Isolated cell preparation. DCN slices were prepared as described above. Then each DCN was cut into two to three pieces with fine scissors, transferred to an incubation chamber, and incubated at 37°C for 10–15 min with 3 mg/ml Protease XXIII (Sigma, St. Louis, MO) in HEPES-buffered solution with low Ca2+. Then the tissue was transferred to the incubation solution (HEPES-low Cl−), which was supplemented with 1 mg/ml trypsin inhibitor (Sigma) and 0.5 mg/ml bovine serum albumin. Tissue chunks were kept at room temperature and were oxygenated continuously with 100% O2. Immediately before recording, a single tissue piece was triturated gently through a series of three or four fire-polished Pasteur pipettes with gradually decreasing diameters. The dispersed cells were plated on 35 mm culture dishes (Corning, Corning, NY) coated with 10 μg/ml poly-d-lysine (Life Technologies, Gaithersburg, MD) to promote adherence and were placed on the stage of a Zeiss IM-35 microscope equipped with Hoffman optics. The cells were allowed to sit undisturbed for 10–15 min before a continuous flow (∼0.5 ml/min) of the HEPES-buffered recording solution was established. Inward sodium and calcium currents were blocked by adding TTX (0.5 μm) and Cd2+ (100–200 μm) to the recording solution. The pharmacology of the outward currents was analyzed by adding 4-AP (1 mm) and/or TEA (20 mm) in addition to the TTX and Cd2+.
Solutions. The HEPES-low Cl− dissection solution contained (in mm): 82 Na2SO4, 30 K2SO4, 10 HEPES (free acid), 10 glucose, 4.8 MgCl2, 0.2 CaCl2, and 1 kynurenic acid (pH-adjusted to 7.35 with NaOH and equilibrated with 100% O2). The HEPES-buffered recording solution contained (in mm): 130 NaCl, 5 KCl, 10 HEPES, 25 glucose, 1.3 MgCl2, and 2.5 CaCl2(pH-adjusted to 7.35 with NaOH and equilibrated with 100% O2). The bicarbonate-buffered solution contained (in mm): 130 NaCl, 3 KCl, 1.25 KH2PO4, 20 NaHCO3, 10 glucose, 1.3 MgSO4, and 2.5 CaCl2, pH 7.35–7.4 (equilibrated with 95%O2/5% CO2). The HEPES-buffered dissection solution consisted of (in mm): 138 NaCl, 5 KCl, 1.25 KH2PO4, 10 HEPES, 10 glucose, 4 MgSO4, 0.2 CaCl2, and 1 kynurenic acid (pH-adjusted to 7.35 with NaOH and equilibrated with 100% O2). The low-Ca2+HEPES-buffered solution used for the isolated cell incubation consisted of (in mm): 130 NaCl, 5 KCl, 10 HEPES, 25 glucose, 4 MgCl2, and 0.2 CaCl2 (pH-adjusted to 7.35 with NaOH and equilibrated with 100% O2). All chemicals were obtained from Sigma and Aldrich (Milwaukee, WI), except for kynurenic acid, which was obtained from Tocris Cookson (St. Louis, MO).
Recording. Electrodes were pulled from 1.5 mm KG33 glass (Garner Glass, Claremont, CA) on a BB-CH-PC puller (Mecenex, Geneva, Switzerland), fire-polished, and coated with Sylgard (Dow Corning 184, Midland, MI). Electrodes had a final resistance in the recording bath of 3–9 MΩ. The recording electrode contained (in mm): 100 K-gluconate, 4 NaCl, 20 KCl, 0.2 CaCl2, 10 HEPES (free acid), 1.1 EGTA, 2 Mg-ATP, 1 MgCl2, and 5 glutathione [to reduce oxidation (Ruppersberg et al., 1991)]; the pH was adjusted to 7.2 with KOH. The final osmolarity was ∼300 mOsm. In slice experiments we routinely added Lucifer yellow (K-salt, ∼1 mg/ml; Molecular Probes, Eugene, OR) to the electrode solution for cell visualization. Current-clamp recordings from cells in slices and voltage-clamp recordings from patches were all made with an EPC-7 (List-Electronic, Darmstadt-Eberstadt, Germany). After whole-cell recording in slices, somatic outside-out patches were pulled by slowly retracting the electrode from the cell. A large increase in the input resistance and a decrease in the capacitance indicated the formation of a patch. Whole-cell tight-seal voltage-clamp recordings from isolated cells were made with an Axopatch 200 (Axon Instruments, Foster City, CA). Data were acquired under computer control with a custom program, DATAC (Bertrand and Bader, 1986). Data were digitized by a 12-bit analog-to-digital converter (Digidata 1200, Axon Instruments) at 5–10 kHz and filtered at 2–5 kHz. In whole-cell voltage-clamp recordings we electronically compensated for 70–90% of the electrode series resistance. All voltages also were adjusted for an estimated electrode bath junction potential of −12 mV by off-line subtraction.
Determination of morphology. Recordings in slice preparation were made from cells in layer 2 that, when viewed with infrared differential interference contrast optics, appeared to be pyramidal cells (Fig. 1A). The cells had a large and distinctive fusiform-shaped soma (25- to 35-μm-long axis; Fig. 1A). These cells were filled with Lucifer yellow and examined under fluorescence (450 nm excitation) immediately after recording. Images were captured at 10 bits/pixel with a CCD camera (Cohu, San Diego, CA), an Image Lightening board, and Axon Imaging Workbench imaging software (versions 2.0 and 2.1, Axon Instruments). Then the cells were reconstructed by cutting and pasting from successive focal planes. Figure 1B (showing the same cell as in Fig. 1A) illustrates that these cells possessed highly branched, spiny apical dendritic trees that terminated near the surface of the DCN and sparsely branched, less spiny, basal dendrites that reached into the deep layer of the DCN. These cells clearly correspond to the class of large principal neurons of the DCN called pyramidal or fusiform cells (Brawer et al., 1974;Blackstad et al., 1984; Ryugo and Willard, 1985; Manis et al., 1994).
Fig. 1.

Appearance and identification of dorsal cochlear nucleus (DCN) pyramidal cells in rat pup brain slice preparation (A, B) and acutely isolated cells (C). A, Infrared differential interference contrast images of cell with patch pipette (P) attached. Scale bar, 25 μm.B, Montages of cell in A after being filled with Lucifer yellow from the patch pipette. Approximate positions of the layers are shown. The cell is a pyramidal cell with apical and basal dendritic trees. Scale bar, 25 μm. C, Pictures of two acutely isolated neurons from rat DCN. Many of the larger cells had morphology reminiscent of DCN pyramidal cells. Scale bars, 70 μm. Hoffman optics, 40× objective.
Although pyramidal cells could not be identified unambiguously in the isolated cell preparation, we selected cells that appeared to be pyramidal neurons for recording. Selected cells were large (>20 μm in length) and fusiform-shaped and showed smooth membranes (see Fig.1C); many of these cells also had short remnants of dendritic or axonal processes.
Data analysis and modeling. Digitized data were analyzed by MATLAB (Version 5.2, The Mathworks, Natick, MA) on a Power Macintosh (Apple, Cupertino, CA) and by Origin (Versions 5.0, MicroCal Software, Cambridge, MA) on a PC. In voltage-clamp recordings the leak correction was performed off-line by estimating the linear resistance during hyperpolarizing steps between −65 and −90 mV and subtracting the corresponding current. The averaged and normalized capacitance transients also were subtracted from each record. All of the data presented in the figures have been corrected for leak conductance and capacitance transients.
Inactivating and noninactivating K+ currentsIKI and IKNI were assumed to obey the standard formulation (Hodgkin and Huxley, 1952; Connor et al., 1977):
| Equation 1 |
| Equation 2 |
The functions m, h, and nrepresent gating functions, where m and n are the activation gates, h is the inactivation gate,kI and kNI reflect the effects of cooperativity between subunits during channel activation,gI and gNI are the maximal conductances, and Ek is the potassium reversal potential. The gating functionsx(V,t) are described by the differential equation:
| Equation 3 |
where τ(V) is the time constant andx∞(V) is the steady-state value given by:
| Equation 4 |
where V0.5 (mV) is the membrane potential for half-activation or half-inactivation, z is the equivalent number of gating charges, and F/RT is the temperature factor (F/RT = 0.04 mV−1 at 22°C; F/RT = 0.038 mV−1 at 34°C). The step response of the gating function is given by the solution of Equation 3:
| Equation 5 |
where x0(V) isx(V) at t = 0.
Then the currents were analyzed with the above model. Activation of the peak or steady-state currents was analyzed with a gating model based on the Boltzmann function, translated into the current domain:
| Equation 6 |
where I is the membrane current (pA) at the command voltage, V is the command voltage (mV),Vr is the reversal potential for the current (mV), Gmax is the maximal conductance (nS), andV0.5, z, and F/RTare as defined in Equation 4. This modified form of the Boltzmann function was used because it avoids the singularity that occurs atV = Vr in the standard formulation if the measured current is transformed first into a conductance (G = I/(V −Vr)). In the fits,Vr was held constant at the equilibrium potential for potassium (−81.5 mV, as calculated), whereas parametersGmax, V0.5, and z were allowed to vary. To analyze steady-state inactivation, we fit the currents to the following normalized Boltzmann function:
| Equation 7 |
where I(V) is the membrane current (pA) at the command voltage, Imax is the maximal current (pA) to the step (usually 0 mV) measured after a long (80–100 msec) control prepulse to approximately −110 mV, Vis the voltage of the prepulse (mV), andV0.5, z, and F/RTare as defined in Equation 4. Only the parametersV0.5 and z were allowed to vary during the fits. During data acquisition the control and test trials were interleaved. During fitting, Imax was fixed to the average current of the control trials and was not allowed to vary.
The time course of IKI in isolated cells showed a sigmoidal rise and a single-exponential decay that could be described by a function of the form (Connor et al., 1977):
| Equation 8 |
where τactiv(V) and τinact(V) describe the activation and inactivation time constants as a function of voltage, and krepresents the cooperativity of channel subunits. The fit was done in two steps. First, the data at different voltages were fit by unconstrained functions of the type described by Equation 8. Then the average value of k across all voltages was calculated, and the data were refit with k fixed at the average value. This procedure assumes that the formal kinetic descriptions of channel activation and inactivation are not voltage-dependent.
Modeling. Activation of the different K+conductances during normal cell activity was evaluated by using a computational model. This model represented a patch of membrane, and we used the kinetic description derived from our patch data for the fast and the slow transient currents, assuming that the activation and inactivation time constants showed no voltage dependence. In the model we first solved Equation 3 for the gating parameters of the twoIKI, using fourth-order Runge–Kutta integration and then evaluating the open probability (Po =mkh) of the channels. The trajectory of V was the experimentally recorded membrane voltage of a neuron during different patterns of current injection.
The currents were assumed to obey the formm4h; to obtain appropriate parameters, we fit the peak current activation functions (m∞) in patches by using a single Boltzmann raised to the fourth power. The resulting changes in the activation (m) and inactivation (h) gating functions of the two transient channels were monitored, and the fraction of open (Po =m4h) channels was plotted as a function of time. The model was implemented in C++ (Codewarrior 11, Metrowerks, Austin, TX) and executed as a MEX-file under MATLAB (Version 5.2) on a Power Macintosh (Apple).
RESULTS
For a transient current to participate in the voltage-dependent discharge patterns of pyramidal cells, it must meet five criteria. First, the channels must begin to activate at or just above the resting potential. Second, the channels must show changes in steady-state inactivation over a voltage range consistent with the range of voltages that modify the first spike latency (FSL) or first interspike interval (FISI). Third, the time constant of inactivation should be of the same order of magnitude as the rise in the membrane potential leading to the first spike or during the first interspike interval. Fourth, the kinetics of the recovery from inactivation of the conductance should match approximately the duration of hyperpolarizing pulses necessary to cause transitions in the firing patterns of the cells. Fifth, there must be a sufficient amount of transient current present to oppose the depolarization. We examined these criteria by using current-clamp and voltage-clamp measurements on DCN pyramidal cells.
Discharge properties of DCN cells in slices
Because previous descriptions of the discharge patterns of DCN pyramidal cells were obtained from adult guinea pig, we first confirmed that the voltage-dependent discharge patterns of DCN neurons were present in young (11- to 17-d-old) rat pups. Recordings were made from 50 cells in slices, 22 of which were filled with Lucifer yellow and subsequently identified as pyramidal cells (although the remaining cells were not filled with Lucifer yellow, they appeared to be pyramidal cells on the basis of their location and appearance in infrared differential interference contrast optics).
Neonatal rat pyramidal cells showed the characteristic temporal firing patterns described previously for guinea pigs (Manis, 1990). Depolarization from the resting potential (−58.6 ± 6.4 mV;n = 26) generated trains of regularly spaced action potentials, although sometimes there was a short delay to the first spike. When the cells were hyperpolarized before depolarization, they responded with a delayed spike train (“buildup” response pattern) and a characteristic “hump and sag” combination during the delay (arrow in Fig.2A1). The slow depolarization of the membrane potential toward firing threshold was accompanied frequently by subthreshold oscillations (arrow in Fig. 2A1). The FSL increased as the prepulse was made more hyperpolarized (Fig.2A3). The shift in FSL occurred when the prepulse placed the membrane potential between −60 and −90 mV for most cells (Fig. 2A3; see also Fig. 7). To provide a quantitative estimate of the voltage range, we fit Boltzmann functions to the FSL as a function of voltage, and then the voltages corresponding to 20 and 80% of the latency shift were calculated from the Boltzmann fits. These points fell at −67.7 ± 6.7 to −87.0 ± 12.6 mV, respectively (n = 23). The voltage range over which the most of the shift occurs can be estimated by the difference of the 80 and 20% voltages. The mean voltage range was 19.4 ± 10.0 mV. Note that, for the cell in Figure 2A3, the FSL showed a pronounced shift (open circles) with the prepulse voltage whereas the FISI remained nearly constant (filled triangles).
Fig. 2.

Discharge patterns of rat DCN pyramidal cells and voltage dependence of first spike latency and first interspike intervals. A1, Superimposed responses to a constant depolarizing current step after a 50 msec hyperpolarization to different levels. The current injection protocol is shown in A2; the dashed line indicates the zero current level. An arrowpoints to subthreshold events.A3, The first spike latency (open circles) increases with increasing hyperpolarization between −60 and −90 mV, whereas the first interspike interval (filled triangles) is nearly constant. This cell shows the buildup discharge pattern. Theline through the first spike latency data is a Boltzmann fit, with the half-inactivation parameters shown.B1,B2, Another cell showing a short latency first spike and long first interspike intervals (pauser).B3, The first interspike interval (filled triangles) increases as the amplitude of the prehyperpolarizing pulse increases; the data are fit with a Boltzmann function, with the half-inactivation parameters shown. The first spike latency (open circles) shows a slight increase with prehyperpolarization according to the additional time needed to charge the membrane.C1,C2, Another cell showing a transition from chopper to pauser to buildup pattern.C3, As the amplitude of the prehyperpolarizing pulse increases from a depolarized level to −65 mV, the first interspike interval (filled triangles) increases, changing the firing pattern from chopper to pauser. At this point a further increase in prehyperpolarization causes the disappearance of the short latency onset spike and thus an increase in first spike latency to a value that corresponds to the sum of first spike latency and first interspike interval before the shift. The first interspike interval is reduced to the value of the subsequent interspike intervals. The cell is now a buildup. Stronger hyperpolarization further increases the first spike latency.
Fig. 7.

Comparison of the 20th (A) and 80th (B) percentile of inactivation of the transient current and of the changes in first spike latency (for buildup pattern) or first interspike interval (for pauser pattern). Note that the range of inactivation of IKIFoverlaps the voltage ranges for the pauser and buildup patterns, whereas the IKIS current inactivates in a more depolarized range. The data are plotted with box plots. Thevertical lines of the box represent the 25th, 50th, and 75th percentile values. The square symbol in the box denotes the mean of the data. The extended error bars indicate the 5th and 95th percentile values.
When larger depolarizing currents were applied, some cells responded with a short latency spike, followed by a long FISI and a late regular discharge (Fig. 2B1), corresponding to a “pauser” response pattern. When cells fired with this pattern, the duration of the FISI usually depended on the level of the prepulse. Figure 2B3 shows that, as the voltage measured at the end of the hyperpolarizing current step became more negative, the FISI became longer (filled triangles). However, the FSL (open circles) became only slightly longer, mainly reflecting the time needed to charge the membrane to spike threshold. Boltzmann functions were used to estimate the voltage range over which the FISI changed in these cells, as described above. The 20% voltage was −75.0 ± 6.2 mV, the 80% voltage was −93.9 ± 12.0 mV, and the mean voltage range was 18.8 ± 9.76 mV (n = 8). When the pauser and buildup patterns were compared, the voltages over which the FISI and the FSL could shift were mainly overlapping (see Fig. 7), although the 80th percentile voltages were significantly different (p < 0.02; two-tailed t test). As shown in Figure 2C, cells also could show transitions from one firing pattern to another, depending on the amount of previous hyperpolarization. After the depolarizing prepulses the cell responded with regular discharge (Fig. 2C1). When the prepulse was close to the resting potential, the cell responded with a pauser pattern, whereas when the prepulse was hyperpolarized below −65 mV, the cell responded with a buildup pattern (Fig.2C3). The transition from one pattern to the other was always abrupt (Fig. 2C3); even small excursions of the holding potential away from the resting potential could change the discharge pattern. Additionally, in most cells we observed a slow sag of varying amplitude in the response during hyperpolarizing steps, indicating the presence of an additional hyperpolarization-activated current. These results are consistent with previously reported data from adult guinea pigs (Manis, 1990) and extend the existence of the voltage-dependent discharge patterns of DCN pyramidal cells to neonatal ages in rats.
Outward currents in somatic outside-out patches
To investigate the properties of transient currents in pyramidal cells, we recorded in voltage-clamp from outside-out patches (n = 43) pulled from the soma of pyramidal cells in slices after we characterized the cells in current clamp. Because the cells were filled with Lucifer yellow before the patches were obtained (as in Fig. 1), we were certain about the identification of the cells.
The outward currents in patches had a variety of different appearances, probably reflecting the local composition of the channels sampled in the patch. The range of outward currents elicited by steps to −10 mV is indicated in Figure 3. Some patches had a rapidly inactivating current superimposed on a large noninactivating component (Fig. 3A1), other patches had a mixture of rapidly and slowly inactivating currents superimposed on a small noninactivating component (Fig.3A2), whereas yet other patches had only a rapidly inactivating current with a small noninactivating component (Fig. 3A3). The amplitudes of the peak and steady-state currents measured at +38 mV in the patches were correlated (Fig. 3B; Isteady state = 0.0156 + 0.195 · Ipeak;R = 0.847), and the steady-state current averaged one-fifth of the peak current. The mean reversal potential of the transient current determined from six patches was −79.4 ± 1.8 mV, close to the K+ equilibrium potential of −81.5 mV estimated from the bath and electrode solutions. This result suggests that the outward currents are carried mainly through K+ channels. The transient current is similar to the A current (Connor and Stevens, 1971) and will be termedIKI (for inactivating) or transient K+ current hereafter. The noninactivating current will be termed IKNI (for noninactivating). The steady-state current most likely reflects a mixture of both slowly inactivating and noninactivating currents.
Fig. 3.
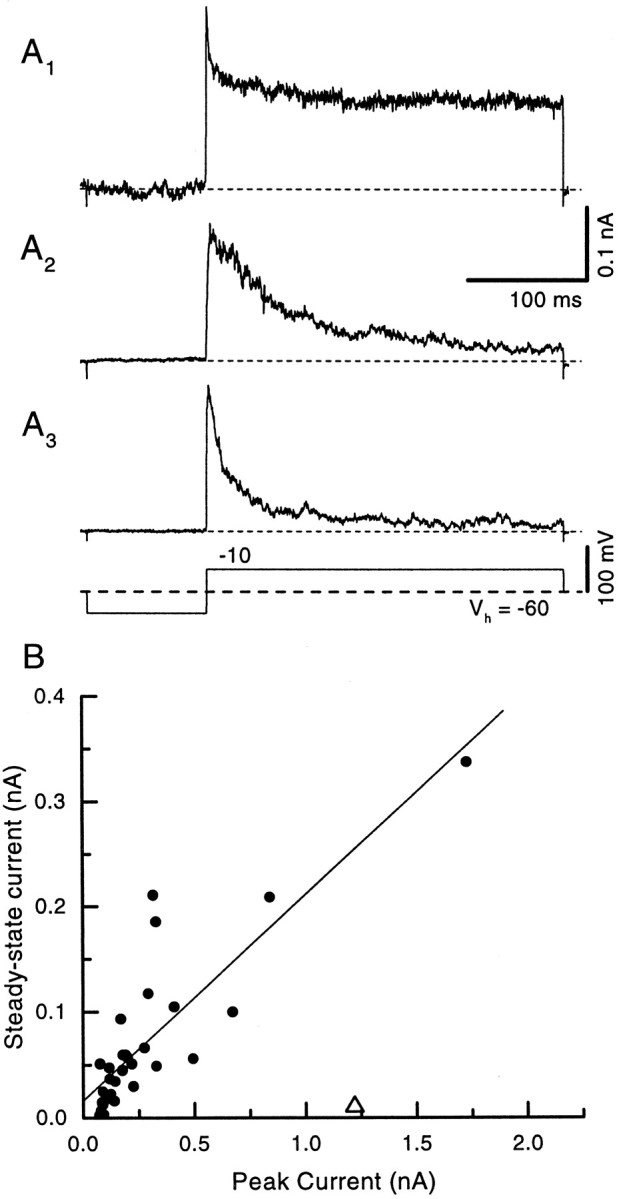
Individual outside-out patches showed currents with a range of shapes. The command voltage for all traces is shownbelow A3. Some patches had a rapidly inactivating component with a large steady-state current (A1), whereas others showed only a rapidly inactivating component with a small steady-state current (A3). Some patches showed a more slowly decaying current (A2).B, Peak and steady-state currents generally were correlated across patches (regression fit indicated byline), although currents in some patches were dominated by either the fast transient or steady-state current. One patch was excluded from the regression analysis (open triangle).
Surprisingly, we never observed any rapid inward currents (see Figs.3A, 4A), suggesting that Na+ channels were not present in significant numbers in these patches (n = 43). Adding 100 μmCd2+ to the bath did not affect the activation or inactivation of the currents significantly (n = 3; data not shown), indicating that neither Ca2+ channels nor Ca2+-activated K+ channels were present in significant numbers in these patches. Occasionally, we observed hyperpolarization-activated inward currents. Similar Cs+-sensitive hyperpolarization-activated currents were observed in whole-cell recordings in slices (n = 4; data not shown), but these were not studied in detail.
Fig. 4.

Voltage dependence of activation and inactivation of transient currents in outside-out patches from DCN pyramidal cells.A, Voltage command and current traces from one outside-out patch used to study activation and inactivation. The range of command voltages is indicated by the line withtwo arrows. A2,Inset showing the rapid activation of the currents.B, Fits from peak currents in A to Boltzmann functions. Activation is shown on the right;filled triangles are the measured values from the peak current in A, and the line is the best fit modified Boltzmann. Inactivation is shown on theleft; filled circles are the normalized peak current measured during the final step in A and are plotted as a function of the voltage during the preceding variable step. The dashed line is the fit of a single Boltzmann function to the data. However, the data were better described by the sum of two Boltzmann functions (solid line) (see Results). C1, Steps to 0 mV preceded by prepulses to −128 or −60 mV. The rapid inactivating outward current is reduced significantly by the prepulse to −60 mV.C2, Difference of currents elicited in C1 reveals a fast transient outward current. D, The filled circles show the voltage dependence of the peak current. The peak current activates near the resting potential. The filled triangles and squares show the voltage dependence of the slow (from C1) and noninactivating (from C2) components. These currents activate at a more depolarized voltage, as shown in the inset.
Voltage dependence of activation and inactivation in patches
An important determinant of the physiological role ofIKI is the range of voltages over which activation and inactivation occur. We characterized the activation and inactivation functions of currents in the patches by using the voltage protocol shown in Figure4A. In this protocol the channels were deinactivated by the first step to −112 mV, and the activation kinetics and inactivation kinetics were analyzed during the subsequent step. The final step (to ∼0 mV) was used to measure inactivation as a function of the voltage during the second step.IKI was largest when the patch was depolarized from holding potentials below −100 mV, whereas it was reduced if the patch was depolarized from less negative holding potentials. The normalized peak current elicited by a step to 0 mV was plotted as a function of the prepulse voltage for the patch and fit to a single Boltzmann (Eq. 7; Fig. 4B, filled circles anddashed line), which for this patch yielded a half-inactivation of approximately −60 mV.
The traces in the inset (Fig. 4A2) show that the transient current activated rapidly for voltage steps just above the resting potential. The peak current was plotted as function of step voltage (Fig. 4B, filled triangles) and fit with Equation 6. Half-activation of the peak current occurred at −6.8 ± 16.4 mV, with an equivalent gating charge of 1.47 ± 0.39 (n = 34). Half-inactivation of the peak current occurred at −63 ± 17 mV, and the equivalent gating charge was −1.88 ± 1.41 (n = 34). As we will discuss in the next section, it is likely that the half-inactivation voltages reflect the contribution of two separate currents with different voltage dependence. There was also a significant overlap between the activation and inactivation curves, suggesting that the potassium currents in these cells contribute a small steady conductance at the resting potential of the cell. In addition, at rest a significant amount of inactivation has been removed so that any depolarization should activate the channels.
IKI in patches has two components
Three lines of evidence suggested that IKIwas composed of two kinetically distinct components. First, 20 of 34 inactivation functions were better described by the sum of two Boltzmann functions (as determined by a reduction of the mean-squared error of the fit by at least 20%). These two components showed different, well separated half-inactivation values, as shown for the patch in Figure 4B (solid line). The mean half-inactivation values for the two Boltzmanns were −89.1 ± 12.5 mV and −37.7 ± 9.4 mV (n = 20), and thez was −5.23 ± 3.51 and −4.16 ± 2.05, respectively.
The second line of evidence was that we could eliminate the fast component by holding the patches at −60 mV; under these conditions only the slowly inactivating current remained. Subtraction of the traces as shown in Figure 4C1, obtained with prepulses to −62 and −112 mV, isolated the rapidly inactivating current (Fig. 4C2; n = 4). Figure 4D indicates that the fast component (filled circles) activated at potentials close to the resting potential whereas the slow component (filled triangles and filled squares) activated at more depolarized voltages. The third line of evidence was that the decay time course for more than one-half of the patches was best described by the sum of two exponential components, as described below.
Kinetics of inactivation of IKIin patches
To evaluate the decay of IKI, we fit the current trace with single- or double-exponential functions. A fit with two exponentials was chosen over a single-exponential fit if it reduced the mean-squared error by at least 20%. Of 34 patches, 23 were best fit with a double exponential, and 11 were best fit with a single exponential. Figure 5A depicts current traces and overlaid fits for a typical patch that showed a double-exponential decay. The decay time constants from the double-exponential fits were well separated (Fig.5B1); however, the amplitudes of the two components revealed activation over a similar voltage range (Fig.5B2). The fast component (IKIF) decayed with a mean time constant of 11 msec at 0 mV, whereas the slow component (IKIS) decayed with a mean time constant of 145 msec. The voltage dependence of the time constants for both components was shallow (Fig. 5C). The outward currents in patches activated rapidly, time-to-peak occurring in <1 msec (see Fig.4A2); because of limitations of our sampling rate during these experiments we did not obtain estimates of the activation time constants (activation kinetics were studied at room temperature with whole-cell recording in isolated cells, as presented below).
Fig. 5.
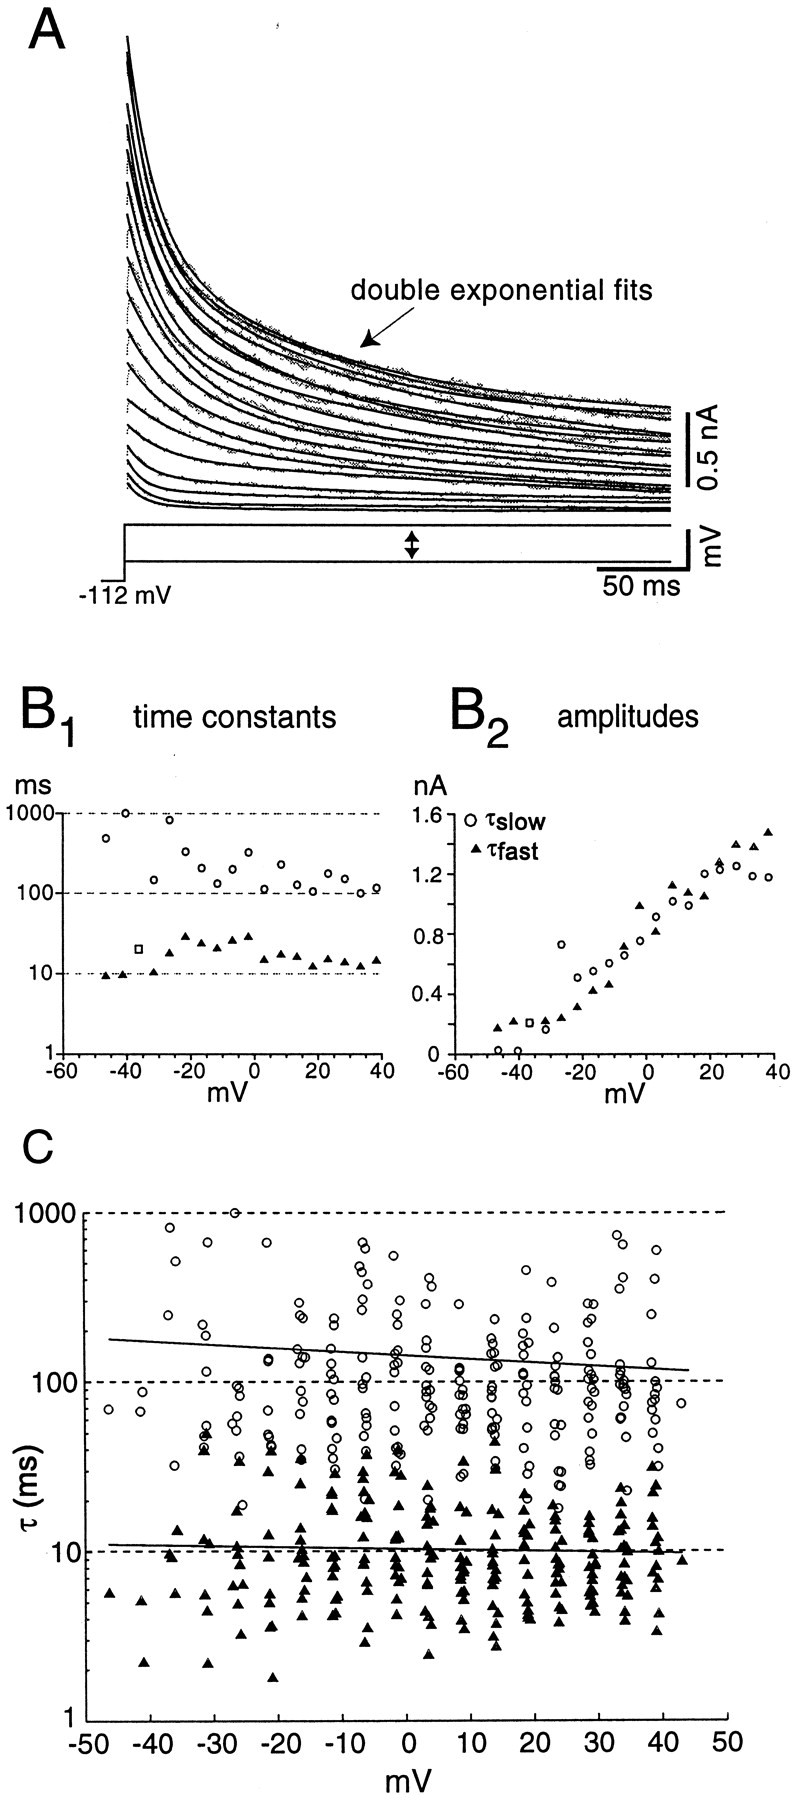
Inactivation kinetics of transient currents in outside-out patches reveal two components. A, Fits of the sum of two exponential decay functions to the decay phase of the currents elicited by a series of voltage steps.B1, Time constants for the fast and slow components of decay. The open squares indicate voltages at which the data were fit with a single exponential.B2, Amplitude of the two time constants for the fits to the data in A. C, Summary of kinetics for 23 patches with double-exponential fits. The regression line (solid line) for the fast component (filled triangles) is τ = 10.4 − 0.01 ·V (R = 0.02), and the regression for the slow component (open circles) is τ = 145.4 − 0.73 · V (R = 0.10).
There was a high degree of correlation between patches that showed two-component inactivation of the peak current and patches that showed double-exponential decays. Seventeen of 33 patches showed both double-exponential decays and double Boltzmann inactivation functions, and nine patches showed single-exponential decays and single Boltzmann functions. The remaining seven patches showed single-component fits to either the decay time course or inactivation and double-component fits to the other measure. The correlation between the presence of double- or single-component fits to both measurements was highly significant (Spearman rank order correlation coefficient = 0.56, df = 31; p < 0.01), further indicating the presence of two components in the transient current.
Block of outward currents by TEA and 4-AP
Because the outward currents had characteristics of K+ currents, the ability of the K+ channel blockers TEA and 4-AP to block the currents was tested. In general, transient K+currents are not very sensitive to 10–20 mm TEA but may be blocked by 0.1–5 mm 4-AP (Connor and Stevens, 1971; Neher and Lux, 1972; Schwindt and Crill, 1981; Gustafsson et al., 1982;Thompson, 1982; Segal and Barker, 1984; Segal et al., 1984; Nakajima et al., 1986; Numann et al., 1987; Schwindt et al., 1988; Storm, 1988; Wu and Barish, 1992). Figure 6 shows outward currents elicited by 300 msec pulses to +38 mV after a 75 msec step to −112 mV. In the presence of 10 mm TEA (Fig.6A2) the peak currents of the patch shown in Figure 6A1 are reduced but still activated near −50 mV (data not shown). The currents at the end of the step are reduced even further and activated near −30 mV. Under control conditions the current decayed with two well separated time constants. In the presence of 10 mm TEA (as in Fig.6A2), the current decay can still be fit with two time constants. To evaluate the change in the relative amplitudes of the time constants, we performed simultaneous fits of the control currents, the TEA-resistant current, and the TEA-sensitive component (Fig. 6A3; obtained by subtraction) with double exponentials, sharing the time constants across traces. In TEA the amplitude of the slow component was reduced significantly (to 19.1 ± 14.9% of the control amplitude;n = 8; p < 0.001), whereas the faster component was not affected significantly (82.8 ± 30.1% of the control amplitude; n = 8; p > 0.1). The current that was blocked by TEA (Fig.6A3) showed mostly a slow inactivation. The steady-state inactivation curve for the peak current (Fig. 6B, squares) showed a shallow slope and half-inactivation of −58.2 ± 14.7 mV (n = 9) when it was fit with a single Boltzmann function. However, in presence of 10 mm TEA the steady-state inactivation of the peak current was shifted to the left by ∼20 mV, with the larger component of inactivation now occurring at a V0.5 of −77.9 ± 23.7 mV (n = 9; Fig. 6B, inverted triangles). Half-activation of the peak current occurred at −11.7 ± 9.5 mV. On the other hand, the TEA-sensitive current showed half-inactivation at −36.8 ± 15.4 mV and half-activation at −5.2 ± 11.3 mV (n = 6; Fig. 6B, circles). The half-inactivation voltage of the TEA-resistant current was similar to the more negative half-inactivation value identified with double Boltzmann fits to the inactivation of the peak current in control conditions. Half-inactivation of the TEA-sensitive current was close to that of the less negative half-inactivation value found in the same fits. These results support the idea that there are two kinetically and pharmacologically distinct inactivating currents in the patches.
Fig. 6.

Tetraethylammonium (TEA) or 4-aminopyridine (4-AP) can block the slowly decaying transient current in patches. This figure shows traces from two exemplar patches. A1, Control currents elicited by a step from −112 to +38 mV for 300 msec, followed by a 100 msec step to 0 mV (the voltage protocol is shown below A1). The noisy tracerepresents data; the line is the best fit of the sum of two exponentials. A2, Currents elicited in the presence of 10 mm TEA. Fast and slow decay components can still be discerned. Although the peak current is reduced, it is the slow component that is mainly responsible for the change [compare the amplitudes of the fast (a1) and slow (a2) components of the exponential fits].A3, Subtraction of traces inA1 andA2 reveals the TEA-sensitive component of the current; this current is dominated by the slow component. B, Summary of inactivation as a function of prepulse voltages for the three conditions shown in A. The symbols correspond to those in A. The control inactivation curve (open squares) has a shallow slope and was fit with the sum of two Boltzmann functions. In the presence of TEA, half-inactivation is shifted to the negative by ∼20 mV (inverted triangles), whereas the TEA-sensitive current shows half-inactivation at more positive voltages (approximately −45 mV; open circles). C,D, Shown is the same experimental procedure as inA and B, except with 4-AP. The effects of 4-AP are similar to those of TEA, except for a slightly greater reduction of the fast component.
We also tested 4-AP by using the same paradigm (Fig. 6C,D). Application of 4-AP (1–2 mm) alone reduced the slow component in a manner similar to 10 mm TEA (Fig.6C2; to 35.0 ± 35.5% of the control amplitude; n = 6; p < 0.01). 4-AP also reduced the amplitude of the fast component of the current, although this effect was highly variable between patches and not statistically significant (mean reduction to 64.2 ± 35.5%; current amplitude in 4-AP ranged from 12–107% of control;n = 6; p > 0.05). Again, double Boltzmann fits to the inactivation curves indicated that the slower 4-AP-sensitive component had a more positive half-inactivation (Fig.6D, circles) than did the faster component (Fig.6D, inverted triangles). Thus, 4-AP, like TEA, separates the currents into two components with distinct inactivation kinetics and half-inactivation voltages.
Comparison of voltage dependence ofIKI and FSL/FISI shift
We now can evaluate the criterion that the inactivation voltage ranges of IKI and FSL/FISI shift must match forIKI to play a role in the observed FSL and FISI change. A comparison of the half-inactivation voltages ofIKI and the FSL and FISI shift is shown in Figure 7. The 20th and 80th percentiles for inactivation of IKIF measured in patches clearly overlap the 20th and 80th percentiles of prepulse voltages that can modify the discharge patterns, whereas the 20th and 80th percentiles for inactivation of IKIS are inappropriate to modify the discharge patterns. This result suggests that IKIF is the principal candidate current involved in regulating the voltage dependence of the discharge patterns.
Recovery from inactivation
The fourth requirement for IKI to play a role in the observed FSL changes was that the kinetics of the recovery from inactivation of IKI should match approximately the duration of hyperpolarizing pulses necessary to cause transitions in the firing patterns of the cells. We therefore examined the relationship between the duration of a hyperpolarizing prepulse and the discharge patterns of the cells, and we compared this with the rate at which the transient K+ currents recover from inactivation.
Figure 8A shows (in whole-cell current clamp) how the duration of a hyperpolarizing prepulse affected the latency to the first spike. The FSL increased monotonically with increasing duration of the hyperpolarizing prepulse (Fig. 8B, filled triangles). The data could be fit with an exponential function (excluding the short duration in which the latency is a linear function of the prepulse duration caused by the charging of the membrane), revealing a time constant of ∼10 msec. Note that, when the pulse duration was 6.3 msec, the cell underwent a bifurcation in its behavior; on one trial of four it fired with a short latency, whereas on the other three trials it fired with a long latency first spike. In contrast, the FISI is relatively constant (open circles). Clear bifurcations (regular firing abruptly changing to a buildup pattern) were apparent in 10 of 12 cells that were tested in this way; the remaining two cells showed a smooth transition into the long FSL behavior. From these results we conclude that even brief hyperpolarizations may alter the discharge pattern in response to a subsequent depolarization. These results also show that different discharge patterns of pyramidal cells are not necessarily graded according to voltage but that these patterns actually reflect discrete firing modes.
Fig. 8.

Time dependence of first spike latencies and recovery from inactivation of the transient currents.A, Responses of a pyramidal cell under current clamp to a depolarizing current step after hyperpolarizing pulses of varied duration. The hyperpolarizing pulses were preceded by a depolarizing step below spike threshold to inactivate transient K+ currents. Note the development of long first spike latency response at 6.3 msec, including the hump and sag in the voltage trace (arrows). B, First spike latency (filled triangles) and first interspike intervals (open circles) for the cell inA, over hyperpolarizing prepulse durations between 1 and 100 msec, plotted on a log–log scale. There are four trials shown for each time point; prepulse durations were presented in a logarithmic series. Latency increases approximately linearly with pulse duration until 6.3 msec, at which duration the cell can fire either with a short or a long latency (the bifurcation labeled with anarrow). The increase in spike latency after the bifurcation time point could be approximated by a single-exponential recovery function with a time constant of 9.6 msec (line). The first interspike intervals were affected little by the prepulse duration. C, Protocol used to measure recovery from inactivation of transient K+ currents. The voltage protocol is shownbelow the currents. Control traces are shown for the first and last trials only. The arrow indicates the control trace with a 100 msec pulse duration. D, Ratio of test current to control current in C, plotted as a function of prepulse duration. Recovery time course could be approximated by an exponential function (line) with a time constant of 20.6 msec. E, Comparison of measured time constants for change in first spike latency in current clamp (as in B) and for recovery from inactivation in patches (as in D). The distributions are partially overlapping.
To measure the recovery from inactivation ofIKI, we applied a depolarizing voltage step (between −20 and 0 mV for 100 msec) to inactivateIKI fully and followed it with a hyperpolarizing step of variable length to remove inactivation (see Fig.8C). The amplitude of the peak transient current (representing the fraction of channels that have recovered from inactivation) evoked by a subsequent step to a depolarized voltage was normalized against control currents and plotted as a function of the duration of the hyperpolarizing prepulse. The recovery time courses were described adequately by a single-exponential function (Fig.8D), although the recovery was not always complete within 100 msec. In some cases the slowly inactivating currents seemed to recover more slowly (arrow in Fig. 8C).
The time constants for recovery from inactivation are compared with the time constants of the shift in FSL under current clamp in Figure8E. Although the recovery time constants show some overlap, the time constants of IKI in patches are generally longer than the time constant for the FSL shift. However, the currents in the patches recover rapidly enough that a substantial fraction of the available channels will open even after rather brief hyperpolarizations. For example, assume that the channels have a recovery time constant of 20 msec. After a hyperpolarization of 8 msec ∼33% of the maximal current can be evoked. Because at restIKIF is, in large part, inactivated, a deinactivation of 33% of the total IKIFconductance will greatly increase the amount of total outward current evoked during a subsequent depolarization, and this will strongly influence the subsequent voltage trajectory. However, we also hasten to point out that that recovery of the currents is graded, whereas the discharge patterns of the cells show abrupt transitions. Clearly, the response bifurcations depend on an interaction between the transient currents and the spike-generating mechanism of the cell. This interaction also may be modulated by other conductances in the cells, notably the hyperpolarization-activated currents or other subthreshold currents, such as IKIS. Nonetheless, the fast transient current has the appropriate recovery kinetics to play a key role in regulating the discharge patterns of the pyramidal cells in both voltage and time domains.
Outward currents in acutely isolated cells
To test if the currents seen in outside-out patches are also present in a more intact preparation, we recorded from acutely isolated cells. Because these experiments were performed at a lower temperature (22°C), we also could evaluate activation kinetics. Twenty-five isolated cells (see Fig.1C1,C2) were characterized under voltage clamp; all showed inward and outward currents. A depolarizing voltage step in normal solution resulted in an early, brief inward current followed by a large outward current. The inward current was blocked readily by the application of 0.5 μm TTX, suggesting that it represents a rapidly inactivating sodium conductance. After an initial characterization of the cell as a neuron, as judged by the presence of fast TTX-sensitive inward currents, the subsequent characterization of the outward currents was performed in a solution containing both TTX and Cd2+ to block inward currents.
Depolarizing steps in a solution containing TTX and Cd2+ resulted in two outward currents: a rapidly rising and falling transient current superimposed on a sustained current. The currents were separated into IKIand IKNI by subtracting the traces preceded by a step to −20 mV from those preceded by steps to more hyperpolarized potentials (−100 mV) (Fig.9A). The isolated cells were difficult to depolarize sufficiently to observe consistently the saturation of the activation conductance functions (depolarizations to levels >10 mV frequently resulted in degraded electrical properties of the cell, as evidenced by increased leak currents and decreased potassium currents), so we were unable to obtain accurate estimates of maximal conductances and half-activation voltages. However, inspection of the current–voltage relationship showed that these currents activated at voltages between −60 and −40 mV (Fig. 9B), similar to the activation thresholds seen in patches. The half-inactivation voltage for the cell shown in Figure 9A(9B, filled triangles) was near −80 mV and averaged −81 ± 17 mV, with an equivalent gating charge of −3.0 ± 1.7 (n = 6). The equivalent gating charges for inactivation indicated a somewhat steeper change with voltage than in patches. The activation and inactivation functions overlap slightly around the resting potential so that a “window current” is present at rest. Again, this suggests that the channels contributing to this conductance have a significant steady-state open probability near rest and can both contribute to the resting conductance of the neuron and influence excitability. Overall, the voltage dependence ofIKI was consistent with the measurements of the rapidly inactivating IKIF in patches.
Fig. 9.

Kinetics of activation and inactivation of transient current in acutely isolated DCN neurons. A, Transient currents isolated by subtraction (noisy traces) after prepulses to either +20 or −110 mV and best fits of Equation 8 (smooth traces). Activation and inactivation time constants were determined from the fit parameters. The inset shows the onset of the current on an expanded time scale (solid lines) and the fits obtained withk = 3.3, which minimized the error function over all voltages (short dashed lines). B, Theopen circles show the voltage dependence of activation of the steady-state current in A. The solid line is the fit of a Boltzmann function to these data. Thefilled squares show the voltage dependence of activation of the transient (difference) current; the line is the best-fitting Boltzmann function. The filled trianglesshow the inactivation (left abscissa), measured as the peak current for a step to 0 mV in B, as a function of the prepulse voltage. The line is the best-fitting Boltzmann function. C, Time constants determined from the fits to Equation 8 for 16 cells.C1, Activation time constant as a function of voltage. Activation was fast with slight voltage dependence. The regression line is τ = 0.88 − 0.016 ·V (R = 0.20). The histogram on theright summarizes the time constants across all voltages; most activation time constants were between 0.5 and 2 msec at 22°C.C2, Inactivation time constants as a function of voltage. Inactivation time constants show slight voltage dependence, with most time constants falling between 10 and 40 msec. The regression line is τ = 20.94 + 0.10 · V(R = 0.11). D, Comparison of activation and inactivation time constants for 11 cells, measured at the estimated half-activation voltage for the transient current in each cell. Cells with fast activation showed fast inactivation, whereas cells with slow activation showed slow inactivation. The regression line is τinact = 9.5 + 5.8 · τactiv(R = 0.78).
In isolated cells it was possible to fit adequately the time course of activation and inactivation of IKI by Equation 8(see Fig. 9A and inset). The power kfor the activation function was 4.3 ± 2.2 (n = 16). The activation time constant, τactiv, ranged between 1 and 5 msec (n = 16; Fig.9C1) and showed a slight voltage dependence, whereas the inactivation time constant, τinact, varied between 10 and 40 msec (Fig.9C2). Although both time constants showed very little voltage dependence (see regression lines in Fig.9C1,C2) there were large differences in τinact among the cells. Surprisingly, a comparison of the time constants of τactiv and τinact at the respective half-activation voltage of each cell (Fig. 9D) showed a significant positive correlation; e.g., currents that activated more quickly also inactivated quickly. The noninactivating current,IKNI, activated with time constants between 1 and 5 msec, with a power k of 1.65 ± 0.96 (n = 17). Recovery from inactivation in isolated cells occurred with a time constant of 20 ± 10 msec (n= 7; data not shown). The activation, inactivation, and recovery time constants are in good agreement with the kinetic measurements of the fast IKI in patches.
Similar to our results in outside-out patch recordings we found thatIKI in isolated cell whole-cell recordings was not reduced significantly in amplitude by the application of 1 mm 4-AP (n = 2; data not shown), although 4-AP did reduce the amplitude of IKNI.
Model results
We used a computational model to confirm the involvement of the transient currents in the generation of the long FSL (Fig.10). The parameters of the model channels were obtained from the patch results presented above, except for the steady-state activation parameters. To analyze the data presented in the previous sections, we fit the steady-state activation with a single Boltzmann, raised to the power of 1. The results from the fits to the time course of IKI in isolated cells suggest that the channel contains four activation gates. Thus to describe accurately the behavior of the activation gates, we refit the activation data with a single Boltzmann raised to the fourth power, yielding a mean half-activation voltage of −53.0 and −40.9 mV, with a gating charge of 1.02 and 1.11 for IKIF andIKIS, respectively.
Fig. 10.

Open probabilities of outward currents in the model (A, B) for different membrane voltage trajectories (shown in C) obtained from current-clamp traces.A1–A3, Fast transient (m4h). Model parameters are given in Table 1. After the first action potential the currents are nearly completely inactivated (arrow).B1–B3, Slow transient (m4h); model parameters are given in Table 1.C1–C3, Voltage commands that served as model input, as recorded from a cell in current clamp (stimulus current traces are shown belowthe voltage traces). The first spike latencies were 40, 30, and 23 msec in traces C1,C2, andC3, respectively.
Then the model patch was voltage-clamped, using as a template the voltage traces recorded in whole-cell current clamp in rat slice (Fig.10C). We simulated three conditions in which the amplitude of the hyperpolarizing prepulse was varied (from approximately −85 to approximately −70 mV), yielding (for the example cell) a FSL of 40 msec (column 1), 30 msec (column 2), and 23 msec (column 3). We then computed the open probabilities of the two different outward currents (Fig. 10A,B). So that the FSL can be increased after a hyperpolarizing prepulse, an additional outward current has to be present. At the onset of the depolarizing step after a large hyperpolarizing step (approximately −85 mV; Fig. 10,column 1) IKIF (Fig.10A1) andIKIS (Fig.10B1) were activated rapidly. The activation of the IKIF decayed rapidly before the first action potential was initiated, whereas the activation of the slow transient increased during the same interval. During the first action potential IKIF became inactivated almost completely (arrow), whereasIKIS inactivated only partially. When the prepulse reached a less hyperpolarizing voltage (approximately −70 mV; Fig. 10, column 3), the opening probability ofIKIF channels was reduced by >90%, whereas the opening of IKIS channels was, in large part, unchanged. A comparison of the amplitude of IKISduring the first and the last spikes showed that the amount of activation decreased slightly during the sustained discharge. These results show that IKIF is largest after large hyperpolarizations and thus behaves as expected if it were to play a role in controlling the FSL or FISI. AlthoughIKIS is not affected by prepulses in this voltage range, it is active during subthreshold depolarizations and is poised to participate in the subthreshold integration of synaptic inputs to DCN pyramidal cells.
DISCUSSION
Our experiments indicate that DCN pyramidal cells express prominent transient K+ currents. Recordings from outside-out patches from identified cells in slices and from acutely isolated cells show that the voltage dependence and time dependence of these currents are consistent with a role in regulating the discharge patterns of the cells. Our data suggest that there are at least two pharmacologically and kinetically separable K+currents that contribute to the regulation of subthreshold membrane potentials: a rapidly activating and inactivating transient current with a relatively negative half-inactivation voltage, and a rapidly activating and slowly inactivating current with a less negative half-inactivation voltage (Table 1).
Table 1.
Characteristics of the fast and slowIKI
| Activation, k = 4 | Inactivation, k = 1 | |||||
|---|---|---|---|---|---|---|
| V05 | z | τactiv | V05 | z | τinact | |
| Fast IKI | −53.0 mV | 1.02 | 0.8 msec | −89.6 mV | −3.93 | 11 msec |
| Slow IKI | −40.9 mV | 1.11 | 0.8 msec | −38.4 mV | −2.92 | 145 msec |
Evidence that a transient potassium current regulates the discharge of DCN pyramidal cells
The features of IKIF appear to be the most appropriate to explain the observed discharge characteristics. First,IKIF activates at the resting potential and thus is able to regulate excitability. Second, the range of voltages over which IKIF inactivates is consistent with the voltage dependence of the observed shift in FSL and FISI. Third,IKIF inactivates with a time constant between 10 and 30 msec, values that are consistent with the observed rise in membrane voltage before the first spike. Fourth,IKIF recovers from inactivation with time constants between 10 and 30 msec, which is similar to the “recovery” time dependence of the FSL and FISI. Fifth, the magnitude of IKIF is greater than the magnitude of IKIS and IKNI, suggesting that it provides a significant additional outward current that becomes available only after a hyperpolarizing prepulse. We conclude that IKIF shows the same voltage and time dependence as the observed pauser and buildup discharge patterns (see Figs. 7, 8). Finally, the results of the computational model show that the prepulse amplitude controls the activation of onlyIKIF.
IKIS inactivates over a considerably more positive voltage range than IKIF and hence could not be responsible for the dependence of the discharge patterns on previous membrane potential. However, the relatively negative activation voltage range of IKIS suggests that the channels should be active just above rest. The slow inactivation ofIKIS could play a role in regulating the rise of the membrane potential before the first spike in the buildup response. This is consistent with the model results that show significant activation of IKIS during rest and the depolarizing step but that the amount of activation is not affected strongly by the hyperpolarizing prepulse. In this senseIKIS may contribute to the relatively long FSL that we have observed. The peak activation ofIKIS is less during the repolarizing phase of the later action potentials. This suggests thatIKIS also may regulate spike threshold, action potential duration, and adaptation during prolonged depolarizations. We suspect that IKIS in part corresponds to the relatively noninactivating current in isolated cells, because both were reduced by 4-AP and TEA and because there was a very slow inactivation of the sustained current in isolated cells. It is not clear why a greater amount of inactivation is seen in patches, but we do not believe that it is attributable to K+ accumulation or depletion during channel openings (Wang et al., 1998), because the decay rate was relatively independent of step voltage or patch current (see Figs. 5C, 9C2). It seems more likely that the inactivation process ofIKIS shows a greater sensitivity to temperature, and thus the slow inactivation was not as visible in isolated whole-cell recordings as in patches.
Expression of IKI often has been associated with early stages of development (Bader et al., 1985; Klee et al., 1995). Isolated cells from adult guinea pig DCN show anIKI similar to that observed in rat (our unpublished observations), suggesting that IKIin the DCN appears is expressed into adulthood.
Pharmacology
IKIF was not blocked significantly by 10 mm TEA and only partially by 1–2 mm 4-AP. The A currents in other systems are blocked mainly by 0.1–5 mm4-AP (Connor and Stevens, 1971; Neher and Lux, 1972; Schwindt and Crill, 1981; Gustafsson et al., 1982; Thompson, 1982; Segal and Barker, 1984; Segal et al., 1984; Nakajima et al., 1986; Numann et al., 1987;Schwindt et al., 1988; Storm, 1988; Wu and Barish, 1992). It is possible that higher concentrations of 4-AP would achieve a fuller block in DCN. Recently, firing patterns similar to the pauser/buildup behavior have been reported for olivocochlear neurons in vitro (Fujino et al., 1997). In these cells, 4-AP blockedIKI and converted the firing patterns to simple tonic firing. However, both the kinetics and pharmacological profile of the currents in olivocochlear neurons are different from those in DCN. On the other hand, a fast IKI seen in cochlear nucleus granule cells has properties quite similar to those reported here (Rusznak et al., 1997). Our finding that part ofIKNI and IKIS is sensitive to 4-AP is consistent with previous reports (Numann et al., 1987) as well as with the observation that DCN pyramidal cells contain 4-AP-sensitive conductances (Hirsch and Oertel, 1988; Agar et al., 1997).
Molecular identity of IA
Voltage-gated K+ channels exist in four different gene families genes (Shaker, Shab,Shal, and Shaw). The observed properties ofIKIF are most consistent with theShal (Kv4) subfamily that encodes a transient K+ current active at subthreshold membrane potentials. Reconstituted Kv4.2 and Kv4.3 channels show half-activation of −40 mV and half-inactivation of −80 mV, with activation occurring in <10 msec and with two inactivation time constants of ∼20 and 100–200 msec, whereas in cloned homomeric channels the half-activation is close to 0 mV (Serodio et al., 1994, 1996). These characteristics are mainly in agreement with the kinetics ofIKIF except that half-activation ofIKIF occurs near −5 mV, as compared with −40 mV. Kv4.3 is relatively insensitive to 1 mm 4-AP and shows voltage-independent kinetics (Serodio et al., 1996), also consistent with our results. Kv4.1 is expressed mostly in heart whereas Kv4.2 and Kv4.3 are expressed heavily in the brain, especially the cerebellum (Baldwin et al., 1991; Serodio et al., 1994, 1996). Furthermore, a recent in situ hybridization study (Serodio and Rudy, 1998) has revealed a high level of expression of Kv4.2, along with a low level of Kv4.3 in rat DCN; however, it is still unclear which specific DCN cells express Kv4.2.
Of the members of the Shaw channel family Kv3.1, Kv3.3, and Kv3.4 show inactivation, but they are weakly, if at all, expressed in DCN, whereas Kv3.2, which is expressed at moderate levels in rat DCN pyramidal cells, does not appear to show significant inactivation (Weiser et al., 1994). Kv1.4, a transient channel of theShaker family (Chandy and Gutman, 1995), is expressed in DCN, but the cellular localization of Kv1.4 is unclear. Juiz et al. (1996) have localized the channel to dendrites and spines of DCN pyramidal cells, whereas Heck et al. (1997) suggest a presynaptic localization. Although Kv1.4 may contribute to the recorded currents, it is unlikely to underlie IKIF because its kinetics are slower (Solc et al., 1987). Thus, Kv4.2 is the most likely substrate for IKIF.
Functional implications
So that IKIF can be deinactivated, the cell must be hyperpolarized for a sufficient amount of time. Three likely sources for this hyperpolarization exist. First, pyramidal cells receive inhibitory input from cartwheel cells (Zhang and Oertel, 1994;Davis et al., 1996) that is long enough (10–30 msec) to deinactivateIKIF. Input to the cartwheel cells arises from parallel fibers that carry both auditory and nonauditory input [e.g., somatosensory input from the pinna (Young et al., 1995; Kanold and Young, 1998)]. Second, vertical cells provide an additional auditory inhibitory input to pyramidal cells (Voigt and Young, 1980,1990; Zhang and Oertel, 1994). Third, pyramidal cells show a strong hyperpolarization after a train of action potentials (Hirsch and Oertel, 1988), and this hyperpolarization appears to be able to delay the response to a subsequent excitatory tone burst (Rhode et al., 1983).
We found that the FSL can be delayed by >70 msec. This is remarkable, especially considering the extent to which other elements of the auditory system are designed to retain precise onset timing. Another significant feature of the voltage and time dependence of the FSL shifts is the bifurcations from a regular or pauser firing pattern to a buildup pattern requiring just brief and small hyperpolarizations. This suggests that even brief hyperpolarizing events can shift the FSL by a significant amount. The presence of IKI endows pyramidal neurons with a kind of short-term memory and introduces an additional variable for temporal information encoding. The DCN integrates spectral information with nonauditory information and is thought to be involved in some aspects of sound localization (May, 1998). The presence of IKI may play an important role in the integration of auditory and nonauditory information, because it allows previous nonauditory input to modify the acoustically evoked response. The functional significance of these changes in discharge patterns, however, depends on how spike trains from DCN neurons are integrated with other inputs in target cells of the inferior colliculus.
Footnotes
This work was supported by National Institute on Deafness and Other Communication Disorders Grant R01 DC00425 to P.B.M. We thank K. E. Hancock for suggesting an experiment and our colleagues in The Center for Hearing Sciences for their constructive comments on this manuscript.
Correspondence should be addressed to Dr. Paul B. Manis, The Center for Hearing Sciences, 420 Ross Research Building, Johns Hopkins University School of Medicine, 720 Rutland Avenue, Baltimore, MD 21205.
REFERENCES
- 1.Agar E, Green GG, Sanders DJ. Membrane properties of mouse dorsal cochlear nucleus neurons in vitro. J Basic Clin Physiol Pharmacol. 1997;8:157–179. doi: 10.1515/jbcpp.1997.8.3.157. [DOI] [PubMed] [Google Scholar]
- 2.Bader CR, Bertrand D, Dupin E. Voltage-dependent potassium currents in developing neurones from quail mesencephalic neural crest. J Physiol (Lond) 1985;366:129–151. doi: 10.1113/jphysiol.1985.sp015789. [DOI] [PMC free article] [PubMed] [Google Scholar]
- 3.Baldwin TJ, Tsaur ML, Lopez GA, Jan YN, Jan LY. Characterization of a mammalian cDNA for an inactivating voltage-sensitive K+ channel. Neuron. 1991;7:471–483. doi: 10.1016/0896-6273(91)90299-f. [DOI] [PubMed] [Google Scholar]
- 4.Bertrand D, Bader CR. DATAC: a multipurpose biological data analysis program based on a mathematical interpreter. Int J Biomed Comput. 1986;18:193–202. doi: 10.1016/0020-7101(86)90016-4. [DOI] [PubMed] [Google Scholar]
- 5.Blackstad TW, Osen KK, Mugnaini E. Pyramidal neurones of the dorsal cochlear nucleus: a Golgi and computer reconstruction study in cat. Neuroscience. 1984;13:827–854. doi: 10.1016/0306-4522(84)90099-x. [DOI] [PubMed] [Google Scholar]
- 6.Bossu JL, Dupont JL, Feltz A. Potassium currents in rat cerebellar Purkinje neurones maintained in culture in L15 (Leibovitz) medium. Neurosci Lett. 1988;89:55–62. doi: 10.1016/0304-3940(88)90480-6. [DOI] [PubMed] [Google Scholar]
- 7.Brawer JR, Morest DK, Kane EC. The neuronal architecture of the cochlear nucleus of the cat. J Comp Neurol. 1974;155:251–300. doi: 10.1002/cne.901550302. [DOI] [PubMed] [Google Scholar]
- 8.Chandy KG, Gutman GA. Voltage-gated potassium channel genes. In: North RA, editor. Ligand and voltage-gated ion channels. CRC; Boca Raton, FL: 1995. pp. 1–72. [Google Scholar]
- 9.Connor JA, Stevens CF. Voltage clamp studies of a transient outward membrane current in gastropod neural somata. J Physiol (Lond) 1971;213:21–30. doi: 10.1113/jphysiol.1971.sp009365. [DOI] [PMC free article] [PubMed] [Google Scholar]
- 10.Connor JA, Walter D, McKown R. Neural repetitive firing: modifications of the Hodgkin–Huxley axon suggested by experimental results from crustacean axons. Biophys J. 1977;18:81–102. doi: 10.1016/S0006-3495(77)85598-7. [DOI] [PMC free article] [PubMed] [Google Scholar]
- 11.Davis KA, Miller RL, Young ED. Effects of somatosensory and parallel-fiber stimulation on neurons in dorsal cochlear nucleus. J Neurophysiol. 1996;76:3012–3024. doi: 10.1152/jn.1996.76.5.3012. [DOI] [PubMed] [Google Scholar]
- 12.Duprat F, Guillemare E, Romey G, Fink M, Lesage F, Lazdunski M, Honore E. Susceptibility of cloned K+ channels to reactive oxygen species. Proc Natl Acad Sci USA. 1995;92:11796–11800. doi: 10.1073/pnas.92.25.11796. [DOI] [PMC free article] [PubMed] [Google Scholar]
- 13.Fujino K, Koyano K, Ohmori H. Lateral and medial olivocochlear neurons have distinct electrophysiological properties in the rat brain slice. J Neurophysiol. 1997;77:2788–2804. doi: 10.1152/jn.1997.77.5.2788. [DOI] [PubMed] [Google Scholar]
- 14.Godfrey DA, Kiang NY, Norris BE. Single unit activity in the dorsal cochlear nucleus of the cat. J Comp Neurol. 1975;162:269–284. doi: 10.1002/cne.901620207. [DOI] [PubMed] [Google Scholar]
- 15.Gustafsson B, Galvan M, Grafe P, Wigstrom H. A transient outward current in a mammalian central neurone blocked by 4- aminopyridine. Nature. 1982;299:252–254. doi: 10.1038/299252a0. [DOI] [PubMed] [Google Scholar]
- 16.Heck W, Fitzakerley J, Balak K, Schweitzer L. Localization of a fast inactivating voltage-gated potassium channel (Kv1.4) in the cochlear nucleus of the adult mouse. Assoc Res Otolaryngol. 1997;20:82. [Google Scholar]
- 17.Hewitt MJ, Meddis R. A computer model of dorsal cochlear nucleus pyramidal cells: intrinsic membrane properties. J Acoust Soc Am. 1995;97:2405–2413. doi: 10.1121/1.411962. [DOI] [PubMed] [Google Scholar]
- 18.Hirsch JA, Oertel D. Intrinsic properties of neurones in the dorsal cochlear nucleus of mice, in vitro. J Physiol (Lond) 1988;396:535–548. doi: 10.1113/jphysiol.1988.sp016976. [DOI] [PMC free article] [PubMed] [Google Scholar]
- 19.Hodgkin AL, Huxley AF. A quantitative description of membrane current and its application to conduction and excitation in nerve. J Physiol (Lond) 1952;117:500–544. doi: 10.1113/jphysiol.1952.sp004764. [DOI] [PMC free article] [PubMed] [Google Scholar]
- 20.Juiz J, Chapuli J, Dominguez E, Criado M. Structural support for a transient potassium conductance in the dorsal cochlear nucleus: expression of a fast inactivating potassium channel. Assoc Res Otolaryngol. 1996;19:166. [Google Scholar]
- 21.Kanold PO, Young ED. Somatosensory input to the cat dorsal cochlear nucleus (DCN) derives primarily from spinal nerve C2. Assoc Res Otolaryngol. 1998;21:98. [Google Scholar]
- 22.Kim DO, Ghoshal S, Khant SL, Parham K. A computational model with ionic conductances for the fusiform cell of the dorsal cochlear nucleus. J Acoust Soc Am. 1994;96:1501–1514. doi: 10.1121/1.410228. [DOI] [PubMed] [Google Scholar]
- 23.Klee R, Ficker E, Heinemann U. Comparison of voltage-dependent potassium currents in rat pyramidal neurons acutely isolated from hippocampal regions CA1 and CA3. J Neurophysiol. 1995;74:1982–1995. doi: 10.1152/jn.1995.74.5.1982. [DOI] [PubMed] [Google Scholar]
- 24.Manis PB. Membrane properties and discharge characteristics of guinea pig dorsal cochlear nucleus neurons studied in vitro. J Neurosci. 1990;10:2338–2351. doi: 10.1523/JNEUROSCI.10-07-02338.1990. [DOI] [PMC free article] [PubMed] [Google Scholar]
- 25.Manis PB, Spirou GA, Wright DD, Paydar S, Ryugo DK. Physiology and morphology of complex spiking neurons in the guinea pig dorsal cochlear nucleus. J Comp Neurol. 1994;348:261–276. doi: 10.1002/cne.903480208. [DOI] [PubMed] [Google Scholar]
- 26.May BJ. Lesions of the dorsal cochlear nucleus disrupt sound orientation behavior in cats. Assoc Res Otolaryngol. 1998;21:170. [Google Scholar]
- 27.Nakajima Y, Nakajima S, Leonard RJ, Yamaguchi K. Acetylcholine raises excitability by inhibiting the fast transient potassium current in cultured hippocampal neurons. Proc Natl Acad Sci USA. 1986;83:3022–3026. doi: 10.1073/pnas.83.9.3022. [DOI] [PMC free article] [PubMed] [Google Scholar]
- 28.Neher E, Lux HD. Differential action of TEA+ on two K+ current components of a molluscan neurone. Pflügers Arch. 1972;336:87–100. doi: 10.1007/BF00592924. [DOI] [PubMed] [Google Scholar]
- 29.Numann RE, Wadman WJ, Wong RK. Outward currents of single hippocampal cells obtained from the adult guinea-pig. J Physiol (Lond) 1987;393:331–353. doi: 10.1113/jphysiol.1987.sp016826. [DOI] [PMC free article] [PubMed] [Google Scholar]
- 30.Pfeiffer RR. Classification of response patterns of spike discharges for units in the cochlear nucleus: tone-burst stimulation. Exp Brain Res. 1966;1:220–235. doi: 10.1007/BF00234343. [DOI] [PubMed] [Google Scholar]
- 31.Rhode WS, Smith PH, Oertel D. Physiological response properties of cells labeled intracellularly with horseradish peroxidase in cat dorsal cochlear nucleus. J Comp Neurol. 1983;213:426–447. doi: 10.1002/cne.902130407. [DOI] [PubMed] [Google Scholar]
- 32.Rizzo MA, Nonner W. Transient K current in the somatic membrane of cultured central neurons of embryonic rat. J Neurophysiol. 1992;68:1708–1719. doi: 10.1152/jn.1992.68.5.1708. [DOI] [PubMed] [Google Scholar]
- 33.Rudy B. Diversity and ubiquity of K channels. Neuroscience. 1988;25:729–749. doi: 10.1016/0306-4522(88)90033-4. [DOI] [PubMed] [Google Scholar]
- 34.Rudy B, Sen K, Vega-Saenz de Miera E, Lau D, Ried T, Ward DC. Cloning of a human cDNA expressing a high voltage-activating, TEA-sensitive, type-A K+ channel which maps to chromosome 1 band p21. J Neurosci Res. 1991;29:401–412. doi: 10.1002/jnr.490290316. [DOI] [PubMed] [Google Scholar]
- 35.Ruppersberg JP, Stocker M, Pongs O, Heinemann SH, Frank R, Koenen M. Regulation of fast inactivation of cloned mammalian IKA channels by cysteine oxidation. Nature. 1991;352:711–714. doi: 10.1038/352711a0. [DOI] [PubMed] [Google Scholar]
- 36.Rusznak Z, Forsythe ID, Brew HM, Stanfield PR. Membrane currents influencing action potential latency in granule neurons of the rat cochlear nucleus. Eur J Neurosci. 1997;9:2348–2358. doi: 10.1111/j.1460-9568.1997.tb01652.x. [DOI] [PubMed] [Google Scholar]
- 37.Ryugo DK, Willard FH. The dorsal cochlear nucleus of the mouse: a light microscopic analysis of neurons that project to the inferior colliculus. J Comp Neurol. 1985;242:381–396. doi: 10.1002/cne.902420307. [DOI] [PubMed] [Google Scholar]
- 38.Schroter KH, Ruppersberg JP, Wunder F, Rettig J, Stocker M, Pongs O. Cloning and functional expression of a TEA-sensitive A-type potassium channel from rat brain. FEBS Lett. 1991;278:211–216. doi: 10.1016/0014-5793(91)80119-n. [DOI] [PubMed] [Google Scholar]
- 39.Schwindt PC, Crill WE. Differential effects of TEA and cations on outward ionic currents of cat motoneurons. J Neurophysiol. 1981;46:1–16. doi: 10.1152/jn.1981.46.1.1. [DOI] [PubMed] [Google Scholar]
- 40.Schwindt PC, Spain WJ, Foehring RC, Stafstrom CE, Chubb MC, Crill WE. Multiple potassium conductances and their functions in neurons from cat sensorimotor cortex in vitro. J Neurophysiol. 1988;59:424–449. doi: 10.1152/jn.1988.59.2.424. [DOI] [PubMed] [Google Scholar]
- 41.Segal M, Barker JL. Rat hippocampal neurons in culture: potassium conductances. J Neurophysiol. 1984;51:1409–1433. doi: 10.1152/jn.1984.51.6.1409. [DOI] [PubMed] [Google Scholar]
- 42.Segal M, Rogawski MA, Barker JL. A transient potassium conductance regulates the excitability of cultured hippocampal and spinal neurons. J Neurosci. 1984;4:604–609. doi: 10.1523/JNEUROSCI.04-02-00604.1984. [DOI] [PMC free article] [PubMed] [Google Scholar]
- 43.Serodio P, Rudy B. Differential expression of Kv4 K+ channel subunits mediating subthreshold transient K+ (A-type) currents in rat brain. J Neurophysiol. 1998;79:1081–1091. doi: 10.1152/jn.1998.79.2.1081. [DOI] [PubMed] [Google Scholar]
- 44.Serodio P, Kentros C, Rudy B. Identification of molecular components of A-type channels activating at subthreshold potentials. J Neurophysiol. 1994;72:1516–1529. doi: 10.1152/jn.1994.72.4.1516. [DOI] [PubMed] [Google Scholar]
- 45.Serodio P, Vega-Saenz de Miera E, Rudy B. Cloning of a novel component of A-type K+ channels operating at subthreshold potentials with unique expression in heart and brain. J Neurophysiol. 1996;75:2174–2179. doi: 10.1152/jn.1996.75.5.2174. [DOI] [PubMed] [Google Scholar]
- 46.Solc CK, Zagotta WN, Aldrich RW. Single-channel and genetic analyses reveal two distinct A-type potassium channels in Drosophila. Science. 1987;236:1094–1098. doi: 10.1126/science.2437657. [DOI] [PubMed] [Google Scholar]
- 47.Stephens GJ, Owen DG, Robertson B. Cysteine-modifying reagents alter the gating of the rat cloned potassium channel Kv1.4. Pflügers Arch. 1996;431:435–442. doi: 10.1007/BF02207283. [DOI] [PubMed] [Google Scholar]
- 48.Storm JF. Temporal integration by a slowly inactivating K+ current in hippocampal neurons. Nature. 1988;336:379–381. doi: 10.1038/336379a0. [DOI] [PubMed] [Google Scholar]
- 49.Thompson S. Aminopyridine block of transient potassium current. J Gen Physiol. 1982;80:1–18. doi: 10.1085/jgp.80.1.1. [DOI] [PMC free article] [PubMed] [Google Scholar]
- 50.Vega-Saenz de Miera E, Moreno H, Fruhling D, Kentros C, Rudy B. Cloning of ShIII (Shaw-like) cDNAs encoding a novel high-voltage-activating, TEA-sensitive, type-A K+ channel. Proc R Soc Lond [Biol] 1992;248:9–18. doi: 10.1098/rspb.1992.0036. [DOI] [PubMed] [Google Scholar]
- 51.Voigt HF, Young ED. Evidence of inhibitory interactions between neurons in dorsal cochlear nucleus. J Neurophysiol. 1980;44:76–96. doi: 10.1152/jn.1980.44.1.76. [DOI] [PubMed] [Google Scholar]
- 52.Voigt HF, Young ED. Cross-correlation analysis of inhibitory interactions in dorsal cochlear nucleus. J Neurophysiol. 1990;64:1590–1610. doi: 10.1152/jn.1990.64.5.1590. [DOI] [PubMed] [Google Scholar]
- 53.Wang LY, Gan L, Perney TM, Schwartz I, Kaczmarek LK. Activation of Kv3.1 channels in neuronal spine-like structures may induce local potassium ion depletion. Proc Natl Acad Sci USA. 1998;95:1882–1887. doi: 10.1073/pnas.95.4.1882. [DOI] [PMC free article] [PubMed] [Google Scholar]
- 54.Weiser M, Vega-Saenz de Miera E, Kentros C, Moreno H, Franzen L, Hillman D, Baker H, Rudy B. Differential expression of Shaw-related K+ channels in the rat central nervous system. J Neurosci. 1994;14:949–972. doi: 10.1523/JNEUROSCI.14-03-00949.1994. [DOI] [PMC free article] [PubMed] [Google Scholar]
- 55.Wu RL, Barish ME. Two pharmacologically and kinetically distinct transient potassium currents in cultured embryonic mouse hippocampal neurons. J Neurosci. 1992;12:2235–2246. doi: 10.1523/JNEUROSCI.12-06-02235.1992. [DOI] [PMC free article] [PubMed] [Google Scholar]
- 56.Young ED, Nelken I, Conley RA. Somatosensory effects on neurons in dorsal cochlear nucleus. J Neurophysiol. 1995;73:743–765. doi: 10.1152/jn.1995.73.2.743. [DOI] [PubMed] [Google Scholar]
- 57.Zhang S, Oertel D. Neuronal circuits associated with the output of the dorsal cochlear nucleus through fusiform cells. J Neurophysiol. 1994;71:914–930. doi: 10.1152/jn.1994.71.3.914. [DOI] [PubMed] [Google Scholar]