Abstract
We have used a sensitive activity-dependent probe, sulforhodamine 101 (SR101), to view endocytic events within snake motor nerve terminals. After very brief neural stimulation at reduced temperature, SR101 is visualized exclusively at punctate sites located just inside the presynaptic membrane of each terminal bouton. The number of sites (∼26 sites/bouton) and their location (in register with postsynaptic folds) are similar to the number and location of active zones in snake motor terminals, suggesting a spatial association between exocytosis and endocytosis under these stimulus conditions. With more prolonged stimulation, larger SR101-containing structures appear at the bouton margins. Thus endocytosis occurs initially at distinct sites, which we call “endocytic active zones,” whereas further stimulation recruits a second endocytic paradigm.
Keywords: endocytosis, nerve terminal, neuromuscular junction, neurosecretion, optical probes, vesicle processing
Transmitter release sites, or active zones, are visible as electron-dense structures within the presynaptic membrane of nerve–muscle synapses, where they precisely oppose postsynaptic folds. Calcium channels, potassium channels, and other membrane proteins thought to be associated with release are present at these sites, as are vesicles poised for release (for review, seeJackson, 1995; Matthews, 1996). Thus the exact location of the exocytic event at neuromuscular terminals (and at other vertebrate synapses) is well established. Less is known about the corresponding sites of endocytosis. The recycling process has been studied using aqueous (Heuser and Reese, 1973) or amphiphilic (Betz and Bewick, 1993) markers taken up primarily or exclusively by active nerve terminals and with measurement of membrane capacitance (von Gersdorff and Matthews, 1994; for review of the monitoring of secretion, see Angleson and Betz, 1997). The standard model, based on studies using the EM marker horseradish peroxidase and on freeze–fracture EM, is that endocytosis occurs at sites distinct from active zones, is mediated by clathrin, and often involves endosomal intermediates (Heuser and Reese, 1973, 1981; Heuser et al., 1974). An alternative model is that at least some endocytosis occurs at or near active zones (Ceccarelli et al., 1973, 1979), perhaps as a reversal of exocytosis [“kiss and run” transmitter release (Fesce et al., 1994)]. More recently, there have been suggestions that two endocytic mechanisms might coexist in some nerve terminals (von Gersdorff and Matthews, 1994; Koenig and Ikeda, 1996; Matthews, 1996; Kuromi and Kidokoro, 1998). One hypothesis generally consistent with these observations is that the endocytic paradigm used by a terminal is alterable, depending, for example, on the rate at which it must recycle membrane. To examine this possibility, we have visualized the initial stages of activity-dependent endocytosis using a fluorescent activity-dependent probe with very brief, low-frequency neural stimulation at reduced temperature, immediate fixation, and three-dimensional confocal imaging. Under these conditions, the endocytosed probe was found exclusively at small punctate sites located just within the presynaptic membrane. Moreover, with an increasing number of delivered stimuli, a second mechanism appeared whereby the internalized probe was found at additional larger sites near the margin.
Parts of this paper have been published previously (Roberts et al., 1997; Teng et al., 1998).
MATERIALS AND METHODS
Garter snakes (Thamnophis sirtalis) were killed by rapid decapitation. The transversus abdominis muscle was used. This muscle was ideal for the studies described for several reasons. First, it comprises ∼200 segmental components (one for each rib), with each component supplied by its own nerve. Thus an adequate supply of virtually identical nerve–muscle preparations was available for each series of experiments, thereby eliminating variability caused by the use of multiple animals. Second, the transversus abdominis is a single fiber in thickness. As a consequence of this unique geometry, all ∼40 twitch muscle fibers in the muscle, plus their innervating motor nerve terminals, are visible in a single plane in whole-mounted preparations. This feature permitted access to a statistically adequate sample of terminals for imaging in every preparation. Third, unlike the situation in mammals or amphibians, reptilian motor nerve terminals comprise discrete boutons, similar to boutons in the CNS of mammals. Each bouton opposes a corresponding postsynaptic receptor patch, providing in effect several (∼60) individual small synapses per neuromuscular junction (NMJ). Each single-bouton synapse is of an ideal size for quantitative anatomical study (e.g., counting active zones or endocytic hot spots). Several contiguous segments of the muscle were dissected from the animal, placed in reptilian saline solution, and divided as needed to provide individual two to three segment nerve–muscle preparations. Details of the muscle’s anatomy, dissection procedure, and saline composition are described elsewhere (Wilkinson and Lichtman, 1985).
Stimulation of nerve terminals. Preparations were placed in a dish on the stage of an inverted microscope equipped with differential interference contrast optics. In most experiments the dish was surrounded by ice so that the bath temperature was ∼7°C to slow clathrin-related activity (see Results). For electrical stimulation the cut end of the muscle nerve was drawn into a hook-in-oil electrode. Negative rectangular pulses (200 μsec) were delivered from an isolated stimulator. The amplitude of the pulses was set supramaximal as judged by visible contraction of the muscle (2–5 V). In some experiments, KCl (60 mm) was equimolar substituted for NaCl to provide high-K+ reptilian saline solution for chemical depolarization of terminals.
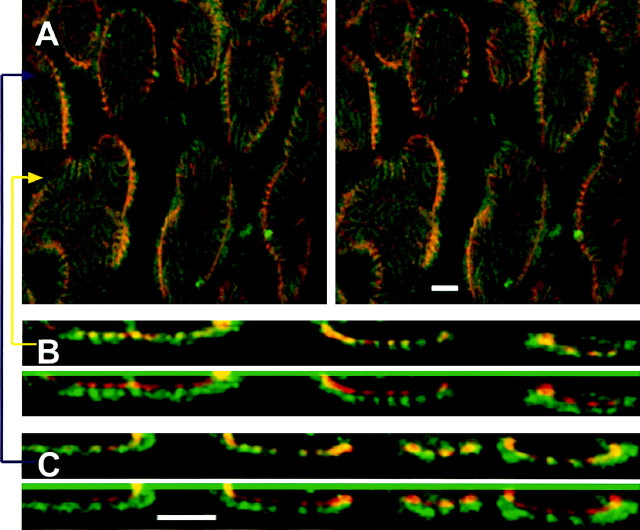
Visualization of postsynaptic folds. The anti-acetylcholine receptor (AChR) antibody mAb22 (rat monoclonal; gift of J. Lindstrom, University of Pennsylvania) was used in initial studies to label the postsynaptic membrane specializations that underlie boutons. Living preparations were incubated at 1:100 dilution for 12 hr at ∼4°C and then fixed as described below and permeabilized (1% Triton X-100; 30 min) before application of the secondary antibody [anti-rat Cy3; 1:100; 2 hr at room temperature (RT)]. To our knowledge, mAb22 is the only reagent available that labels snake AChRs. Postsynaptic secondary folds appeared in three-dimensional images as a bright fingerprint-like pattern. However, use of mAb22 together with sulforhodamine 101 (SR101; see below) was technically difficult because either extremely long incubation times or membrane permeabilization was required for high-resolution imaging with mAb22; the latter was unacceptable because it depleted SR101 from vesicles. We therefore confirmed in separate experiments that the fluorescein-conjugated lectin vicia villosa (FITC-VVA; Sigma, St. Louis, MO) (Scott et al., 1988), which stains synaptic basal lamina, colocalizes with mAb22 (see Fig. 4). To reveal folds, living preparations were incubated in FITC-VVA reptilian saline (67 μg/ml for 30 min at RT) and then washed with reptilian saline for 30 min at RT.
Fig. 4.
Confocal imaging of synaptic membrane and postsynaptic folds. Deconvolved images show light-level colocalization of the basal lamina-specific lectin FITC-VVA (green; synaptic cleft) and the anti-AChR monoclonal mAb22 (red; postsynaptic membrane).A, Stereo view from above, looking through a small region of one nerve terminal toward the muscle below. Note thepeanut-shell shapes of boutons’ invaginations into muscle fiber; this curved surface also identifies the presynaptic membrane within light resolution.Fingerprint-like stripes are postsynaptic folds, which can be seen to radiate into the muscle fiber at the edges of boutons. B, Top, Magnifiedx–z cross section at the yellow arrow in A. Bottom,Red and green images displaced vertically so that the labels can be viewed individually. C, Magnified x–z views as inB taken at the blue arrow inA. Folds are visible and nearly coincident with both labels. Scale bars, 2 μm.
Activity-dependent staining. SR101 (Sigma) and other charged, sulfonated fluorescent molecules have been used to study exocytosis and endocytosis in non-neuronal cells (Wang and Goren, 1987) and to label active reptilian nerve terminals (Lichtman et al., 1985,1989; Lichtman and Wilkinson, 1987; Keifer et al., 1992; Balice-Gordon et al., 1993). The mechanism by which SR101 is taken up in an activity-dependent manner is not known. It is probably not a simple fluid-phase marker because it works better in some preparations (reptilian) than in others [amphibians and mammals (Betz et al., 1992)] and because it stains myelin (and is therefore partially lipophilic, a property it shares with styryl dyes).
SR101 (160 μg/ml) was dissolved in reptilian saline and applied to the bath before the period of electrical stimulation. In initial experiments the preparation was fixed immediately (<2 sec) after stimulation, but this was found unnecessary (see Fig. 7). To improve consistency of quantitative results, subsequent preparations were fixed exactly 1 min after termination of stimulation. Each preparation was rinsed three to six times with fixative (2% formaldehyde in 100 mm sodium phosphate buffer) until clear. For chemical depolarization, SR101 was dissolved into the high-K+reptilian saline before its application; the preparation was then rinsed with fixative. Fixation was for 30 min at RT, followed by a 30 min wash in PBS.
Fig. 7.
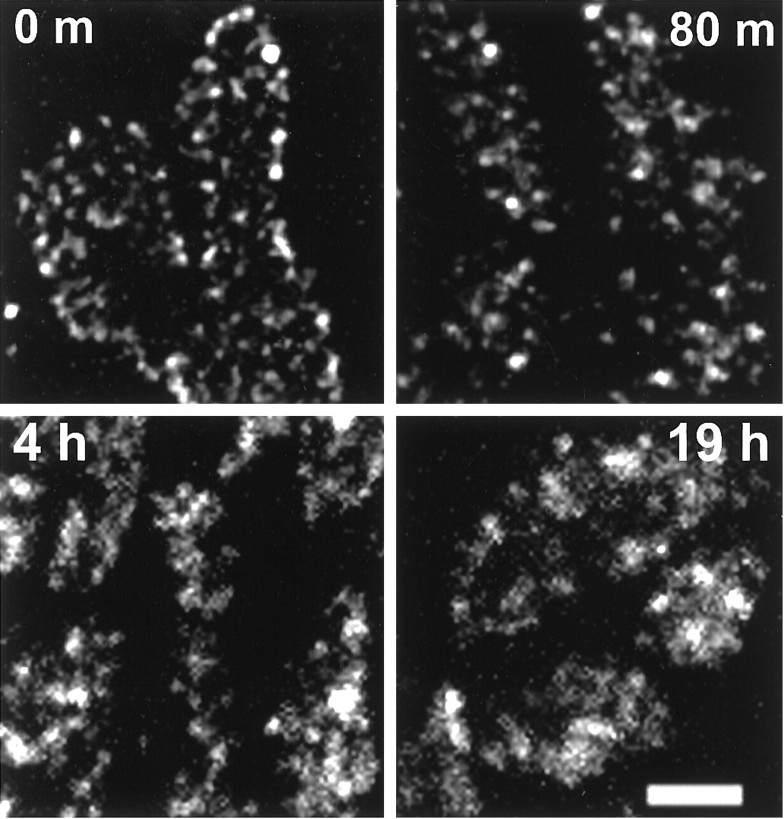
Internalized vesicles at endocytic sites comprise discrete stable pools. Four muscles from one snake were stimulated in an SR101 bath (5 Hz; 30 sec), kept living in reptilian saline (4°C) without further stimulation for the time indicated, and then fixed. Shown are boutons from a typical terminal in each muscle. The labeled vesicles dispersed somewhat but remained in discrete pools, presumably near their original endocytic site. h, Hour;m, minute. Scale bar, 2 μm.
In some experiments FM1-43 (10–13 μg/ml; Molecular Probes, Eugene, OR) was used. The labeling procedure was identical to that of SR101 except that care was taken to keep the preparation as cold as possible (∼4°C) while rinsing with reptilian saline (1 min; frequent solution changes) before fixation. Failure to keep the preparation sufficiently cold resulted in a diffuse rather than punctate distribution of internalized dye. Excepting this difficulty, results using FM1-43 were similar to those using SR101.
Light microscopy. Preparations were whole-mounted on standard slides (Vectashield medium; Vector Laboratories, Burlingame, CA) and imaged with an upright microscope equipped with a Zeiss 63× 1.4 numerical aperture (NA) planapochromat objective and a Bio-Rad MRC 1024 confocal adaptor (Hercules, CA). An krypton–argon laser was used; epifluorescence filter sets were those designed for Texas Red (SR101 and Cy3) and fluorescein (FITC-VVA and FM1-43). The confocal aperture was set to its smallest (diffraction-limited) diameter; collection amplifier gains and offsets were adjusted for optimum visualization of the fluorescence signal and remained unchanged for each series of experiments unless otherwise stated. A stepper motor attached to the microscope’s focusing knob allowed sequential imaging in different focal planes for three-dimensional reconstructions. Usually 15–40 images, at planes separated by 0.25–0.5 μm, were obtained; this increment was approximately one-half of the instrument’s z-axis resolution and was chosen to provide some signal averaging (smoothing) of depth information via oversampling. Stacks comprising 15–40 one- or two-color images (each 512 × 512 pixels; 8 bits of gray scale per color) were stored on the magnetic disk of a computer for subsequent analysis.
Photoconversion and electron microscopy. FM1-43 was used for photoconversion; attempts to photoconvert SR101 fluorescence were not successful. Nerve terminals labeled with FM1-43 were photoconverted using the protocol described below (N. Harata, personal communication) (also see Harata et al., 1998). After stimulation, preparations were washed in ice-cold reptilian saline (10 sec) and then fixed in 2% glutaraldehyde and 100 mm sodium phosphate buffer (20 min). Further washing was (sequentially) in 100 mm glycine and 100 mm sodium phosphate buffer (1.5 hr), 100 mmammonium chloride (5 min), and 100 mm sodium phosphate buffer (10 min). Initial reaction with filtered diaminobenzidine solution (DAB; 1.3 mg/ml; Sigma) was for 15 min in the dark at RT. The preparation was then transferred to an upright microscope equipped with fluorescein epifluorescence optics (100 W Hg lamp) and a water-immersion objective (40×; 0.55 NA). Illumination of one or more labeled terminals in a fixed field of view continued until fluorescence staining was completely bleached and the DAB reaction product was visible (9–15 min). During this time the preparation was kept cool by changes of ice-cold DAB solution every 5 min. After photoconversion, a final rinse in 100 mm sodium phosphate buffer (three times for 10 min each) was performed before preparation for EM.
For transmission EM, preparations were post-fixed in 3% osmium and 100 mm phosphate buffer (1 hr). Regions containing endplate bands were cut from the muscle and then dehydrated, embedded, and processed by standard methods (Wilkinson and Nemeth, 1989) with no additional staining.
Image processing. A deconvolution algorithm (called XCOSM) was applied to most image stacks to improve resolution. XCOSM was written by the Institute for Biomedical Computing at Washington University (St. Louis, MO) and is available from its website (www.ibc.wustl.edu/bcl/xcosm/xcosm.html). The algorithm used a custom point-spread function calculated specifically for the confocal optics described above. Image stacks were converted to stereo pairs using software provided by Bio-Rad.
The number and area of stained regions within boutons were measured by manually outlining each region using Bio-Rad software. By the use of the same software, brightness was measured as the mean pixel value within an outlined area. Measured areas were those of two-dimensional projections of the actual three-dimensional presynaptic membrane surfaces. Pixel brightness was measured in arbitrary units that depended on amplifier settings (range, 0–255). Volumes (i.e., by the use of z-axis information) of stained regions were not measured. Background staining intensity (range, 10–25 brightness units) was measured outside the boutons and subtracted from all measurements. Image sets from which brightness information was obtained and compared (e.g., see data of Fig. 2) were not deconvolved because the XCOSM algorithm does not retain average brightness. Images were printed with a Fujix Pictrography 3000 digital printer (Fuji Photo, Tokyo, Japan).
Fig. 2.
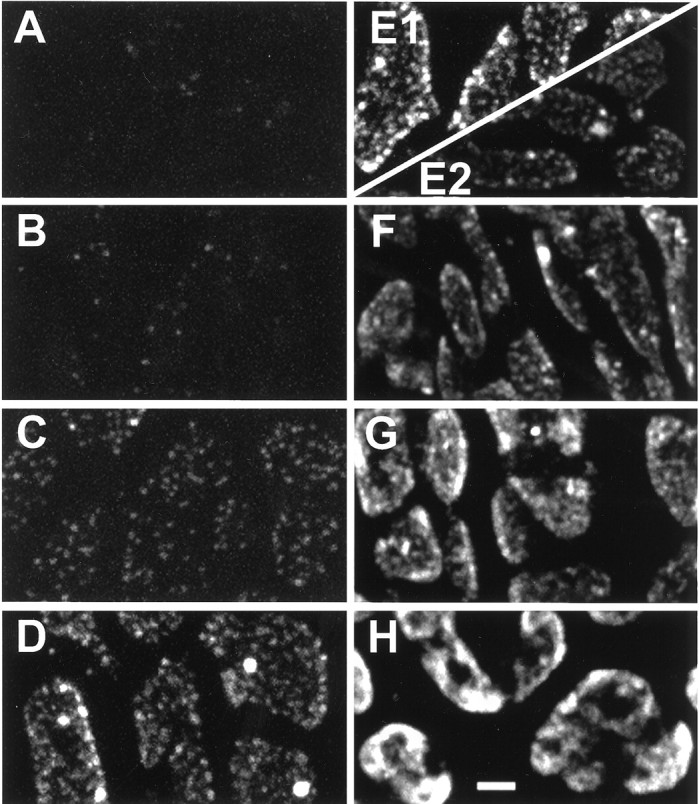
SR101-staining patterns resulting from 5 Hz stimulation of various durations. A–E1, From one snake.E2–H, From a different snake. A,Small dots that were first visible after 5 sec.B–E1, Patterns from 10, 20, 40, and 80 sec stimulation, respectively. Note the monotonic increases in brightness and number of dots, plus the appearance of large structures. E2–H, Patterns from 80, 160, 320, and 640 sec stimulation, respectively. Punctate character is obscured as boutons fill with dye. Photomultiplier gain is reduced inE2–H to prevent saturation. Scale bar, 2 μm.
RESULTS
Characteristics of SR101 uptake
Shown in Figure1A are boutons from a portion of one nerve terminal illustrating the results of a relatively brief activity-dependent staining protocol (375 stimuli delivered over 30 sec) performed at RT. The staining pattern is fairly uniform, excepting dark areas within boutons that contain mitochondria (seeLichtman et al., 1989). Focusing up and down revealed that the probe was distributed throughout the boutons’ vesicular compartment, presumably because of normal vesicle processing that occurred subsequent to endocytosis. The level of detail revealed in Figure1A is typical of results from previous reports using a variety of activity-dependent probes at the snake NMJ, including SR101 (Lichtman et al., 1985, 1989; Lichtman and Wilkinson, 1987), FM1-43 (Connor et al., 1997), and RH 414 (Wilkinson and Lunin, 1994). Figure 1B shows boutons from a different preparation that received fewer stimuli (125 over 25 sec). Staining is still relatively uniform, although a hint of punctate character can be appreciated. In contrast, Figure 1C illustrates results using the same protocol followed in Figure 1Bbut with the bath cooled to ∼7°C, a temperature at which clathrin-mediated endocytosis in mammals is slowed (Anderson et al., 1977). Although dye uptake was diminished, the punctate nature of the staining was enhanced by cooling. As described below, the “dots” of internalized probe appeared just within the bouton’s surface, suggesting that the probe remained near sites of endocytosis, presumably because of a slowing of vesicle-processing steps that use clathrin at reduced temperature. Figure 1D is the same image shown in Figure 1C after enhancement by digital deconvolution. In most experiments we took advantage of the improved resolution provided by cooling the preparation during stimulation and by use of digital deconvolution.
Fig. 1.
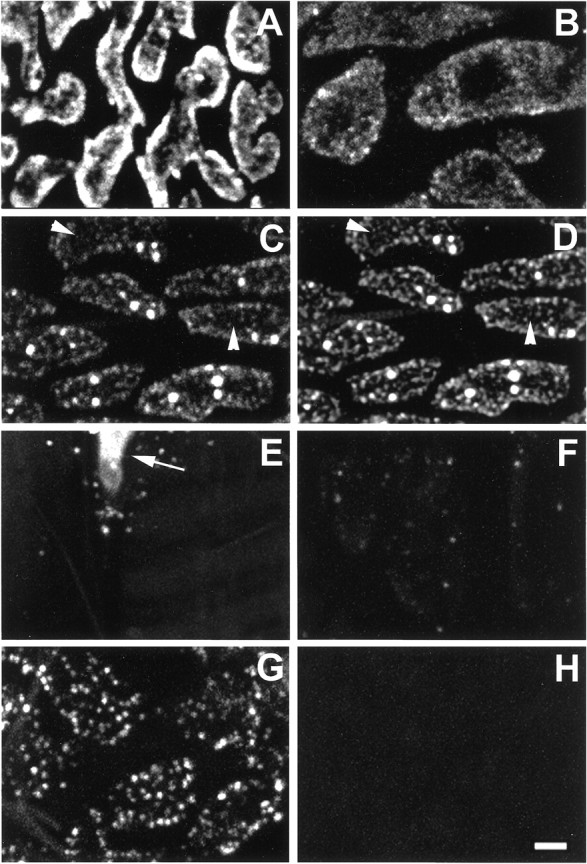
Characteristics of SR101 uptake. Eachpanel in this and subsequent figures shows a region (a few of ∼60 boutons) of one motor nerve terminal reconstructed from a stack of 15–40 diffraction-limited confocal images.A, Moderate stimulation (25 Hz; 1 sec on and 1 sec off for 30 sec) at RT is shown. Boutons were nearly filled with dye.B, Low-frequency stimulation (5 Hz; 25 sec) at RT diminished staining intensity and revealed a punctate pattern.C, Stimulation at ∼7°C (5 Hz; 30 sec) enhanced the punctate character of staining, revealing distinct small dots (arrowheads) and larger near-spherical structures. D, The same image presented in C after digital deconvolution is shown. The overall focus and contrast of the dots(arrowheads) are improved. E, An unstimulated control terminal (40 min in SR101 bath; RT) is shown; thearrow points to the terminal’s myelinated axon.F, A destained terminal (the same snake and staining protocol used in C) resulting from additional stimulation (25 Hz; 90 min; RT) in SR101-free bath is shown.G, Brief chemical stimulation (60 mmK+; 15 sec) produced the same punctate-staining pattern as did neural stimulation (compare with D).H, Dye uptake requires Ca2+. The snake and protocol were the same as that used in G, but stimulation was in a bath containing no added Ca2+. Scale bar, 2 μm.
Dye uptake at reduced temperature depended on neural activity and consequent endocytosis in the usual manner (Betz et al., 1992), according to several criteria. Stimulation was required; there was virtually no specific staining in unstimulated control terminals after 0.5–40 min incubation in a bath containing normal reptilian saline and SR101 (Fig. 1E; n = 61). Additional stimulation in the absence of SR101 resulted in “destaining” (Fig.1F; compare with Fig. 1C). As expected, chemical stimulation (Fig. 1G; KCl depolarization;n = 7) mimicked electrical stimulation, whereas prolonged electrical (n = 2) or chemical (n = 2) stimulation in the absence of added Ca2+ resulted in no labeling (Fig.1H). Stimulation in a bath containing reduced Ca2+ (0.7 mm; n = 1) produced normal punctate staining with reduced intensity. Other methods that internalized SR101 included addition of La3+, Cd2+, or α-latrotoxin to the bath and hypertonicity (250 mm NaCl); these agents are known to increase the rate of spontaneous transmitter release (for review, seevan der Kloot and Molgó, 1994) (data not shown).
Number of stimuli determined SR101-staining pattern
Summarized in Figure2A–H are typical staining patterns observed in response to 5 Hz electrical stimuli delivered for periods ranging from 5 to 640 sec. Approximately 25–50 stimuli (Fig. 2A) were the minimum number required for consistent visible staining with our method (n = 6 preparations). The overall brightness of internalized dye increased with increasing number of stimuli. Several properties of the staining pattern were responsible for this increase. Initially (Fig.2A–C), the dye appeared as a series of small dots that grew in number, size, and brightness with increasing stimulation (see below). With more stimulation (Fig.2D,E), a few large, bright, near-spherical structures appeared; small dots continued to increase in brightness and size but not in number. Finally (Fig.2F–H), the patterns of large structures and small dots became indiscernible as the boutons filled with dye. Similar results were obtained at an average stimulus frequency of 12.5 Hz (25 Hz train gated 1 sec on and 1 sec off; n = 15 preparations; data not shown).
The two types of dye-filled structures comprised nonoverlapping populations. As shown in Figure 3, the dots (0.19 ± 0.07 μm2, mean ± SD;n = 729) were on average nearly an order of magnitude smaller than were the larger structures (1.33 ± 0.42 μm2; n = 29). In terms of brightness, dots (38 ± 29 arbitrary brightness units, mean ± SD; n = 729) were on average dimmer than were the large structures (134 ± 27 units; n = 29) by a factor of approximately three. Experiments described below examined the staining patterns seen with short-duration stimulus trains (≤80 sec or 400 stimuli). Long-duration stimuli that internalized SR101 throughout boutons (Fig. 2H) were not studied.
Fig. 3.
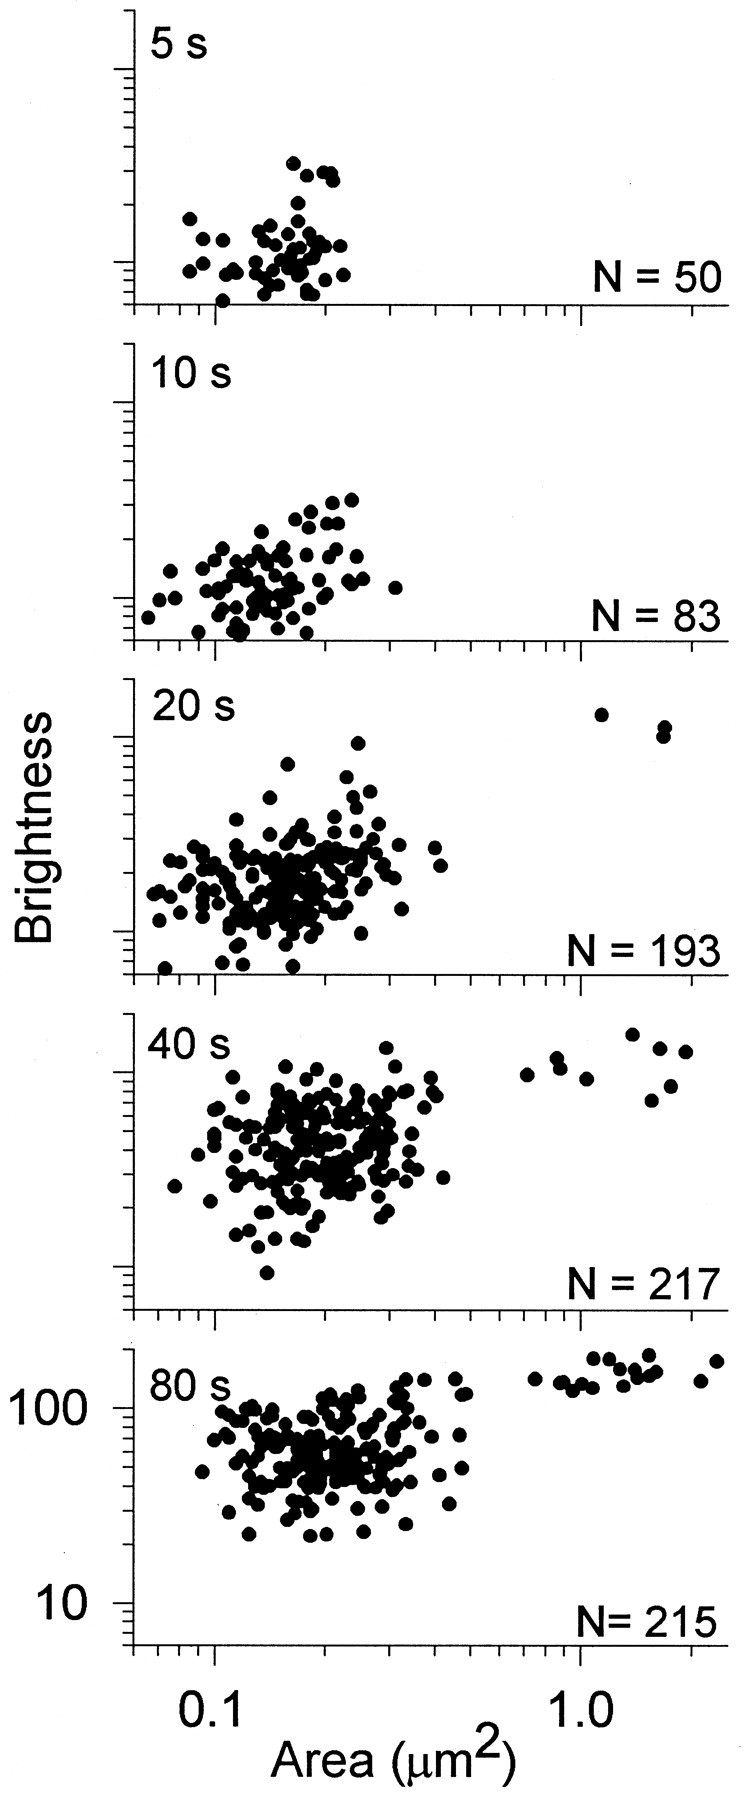
Two types of activity-dependent staining in motor boutons. Shown are double-logarithmic scatterplots comparing two properties, area and brightness, of stained structures in boutons from one snake. Each panel represents one muscle stimulated at 5 Hz for the time indicated. Data points represent all visible structures in nine boutons (3 terminals) from each muscle (total shown at right). Two nonoverlapping populations of structures were seen (clusters at left andright). Small dots (left) increased in brightness as more stimuli were delivered. Large structures (right) were uniformly bright but appeared only in preparations receiving ≥100 stimuli. s, Second.
SR101 dots marked specific sites of endocytosis
To help locate the internalized dye, we labeled the synaptic basal lamina, and hence indirectly the presynaptic membrane that closely opposes it, with the synapse-specific lectin FITC-VVA (Scott et al., 1988). As in amphibians and mammals, reptilian motor terminals are seen in EM to invaginate partially the surface of the innervated muscle fiber. Specifically, each bouton lies in an ∼4 μm in diameter by ∼1 μm deep impression of the postsynaptic membrane. Within this impression the membrane is further invaginated by a series of narrow secondary folds. Viewed from above with three-dimensional confocal imaging, the primary impression resembles the inside of a peanut shell, whereas the secondary folds form a pattern of deep ridges resembling fingerprints. The perimeter of each bouton is the marginal zone or edge of the postsynaptic impression; above it the bouton underlies a Schwann cell sheath but is no longer in contact with the postsynaptic membrane. Postsynaptic folds radiate outward, not downward, at the margin. The postsynaptic membrane, the presynaptic membrane, and the synaptic cleft that separates them all conform to the primary peanut-shell shape (seeWilkinson et al., 1996). Although ultrastructurally distinct, the three surfaces coincide at the light level because the narrow cleft (∼50 nm) is below light resolution. The surface was easily recognizable in three-dimensional images of VVA-labeled NMJs, thereby providing a means to assess the loci of SR101-filled vesicles relative to the presynaptic membrane.
Figure 4A is a three-dimensional reconstruction of part of an NMJ that illustrates high-resolution imaging of the presynaptic surface. Two markers are used, one for AChRs (mAb22; see Materials and Methods) and the other for synaptic basal lamina (FITC-VVA). Note that in each receptor patch the two markers define the same curved surface. The pattern of ridges is also nearly coincident, because secondary folds contain both basal lamina and AChRs. Figure 4, B and C, shows optical cross sections (x–z views) through the image stack along the lines depicted by the arrows in Figure4A. The concave shapes of the cleft and postsynaptic membrane are apparent for each of three bouton profiles shown in Figure4B and four profiles shown in Figure 4C. The red (mAb22) and green (VVA) profiles are nearly coincident. Moreover, each secondary fold appears as a bright spot containing both red and green labels. These experiments confirmed that the resolution using our method was sufficient to demonstrate the known registration between two structures (basal lamina and AChRs) at the level of individual postsynaptic folds, even though the folds’ separation, ∼400 nm, is near the diffraction limit of light microscopy.
We used the same method to examine the spatial relationship between recently endocytosed SR101 and the presynaptic membrane. A total of 87 terminals in 29 snakes were studied. An example is in Figure5. The stereo pair (Fig. 5A) shows part of one NMJ with the basal lamina green. The pattern of SR101 labeling (red) resulted from 45 sec of stimulation at 5 Hz (225 stimuli), a medium stimulus strength in which most of the endocytosed label appears as small dots (see Fig. 2). Two boutons (Fig. 5A, bracketed region) are shown magnified (but not in stereo) in Figure 5B and inx–z profile in Figure 5C. In this and all other experiments (including those in which muscles were fixed <2 sec after stimulation; see Materials and Methods), dots appeared exclusively within a two-dimensional curved surface congruent with and just inside the presynaptic membrane. This is seen most readily by studying the image of Figure 5A near the outer edges of boutons, where the basal lamina and presynaptic membrane are nearly vertical in three-dimensions, or by noting in Figure 5C that the red endocytic sites lie just above the greenbasal lamina.
Fig. 5.
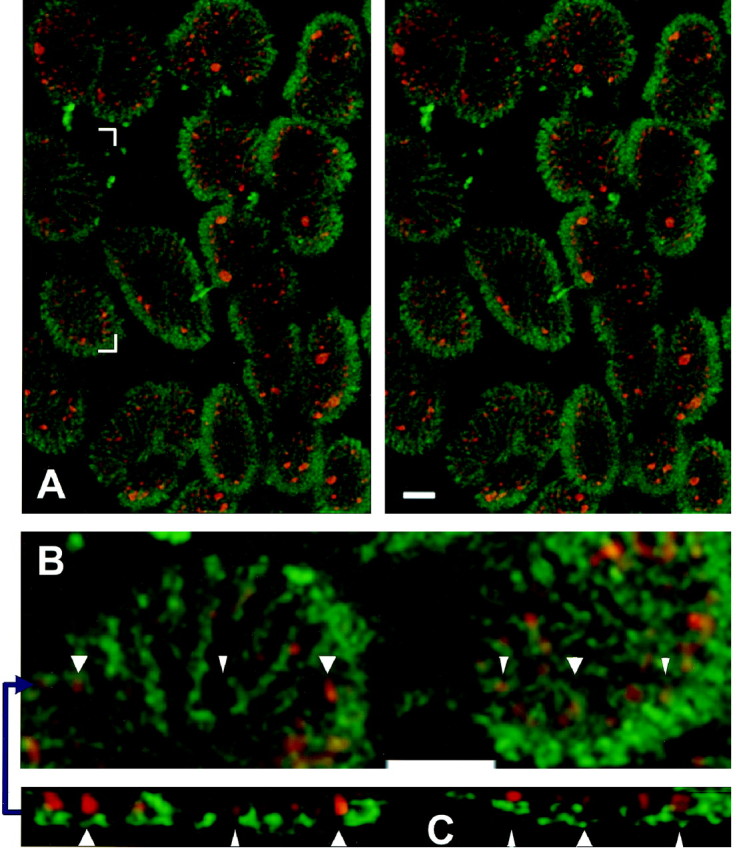
Endocytic sites oppose postsynaptic folds.A, Stereo view as in Figure 4 with the synaptic cleft (FITC-VVA) shown in green. After stimulation (5 Hz; 45 sec), SR101 (red) was internalized at endocytic sites (small dots) and at a few large structures. Sites are confined to loci just inside and congruent with the presynaptic membrane. Moreover, the sites are associated with folds (note especially the edges of boutons).B, Magnified nonstereo view of the bracketed region in A. White arrowheadspoint to six sites. C, View in thex–z plane at the blue arrow in B, showing positions of sites just above the folds. White arrowheads point to the same six sites as the white arrowheads in B. Scale bars, 2 μm.
Dots were not only restricted to a surface corresponding to the presynaptic membrane but were often found at particular loci within that surface—in association with postsynaptic folds. Thus in Figure5C, red SR101 dots appear predominantly above thegreen concentrations of VVA (basal lamina within folds) and not between them. The pattern is also evident in Figure 5B, where red and green are nearly superimposed, and in the three-dimensional image of Figure 5A, particularly near the vertical edges of the boutons where folds spread radially into the muscle fiber. Here the red SR101 dots exhibited the same periodic spatial pattern as the folds, often in register with them. Because the pattern of internalized SR101 dots appeared immediately after brief stimulation and near the presynaptic membrane, each dot in the pattern depicted one or more dye-filled structures at a common site associated with recent endocytosis (see Discussion). Properties of these endocytic sites are described below.
Active zones for endocytosis
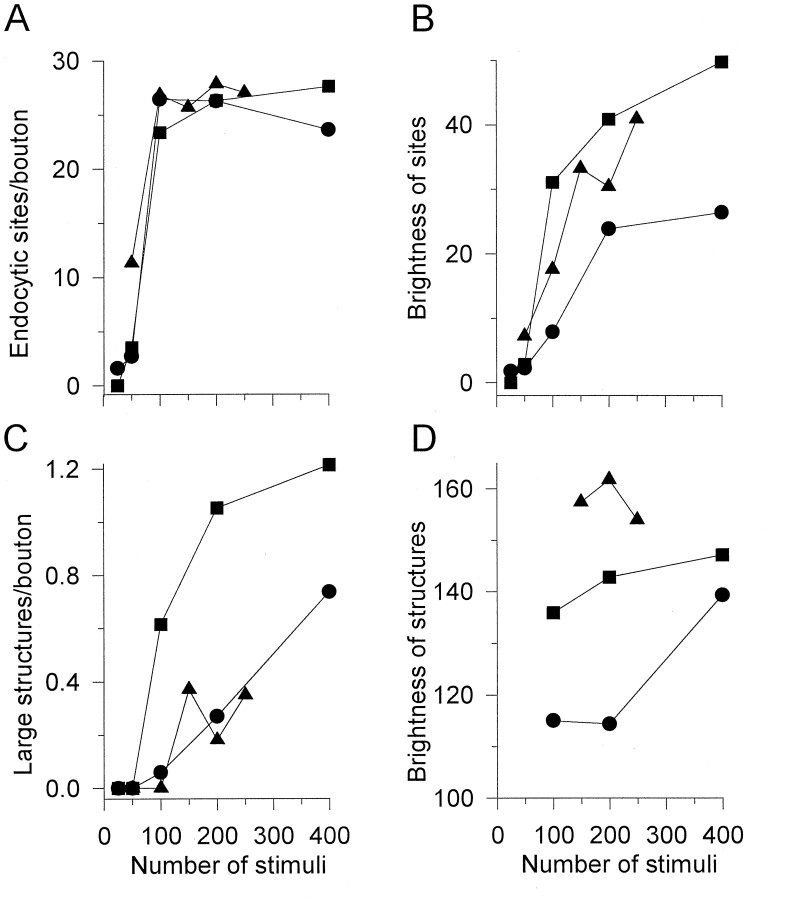
To characterize endocytic sites, we analyzed and compared their pattern among preparations stimulated at 5 Hz for various times. Adjacent segmental components of muscle from one snake were used in each of three sets of experiments (three snakes); results are presented in Figure 6. Surprisingly, the number of visible endocytic sites increased rapidly with initial stimulation and then seemed to saturate at 1.62 ± 0.55 sites/μm2 (mean ± SD; n = 798 boutons in 3 snakes) or ∼26 sites per average-sized bouton (Fig.6A). The brightness of the sites increased monotonically with stimulation. The increase was initially rapid and then appeared to stabilize or increase slowly (Fig.6B; see also Fig. 3).
Fig. 6.
The number of endocytic sites in a bouton is fixed. Data from three snakes (circles,triangles, squares) are shown. Each of five muscles from each snake received a precise number of stimuli in the presence of SR101 (5 Hz; x-axis inA–D). Dots and large structures were analyzed in 33–161 boutons from each muscle. A, The number of visible small endocytic sites increased rapidly with initial stimulation and then remained at a density corresponding to ∼26 sites per average-sized bouton. B, The mean brightness of sites increased monotonically with stimulation. C, The number of visible large structures (putative endosomes) was 0 for 25 and 50 stimuli and then rose monotonically with further stimulation.D, Large structures were brighter than endocytic sites, but their brightness was relatively insensitive to stimulation time; note the expanded brightness scale compared with that inB.
To test whether the number of sites could be increased with nonphysiological stimulation, we added 4-aminopyridine to the bath during stimulation at a concentration (4 μm) that approximately doubles the quantal content at the snake NMJ (data not shown). The drug nearly doubled the mean brightness of the sites compared with that of controls (× 1.9) but did not significantly change their number (1.45 ± 0.51 sites/μm2or ∼24 sites per averaged-sized bouton, mean ± SD;n = 140 boutons in 2 snakes). Thus a fixed number of sites or “endocytic active zones” was available within each bouton. After brief low-frequency stimulation, endocytosed marker accumulated and remained exclusively within these sites.
Although the punctate character of SR101 staining was best preserved by immediate fixation, it persisted in cooled (4°C) unstimulated living preparations for hours after the initial brief stimulation (n = 2 snakes). As shown in Figure7, the pattern of internalized dye remained over time, although each locus became more diffuse, suggesting some limited mobility of dye-filled vesicles within or near it. In contrast, warming the preparation 1 min after stimulation (for 5 min, followed by fixation) largely eradicated the dot pattern, causing the marker to diffuse throughout the terminal (n = 2; data not shown).
Endocytic sites probably contained vesicle clusters
Preliminary transmission EM studies (n = 3 preparations) using the photoconversion reaction product of the styryl dye FM1-43 as an electron-dense marker suggest that the small dot sites are vesicle clusters (Fig.8). Provided stimulation was kept brief, virtually all of the marker was found in vesicles near the presynaptic membrane, consistent with light-level observations in which internalized SR101 (or FM1-43) consisted almost exclusively of small dots (Fig. 2C). However, most EM sections contained only one or a few labeled vesicles per section. An exception was sections cut nearly parallel to the presynaptic membrane, which, occasionally, revealed several vesicles arranged in apparent clusters (Fig. 8B). A striking feature was the relatively frequent capture of putative endocytic profiles seen within the presynaptic membrane. Both the profiles and the fully internalized vesicles appeared to be clathrin-coated, although this observation awaits confirmation with clathrin-specific markers.
Fig. 8.
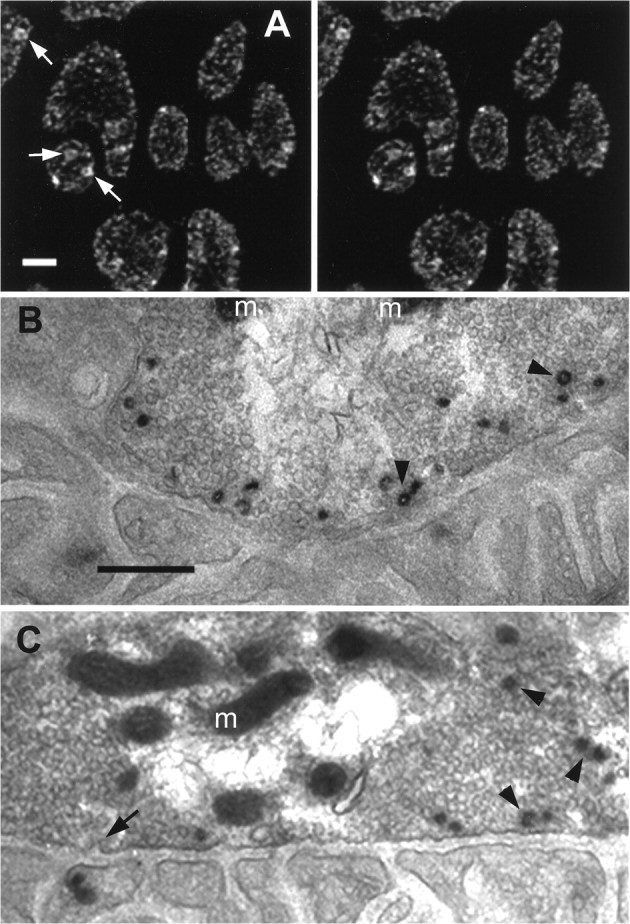
Labeled structures were probably vesicle clusters and endosomes. A, Uptake of the membrane-permeant dye FM1-43 was similar to that of the aqueous dye SR101 but permitted photoconversion for EM. Shown is the staining pattern (stereo view) obtained after brief stimulation (5 Hz; 40 sec) at ∼7°C and fixation as described in Materials and Methods (compare with Fig.2D). Large structures often appeared hollow (arrows), suggesting that they were bound by a membrane and were not clusters of vesicles. B, C, Shown are example EMs of photoconverted FM1-43 from two boutons, as inA but with briefer stimulation (5 Hz; 30 sec) at ∼7°C so that most or all of the internalized dye appeared assmall dots.Sections shown are nearly tangential to the muscle fiber surface and close to the region of the bouton’s deepest invagination. The postsynaptic membrane and its folds arebelow, with the vesicle-filled boutonabove (m, mitochondria). Vesicles containing recently internalized FM1-43 were almost exclusively near the presynaptic membrane, the same location as the small dots seen at light level. Putative endocytic profiles (arrow) appeared in the presynaptic membrane. Some labeled vesicles were coated (arrowheads) as were some endocytic profiles (arrow). Scale bars:A, 2 μm; B, C, 0.5 μm.
Larger SR101-filled structures were probably endosomes
The larger structures containing endocytosed SR101 differed from the discrete endocytic sites. As discussed above, their area and brightness were greater than those of the punctate sites (Fig.3), and they were not seen in preparations that received fewer than ∼100 stimuli. Moreover, among nerve terminals containing both types of structures, the number of small sites remained constant with increasing number of stimuli delivered, while the mean brightness of those sites increased (Fig. 6A,B; note also the systematic upward and rightwarddisplacement of data points in the small dot scatterplots of Fig. 3). In contrast, the number of large structures per bouton increased with increasing number of stimuli, but their brightness did not vary systematically with stimulation. This is illustrated in Figure 6,C and D, which shows the average brightness and number of large structures per bouton as a function of number of delivered stimuli (note also the lack of any trend in brightness or size among the large structure scatterplots of Fig. 3). Finally, large structures appeared predominantly near the outer edges, or marginal zone, of the presynaptic membrane (examples in Figs. 2, 5). Among 26 terminals imaged in three-dimensions and scored visually (three snakes; 376 large structures in 264 boutons total), 316, or 84%, of the large structures were at the marginal zone. These characteristics of size, increasing number with increasing stimulus duration, and location near the marginal zone are those of endosomes visible in EM sections of stimulated motor terminals (Heuser and Reese, 1973), including those of snake (Coniglio et al., 1993). Further evidence that the large structures were endosomes is presented in Figure 8A. Shown is a typical three-dimensional image obtained using FM1-43 instead of SR101, with the stimulation time similar to that of Figure2D (n = 8 terminals from 2 animals). The overall staining pattern using FM1-43 was identical to that obtained with SR101, excepting that many of the large structures appeared to be hollow. Because FM1-43 fluorescence comes from membranes (Betz et al., 1992), the hollow appearance suggests that the large structures are membrane-bound compartments and not clusters of individual small vesicles. We have not yet examined large structures at the EM level. Preliminary EM preparations described above were not stimulated sufficiently to exhibit large structures, and no labeled endosomes were seen.
DISCUSSION
On the basis of the results above, we conclude that two types of endocytic mechanisms coexist within snake neuromuscular boutons. One occurs at a finite number of punctate sites, or hot spots, near exocytic active zones (endocytic active zones). The other occurs at the margins, involves putative endosomal intermediates, and resembles one classical model of endocytosis elaborated by Heuser and colleagues (Heuser, 1990). Preliminary EM evidence suggests that the small dots that mark the punctate sites are vesicle clusters, although there are insufficient data to eliminate additional possibilities. Putative endocytic profiles were seen prominently as well. Both the profiles and the internalized vesicles appeared to be clathrin-coated. EM evidence of the larger structures is not yet available, although they appear endosomal at the light level using FM1-43. In contrast, preparations stimulated at RT contained labeled uncoated vesicles distributed throughout and few endocytic profiles. On the basis of light-level observations, this same result (internalized dye seen throughout the bouton) could be obtained by briefly warming the preparation after stimulation. Presumably, clathrin-mediated steps in the vesicle-processing pathway, such as vesicle budding from the membrane or from endosomes or dissociation of clathrin from vesicles after budding, were slowed by reduced temperature (Anderson et al., 1977) so that those steps became rate-limiting. Thus with brief stimulation individual clathrin-coated vesicles were found “backed up” at hot spots just within the membrane; similarly, additional stimulation formed endosomes [perhaps via macropinocytosis (Takei et al., 1996)] that would otherwise have diminished in size via budding.
We believe that the endocytic paradigms revealed by the slowing of clathrin activity are physiological and not an artifact of reduced temperature for additional reasons as well. Endocytic hot spots were indeed discernable with very brief RT stimulation after we knew what to look for (compare Figs. 1B,D). We found no unexpected temperature dependence (e.g., depression) in postsynaptic potentials or muscle twitch tension with the stimulus paradigms used. Moreover, snakes behaved normally at reduced temperatures (partially submerged in cold water). We emphasize, however, that the well known effects of temperature on clathrin (Anderson et al., 1977) have not to our knowledge been studied in reptiles.
Association between endocytic and exocytic active zones
Punctate hot spots of endocytosis appeared fairly rapidly, being evident in preparations fixed after 5–10 sec of 5 Hz stimulation. These dots were exclusively at the presynaptic membrane, suggesting that bath-applied SR101 (or FM1-43) was visualized near its point of internalization. The density of detectable sites rose rapidly with increasing number of stimuli until it reached a maximum, after ∼100 stimuli, of ∼1.6 sites/μm2 or 26 sites per average-sized bouton. It is known that a typical snake motor bouton exocytoses on average 1.4 vesicles per stimulus at low frequency (Wilkinson et al., 1996). Thus, assuming the simple model of perfect matching between rates of exocytosis and endocytosis (Betz and Bewick, 1993; Ryan et al., 1997), one would expect ∼140 endocytosed vesicles to be randomly distributed among 26 sites after 100 stimuli (i.e., the conditions of Fig. 2C) or 5–6 vesicles per site. Because some, but not all, sites were visible after fewer than ∼100 stimuli, we conclude that approximately the same number (∼5) of internalized dye-containing vesicles (or their equivalent, e.g., as an endosome) was required to visualize a site adequately. Preliminary EM evidence is consistent with this observation. Additional stimulation evidently added dye to each site (making it appear larger and brighter) without recruiting additional sites. The existence of a small, fixed number of endocytic sites indicates that the sites are strongly preferred to random locations for endocytosis (or, indistinguishably, strongly preferred as the common destination for dye internalized nearby) and are therefore associated with demonstrable (although not yet identified) anatomical structures. Additional support for this argument comes from the locations of endocytic sites; they appeared to be fairly uniformly distributed across the presynaptic membrane (anticlustered with a fairly uniform separation as opposed to a random distribution), and they preferentially opposed postsynaptic folds.
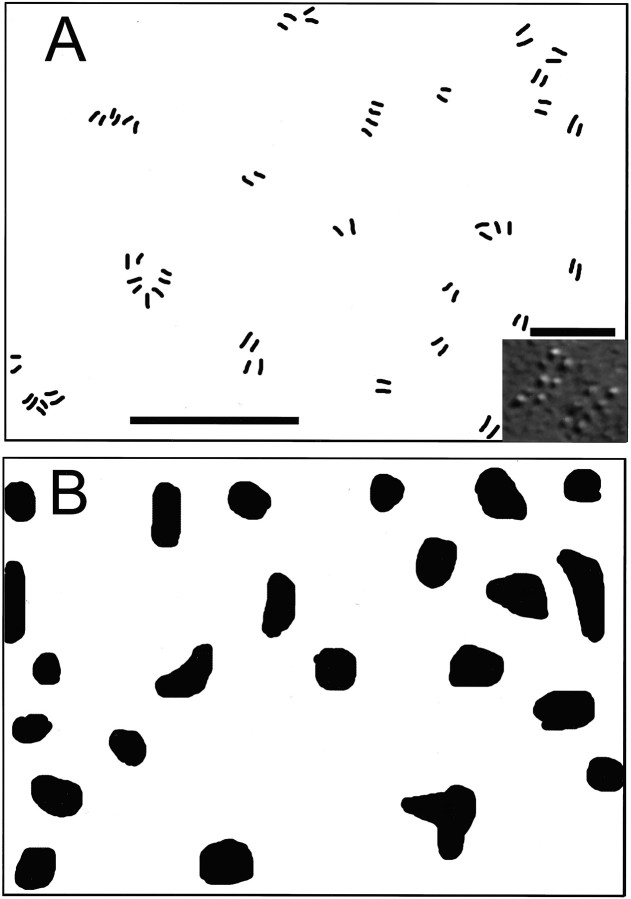
Interestingly, these characteristics apply to exocytic active zones as well; freeze–fracture replicas of lizard (Walrond and Reese, 1985) and snake (H. Teng and J. Heuser, unpublished observations) motor boutons reveal a pattern of active zone profiles remarkably similar to that of the endocytic sites seen here (Fig.9). Moreover, their density [6.3 sites/μm2 (Walrond and Reese, 1985); 5.3 ± 1.1 sites/μm2, mean ± SD; n= 10 boutons (Teng and Heuser, unpublished observations)] is of the same order as the density of endocytic sites in snake. Although hot spots for synaptic vesicle endocytosis have been inferred from immunostaining patterns of clathrin-related proteins (Estes et al., 1996; González-Gaitán and Jäckle, 1997), endocytic sites have not to our knowledge been visualized directly via dye uptake or shown to be finite in number.
Fig. 9.
Relationship between exocytic and endocytic active zones in snake boutons. Camera lucida drawings. A, Region of freeze–fracture replica showing locations of exocytic active zones in the presynaptic membrane. Each double line array represents one active zone (example shown ininset). B, Region of presynaptic membrane of bouton stimulated (5 Hz; 20 sec) in the presence of SR101 using the protocol of Figure 2C. The pattern and density of endocytic sites are similar to those of active zones inA. Scale bars: A, B, 1 μm; inset in A, 100 nm.
We have begun EM and immunostaining to characterize the sites further and to determine whether or not clathrin is associated with them. Thus far, preliminary transmission EM has not revealed structures that might serve as specialized endocytic sites. The only currently known EM structure that might correspond to the sites visualized by our method is the exocytic active zone. The “readily releasable pool” of vesicles associated with each active zone could, if its vesicles recycled independently from those of other pools, account for the attributes of endocytic sites. Each cycling pool would grow in brightness with repeated stimuli until all secreted vesicles were equilibrated with dye or, alternatively, until a second mode of vesicular processing commenced. Initial quantal steps in brightness (corresponding to the filling of individual vesicles) are predicted from such a model (e.g., Ryan et al., 1997; Murthy and Stevens, 1998) but were not observed. However, because approximately five endocytosed quanta represent the lower limit of sensitivity by our method (see above), it is unlikely that quantal increments in brightness would be detected.
Our data provide no insight into the mechanism of endocytosis used at the punctate sites. Kiss and run endocytosis (Fesce et al., 1994), a putative reversal of those steps that result in exocytosis of transmitter, is a possibility. Such a process is expected to be rapid, consistent with the observed internalization of dye within seconds of stimulation. However, dye uptake continued for at least 1 min after brief stimulation [assessed by applying dye after stimulation (seeBetz et al., 1992)]. Spontaneous transmitter release is not significantly elevated during this period. Thus kiss and run seems unlikely as an exclusive mechanism unless one postulates a long kiss. Alternatively, endocytosis might occur separately (e.g., endocytic active zones located near exocytic active zones as paired structures opposing the same postsynaptic fold). The “exo/endo cycling pool” in the Drosophila shibire mutant is located in the periphery of the bouton and, with low-frequency stimulation, operates independently of the bouton’s reserve pool located near its center (Kuromi and Kidokoro, 1998). Cycling pools with similar characteristics have been inferred to exist in CNS boutons as well (for review, seeNeher, 1998). The concept of local cycling pools is also consistent with the putative endocytic profiles found by EM at frog NMJ active zones (Ceccarelli et al., 1973; but see also Heuser, 1990) and at active zones of shibire mutant retinal cells at temperatures that do not permit clathrin assembly (Koenig and Ikeda, 1996). Our data are consistent with these observations and suggest that, in large motor boutons that contain many active zones, many cycling pools are present, each visible as a separate endocytic site. An obvious advantage of this scheme is that each endocytic site retrieves spent vesicular membrane (and its proteins) locally, thereby stabilizing the exocytic active zone in a precise position—opposite its corresponding postsynaptic fold. Note that such an arrangement might not be necessary in amphibian motor terminals, where active zones are functionally isolated from each other because of the terminal’s linear geometry.
Recruitment of a second endocytic mechanism with increased stimulus levels
As discussed above, initial (or low-frequency) activity-dependent endocytosis was strictly associated with exocytic active zones. However, with increased levels of stimulation, a distinct population of larger endocytosed structures was seen as well. These putative newly formed or preexisting endosomes generally fit the classical EM description of events first elaborated by Heuser and Reese (1973) (for review, see Heuser, 1990). Thus our results indicate that the two endocytic mechanisms operated simultaneously at the neuromuscular junction—the archetypal fast chemical synapse in vertebrates. This finding expands reports of two endocytic mechanisms seen elsewhere: in shibire Drosophila mutant photoreceptors (Koenig and Ikeda, 1996), evidenced by two types of endosomal structures, and in goldfish retinal bipolar terminals (von Gersdorff and Matthews, 1994), evidenced by a double-exponential time course of membrane capacitance change after activity. An attractive hypothesis is that two endocytic mechanisms, perhaps related to those described individually in early conflicting classical EM studies of frog nerve terminals, are a common phenomenon at the chemical synapse.
Footnotes
This work was supported by United States Public Health Service Grant NS-24752. We thank W. Betz for helpful discussions, J. Conchello for assistance with digital deconvolution, N. Harata and J. Buchanan for assistance in photoconversion of FM1-43, J. Heuser for freeze–fracture EM, helpful discussions, and suggesting the term endocytic active zone, J. Lindstrom for the generous gift of mAb22, and G. Phillips and P. Bridgman for help with transmission EM.
Correspondence should be addressed to Dr. Robert S. Wilkinson, Department of Cell Biology and Physiology, Washington University School of Medicine, 660 South Euclid Avenue, Box 8228, St. Louis, MO 63110.
REFERENCES
- 1.Anderson RGW, Brown MS, Goldstein JL. Role of the coated endocytic vesicle in the uptake of receptor-bound low density lipoprotein in human fibroblasts. Cell. 1977;10:351–364. doi: 10.1016/0092-8674(77)90022-8. [DOI] [PubMed] [Google Scholar]
- 2.Angleson JK, Betz WJ. Monitoring secretion in real time: capacitance, amperometry and fluorescence compared. Trends Neurosci. 1997;20:281–287. doi: 10.1016/s0166-2236(97)01083-7. [DOI] [PubMed] [Google Scholar]
- 3.Balice-Gordon RJ, Chua CK, Nelson CC, Lichtman JW. Gradual loss of synaptic cartels precedes axon withdrawal at developing neuromuscular junctions. Neuron. 1993;11:801–815. doi: 10.1016/0896-6273(93)90110-d. [DOI] [PubMed] [Google Scholar]
- 4.Betz WJ, Bewick GS. Optical monitoring of transmitter release and synaptic vesicle recycling at the frog neuromuscular junction. J Physiol (Lond) 1993;460:287–309. doi: 10.1113/jphysiol.1993.sp019472. [DOI] [PMC free article] [PubMed] [Google Scholar]
- 5.Betz WJ, Mao F, Bewick GS. Activity-dependent fluorescent staining and destaining of living vertebrate motor nerve terminals. J Neurosci. 1992;12:363–375. doi: 10.1523/JNEUROSCI.12-02-00363.1992. [DOI] [PMC free article] [PubMed] [Google Scholar]
- 6.Ceccarelli B, Hurlbut WP, Mauro A. Turnover of transmitter and synaptic vesicles at the frog neuromuscular junction. J Cell Biol. 1973;57:499–524. doi: 10.1083/jcb.57.2.499. [DOI] [PMC free article] [PubMed] [Google Scholar]
- 7.Ceccarelli B, Grohovaz F, Hurlbut WP, Iezzi N. Freeze-fracture studies of frog neuromuscular junctions during intense release of neurotransmitter. J Cell Biol. 1979;81:163–192. doi: 10.1083/jcb.81.1.178. [DOI] [PMC free article] [PubMed] [Google Scholar]
- 8.Coniglio LM, Hendricks GM, Parsons RL. Effects of lanthanum at snake twitch and tonic muscle fibre endplates. J Physiol (Lond) 1993;466:405–419. [PMC free article] [PubMed] [Google Scholar]
- 9.Connor EA, Dunaevsky A, Griffiths DJ, Hardwick JC, Parsons RL. Transmitter release differs at snake twitch and tonic endplates during potassium-induced nerve terminal depolarization. J Neurophysiol. 1997;77:749–760. doi: 10.1152/jn.1997.77.2.749. [DOI] [PubMed] [Google Scholar]
- 10.Estes PS, Roos J, van der Bliek A, Kelly RB, Krishnan KS, Ramaswami M. Traffic of dynamin within individual Drosophila synaptic boutons relative to compartment-specific markers. J Neurosci. 1996;16:5443–5456. doi: 10.1523/JNEUROSCI.16-17-05443.1996. [DOI] [PMC free article] [PubMed] [Google Scholar]
- 11.Fesce R, Grohovaz F, Valtorta F, Meldolessi J. Neurotransmitter release: fusion or “kiss and run”? Trends Cell Biol. 1994;4:1–4. doi: 10.1016/0962-8924(94)90025-6. [DOI] [PubMed] [Google Scholar]
- 12.González-Gaitán M, Jäckle H. Role of Drosophila α-adaptin in presynaptic vesicle r recycling. Cell. 1997;88:767–776. doi: 10.1016/s0092-8674(00)81923-6. [DOI] [PubMed] [Google Scholar]
- 13.Harata N, Buchanan J, Tsien RW. Visualization of endocytosed synaptic vesicles in hippocampal neurons. Soc Neurosci Abstr. 1998;24:77. [Google Scholar]
- 14.Heuser JE. The role of coated vesicles in recycling of synaptic vesicle membrane. In: Clementi F, Meldolesi J, editors. Neurotransmitter release: the neuromuscular junction. Academic; San Diego: 1990. pp. 83–96. [Google Scholar]
- 15.Heuser JE, Reese TS. Evidence for recycling of synaptic vesicle membrane during transmitter release at the frog neuromuscular junction. J Cell Biol. 1973;57:315–344. doi: 10.1083/jcb.57.2.315. [DOI] [PMC free article] [PubMed] [Google Scholar]
- 16.Heuser JE, Reese TS. Structural changes after transmitter release at the frog neuromuscular junction. J Cell Biol. 1981;88:564–580. doi: 10.1083/jcb.88.3.564. [DOI] [PMC free article] [PubMed] [Google Scholar]
- 17.Heuser JE, Reese TS, Landis DMD. Functional changes in frog neuromuscular junctions studied with freeze-fracture. J Neurocytol. 1974;3:109–131. doi: 10.1007/BF01111936. [DOI] [PubMed] [Google Scholar]
- 18.Jackson MB. Presynaptic excitability. Int Rev Neurobiol. 1995;38:201–251. doi: 10.1016/s0074-7742(08)60527-9. [DOI] [PubMed] [Google Scholar]
- 19.Keifer J, Vyas D, Houk JC. Sulforhodamine labeling of neural circuits engaged in motor pattern generation in the in vitro turtle brainstem-cerebellum. J Neurosci. 1992;12:3187–3199. doi: 10.1523/JNEUROSCI.12-08-03187.1992. [DOI] [PMC free article] [PubMed] [Google Scholar]
- 20.Koenig JH, Ikeda K. Synaptic vesicles have two distinct recycling pathways. J Cell Biol. 1996;135:797–808. doi: 10.1083/jcb.135.3.797. [DOI] [PMC free article] [PubMed] [Google Scholar]
- 21.Kuromi H, Kidokoro Y. Two distinct pools of synaptic vesicles in single presynaptic boutons in a temperature-sensitive Drosophila mutant, shibire. Neuron. 1998;20:917–925. doi: 10.1016/s0896-6273(00)80473-0. [DOI] [PubMed] [Google Scholar]
- 22.Lichtman JW, Wilkinson RS. Properties of motor units in the transversus abdominis muscle of the garter snake. J Physiol (Lond) 1987;393:355–374. doi: 10.1113/jphysiol.1987.sp016827. [DOI] [PMC free article] [PubMed] [Google Scholar]
- 23.Lichtman JW, Wilkinson RS, Rich MM. Multiple innervation of tonic endplates revealed by activity-dependent uptake of fluorescent probes. Nature. 1985;314:357–359. doi: 10.1038/314357a0. [DOI] [PubMed] [Google Scholar]
- 24.Lichtman JW, Sunderland W, Wilkinson RS. High resolution imaging of synaptic structure with a simple confocal microscope. New Biol. 1989;1:75–82. [PubMed] [Google Scholar]
- 25.Matthews G. Neurotransmitter release. Annu Rev Neurosci. 1996;19:219–233. doi: 10.1146/annurev.ne.19.030196.001251. [DOI] [PubMed] [Google Scholar]
- 26.Murthy VN, Stevens CF. Synaptic vesicles retain their identity through the endocytic cycle. Nature. 1998;392:497–501. doi: 10.1038/33152. [DOI] [PubMed] [Google Scholar]
- 27.Neher E. Vesicle pools and Ca2+ microdomains: new tools for understanding their roles in neurotransmitter release. Neuron. 1998;20:389–399. doi: 10.1016/s0896-6273(00)80983-6. [DOI] [PubMed] [Google Scholar]
- 28.Roberts R, Teng H, Wilkinson R. Patterns of nerve terminal endocytosis revealed by activity dependent staining. Mol Biol Cell. 1997;8:413a. [Google Scholar]
- 29.Ryan TA, Reuter H, Smith SJ. Optical detection of a quantal presynaptic membrane turnover. Nature. 1997;388:478–482. doi: 10.1038/41335. [DOI] [PubMed] [Google Scholar]
- 30.Scott LJ, Bacou F, Sanes JR. A synapse-specific carbohydrate at the neuromuscular junction: association with both acetylcholinesterase and a glycolipid. J Neurosci. 1988;8:932–944. doi: 10.1523/JNEUROSCI.08-03-00932.1988. [DOI] [PMC free article] [PubMed] [Google Scholar]
- 31.Takei K, Mundigl O, Daniell L, De Camilli P. The synaptic vesicle cycle: a single vesicle budding step involving clathrin and dynamin. J Cell Biol. 1996;133:1237–1250. doi: 10.1083/jcb.133.6.1237. [DOI] [PMC free article] [PubMed] [Google Scholar]
- 32.Teng H, Cole J, Wilkinson RS. Discrete endocytic “active zones” in snake neuromuscular boutons. Soc Neurosci Abstr. 1998;24:77. [Google Scholar]
- 33.van der Kloot W, Molgó J. Quantal acetylcholine release at the vertebrate neuromuscular junction. Physiol Rev. 1994;74:899–991. doi: 10.1152/physrev.1994.74.4.899. [DOI] [PubMed] [Google Scholar]
- 34.von Gersdorff H, Matthews G. Dynamics of synaptic vesicle fusion and membrane retrieval in synaptic terminals. Nature. 1994;367:735–739. doi: 10.1038/367735a0. [DOI] [PubMed] [Google Scholar]
- 35.Walrond JP, Reese TS. Structure of axon terminals and active zones at synapses on lizard twitch and tonic muscle fibers. J Neurosci. 1985;5:1118–1131. doi: 10.1523/JNEUROSCI.05-05-01118.1985. [DOI] [PMC free article] [PubMed] [Google Scholar]
- 36.Wang Y, Goren MB. Differential and sequential delivery of fluorescent lysosomal probes into phagosomes in mouse peritoneal macrophages. J Cell Biol. 1987;104:1749–1754. doi: 10.1083/jcb.104.6.1749. [DOI] [PMC free article] [PubMed] [Google Scholar]
- 37.Wilkinson RS, Lichtman JW. Regular alternation of fiber types in the transversus abdominis muscle of the garter snake. J Neurosci. 1985;5:2979–2988. doi: 10.1523/JNEUROSCI.05-11-02979.1985. [DOI] [PMC free article] [PubMed] [Google Scholar]
- 38.Wilkinson RS, Lunin SD. Properties of “reconstructed” motor synapses of the garter snake. J Neurosci. 1994;14:3319–3332. doi: 10.1523/JNEUROSCI.14-05-03319.1994. [DOI] [PMC free article] [PubMed] [Google Scholar]
- 39.Wilkinson RS, Nemeth PM. Metabolic fiber types of snake transversus abdominis muscle. Am J Physiol. 1989;256:C1176–C1183. doi: 10.1152/ajpcell.1989.256.6.C1176. [DOI] [PubMed] [Google Scholar]
- 40.Wilkinson RS, Son Y-J, Lunin SD. Release properties of isolated neuromuscular boutons of the garter snake. J Physiol (Lond) 1996;495:503–514. doi: 10.1113/jphysiol.1996.sp021610. [DOI] [PMC free article] [PubMed] [Google Scholar]


