

Abstract
Extracellular recordings were obtained from the ganglion cell (GC) layer during correlated spontaneous bursting activity (SBA) in the immature turtle retina. Pharmacological agents were bath-applied, and their effects on burst and correlation parameters were determined.
SBA requires synaptic transmission. It was blocked in the presence of curare and mecamylamine, two cholinergic nicotinic antagonists, and enhanced with neostigmine, a cholinesterase inhibitor. SBA was profoundly inhibited during blockade of glutamatergic receptors with the broad spectrum antagonist kynurenate and it vanished with 6,7-dinitroquinoxaline-2–3-dione (DNQX) and 6-cyano-7-nitroquinoxaline-2,3-dione (CNQX), two AMPA/kainate receptor antagonists. Blockade of NMDA receptors withd(−)-2-amino-5-phosphonopentanoic acid (d-AP-5) led only to a modest reduction in SBA. Blockade of GABAA receptors with bicuculline prolonged the duration of the bursts. Inhibition of GABA uptake with nipecotic acid led to a decrease in burst rate. Blockade of K+ channels with cesium (Cs+) and tetraethylammonium (TEA) led to a dramatic decrease in excitability. Burst propagation between neighboring GCs was reduced by K+ channel blockade. Gap junction blockade had no consistent effect on bursts or correlation parameters. None of these drugs had a strong effect on the refractory period between bursts.
We conclude that correlated SBA in immature turtle GCs requires both cholinergic nicotinic and glutamatergic (mainly through AMPA/kainate receptors) synaptic transmission. GABAergic activity modulates the intensity and the duration of the bursts. Extracellular K+ is involved in lateral activity propagation and increases retinal excitability, which may be required for burst generation.
Keywords: retinal ganglion cells, development, spontaneous activity, spontaneous bursts, acetylcholine, glutamate, extracellular potassium, turtle
Ganglion cells (GCs) in the immature vertebrate retina fire correlated spontaneous bursts of spikes (for review, see Catsicas and Mobbs, 1995; Copenhagen, 1996; Wong, 1999). In mammals, this spontaneous bursting activity (SBA) occurs while GCs establish connections with their central targets (Goodman and Shatz, 1993; Katz, 1993; Mooney et al., 1996; Shatz, 1996), and it influences the pattern of the formation of eye-specific connections (Penn et al., 1998). In addition, SBA influences developing retinal receptive fields in the immature turtle retina (Sernagor and Grzywacz, 1996).
The critical role played by this immature SBA in the formation of neural connectivity in the developing vertebrate visual system has led to an increasing interest in trying to unravel the cellular mechanisms underlying the generation and propagation of these bursts. SBA was first detected in newborn rabbit retinal GCs (Masland, 1977). In the embryonic rat retina, SBA was found to be synchronized between neighboring GCs (Maffei and Galli-Resta, 1990). This observation was extended to a larger retinal area in cat and ferret, using an array of extracellular electrodes (Meister et al., 1991; Wong et al., 1993). Using this approach, it was observed that correlated SBA in neighboring GCs results in waves propagating across the retina.
There still is a great deal of controversy regarding the mechanisms underlying the generation and propagation of retinal SBA. There is a general consensus about the requirement of synaptic activity and involvement of acetylcholine in the generation mechanism of these bursts (Masland, 1977; Feller et al., 1996; Sernagor and Grzywacz, 1996). However, it is still unclear whether the lateral propagation of activity might be, at least partially, mediated by a diffusing agent such as extracellular K+, which accumulates in the extracellular space during electrical activity. This possibility has been raised in a biophysical model of the cellular mechanisms underlying these retinal waves (Burgi and Grzywacz, 1994a,b). Calcium imaging studies show that the waves are restricted to the inner retina [GCs and amacrine cells (ACs)] in mammals (Wong et al., 1995; Wong and Oakley, 1996; Feller et al., 1996). However, waves penetrate all retinal layers in the chick embryo before completion of synaptogenesis (Catsicas et al., 1998). Not all cells are active during each wave (Wong et al., 1995; Sernagor and O’Donovan, 1997). A recent study demonstrates that SBA in ACs is closely correlated with that in GCs and that both cell types are driven by synaptic input (Zhou, 1998). These studies suggest the involvement of specific retinal networks (for a theoretical study, see Feller et al., 1997) and argue against passive diffusion of an extracellular agent. A counter argument comes from simulations (Burgi and Grzywacz, 1994b), which show that inclusion of GCs with different intrinsic properties can result in waves that do not activate all GCs.
Using quantitative methods developed elsewhere (Grzywacz and Sernagor, 1999), we have performed a thorough pharmacological study of SBA in turtle immature retinal GCs to investigate possible mechanisms of burst generation and propagation, including specific synaptic transmission, extracellular K+, and gap junctions.
Parts of this study have been previously published in abstract form (Sernagor and Grzywacz, 1993, 1994) and briefly addressed in another publication (Sernagor and Grzywacz, 1996) (this study reported that curare blocks SBA in the turtle retina).
MATERIALS AND METHODS
Preparation. We used the turtle speciesPseudemys scripta elegans. The age of the embryos was determined according to specific stages of embryonic development (Yntema, 1968). Here, we pool data from embryos from stages S23 [approximately embryonic day 40 (∼E40)] and older, and from hatchlings 0–2 weeks old. We did not discriminate between ages for these experiments. However, most experiments were performed at embryonic stage 25, during the last week of gestation, because bursts are robust at this stage. Enucleation, extraction of the retina, and superfusion were performed as described elsewhere (Sernagor and Grzywacz, 1995a). The composition of the Ringer’s solution (Ariel and Adolph, 1985) was the following (in mm): 96.5 NaCl, 2.6 KCl, 2.0 MgCl2, 31.5 NaHCO3, 10 glucose, 10 HEPES, and 4 CaCl2, pH 7.4 (when oxygenated). The preparation was superfused at a rate of 4–10 ml/sec with oxygenated Ringer’s solution kept at 26–28°C.
The different pharmacological agents were purchased from Sigma (St Louis, MO) and Tocris Cookson (Bristol, UK). All pharmacological agents were bath-applied through the superfusate. For halothane, cold liquid halothane was bubbled in one bottle that was connected to the superfusate bottle through a large piece of plastic tubing. Gaseous halothane, coming through the tube, was bubbling into the superfusate solution. The superfusate was thus saturated with halothane. Changes in activity caused by the drugs were sampled 15 min after replacement of the solution in the experimental chamber. For each condition, the activity was continuously recorded for 10–15 min. Unless stated in specific parts of the Results section, all changes in activity were reversible after washout of the drug. Except for Figure1, the figures do not illustrate recovery of the activity after washout.
Fig. 1.
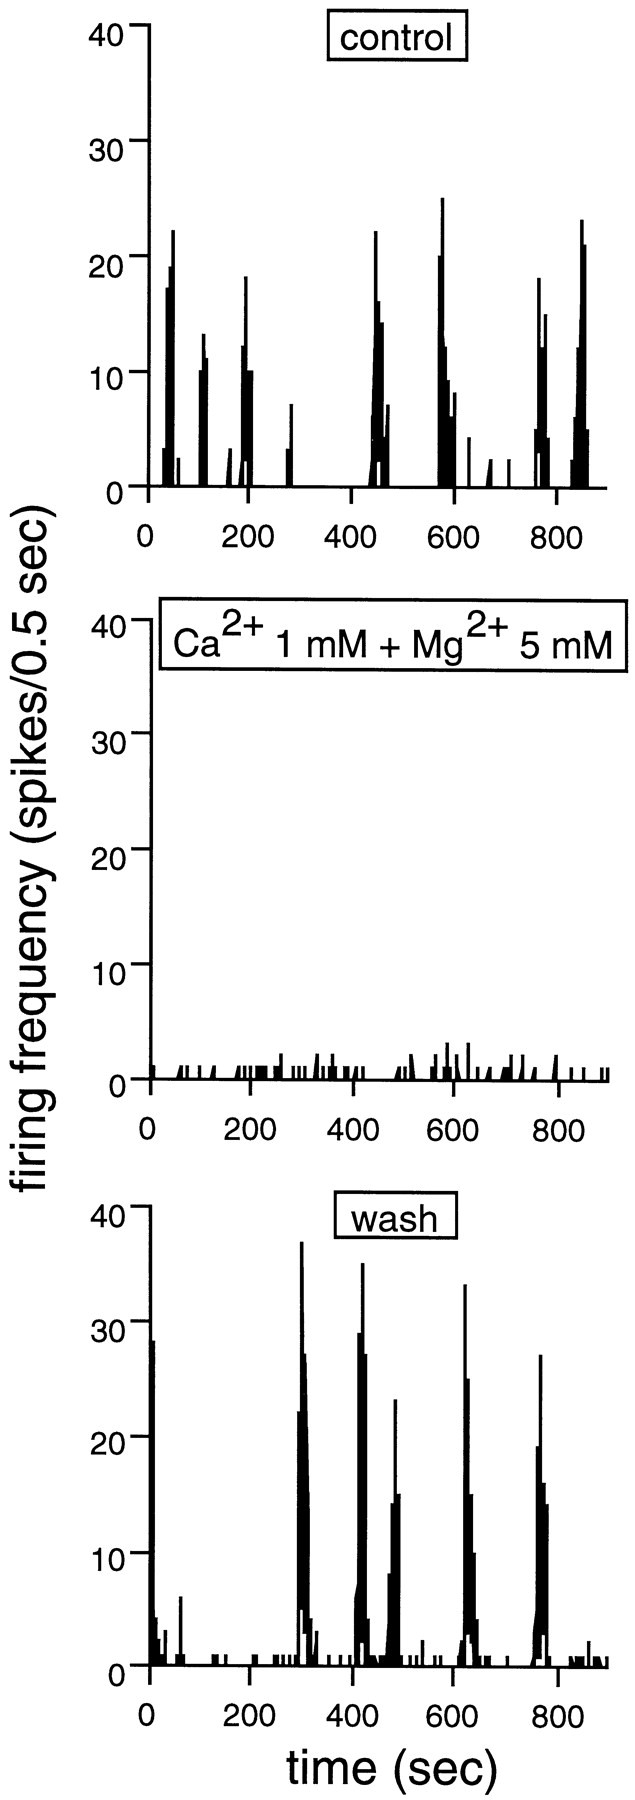
Synaptic transmission is required for spontaneous bursting. The spontaneous bursts are illustrated by changes in firing rate (in 0.5 sec bins) over a period of 900 sec. Burst onset and offset is indicated by abrupt changes in firing rate. Top panel, Control. The cell fires in strong, well defined bursts of spikes. Middle panel, When synaptic transmission is blocked by decreasing [Ca2+]out to 1 mm and increasing [Mg2+]out to 5 mm, the spontaneous bursts completely disappear. The only spontaneous activity left in these conditions is some isolated, sporadic spikes.Bottom panel, Wash. When [Ca2+]out and [Mg2+]out are returned to normal levels, strong spontaneous bursts reappear. Stage 25 GC.
Recordings. The electrodes were parylene-coated with 2–5 MΩ resistance (A-M Electrophysiology). The signals were amplified 10,000 times by a Dagan 2400 amplifier (Dagan, Minneapolis, MN) at frequency bandwidth of 300–3000 Hz and 50 Hz notch filter. The threshold for spike detection was set manually with a window discriminator (model WD-2; Dagan), and the value of the threshold was fed automatically to the computer. Data collection was performed by an analog-to-digital board (model DAS 16; Keithley MetraByte, Rochester, NY) installed on an IBM-compatible personal computer running ASYST 2.1 (ASYST, Rochester, NY). Collection of data was done in direct memory access mode in intervals of 1.2 sec with a sampling frequency of 10,000 Hz (12,000 samples). Data were also copied every 1.2 sec. During the next 1.2 sec collection period, the time of occurrence and the waveforms of the spikes were extracted from the last copy and stored on disk for off-line analysis. The times of spike occurrence were those of signal threshold crossing. The stored spike waveform comprised 20 points (2 msec) such that the first 3 points (0.3 msec) were before threshold. The total duration of data collection was 972 sec per cell or cell cluster. All the data came from dark-adapted retinas (light adaptation tends to weaken the spontaneous activity; data not shown).
Data analysis. As mentioned above, we used quantitative methods developed elsewhere to analyze the recorded data (Grzywacz and Sernagor, 1999). The following is a brief description of these methods. The spike waveforms were used to assign spikes to different cells. We plotted correlograms of amplitude versus duration (spike indices). To determine whether the electrode recorded from more than one cell, we looked for clusters in the distribution of spike indices (Meister et al., 1991). Next, we used an objective statistical criterion to decide whether a given cell exhibited bursts of spikes. Figuring out whether the activity comprised bursts was important. For instance, although all spiking activity may be developmentally relevant, models for the development of retinal orientation selectivity suggest that wave-induced bursts may underlie the emergence of this property (Burgi and Grzywacz, 1997, 1998). In our statistical criterion for “burstiness”, for each spike we measured its delay from the preceding spike and the delay until the next spike. These two delays were the abscissa and ordinate of a point in a correlogram displaying the data for all spikes. If there were no bursts, then these delays should be uncorrelated, which would be reflected in the correlogram. Otherwise, the spikes inside bursts tended to have preceding and after delays shorter than those that did not occur during bursts, resulting in a positive correlation in the correlogram. It is important to understand that this method was not for defining a burst, but to decide whether the spiking activity comprised bursts. In other words, the method told us whether the spikes were homogeneously distributed in time or appeared in clumps. Although this was often not necessary, particularly in control conditions, pharmacological treatments could occasionally change the spiking pattern so dramatically that it became questionable whether bursts were present, although the activity was still strong. This method eliminated any subjective judgment of burstiness.
Once a cell was classified as bursting, we continued to cluster the data into bursts. For this purpose, we used an agglomerative hierarchical clustering method of the single-linkage type (Johnson and Wichern, 1992). The rationale for using agglomerative hierarchical clustering is that bursts are clusters of spikes, and this method is the most common form of cluster analysis. The rationale for single-linkage clustering is its tendency to pick out long stringlike clusters (as bursts of spikes) and its simplicity of implementation. A key parameter in any clustering procedure is the preset threshold for halting the procedure. To determine this threshold, we used the histogram of interspike intervals. The logic behind using this histogram is that during bursts these intervals are short, between bursts these intervals are long, but during the refractory period after bursts (intermediate intervals), there are very few events. Consequently, the histogram is expected to be bimodal and to have a minimum separating the modes. In other words, the histogram has a minimum at times longer than the intervals inside bursts and thus appropriate to be the preset threshold. [This definition of threshold assumes a refractory period after the burst. Direct, independent evidence for such a refractory period comes from the autocovariance function (Grzywacz and Sernagor, 1999). Assuming a refractory period to define the burst does not influence conclusions of how refractoriness affects burst properties, as for instance, making a burst duration shorter or longer.] As in any statistical techniques, there are errors when using such a threshold and clustering, but these errors are small (Grzywacz and Sernagor, 1999).
Besides this clustering of bursts, we have also looked at the autocovariance and cross-covariance functions obtained from the entire spike train without preprocessing. [Although many authors call these or related functions by the name of autocorrelation, we prefer to use the autocovariance nomenclature. In the statistical literature, correlation is covariance normalized by SDs (Johnson and Wichern, 1992).] Full development of the covariance formulas appear elsewhere (Grzywacz and Sernagor, 1999). Although other retinal investigators use related formulas (Arnett and Spraker, 1981; Mastronarde, 1983; Meister et al., 1991), it was necessary to derive the formulas from scratch to obtain the treatment of the statistical significance of the covariance. To determine whether the covariance in a given bin was statistically significantly different from zero, a χ2 test was used on the counts in each bin.
From the bursts in individual cells, we quantified several temporal variables that are described in Results. The different burst variables were expressed as the median of the distribution of values ± the median absolute deviation (MAD). These parameters were preferred over the more standard mean and SE, because median and MAD are robust and less sensitive to outliers (Sprent, 1993; in normal distributions, 1 MAD = 0.675 SDs). Significance statistical tests used to determine the effect of different drugs on these burst parameters were the pairedt test (one-sided) or the χ2 test. Although some samples contained a small number of cells, the drug effects were large compared with the SD of the samples. Hence, it was possible to ascertain that these effects were statistically significant.
Two bursts in neighbor cells were considered to be synchronized if after clustering they overlapped temporally, regardless of their delay (defined as the delay between their onsets). However, not all bursts were synchronized with bursts in neighbor cells. To quantify the degree of synchronization, we calculated the safety factor (SF) for a “propagating” excitation to hit both cells. LetK1 and K2 be the number of nonsynchronized bursts in the neighboring cells 1 and 2, respectively. Let K1,2 be the number of synchronized bursts in these cells. Then the safety factor is:
| Equation 1 |
We think of the denominator of this equation as the total number of burst-related events invading the cells and of the numerator as the number of events that actually hit both cells. Finally, we measured two kinds of Kendall’s τ correlation coefficients on burst-measured variables. One kind was between every pair of the variables extracted from bursts in a single cell. The other kind was between the same variables extracted from synchronized bursts in neighbor cells.
RESULTS
Statistical analysis of bursts in control condition
We described the statistics of SBA in developing turtle GCs in control conditions elsewhere (Grzywacz and Sernagor, 1999). Because these control bursts provide the context for the pharmacology described here, we begin with a short summary of their properties. The interburst interval (IBI), burst duration (BD), firing rate (FR) within the burst, and number of spikes per burst varied widely among cells and from burst to burst in a single cell. Part of this variability was caused by the positive correlation between a BD and the IBI preceding that burst. This correlation indicated the influence of a refractory period on properties of bursts. Further evidence of such a refractoriness came from the autocovariance function of the burst, which gives the tendency of a spike to occur a given amount of time after another spike. This function showed a positive phase (between ≈10 msec and 10 sec) followed by a negative one (between 10 and >100 sec), suggestive of burst refractoriness. The bursts seemed to be propagating from cell to cell, because there was a long (symmetrically distributed) delay between the activation of two neighbor cells (median absolute delay, 2.3 sec). However, the activity often failed to propagate from one cell to the other (median SF, 0.59). The number of spikes per burst in neighbor cells was correlated, indicating lateral propagation of excitation. At least two factors contribute to the excitability during bursts, because in 27 of 29 pairs of cells, the positive phase of the cross-covariance function (similar to autocovariance but for two cells, see also Fig. 6) had a temporally asymmetric fast component (1–3 msec) followed by a temporally symmetric slow component (1 msec to 10 sec).
Fig. 6.

During spontaneous correlated bursting, glutamatergic activity appears to contribute to activity synchronization between neighboring cells by coordinating individual spikes between these cells. This figure illustrates the cross-covariance function for activity synchronization in two pairs of cells (A, B). The cross-covariance, expressed as hits per square second is plotted as a function of the delay in milliseconds in logarithmic units. Each point represents cross-covariance values averaged in intervals beginning at the abscissa of the point and extending half log unit. In normal conditions, this function has two components, a fast (1–3 msec), asymmetric component, followed by a slow, symmetric component. A, Theleft panel shows the control cross-covariance function for one pair of GCs. The right panel illustrates the function for the same pair of cells in the presence of 75 μm kynurenate. The fast, asymmetric component disappears in these conditions, whereas the slow component is unchanged. We may therefore conclude that glutamatergic activity is important for that early component of the function, which reflects synchronization between individual spikes in neighboring cells. B, Theleft panel illustrates the control cross-covariance function for another pair of cells (notice the difference in scale with that of A). The right panel illustrates the function for the same pair of cells in the presence of 100 μm kynurenate. Both components of the function have nearly vanished in these conditions. Values between −100 and 100 μsec are delimited by the vertical dotted lines. Stage 25 GCs.
Spontaneous bursting requires synaptic transmission
To verify whether synaptic connections are required either for the generation or propagation of spontaneous discharges in developing turtle retinal GCs, we have blocked synaptic release by reducing the calcium (Ca2+) concentration in the Ringer’s solution to 1 mm and increasing the magnesium (Mg2+) concentration to 5 mm. Figure 1shows that during blockade of synaptic transmission, SBA vanished in a stage 25 GC. Only few sporadic spikes are occasionally detected under these conditions. As soon as Ca2+ and Mg2+ concentrations are readjusted to normal, vigorous bursts reappear. In all GCs investigated under low-Ca2+, high-Mg2+ conditions (n = 10), spontaneous bursts disappeared, and cells remained quiescent for as long as Ca2+concentration was low.
We also used cobalt (Co2+), a calcium channel blocker, to block synaptic transmission. SBA disappeared in the presence of 20–100 μm Co2+(n = 5). However, at low Co2+concentrations (2–10 μm), the bursts sometimes did not vanish completely, and we could observe spontaneous activity during partial blockade of synaptic transmission (Table1). In three of four cells, we could measure burst parameters under these conditions. BD and the number of spikes per burst respectively decreased by 54.1 ± 2.4 (p ≤ 0.024; t test) and 60.7 ± 9.0% (p ≤ 0.1; t test).
Table 1.
Effects of pharmacological agents on burst parameters
| Experimental conditions | BR | BD | BVNBR | FR | Spikes/burst | Spikes/trial | N |
|---|---|---|---|---|---|---|---|
| Co2+, 2–10 μm | NS | ↓54.1 ± 2.4 | ↓55.5 ± 1.4 | NS | ↓60.7 ± 9.0 | ↓37.4 ± 2.7 | 4 (3) |
| p ≤ 0.024 | p ≤ 0.047 | p ≤ 0.1 | p ≤ 0.038 | ||||
| Curare, 2 μm | ↓81 ± 16 | ↓71 ± 13 | ↓72.5 ± 3.7 | ↓62 ± 26 | NS | ↓72.5 ± 4.8 | 4 |
| p ≤ 0.034 | p ≤ 0.05 | p≤ 0.067 | p ≤ 0.15 | p ≤ 0.0001 | |||
| Mecamylamine, 2–4 μm | ↓100 ± 0 | ? | ? | ? | ? | ↓97.0 ± 0.8 | 5 |
| p ≤ 0.0001 | p ≤ 0.0005 | ||||||
| Neostigmine, 2–5 μm | ↑260 ± 130 | ↓42 ± 20 | ↑170 ± 160 | ↑300 ± 200 | NS | ↑114 ± 30 | 6 (5) |
| p ≤ 0.01 | p ≤ 0.036 | p≤ 0.066 | p ≤ 0.008 | p ≤ 0.01 | |||
| Kynurenate, 75–100 μm | ↓71 ± 13 | NS | NS | NS | NS | ↓66.7 ± 7.3 | 6 (5) |
| p ≤ 0.0085 | p ≤ 0.014 | ||||||
| DNQX, 10 μm | ↓100 ± 0 | ? | ? | ? | ? | ↓90.3 ± 9.1 | 3 |
| p ≤ 0.0001 | p ≤ 0.025 | ||||||
| CNQX, 5–10 μm | ↓87 ± 13 | NS | NS | NS | NS | ↓82 ± 12 | 3 |
| p ≤ 0.025 | p ≤ 0.025 | ||||||
| d-AP-5, 10–25 μm | NS | NS | NS | NS | NS | ↓37 ± 6 | 6 |
| p ≤ 0.001 | |||||||
| Bicuculline, 2–4 μm | NS | ↑28.7 ± 9.3 | ↑88 ± 44 | NS | ↑59 ± 53 | ↑44 ± 15 | 8 (7) |
| p ≤ 0.016 | p ≤ 0.0078 | p ≤ 0.064 | p ≤ 0.0039 | ||||
| Nipecotic acid, 10 μm | ↓36 ± 18 | NS | ↓60 ± 10 | NS | ↓46 ± 15 | ↓56 ± 7 | 5 |
| p ≤ 0.05 | p ≤ 0.0025 | p ≤ 0.025 | p ≤ 0.001 | ||||
| Cs+ + TEA, 50 μm | ↓59 ± 11 | ↑44 ± 18.3 | ↓49 ± 29 | ↓26.9 ± 9.9 | ↓16 ± 11 | ↓66.3 ± 5.7 | 6 (4) |
| p ≤ 0.0002 | p ≤ 0.038 | p≤ 0.13 | p ≤ 0.01 | p ≤ 0.12 | p≤ 0.0071 | ||
| Halothane | ↓30 ± 13 | ↑70 ± 37 | NS | NS | ↑41 ± 28 | NS | 4 |
| p ≤ 0.026 | p ≤ 0.033 | p ≤ 0.069 |
This table summarizes changes in BR, BD, BVNBR, FR within bursts, number of spikes per burst, and number of spikes per trial during several pharmacological treatments, as explained in the first column of the table. The values are expressed as median ± MAD (see Materials and Methods). Upwards arrows indicate an increase and downwards arrows indicate a decrease in the values. NS, Not significant. The question marks indicate parameters that could not be measured, because there were no bursts left, but only sporadic, random spiking activity. Numbers in parentheses in the N column indicate the number of cells used to calculate all bursts parameters. (Sometimes not all cells can be used because a pharmacological treatment abolishes bursting activity.) The number before the parentheses indicates the total number of cells used, at least to measure the total number of spikes per trial (which can always be measured, even when there are no bursts left).
These results suggest that SBA requires synaptic transmission.
The nature of synaptic connections involved in spontaneous bursting
Excitatory connections
Acetylcholine. Two major excitatory synaptic inputs onto retinal GCs are mediated by glutamate (from bipolar cells) and acetylcholine (from ACs) (Dowling, 1987). Spontaneous compound postsynaptic currents recorded from mammalian GCs and propagation of spontaneous retinal waves receive a major contribution from nicotinic cholinergic activity (Feller et al., 1996). To test the possible role of acetylcholine in initiation or propagation of periodic bursting of GCs in our preparation, we have investigated the effects of cholinergic antagonists and potentiators on SBA.
Spontaneous bursting of GCs completely vanishes in the presence ofd-tubocurarine (curare) and mecamylamine, two antagonists of the cholinergic nicotinic receptor. The left panel of Figure2 illustrates the effect of increasing the concentration of curare (from 2 to 4 μm) on spontaneous bursting in a stage 25 GC. In the presence of a 2 μm concentration of the drug, both the burst rate (BR) and FR within each burst decreased, and when the concentration was doubled, the bursts disappeared. The decrease in FR is detailed on the right panel of Figure 2, which shows the distribution of interspike intervals during the recording trials. As the curare concentration increases, and the activity is slowed down, the distribution is shifted to the right, toward larger intervals between spikes. From bimodal (upper and middle panels), the interspike intervals distribution becomes unimodal in the presence of 4 μm curare.
Fig. 2.

Cholinergic nicotinic activity is required for the generation of spontaneous bursting activity. This figure illustrates how spontaneous bursts gradually disappear (both BR and FR within bursts decrease before the bursts disappear) as the concentration of curare, a cholinergic nicotinic blocker, increases from 2 to 4 μm. Top panels, Control. Middle panels, Activity in the presence of 2 μm curare.Bottom panels, Activity in the presence of 4 μm curare. Left panels, The spontaneous bursts are illustrated by changes in firing rate (in 0.5 sec bins) over a period of 900 sec, such as in Figure 1. Only isolated spontaneous spikes remain while the cholinergic activity is blocked. Right panels, Histograms illustrating interspike intervals (in logarithmic units) measured under different experimental conditions. As the curare concentration increases, the activity is slowed down, resulting in a shift to the right in the interspike intervals. In themiddle histogram, values represents those of the intervals between isolated spontaneous spikes. Stage 25 GC.
In our hands, when the curare concentration was above 2 μm, SBA disappeared completely. In the presence of 2 μm curare, it was still possible to detect weak SBA in four cells. Under this concentration, BR, BD, FR within bursts, and total number of spikes recorded per trial respectively decreased by 81 ± 16 (p ≤ 0.034; t test), 71 ± 13 (p ≤ 0.05; t test), 62 ± 26 (p ≤ 0.15; t test), and 72.5 ± 4.8% (p ≤ 0.0001;t test) (Table 1).
SBA completely vanished in the presence of mecamylamine (2–4 μm), a highly specific nicotinic antagonist (n = 5). Only few sporadic spikes were detected in the presence of the drug. The total number of spikes recorded per trial decreased by 97.0 ± 0.8% (p ≤ 0.0005;t test).
On the other hand, blockade of cholinergic muscarinic receptors with atropine (1–2 μm) had no systematic effect on spontaneous bursting of GCs (n = 3).
In another set of experiments, acetylcholine activity was enhanced rather than suppressed. This was achieved with neostigmine, a cholinesterase inhibitor. In the presence of neostigmine (2–5 μm), SBA in GCs increased dramatically. Figure3 shows the enhancement of spontaneous activity by neostigmine in two adjacent GCs that were recorded from with the same electrode. (The high level of synchronization in activity between neighboring cells is well illustrated in this example.) Although bursts are substantially shorter in the presence of neostigmine, their frequency of occurrence is much higher. The effect of neostigmine was so pronounced that occasionally it was not possible to record extracellular spikes, possibly because of receptor desensitization or substantial membrane depolarization and shunting during the bursts. However, the enhancement of SBA by neostigmine was evident after the drug had been washed out of the chamber and lasted hours. In such cases, these effects were measured immediately after the drug had been washed away. Neostigmine increased BR, FR within bursts, the total number of spikes per trial, and the burst versus nonburst ratio (BVNBR) by 260 ± 100 (p ≤ 0.01;t test), 300 ± 200 (p ≤ 0.008;t test), 114 ± 30 (p ≤ 0.01;t test), and 170 ± 160% (p ≤ 0.066; t test) respectively, whereas BD was 42 ± 20% (p ≤ 0.036; t test) shorter (n = 6; results pooled from two cells in the presence of the drug, and four cells whose activity was sampled after neostigmine had been washed out) (Table 1). The decrease in BD could, for example, result from desensitization of the cholinergic receptors because of strong and prolonged activation by acetylcholine or from a direct effect of neostigmine on the cholinergic receptors (Slater et al., 1986; Backman et al., 1996). We cannot rule out that another refractory-like mechanism is accelerated by the stronger activity, contributing to the termination of the bursts, and thus to the reduction in BD.
Fig. 3.

Spontaneous bursting activity is enhanced during blockade of cholinesterase with neostigmine. SBA is illustrated as in previous figures. The two top traces show the control activity in two adjacent GCs recorded by the same electrode.Cell #2 has stronger bursts and also more “background” activity superimposed on the bursts. The bursts are well synchronized between these two cells. The two bottom traces show the SBA in the presence of 2 μmneostigmine. Bursts are much more frequent. The firing rate within bursts has significantly increased in cell #1. The bursts are much shorter than before enhancement of acetylcholine activity by the drug. The activity is highly synchronized between the cells (see Fig. 4). Stage 25 GC.
As expected during enhanced excitability and assuming that SBA of an individual GC is part of a wave spreading across the retina (Grzywacz and Sernagor, 1999), the degree of correlation in activity between neighboring GCs was increased in the presence of neostigmine (Table2). Figure4 shows that the SF for activity propagation between cells increased by 62 ± 20% (p ≤ 0.014; χ2 test) for the two pairs of cells recorded from in the presence of neostigmine. Accordingly, the magnitude of the late, symmetric component of the cross-covariance function (Grzywacz and Sernagor, 1999) increased by 180 ± 120% (p ≤ 0.18; ttest). In contrast, the duration of this component decreased by 80 ± 10% (p ≤ 0.17; t test), consistent with the reduction in BD.
Table 2.
Effects of pharmacological agents on activity propagation
| Experimental conditions | SF | Amplitude early cross-covariance component | Amplitude late cross-covariance component | Duration late cross-covariance component | N (pairs of cells) |
|---|---|---|---|---|---|
| Neostigmine, 2–5 μm | ↑62 ± 20 | NS | ↑180 ± 120 | ↓80 ± 10 | 2 |
| p ≤ 0.014 | p ≤ 0.18 | p ≤ 0.17 | |||
| Kynurenate, 75 μm | ↓38 ± 23 | ↓88.6 ± 6.4 | ↓87.5 ± 1.8 | ↑230 ± 230 | 3 (2) |
| p ≤ 0.08 | p ≤ 0.065 | p ≤ 0.13 | p ≤ 0.15 | ||
| DNQX, 5 μm | NS | ↓66.4 ± 4.7 | ↓53.1 ± 4.5 | NS | 1 |
| p ≤ 0.023 | p ≤ 0.027 | ||||
| d-AP-5, 20 μm | NS | ↓40 ± 23 | ↓50 ± 21 | NS | 1 |
| p ≤ 0.05 | p ≤ 0.01 | ||||
| Bicuculline, 2–4 μm | ↑39 ± 23 | ↑40 ± 30 | ↑52 ± 27 | NS | 4 (2) |
| p ≤ 0.087 | p ≤ 0.12 | p ≤ 0.14 | |||
| Nipecotic acid, 10 μm | NS | ↓66 ± 6 | ↓66 ± 6 | NS | 2 |
| p ≤ 0.005 | p ≤ 0.005 | ||||
| Cs+ + TEA, 50 μm | ↓35.3 ± 5.8 | ↓91.4 ± 8.6 | ↓90 ± 3.3 | ↑233.3 ± 0.0 | 3 (2) |
| p ≤ 0.03 | p ≤ 0.046 | p ≤ 0.0009 | p ≤ 0.0001 |
This table summarizes changes in SF, the amplitude of the early and late components of the cross-covariance function, and the duration of the late component. Same table conventions as for Table 1. The numbers in parentheses in the N column indicate the number of pairs of cells used to calculate the SF, whereas the numbers before the parentheses indicate the number of pairs of cells used for the cross-covariance function (which can always be measured, even when there is no bursting activity). The errors in cases with a N of 1 were obtained by splitting the data into six equal-sized, nonoverlapping subsets and computing the variation across them.
Fig. 4.

The safety factor for activity propagation between adjacent cells increases during blockade of acetylcholinesterase with neostigmine. The figure illustrates the median SF for two pairs of cells in control conditions and in the presence of 2 μmneostigmine. When acetylcholinesterase is inhibited, the SF increases by 61.8%. Median absolute deviation bars. Stage 25 GCs.
These results demonstrate that acetylcholine, acting via nicotinic receptors, is indispensable for SBA in immature turtle retinal GCs. Moreover, they show that acetylcholine either mediates or facilitates the propagation of the activity between neighboring GCs.
Glutamate. We have shown that acetylcholine is indispensable for SBA in GCs. However, that does not exclude the possible involvement of another excitatory neurotransmitter. GCs in the developing turtle retina not only burst spontaneously, but they also respond to light (Sernagor and Grzywacz, 1995a), suggesting that glutamatergic synapses are functional at these stages of development and may be implicated in SBA as well. To test this possibility, we have looked at SBA during glutamatergic blockade. The effective concentration of the drugs used was determined by the disappearance of light responses.
The bursts almost vanished in the presence of kynurenate (75–100 μm), a broad spectrum glutamatergic antagonist. The left panels of Figure 5 illustrate the effect of 75 μm kynurenate on SBA in a stage 25 GC. The robust SBA of this cell, 27 bursts during the recording trial, decreased to the point that only nine bursts could be detected during blockade of the glutamate receptors. The FR during four of these bursts was considerably lower than in the control conditions. BR and the total number of spikes decreased respectively by 71 ± 13 (p ≤ 0.0085; t test) and 66.7 ± 7.3% (p ≤0.03; t test) (n = 6), indicating a profound decrease in excitability (Table 1).
Fig. 5.

Glutamatergic activity, acting mainly through AMPA/kainate receptors, is required for the generation of spontaneous bursting activity. SBA is illustrated as in previous figures. Theleft panels illustrate how kynurenate, a broad spectrum glutamate antagonist, profoundly reduces SBA. Top left panel, SBA in control conditions (S25 GC). The cell fires robust, regular bursts of spikes. There is very little background, sporadic activity in this cell. Bottom left panel, SBA in the presence of 75 μm kynurenate, a broad-spectrum antagonist of glutamatergic receptors. BR is significantly reduced in these conditions. The right panels illustrate that SBA disappears in the presence of CNQX, an AMPA/kainate receptor antagonist. Top right panel, SBA in control conditions (S26 GC). Bottom right panel, SBA in the presence of 10 μm CNQX. SBA completely vanishes in these conditions, leaving only few sporadic spikes. The disappearance of light responses was used in both experiments to demonstrate effective glutamate receptor blockade.
To investigate the type of glutamatergic receptors responsible for the dramatic reduction in SBA, we have looked at the effects of DNQX and CNQX, two specific AMPA/kainate antagonists and d-AP-5, a specific NMDA antagonist. All these glutamatergic antagonists significantly reduced SBA (Table 1). However, the reduction was much more pronounced during blockade of AMPA/kainate receptors than during blockade of NMDA receptors. The number of spikes per trial fell by 47 ± 25% in the presence of 5 μm DNQX (n = 2). Doubling the concentration led to the complete disappearance of SBA, and the activity decreased by 90.3 ± 6.4% (n = 3) (p ≤ 0.025;t test). Similar results were obtained in the presence of CNQX (5 and 10 μm). For this drug, the number of spikes per trial fell by 82 ± 12% (n = 3) (p ≤ 0.025; t test). This was because of a 87 ± 13% fall in BR (including two cells for which SBA completely disappeared) (p ≤ 0.025;t test). The right panels of Figure 5 illustrate how CNQX (10 μm) abolished SBA in a S26 GC. No other single-cell parameters were influenced by DNQX and CNQX (perhaps because of the very small number of bursts left for statistical analysis).
During blockade of NMDA receptors with d-AP-5 (10–25 μm), there was a modest but significant decrease in the number of spikes per trial, 37 ± 6% (n = 6) (p ≤ 0.001; t test). No other single-cell factor changed systematically across cells.
Blockade of glutamatergic receptors had no significant effect on BD.
These results show that glutamatergic activity is required for the generation of SBA. This mechanism acts mainly via AMPA/kainate receptors, whereas NMDA receptors do not seem to bring a major contribution to SBA.
The weaker excitability of the retina during glutamate blockade led to a decrease in the probability of activity propagation from GCs to their neighbors (Table 2), as indicated by a 38 ± 23% (p ≤ 0.08; χ2 test) decrease in the SF for propagation between cells in the presence of 75 μm kynurenate (calculated from two pairs of cells). At 100 μm, the highest concentration of kynurenate tested, the bursts became so weak that both the fast and the slow components of the cross-covariance function were profoundly reduced (see the example in Fig. 6B) (measured in three pairs of cells). However, in the presence of a 75 μm concentration of the drug, the early, asymmetric component disappeared, whereas the late, symmetric component was unchanged, as is illustrated in Figure 6A. SBA became so weak in the presence of CNQX and DNQX that it was difficult to assess the effects of these drugs on activity propagation between cells except for one pair of cells in the presence of 5 μmDNQX. For this drug, the results were similar to those obtained with kynurenate. Both the early and the late peak of the cross-covariance function decreased with DNQX, but the effect was significantly more pronounced on the early component (66.4%) than on the late one (53.1%). In the presence of d-AP-5, the early and the late peak of the cross-covariance function decreased respectively by 40 and 50% (measured in one pair of cells), consistently with the general decrease in the number of spikes. However, these changes were not consistent with those observed in the presence of kynurenate and DNQX, where the early, fast component was significantly more affected than the late one. Hence, glutamate appears to contribute to neighbor-cell synchronization through a fast (1–3 msec) mechanism, rather than the slow, symmetric mechanism that mediates propagation of bursts. This contribution seems to be through AMPA/kainate receptors.
Inhibitory connections
GABA. Studies of mammalian retinas (Feller et al., 1996; Fischer et al., 1998; Zhou, 1998) as well as the present study indicate that ACs are involved in SBA of immature GCs. Besides acetylcholine, many ACs also release GABA (Vaney, 1990; Criswell and Brandon, 1992; O’Malley et al., 1992). This inhibitory neurotransmitter is thus a good candidate for modulation of the SBA. GABA, acting on GABAA receptors, was found to potentiate SBA in early postnatal ferret GCs and to inhibit SBA during the period of on–off segregation in the geniculate nucleus (Fischer et al., 1998).
We have looked at spontaneous activity during blockade of GABAA receptors with the competitive antagonist bicuculline (1–4 μm). The frequency of occurrence of the bursts was not affected by the drug. However, the duration of the bursts increased significantly (Table 1). Figure 7 shows the extent of the increase in BD during a recording trial in a stage 25 GC. Before blockade of GABAA receptors, all bursts had a duration of ∼2 sec on average (Fig. 7B, open triangles). In the presence of 2 μmbicuculline, the duration of the bursts (filled circles) increased up to 30 sec, with a median of 8.4 ± 5.6 sec, whereas BR was unchanged. In seven cells, BD increased by 28.7 ± 9.3% (p ≤ 0.015; ttest). Not surprisingly, there was an increase in the number of spikes per burst and the number of spikes per trial of 59 + 53 (p ≤ 0.064; t test) and 44 ± 15% (p ≤ 0.0039; t test), respectively. The BVNBR increased by 88 ± 44% (p ≤ 0.0087; t test), and the SF for activity propagation between cells by 39 ± 23% (p ≤ 0.08; χ2 test) (Table 2). Bicuculline abolished the positive correlation between the IBIs and the number of spikes per burst.
Fig. 7.

GABA modulates the strength of the spontaneous bursts through GABAA receptors. A, These panels illustrate SBA, represented as in previous figures. Theleft panel shows SBA in control conditions, and theright panel in the presence of 2 μmbicuculline, a GABAA receptor antagonist. The bursts are longer in the presence of bicuculline, whereas BR does not change.B, This graph shows the duration of all the bursts (same GC as in A) occurring during the recording trial in control conditions (open triangles) and in the presence of 2 μm bicuculline (filled circles). The bursts are significantly longer when the GABAergic activity is blocked. Stage 25 GC.
These observations show that GABA, acting via GABAAreceptors, modulates the intensity (BD) of SBA in turtle GCs.
When GABA uptake was inhibited with nipecotic acid (10 μm), SBA was significantly weaker (Table 1), with a 56 ± 7% reduction in the total number of spikes per trial (n = 5) (p ≤ 0.001;t test). This effect was mainly caused by a decrease in BR and the number of spikes per burst, respectively 36 ± 18% (p ≤ 0.05; t test) and 46 ± 15% (p ≤ 0.025; t test)). In addition, the BVNBR decreased by 60 ± 10% (p ≤ 0.0025, t test). In contrast, as opposed to blockade of GABAA receptors with bicuculline, BD and FR were not significantly affected by nipecotic acid (both parameters decreased insignificantly, but the combination of their modulation resulted in a significant decrease in the number of spikes per burst). Moreover, the SF for activity propagation between neighboring cells did not change. However, the significant correlation between the number of spikes per burst that normally exists between neighboring cells disappeared with nipecotic acid. Consistently with a reduction in the number of spikes, the early and the late peaks of the cross-covariance function fell together by 66 ± 6% (p ≤ 0.005; t test) (Table 2).
These results show that when more GABA is available in the extracellular space, the excitability required for generating SBA decreases. Consequently, fewer bursts are observed, and these bursts are weaker.
Glycine. Glycine is another major inhibitory neurotransmitter in the adult inner plexiform layer (Dowling, 1987). Therefore, we have investigated the effects of strychnine (1–5 μm), a competitive antagonist of the glycinergic receptor on SBA (n = 4). Strychnine had no significant effect on burst parameters. However, there was a weak increase in the correlation between IBI preceding a burst and BD of the following burst. In control conditions, the correlation coefficient was −0.067 ± 0.060. In the presence of strychnine, the correlation coefficient significantly increased to 0.375 ± 0.053 (p < 0.0187; t test). This increase suggests that glycine has a weak influence on the duration or the strength of the refractory period.
The role of extracellular potassium
The results presented in the two previous sections demonstrate that synaptic transmission, both cholinergic and glutamatergic, is indispensable for the SBA present during early development in turtle retinal GCs.
However, these findings do not exclude the possibility that other agents might be involved in the initiation and/or propagation of the activity from GCs to their neighbors. A model (Burgi and Grzywacz, 1994a,b) proposed that the activity propagation is mediated by extracellular K+, whose concentration increases during firing and could thus depolarize neighboring cells, bringing them to firing threshold. In this model, synaptic excitation was necessary for propagation, because without such an excitation, extracellular K+ could not elicit spiking activity in GCs.
To test this possibility, we have blocked the K+efflux during firing with the K+ channel blockers Cs+ and TEA.
In the presence of Cs+ and TEA (50 μmeach), bursty and nonbursty spontaneous activity almost completely vanished. An extreme example of this effect is illustrated in Figure8. In this particular case, the robust bursting behavior of the cell was reduced to few clusters of very weak firing (2 spikes/0.5 sec). In six cells investigated under these conditions, BR and the total number of spikes per trial significantly decreased by 59 ± 11 (p ≤ 0.0002;t test) and 66.3 ± 5.7% (p ≤ 0.0071; t test), respectively. Burst parameters could be accurately measured in four of these cells (not including the cell illustrated in Fig. 8). FR within bursts and BVNBR decreased by 26.9 ± 9.9 (p ≤ 0.01; t test) and 49 ± 29% (p ≤ 0.13; ttest), respectively (Table 1).
Fig. 8.

Blockade of K+ channels, and thus of K+ efflux during activity, abolishes spontaneous bursting. Top panels, Control. Bottom panels, Activity in the presence of 50 μmCs+ and TEA, two K+ channel blockers. Right panels, Histograms of interspike intervals (in logarithmic units). The strong spontaneous bursts recorded in control conditions vanish in the presence of the drugs. Only very few weak bursts remain in the presence of Cs+ and TEA. The distribution of interspike intervals shifts to higher values and loses its clear bimodality as bursts become hardly detectable. Stage 25 GC.
These effects indicate that blockade of K+ channels with Cs+ and TEA reduces the excitability of the retina, leading to a profound decrease in SBA.
During K+ channel blockade, BD increased by 44 ± 18% (p ≤0.038; t test). The SF for activity propagation between cells, measured in two pairs of cells, significantly decreased by 35.3+5.8% (p ≤0.03;t test) (Fig. 9, Table 2). The duration of the slow component of the cross-covariance function measured in two pairs of cells increased by 233.3 + 0.0% (p = 0; t test), as expected from the increase in BD. Both the increase in BD and in the duration of the slow component of the cross-covariance function could result from broadening of individual spikes within a burst because the repolarization of the membrane is presumably slower under these conditions (and this could also explain the decrease in FR). This putative spike broadening could occur both in the GCs and in the presynaptic cholinergic cells, which may spike during development (Zhou and Fain, 1996). Intracellular recording is required to verify this possibility. Another possibility is that the mechanism that leads to a refractory period between consecutive bursts requires the temporal integration of activity to reach a threshold (for instance synaptic fatigue). Consequently, because the activity is weaker in the presence of Cs+ and TEA, bursts would last longer before the onset of the refractory mechanism.
Fig. 9.

The safety factor for activity propagation between adjacent cells decreases during blockade of K+channels. The figure illustrates the median SF for two pairs of cells in control conditions and in the presence of 50 μmCs+ and TEA. When K+ channels are blocked, the SF decreases by 35.3%. Median absolute deviation bars. Stage 25 GCs.
In the presence of a 5 mm concentration of a mixture of Cs+ and TEA (concentrations in the millimolar range are routinely used to achieve effective blockade of K+ channels in adult neurons in the CNS), GCs tended to fire continuously, and individual bursts of spikes were not detectable (n = 7). In the presence of 0.5 mm each of the blockers, bursts could sometimes still be detected, but there was also much random firing (n = 4). We suspect that the blockers were causing a substantial depolarization of the cells when applied at high concentrations (because different K+ conductances were blocked) and were thus responsible for the erratic firing patterns recorded under these conditions.
Both the early asymmetric and the late symmetric components of the cross-covariance function were substantially reduced [by 91.4 ± 8.6 (p ≤ 0.046; t test) and 90.0 ± 3.3% (p ≤ 0.0009; ttest), respectively] in the presence of a 50 μmconcentration of the blockers. One example of the reduction in amplitude of these two components is shown in Figure10A. However, when spontaneous activity was resumed by increasing the concentration of both Cs+ and TEA to 0.5 mm in these two cells (see explanation in previous paragraph), the late component almost disappeared, whereas the early one remained unchanged relative to the control data (Fig. 10B). We can reasonably assume that under these conditions, K+ efflux is substantially reduced. This observation therefore suggests that extracellular K+ may be involved in the symmetric activity propagation (Grzywacz and Sernagor, 1999) between neighboring GCs.
Fig. 10.

During spontaneous correlated bursting, extracellular K+ appears to be important not only for burst generation, but also for burst propagation between neighboring cells. As in Figure 6, this figure illustrates the cross-covariance function for activity synchronization in two pairs of cells (A, B). A, Theleft panel shows the control cross-covariance function for one pair of GCs. The right panel illustrates the function for the same pair of cells in the presence of 50 μm Cs+ and TEA. Both components of the function disappear in these conditions, and SBA is reduced to few weak clusters of spikes. B, The left panelillustrates the control cross-covariance function for another pair of cells. The right panel illustrates the function for the same pair of cells in the presence of 500 μmCs+ and TEA. Spontaneous firing resumes (see Results for explanation) in these conditions. The late, symmetric component of the cross-covariance function disappears, whereas the early, asymmetric component is intact. This demonstrates that extracellular K+ is important for the symmetric burst propagation between neighboring cells. Same graph conventions as for Figure 6. Stage 25 GCs.
Gap junctions
The adult turtle retina is characterized by a vast network of gap junctions between GCs and also other retinal neurons (Cook and Becker, 1995). Gap junctions are also present early in the developing mammalian retina (Penn et al., 1994). We have explored the possibility that they might be involved in SBA and/or synchronization between neighboring GCs in our preparation. For that purpose, we have used the anesthetics halothane and octanol, two gap junction blockers.
Halothane reduced BR by 30 ± 13% (p ≤ 0.026; t test; n = 4) and increased BD by 70 ± 37% (p ≤ 0.033; t test;n = 4). No other burst or cross-correlation parameters were significantly affected by the drug (Table 1). The effects of octanol (500 μm) were similar, but even weaker, and did not reach a statistical level of significance. Hence, gap junctions do not appear to contribute directly to the propagation of bursts.
Is the burst refractory period mediated by synaptic connections or by potassium?
After each burst, there is a refractory period of ∼100–300 sec during which the probability for a burst to occur is below average, as is indicated by the negative phase of the autocovariance function (Grzywacz and Sernagor, 1999). The mechanism underlying this refractory period does not only delay bursts, but can also modify them, as indicated by the positive correlation between the interval between two consecutive bursts and the duration of the second burst (Grzywacz and Sernagor, 1999).
This refractory period could be caused by synaptic inhibition. In support of this possibility, we found that strychnine caused a weak but significant increase in the correlation between IBI preceding a burst and the duration of the afterburst. However, neither GABA nor glycine have an effect on the negative phase of the autocovariance function.
It has also been suggested that the refractory period reflects a cumulative after hyperpolarization caused by Ca2+-mediated K+ conductance (Burgi and Grzywacz, 1994a,b). However, this possibility is unlikely because blockade of K+ conductances with Cs+ and TEA had no significant effect on the refractory period.
It is important to emphasize that this quiescent period does seem to have a real physiological significance because of the positive correlation between the interval between two consecutive bursts and the duration of the second burst. There is thus a cumulative process that builds up or dissipates during the silent period, enabling the outbreak of the next burst. For instance, during each burst, the synaptic machinery that leads to the outbreak of that burst becomes somehow too weak for the activity to persist or resume soon after, and sufficient time must pass (100–300 sec) before the machinery returns to normal.
DISCUSSION
In this study, we have performed pharmacological manipulations to investigate the cellular mechanisms underlying SBA present in GCs in the developing retina of the turtle. The results give new insights about the role of synaptic connections, extracellular K+, and gap junctions in the generation and propagation of these bursts.
Synaptic connections
When synaptic transmission was blocked, SBA was abolished. This suggests that synaptic transmission is a sine qua noncondition for SBA to occur.
Excitatory synaptic connections
Acetylcholine
SBA was completely blocked in the presence of curare and mecamylamine, which demonstrates that activation of nicotinic cholinergic receptors is essential for triggering SBA in GCs. When the action of endogenous acetylcholine was potentiated and prolonged in the presence of neostigmine, a cholinesterase inhibitor, SBA profoundly increased (both BR and FR). Despite BD being significantly shorter, the overall activity was very much enhanced during cholinesterase blockade. Hence, besides their importance for burst initiation, cholinergic connections play a central role in setting the intensity of the SBA. Where are these cholinergic connections coming from? The available data suggest that in adult mammals, cholinergic connections must originate in ACs (Masland and Mills, 1979; Hayden et al., 1980; Wasselius et al., 1998). However, turtle photoreceptors also contain acetylcholine (Criswell and Brandon, 1992). In addition, in the GC layer of turtle retinas, a transient population of cholinergic cells exists during embryogenesis (Grzywacz and Nguyen, 1998). Therefore, acetylcholine may have one or more sources in reptiles and perhaps also in other vertebrates. Cholinergic ACs have long dendrites, which would enable long-range connections and therefore make these cells good candidates for SBA propagation between neighboring GCs. However, available data rule out nicotinic receptors in cholinergic ACs in adult mammalian (Baldridge, 1995) and avian (Keyser et al., 1988) retinas. Consequently, if cholinergic ACs mediate the propagation of SBA, then these cells may not do so by contacting each other.
The spontaneous bursts and retinal waves present in the developing mammalian retina (Feller et al., 1996) and chick embryonic retina (Sernagor and O’Donovan, 1997) also require the activation of nicotinic receptors. [However, nicotinic activity in the chick seems only modulatory in retinal waves before the completion of synaptogenesis (Catsicas et al., 1998)]. The presence of these immature acetylcholine-dependent bursts across different species suggests that nicotinic receptors play a critical role in the developing vertebrate retina. The role of acetylcholine may transcend that of the bursts, because immunoreactivity to acetylcholine transferase emerges before the bursts in turtle (Grzywacz et al., 1997). Neuronal nicotinic receptors are also detected at very early stages of development in the chick retina (Hamassaki-Britto et al., 1994), before the emergence of retinal waves. Nicotinic receptors seem involved in many events of fundamental importance in the developing CNS (Role and Berg, 1996). They regulate [Ca2+]in, linked to many developmental events, in developing rabbit retinal GCs and ACs (Wong, 1995). Chronic blockade of nicotinic receptors with curare in the developing turtle retina inhibits the expansion of receptive field areas of GCs (Sernagor and Grzywacz, 1996) and dendritic outgrowth (Mehta and Sernagor, 1998), and it affects the development of receptive field isotropicity (Sernagor and Grzywacz, 1995b).
Glutamate
During glutamatergic blockade with the broad spectrum antagonist kynurenate, there was a dramatic decrease in BR. During kainate/AMPA receptor blockade with DNQX or CNQX, the effect was stronger, and SBA completely vanished. However, during NMDA receptor blockade, SBA was just reduced. Consequently, glutamate, acting mainly through kainate/AMPA receptors, is indispensable for generating SBA.
The effects of kynurenate and DNQX on the cross-covariance function point toward an interesting role that might be played by glutamate for activity propagation between neighboring GCs. When SBA is partially blocked with these drugs, the early component of the cross-covariance function is more sensitive to blockade than the late one, suggesting that glutamatergic transmission, acting through AMPA/kainate receptors, may be important for coordinating individual spikes between neighboring cells. Such a glutamatergic coordination would increase retinal excitability without contributing directly to the propagation of the bursts, because this coordination is too fast (1–3 msec) and asymmetric. (Such fast signals could be mediated by AMPA/kainate receptors that are known to generate transient responses.) In support of this idea, recent imaging experiments in the chick embryo show that during partial blockade of glutamatergic receptors, waves keep spreading across the retina (whereas the overall activity in every cell is much weaker). During partial blockade of cholinergic nicotinic receptors on the other hand, waves become spatially much more restricted (E. Sernagor, S. Eglen, and M. J. O’Donovan, unpublished results). Perhaps glutamate is released spontaneously from bipolar cells onto dendrites of ACs or GCs, maintaining a high level of excitability that would ensure the outbreak of SBA (both NMDA and non-NMDA receptors may contribute to this enhanced excitability). In support of this idea, one study shows that the extracellular concentration of glutamate is abnormally high in the developing rabbit retina (Haberecht and Redburn, 1996). Another possibility, which does not exclude the first one, is that immature GCs have axon collaterals making synaptic contacts with other GCs and/or ACs. Axon collaterals are transiently present in the developing retina (Ramoa et al., 1988;Wingate and Thompson, 1994) (V. Mehta and E. Sernagor, unpublished observations). Attributing fast correlation to GC collaterals or bipolar cells may appear to contradict some results from adult studies. A recent study on adult retinal GCs shows that correlation in the medium (10–50 msec) and narrow (<1 msec) temporal range is mediated by electrical junctions, whereas those in the long range (40–100 msec) are mediated by chemical synapses (Brivanlou et al., 1998). Our results do not support the source of the asymmetric component of the cross-covariance function in SBA originating from electrical junctions, because this component occurs between 1 and 3 msec and more importantly, it is not affected by gap junction blockers.
A difference between our results and those reported in mammals is that inhibition of glutamatergic activity does not abolish SBA in early postnatal mammalian GCs (Tootle, 1993; Wong et al., 1995; Miller et al., 1998) [it does however weaken SBA (Miller et al., 1998)] despite embryonic GCs expressing functional glutamatergic receptors (Rörig and Grantyn, 1994). In the chick embryo, blockade of glutamate receptors blocks retinal waves (Sernagor and O’Donovan, 1997; Wong et al., 1998). If the extracellular concentration of glutamate is indeed higher in immature mammalian retinas (Haberecht and Redburn, 1996), then perhaps higher concentrations of glutamatergic blockers are required to block SBA. (Light-evoked responses were used as a probe for effective glutamate blockade in turtles but not in mammals.) Evidence that glutamate contributes to SBA is that GCs and cholinergic ACs are both driven synaptically during SBA (Zhou, 1998). If glutamate is not involved in generation and/or propagation of SBA in mammals, then one must assume that an extracellular agent, released during a burst, can depolarize neighboring cells sufficiently to bring them to firing threshold or that the activity propagates laterally through cholinergic contacts between ACs.
Inhibitory synaptic connections
The effects of bicuculline and nipecotic acid point out to an inhibitory effect of GABA on SBA. Our findings show that GABA, acting through GABAA receptors, modulates BD. A similar modulation was reported for ferrets (Feller et al., 1996; Fischer et al., 1998) (during the period of on–off segregation only). The inhibitory modulation caused by nipecotic acid on SBA can be explained by an increase in GABA concentration, resulting in membrane shunting and a general decrease in excitability. However, GABA does not seem to play a central role in burst initiation because blockade of GABAAreceptors does not affect BR. The most likely possibility is that GABA is released from ACs. A large fraction of ACs (∼40% in the rabbit) are GABAergic in the vertebrate retina (Dowling, 1987; Vaney, 1990).
Glycine, on the other hand, seems to have a weak effect on the mechanism underlying the refractory period because strychnine increases the correlation coefficient between IBI preceding a burst and BD of the afterburst.
Extracellular potassium
Our findings show that blocking K+ channels, which alters the level of excitability of retinal neurons, has a profound inhibitory effect on SBA. At low concentrations of Cs+ and TEA, SBA was profoundly reduced, whereas at high concentrations, the excitability of the retina was increased, and GCs exhibited strong random firing without bursting patterns. We can reasonably assume that K+ outflow is reduced during K+ channel blockade and therefore we propose that under normal conditions, a relatively high level of extracellular K+ exists in the immature retina, helping SBA generation. However, we cannot reject other mechanisms of action. Further experiments will be required to elucidate the many possible mechanisms of action by which blockade of K+channels affects SBA. It is possible that inhibitory interneurons depolarize because of K+-channel blockade, suppressing the SBA. Another possibility is thatIh, a K+ current known to generate rhythmic oscillations and to be sensitive to low doses of Cs+ (Lüthi and McCormick, 1998), is involved in the generation of retinal SBA. This possibility could account for the strong inhibition of the bursting pattern at low concentrations of the blockers.
The data also suggest that K+ is one of the factors that directly mediate the lateral propagation of the bursts, as has been suggested by an earlier theoretical study (Burgi and Grzywacz, 1994a). When the concentration of Cs+ and TEA was high (0.5 mm), the late component of the cross-covariance function virtually disappeared, whereas the early component was intact. Because the late, but not the early component is symmetrical and has the appropriate duration, it can reasonably be associated with the mechanism that mediates the propagation of bursts (Grzywacz and Sernagor, 1999). However, we cannot reject the more indirect possibility that changes in lateral propagation caused by blockade of K+ channels is also caused by a modulation of transmitter release properties of retinal neurons. In other words, the hypothesis that the propagation of the activity is caused by diffusion of extracellular K+ was not addressed directly by the current experiments.
In the mature retina, Müller cells are known to buffer [K+]out (Newman and Reichenbach, 1996). During development, Müller cells mature late structurally in mammals (Polley et al., 1989) and in turtles (M. N. Grzywacz and M. Mejia, unpublished observations), and therefore probably mature late functionally as well (Rager, 1979). Müller cells show poor buffering of glutamate in the neonatal rabbit retina (Redburn et al., 1992) and may therefore also have weak K+buffering. This would lead to increased excitability in the retina, resulting in the outbreak of SBA. As the retina develops and Müller cells become functional, the extracellular glutamate and K+ concentrations would decrease, resulting in more hyperpolarized resting membrane potentials, which would make it harder for neurons to reach threshold for bursting. One indication that Müller cells are probably not functional during the period of SBA is the absence of a b-wave component in the electroretinogram (Miller and Dowling, 1970; Miller, 1972) in embryos (Rager, 1979). A small b-wave develops toward the end of gestation and matures in young turtle hatchlings (unpublished results), coinciding with the disappearance of SBA.
Gap junctions
On the basis of the observed changes in SBA in the presence of halothane or octanol, it is difficult to assume that gap junctions, including those between GCs and ACs (Kenyon and Marshak, 1998), are involved in SBA in turtles. A similar conclusion applies to β GCs of the mammalian retina, because they express propagating bursts despite lacking gap junctions (Penn et al., 1994) but not to retinal waves observed at late developmental stages in the chick embryo (Wong et al., 1998).
Bursts refractory period
None of the pharmacological manipulations we have performed had a significant effect on the refractory period of the burst (except for a minor influence by strychnine). The refractory period could be caused by synaptic fatigue. Synaptic transmission is known to be weaker and fatigue more easily in immature neurons (Lev-Tov and Pinco, 1992;Grantyn et al., 1995; O’Donovan and Chub, 1997). This could be caused by the depletion of synaptic vesicles that have to undergo endocytosis before being available again for synaptic release. In a nonexclusive alternative explanation, the neurotransmitter stores may become depleted, and transmission cannot resume before new neurotransmitter is synthesized. Both explanations are consistent with the rapid saturation of the refractory mechanism (Grzywacz and Sernagor, 1999). The refractory period could originate from any cell type participating in SBA. A theoretical study argues that it is the cholinergic ACs that determine the postwave or burst refractory period (Feller et al., 1997). This possibility remains to be demonstrated experimentally, by testing whether synaptically evoked responses in ACs are weaker immediately after a wave. However, the possibility raised by Feller et al. (1997) that the refractory period is caused by large afterhyperpolarizing currents is unlikely. This is because Cs+ and TEA had no effect on the refractory period (see Results). Moreover, starburst ACs in the rabbit do not exhibit an interburst hyperpolarization (Zhou, 1998).
Footnotes
This work was supported by National Eye Institute Grant EY10600, Newcastle University Hospitals Special Trustees Grant R125/05760, and Medical Research Council Grant R125/05878 to E.S., by National Eye Institute Grants EY08921 and EY11170, and the William A. Kettlewell chair to N.M.G., and by a core grant from the National Eye Institute to Smith-Kettlewell.
Correspondence should be addressed to Evelyne Sernagor, Department of Child Health, the Medical School, University of Newcastle upon Tyne, Framlington Place, Newcastle upon Tyne NE2 4HH, UK.
REFERENCES
- 1.Ariel M, Adolph AR. Neurotransmitter inputs to directionally sensitive turtle retinal ganglion cells. J Neurophysiol. 1985;54:1123–1143. doi: 10.1152/jn.1985.54.5.1123. [DOI] [PubMed] [Google Scholar]
- 2.Arnett D, Spraker TE. Cross-correlation analysis of the maintained discharge of rabbit retinal ganglion cells. J Physiol (Lond) 1981;317:29–47. doi: 10.1113/jphysiol.1981.sp013812. [DOI] [PMC free article] [PubMed] [Google Scholar]
- 3.Backman SB, Stein RD, Blank DW, Collier B, Polosa C. Different properties of the bradycardia produced by neostigmine and edrophonium in the cat. Can J Anaesth. 1996;43:731–740. doi: 10.1007/BF03017959. [DOI] [PubMed] [Google Scholar]
- 4.Baldridge WH. Optical recording of the effects of cholinergic ligands on neurons in the ganglion cell layer of mammalian retina. J Neurosci. 1995;15:5060–5072. doi: 10.1523/JNEUROSCI.16-16-05060.1996. [DOI] [PMC free article] [PubMed] [Google Scholar]
- 5.Brivanlou IH, Warland DK, Meister M. Mechanisms of concerted firing among retinal ganglion cells. Neuron. 1998;20:527–539. doi: 10.1016/s0896-6273(00)80992-7. [DOI] [PubMed] [Google Scholar]
- 6.Burgi PY, Grzywacz NM. Model-based on extracellular potassium for spontaneous synchronous activity in developing retinas. Neural Comp. 1994a;6:983–1004. doi: 10.1523/JNEUROSCI.14-12-07426.1994. [DOI] [PMC free article] [PubMed] [Google Scholar]
- 7.Burgi PY, Grzywacz NM. Model for the pharmacological basis of spontaneous synchronous activity in developing retinas. J Neurosci. 1994b;14:7426–7439. doi: 10.1523/JNEUROSCI.14-12-07426.1994. [DOI] [PMC free article] [PubMed] [Google Scholar]
- 8.Burgi PY, Grzywacz NM. Possible roles of spontaneous waves and dendritic growth for retinal receptive field development. Neural Comp. 1997;9:533–553. doi: 10.1162/neco.1997.9.3.533. [DOI] [PubMed] [Google Scholar]
- 9.Burgi PY, Grzywacz NM. A biophysical model for the developmental time course of retinal orientation selectivity. Vision Res. 1998;38:2787–2800. doi: 10.1016/s0042-6989(97)00323-4. [DOI] [PubMed] [Google Scholar]
- 10.Catsicas M, Mobbs P. Retinal development: waves are swell. Curr Biol. 1995;5:977–979. doi: 10.1016/s0960-9822(95)00192-8. [DOI] [PubMed] [Google Scholar]
- 11.Catsicas M, Bonness V, Becker D, Mobbs P. Spontaneous Ca2+ transients and their transmission in the developing chick retina. Curr Biol. 1998;8:283–286. doi: 10.1016/s0960-9822(98)70110-1. [DOI] [PubMed] [Google Scholar]
- 12.Cook JE, Becker DL. Gap junctions in the vertebrate retina. Microsc Res Tech. 1995;31:408–419. doi: 10.1002/jemt.1070310510. [DOI] [PubMed] [Google Scholar]
- 13.Copenhagen DR. Retinal development: on the crest of an exciting wave. Curr Biol. 1996;6:1368–1370. doi: 10.1016/s0960-9822(96)00732-4. [DOI] [PubMed] [Google Scholar]
- 14.Criswell MH, Brandon C. Cholinergic and GABAergic neurons occur in both the distal and proximal turtle retina. Brain Res. 1992;577:101–111. doi: 10.1016/0006-8993(92)90542-h. [DOI] [PubMed] [Google Scholar]
- 15.Dowling JE. The retina: an approachable part of the brain. Harvard UP; Cambridge, MA: 1987. [Google Scholar]
- 16.Feller MB, Wellis DP, Stellwagen D, Werblin FS, Shatz CJ. Requirement for cholinergic synaptic transmission in the propagation of spontaneous retinal waves. Science. 1996;272:1182–1187. doi: 10.1126/science.272.5265.1182. [DOI] [PubMed] [Google Scholar]
- 17.Feller MB, Butts DA, Aaron HL, Rokhsar DS, Shatz CJ. Dynamic processes shape spatiotemporal properties of retinal waves. Neuron. 1997;19:293–306. doi: 10.1016/s0896-6273(00)80940-x. [DOI] [PubMed] [Google Scholar]
- 18.Fischer KF, Lukasiewicz PD, Wong ROL. Age-dependent and cell class-specific modulation of retinal ganglion cell bursting activity by GABA. J Neurosci. 1998;18:3767–3778. doi: 10.1523/JNEUROSCI.18-10-03767.1998. [DOI] [PMC free article] [PubMed] [Google Scholar]
- 19.Goodman CS, Shatz CJ. Developmental mechanisms that generate precise patterns of neural connectivity. Cell. 1993;72:77–98. doi: 10.1016/s0092-8674(05)80030-3. [DOI] [PubMed] [Google Scholar]
- 20.Grantyn R, Kraszewski K, Melnick I, Taschenberger H, Warton SS. In-vitro development of vertebrate central synapses. Perspect Dev Neurobiol. 1995;2:387–397. [PubMed] [Google Scholar]
- 21.Grzywacz NM, Nguyen LT. A transient cholinergic population of cells in the developing turtle retina. Soc Neurosci Abstr. 1998;24:63. [Google Scholar]
- 22.Grzywacz NM, Sernagor E (1999) Spontaneous activity in developing turtle retinal ganglion cells: statistical analysis. Vis Neurosci, in press. [DOI] [PubMed]
- 23.Grzywacz NM, Nguyen LT, Mejia M, De Juan J. Development of cholinergic neurons in the turtle retina. Invest Ophthalmol Vis Sci Abstr. 1997;38:4396. [Google Scholar]
- 24.Haberecht MF, Redburn DA. High-levels of extracellular glutamate are present in retina during neonatal development. Neurochem Res. 1996;21:285–291. doi: 10.1007/BF02529146. [DOI] [PubMed] [Google Scholar]
- 25.Hamassaki-Britto DE, Gardino PF, Hokoç JN, Keyser KT, Karten HJ, Lindstrom JM, Britto LRG. Differential development of α-bungarotoxin-sensitive and α-bungarotoxin-insensitive nicotinic acetylcholine receptors in the chick retina. J comp Neurol. 1994;347:161–170. doi: 10.1002/cne.903470202. [DOI] [PubMed] [Google Scholar]
- 26.Hayden SA, Mills JW, Masland RH. Acetylcholine synthesis by displaced amacrine cells. Science. 1980;210:435–437. doi: 10.1126/science.7433984. [DOI] [PubMed] [Google Scholar]
- 27.Johnson RA, Wichern W. Applied multivariate statistical analysis. Prentice Hall; Englewood Cliffs, NJ: 1992. [Google Scholar]
- 28.Katz LC. Coordinate activity in retinal and cortical development. Cur Opin Neurobiol. 1993;3:93–99. doi: 10.1016/0959-4388(93)90041-v. [DOI] [PubMed] [Google Scholar]
- 29.Kenyon GT, Marshak DW. Gap junctions with amacrine cells provide a feedback pathway for ganglion cells within the retina. Proc R Soc Lond B Biol Sci. 1998;265:919–925. doi: 10.1098/rspb.1998.0379. [DOI] [PMC free article] [PubMed] [Google Scholar]
- 30.Keyser KT, Hughes TE, Whiting PJ, Lindstrom JM, Karten HJ. Cholinoceptive neurons in the retina of the chick: an immunohistochemical study of the nicotinic acetylcholine receptors. Vis Neurosci. 1988;1:349–366. doi: 10.1017/s0952523800004120. [DOI] [PubMed] [Google Scholar]
- 31.Lev-Tov A, Pinco M. In vitro studies of prolonged synaptic depression in the neonatal rat spinal cord. J Physiol (Lond) 1992;447:149–169. doi: 10.1113/jphysiol.1992.sp018996. [DOI] [PMC free article] [PubMed] [Google Scholar]
- 32.Lüthi A, McCormick DA. H-current: properties of a neuronal and network pacemaker. Neuron. 1998;21:9–12. doi: 10.1016/s0896-6273(00)80509-7. [DOI] [PubMed] [Google Scholar]
- 33.Maffei L, Galli-Resta L. Correlation in the discharges of neighboring rat retinal ganglion cells during prenatal life. Proc Natl Acad Sci USA. 1990;87:2861–2864. doi: 10.1073/pnas.87.7.2861. [DOI] [PMC free article] [PubMed] [Google Scholar]
- 34.Masland RH. Maturation of function in the developing rabbit retina. J Comp Neurol. 1977;175:275–286. doi: 10.1002/cne.901750303. [DOI] [PubMed] [Google Scholar]
- 35.Masland RH, Mills JW. Autoradiographic localization of acetylcholine in the rabbit retina. J Cell Biol. 1979;83:159–178. doi: 10.1083/jcb.83.1.159. [DOI] [PMC free article] [PubMed] [Google Scholar]
- 36.Mastronarde DN. Correlated firing of cat retinal ganglion cells. I. Spontaneously active inputs to X- and Y-cells. J Neurophysiol. 1983;49:303–324. doi: 10.1152/jn.1983.49.2.303. [DOI] [PubMed] [Google Scholar]
- 37.Mehta V, Sernagor E. Activity-dependent dendritic outgrowth in developing retinal ganglion cells. Eur J Neurosci [Suppl] 1998;10:332. [Google Scholar]
- 38.Meister M, Wong ROL, Baylor DA, Shatz CJ. Synchronous bursts of action potentials in ganglion cells of the developing mammalian retina. Science. 1991;252:939–943. doi: 10.1126/science.2035024. [DOI] [PubMed] [Google Scholar]
- 39.Miller ED, Wong WT, Wong ROL. Developmental changes in the neurotransmitter regulation of correlated spontaneous retinal bursting activity. Soc Neurosci Abstr. 1998;24:812. doi: 10.1523/JNEUROSCI.20-01-00351.2000. [DOI] [PMC free article] [PubMed] [Google Scholar]
- 40.Miller RF. Role of K+ in generation of b-wave of electroretinogram. J Neurophysiol. 1972;35:28–38. doi: 10.1152/jn.1973.36.1.28. [DOI] [PubMed] [Google Scholar]
- 41.Miller RF, Dowling JE. Intracellular responses of the Müller (glial) cells of mudpuppy retina: their relation to b-wave of the electroretinogram. J Neurophysiol. 1970;33:323–341. doi: 10.1152/jn.1970.33.3.323. [DOI] [PubMed] [Google Scholar]
- 42.Mooney R, Penn AA, Gallego R, Shatz CJ. Thalamic relay of spontaneous retinal activity prior to vision. Neuron. 1996;17:863–874. doi: 10.1016/s0896-6273(00)80218-4. [DOI] [PubMed] [Google Scholar]
- 43.Newman E, Reichenbach A. The Müller cell: a functional element of the retina. Trends Neurosci. 1996;19:307–312. doi: 10.1016/0166-2236(96)10040-0. [DOI] [PubMed] [Google Scholar]
- 44.O’Donovan MJ, Chub N. Population behavior and self-organization in the genesis of spontaneous rhythmic activity by developing spinal networks. Semin Cell Dev Biol. 1997;8:21–28. doi: 10.1006/scdb.1996.0117. [DOI] [PubMed] [Google Scholar]
- 45.O’Malley DM, Sandell JH, Masland RH. Co-release of acetylcholine and GABA by the starburst amacrine cells. J Neurosci. 1992;12:1394–1408. doi: 10.1523/JNEUROSCI.12-04-01394.1992. [DOI] [PMC free article] [PubMed] [Google Scholar]
- 46.Penn AA, Wong ROL, Shatz CJ. Neural coupling in the developing mammalian retina. J Neurosci. 1994;14:3805–3815. doi: 10.1523/JNEUROSCI.14-06-03805.1994. [DOI] [PMC free article] [PubMed] [Google Scholar]
- 47.Penn AA, Riquelme PA, Feller MB, Shatz CJ. Competition in retinogeniculate patterning driven by spontaneous activity. Science. 1998;279:2108–21112. doi: 10.1126/science.279.5359.2108. [DOI] [PubMed] [Google Scholar]
- 48.Polley EH, Zimmerman RP, Fortney RL. Neurogenesis and maturation of cell morphology in the development of the mammalian retina. In: Finlay BL, Sengelaub DR, editors. Development of the vertebrate retina. Plenum; New-York: 1989. pp. 3–26. [Google Scholar]
- 49.Rager G. The cellular origin of the b-wave in the electroretinogram: a developmental approach. J Comp Neurol. 1979;188:225–244. doi: 10.1002/cne.901880203. [DOI] [PubMed] [Google Scholar]
- 50.Ramoa AS, Campbell G, Shatz CJ. Dendritic growth and remodeling of cat retinal ganglion cells during fetal and postnatal development. J Neurosci. 1988;8:4239–4261. doi: 10.1523/JNEUROSCI.08-11-04239.1988. [DOI] [PMC free article] [PubMed] [Google Scholar]
- 51.Redburn DA, Agarwal SH, Messersmith EK, Mitchell CK. Development of the glutamate system in rabbit retina. Neurochem Res. 1992;17:61–66. doi: 10.1007/BF00966865. [DOI] [PubMed] [Google Scholar]
- 52.Role LW, Berg DK. Nicotinic receptors in the development and modulation of CNS synapses. Neuron. 1996;16:1077–1085. doi: 10.1016/s0896-6273(00)80134-8. [DOI] [PubMed] [Google Scholar]
- 53.Rörig B, Grantyn R. Ligand- and voltage-gated ion channels are expressed by embryonic mouse retinal neurones. NeuroReport. 1994;5:1197–1200. doi: 10.1097/00001756-199406020-00009. [DOI] [PubMed] [Google Scholar]
- 54.Sernagor E, Grzywacz NM. Cellular mechanisms underlying spontaneous correlated activity in the turtle embryonic retina. Invest Ophthalmol Vis Sci Abstr. 1993;34:1156. [Google Scholar]
- 55.Sernagor E, Grzywacz NM. Synaptic connections involved in the spontaneous correlated bursts in the developing turtle retina. Invest Ophthalmol Vis Sci Abstr. 1994;35:2125. [Google Scholar]
- 56.Sernagor E, Grzywacz NM. Emergence of complex receptive field properties of ganglion cells in the developing turtle retina. J Neurophysiol. 1995a;73:1355–1364. doi: 10.1152/jn.1995.73.4.1355. [DOI] [PubMed] [Google Scholar]
- 57.Sernagor E, Grzywacz NM. Shaping of receptive field properties in developing retinal ganglion cells in the absence of early cholinergic spontaneous activity. Soc Neurosci Abstr. 1995b;21:1503. [Google Scholar]
- 58.Sernagor E, Grzywacz NM. Influence of spontaneous activity and visual experience on developing retinal receptive fields. Curr Biol. 1996;6:1503–1508. doi: 10.1016/s0960-9822(96)00755-5. [DOI] [PubMed] [Google Scholar]
- 59.Sernagor E, O’Donovan MJ. Cellular mechanisms underlying retinal waves in the chick embryo. Soc Neurosci Abstr. 1997;23:306. [Google Scholar]
- 60.Shatz CJ. Emergence of order in visual system development. Proc Natl Acad Sci USA. 1996;93:602–608. doi: 10.1073/pnas.93.2.602. [DOI] [PMC free article] [PubMed] [Google Scholar]
- 61.Slater NT, Filbert M, Carpenter DO. Multiple interactions of anticholinesterases with Aplysia acetylcholine responses. Brain Res. 1986;375:407–412. doi: 10.1016/0006-8993(86)90768-7. [DOI] [PubMed] [Google Scholar]
- 62.Sprent P. Applied nonparametric statistical methods. Chapman & Hall; London: 1993. [Google Scholar]
- 63.Tootle JS. Early postnatal development of visual function in ganglion cells of the cat retina. J Neurophysiol. 1993;69:1645–1660. doi: 10.1152/jn.1993.69.5.1645. [DOI] [PubMed] [Google Scholar]
- 64.Vaney DI. The mosaic of amacrine cells in the mammalian retina. Prog Retinal Res. 1990;9:1–46. [Google Scholar]
- 65.Wasselius J, Johansson K, Bruun A, Zucker C, Ehinger B. Correlations between cholinergic neurons and muscarinic m2 receptors in the rat retina. NeuroReport. 1998;9:1799–1802. doi: 10.1097/00001756-199806010-00023. [DOI] [PubMed] [Google Scholar]
- 66.Wingate RJT, Thompson ID. Targeting and activity-related dendritic modification in mammalian retinal ganglion cells. J Neurosci. 1994;14:6621–6637. doi: 10.1523/JNEUROSCI.14-11-06621.1994. [DOI] [PMC free article] [PubMed] [Google Scholar]
- 67.Wong ROL. Cholinergic regulation of [Ca2+]i during cell division and differentiation in the mammalian retina. J Neurosci. 1995;15:2696–2706. doi: 10.1523/JNEUROSCI.15-04-02696.1995. [DOI] [PMC free article] [PubMed] [Google Scholar]
- 68.Wong ROL. Retinal waves and visual system development. Annu Rev Neurosci. 1999;22:29–47. doi: 10.1146/annurev.neuro.22.1.29. [DOI] [PubMed] [Google Scholar]
- 69.Wong ROL, Oakley DM. Changing patterns of spontaneous bursting activity of On and Off retinal ganglion cells during development. Neuron. 1996;16:1087–1095. doi: 10.1016/s0896-6273(00)80135-x. [DOI] [PubMed] [Google Scholar]
- 70.Wong ROL, Meister M, Shatz CJ. Transient period of correlated bursting activity during development of the mammalian retina. Neuron. 1993;11:923–938. doi: 10.1016/0896-6273(93)90122-8. [DOI] [PubMed] [Google Scholar]
- 71.Wong ROL, Chernjavsky A, Smith SJ, Shatz CJ. Early functional neural networks in the developing retina. Nature. 1995;374:716–718. doi: 10.1038/374716a0. [DOI] [PubMed] [Google Scholar]
- 72.Wong WT, Sanes JR, Wong ROL. Developmentally regulated spontaneous activity in the embryonic chick retina. J Neurosci. 1998;18:8839–8852. doi: 10.1523/JNEUROSCI.18-21-08839.1998. [DOI] [PMC free article] [PubMed] [Google Scholar]
- 73.Yntema CL. A series of stages in the embryonic development of Chelydra serpentina. J Morphol. 1968;125:219–252. doi: 10.1002/jmor.1051250207. [DOI] [PubMed] [Google Scholar]
- 74.Zhou ZJ. Direct participation of starburst amacrine cells in spontaneous rhythmic activities in the developing mammalian retina. J Neurosci. 1998;18:4155–4165. doi: 10.1523/JNEUROSCI.18-11-04155.1998. [DOI] [PMC free article] [PubMed] [Google Scholar]
- 75.Zhou ZJ, Fain GL. Starburst amacrine cells change from spiking to nonspiking neurons during retinal development. Proc Natl Acad Sci USA. 1996;93:8057–8062. doi: 10.1073/pnas.93.15.8057. [DOI] [PMC free article] [PubMed] [Google Scholar]