Abstract
Neuronal response synchronization with millisecond precision has been proposed to serve feature binding in vision and should therefore, like visual experience, depend on central states. Here we test this hypothesis by examining the occurrence and strength of response synchronization in areas 17 and 18 of anesthetized cats as a function of central states. These were assessed from the frequency content of the electroencephalogram, low power in the δ and high power in the γ frequency ranges (here 20–70 Hz) being considered as a signature of activated states. We evaluated both spontaneous state changes and transitions induced by electrical stimulation of the mesencephalic reticular formation. During states of low central activation, visual responses were robust but lacked signs of precise synchronization. At intermediate levels of activation, responses became synchronized and exhibited an oscillatory patterning in the range of 70–105 Hz. At higher levels of activation, a different pattern of response synchronization and oscillatory modulation appeared, oscillation frequency now being in the range of 20–65 Hz. The strength of response synchronization and oscillatory modulation in the 20–65 Hz range increased with further activation and was associated with a decrease in oscillation frequency. We propose that the oscillatory patterning in the 70–105 Hz range is attributable to oscillatory retinothalamic input and that a minimal level of activation is necessary for cortical neurons to follow this oscillatory pattern. In contrast, the synchronization of responses at oscillation frequencies in the 20–65 Hz range appears to result from intracortical synchronizing mechanisms, which become progressively more effective as central activation increases. Surprisingly, enhanced synchronization and oscillatory modulation in the γ frequency range were not associated with consistent increases in response amplitude, excluding a simple relation between central activation and neuronal discharge rate. The fact that intracortical synchronizing mechanisms are particularly effective during states of central activation supports the hypothesis that precise synchronization of responses plays a role in sensory processing.
Keywords: synchronization, γ frequency oscillations, EEG, cortical activation, visual perception, thalamocortical interactions, sleep
The synchronization of neuronal responses has been proposed as a mechanism complementary to rate modulation for the definition of relations among distributed responses. According to this hypothesis, synchronization of discharges with a precision in the millisecond range serves to jointly raise the saliency of responses, thereby defining for subsequent processing stages which responses are related (for review, see Singer and Gray, 1995). Synchronization in the millisecond range has been reported in several brain areas and species (Gray et al., 1989; Frien et al., 1994; Kreiter and Singer, 1994; Laurent and Davidowitz, 1994; Prechtl, 1994;Livingstone, 1996; Neuenschwander et al., 1996a,b; Freiwald et al., 1998) and is frequently associated with an oscillatory modulation of discharges in the γ frequency range. There is increasing evidence that these precise temporal relations among distributed discharges carry information that cannot be extracted from the firing rate of individual neurons. In the auditory cortex, the precise timing of spikes signals the familiarity of species-specific calls (Wang et al., 1995). In the insect olfactory system, composite odors appear to be encoded in the specific constellation of synchronous oscillatory discharges (Laurent, 1996), and in the visual cortex, synchronization of visual responses has been shown to reflect perceptual grouping criteria such as vicinity, continuity, colinearity, and common fate (Gray et al., 1989; Engel et al., 1991; Kreiter and Singer, 1996;Livingstone, 1996). Moreover, response synchronization correlates well with sensory disturbances such as strabismic amblyopia (Roelfsema et al., 1994) and with changes in perceptual dominance during interocular rivalry (Fries et al., 1997).
It is during waking and dreaming [rapid eye movement (REM) sleep], the two major brain states characterized by a desynchronized electroencephalogram (EEG) (Steriade et al., 1996), that visual experiences are possible. The EEG in these states is dominated by low-voltage activity in the γ frequency range and is referred to as “activated,” contrasting with the prominent high-voltage δ (1–4 Hz) activity that is observed during non-REM sleep (Steriade and McCarley, 1990; Llinás and Ribary, 1993). This predicts that neuronal response properties essential for perception should be expressed in the behavior of neuronal populations during states of central activation and should be absent when the brain is in a state that is incompatible with perception. To test this prediction, we investigated how visual responses in the cat primary visual cortex change in relation to EEG activation, as assessed from the frequency content of the EEG. EEG changes characteristic of behavioral arousal and of the transition from non-REM to REM sleep are caused by enhanced activity of modulatory projections originating in the mesencephalic reticular formation (MRF) (Moruzzi and Magoun, 1949; Hobson, 1992) and can be induced by electrical stimulation of the MRF (Moruzzi and Magoun, 1949). Therefore, we studied both spontaneous fluctuations of central states and those induced by electrical stimulation of the MRF. We have shown previously that MRF stimulation enhances the synchronization of neuronal responses in the visual cortex of anesthetized cats (Munk et al., 1996b). Here we extended this analysis to investigate the variation in strength, oscillatory modulation, and synchronization of visual responses in relation to central state changes.
Some of the results from this study have appeared in abstract form (Munk et al., 1996a)
MATERIALS AND METHODS
Animals. Eight adult cats were studied. Anesthesia was induced with 10 mg/kg ketamine and 2 mg/kg rompun injected intramuscularly and maintained under artificial ventilation with 70% N2O and 30% O2 supplemented with 1% halothane during all surgical procedures, as described previously (Engel et al., 1990). Heart rate, temperature, EEG, and end-tidal CO2 were monitored continuously. After surgery, halothane concentration was adjusted between 0.6 and 0.8% to allow a level of anesthesia characterized by a polymorphic EEG exhibiting spontaneous variations from slow waves to activity in the γ frequency range. Subsequently, animals were paralyzed with 0.1 mg · kg−1 · hr−1intravenous pancuronium bromide, and recordings were obtained during the following 3–4 d.
Multiple-electrode recording. Multiunit activity was recorded simultaneously with up to three tungsten electrodes from a total of 53 sites in areas 17 and 18 (45 pairs of recording sites). Neurons at different sites recorded simultaneously had nonoverlapping receptive fields, with an average center-to-center distance of 7.6 ± 5.1° of visual angle. Multiunit responses to repeated presentations of an invariant visual stimulus were recorded in 21 sessions spanning 3–10 consecutive hours. The level of anesthetic was kept constant during each session. Multiunit activity was filtered between 1 and 3 kHz, fed through a Schmitt trigger whose threshold was set higher than twice the noise level, and sampled at 100 kHz with a 1401 CED interface controlled by Spike 2 software (Cambridge Electronic Design, Cambridge, UK). The EEG was recorded at the same time between two epidural silver ball electrodes that were placed lateral and posterior to the multiunit recording sites, either across the hemispheres (one animal) or with a spacing of 3–5 mm in the same hemisphere (seven animals). The EEG signal was filtered between 0.1 and 1000 Hz and digitized at 1 kHz.
MRF stimulation. Bipolar stimulation electrodes were positioned bilaterally into the optic chiasm (A, 14.5; H, 5; L, ±3) (Horsley-Clarke) and the MRF (A, 2; H, 8; L, ±3). The position of MRF stimulation electrodes was adjusted so that delivery of a 61-msec-long train (100 μsec pulses at 75 Hz, 1–3 mA; Singer, 1973) caused maximal facilitation of the cortical potential evoked by a single shock (50 μsec, 1–2 mA) applied to the optic chiasm. MRF-induced facilitation of the evoked potential was always tested before muscle relaxation. No signs of stress such as motor reactions, increased heart rate, temperature, or end-tidal CO2 were present after MRF stimulation, indicating that the level of anesthesia was adequate. The position of the MRF stimulation electrodes was verified in histological sections from electrolytic lesions made along the electrode tracks at the end of the experiments.
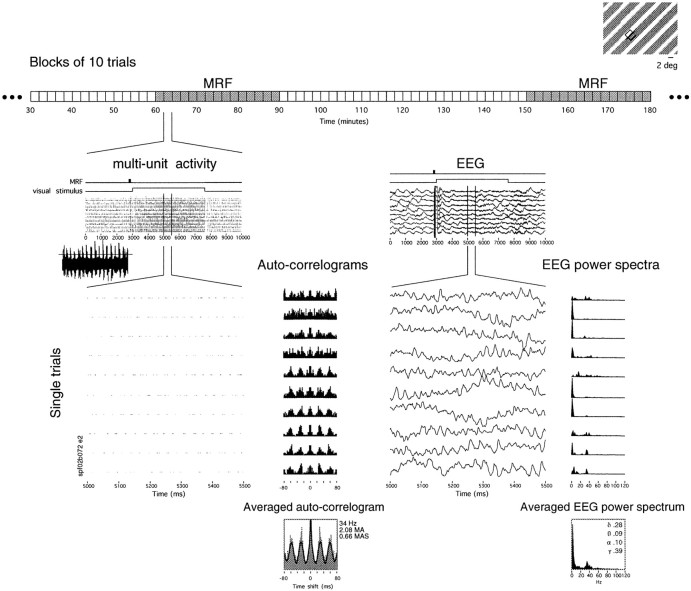
Visual stimulation and experimental design. The visual stimulus consisted of one or several patches of moving gratings presented on a computer screen (100 Hz refresh rate). When several patches were presented, they were, as far as possible, of the same contrast, size, velocity, orientation, and direction of movement, so that there was a good chance that visual responses elicited by them would exhibit synchronization (Gray et al., 1989). The experimental design is schematized in Figure 1. In each 10 sec trial, the visual stimulus appeared 3 sec after trial start and remained on for 4.5 sec. Data were acquired in blocks of 10 consecutive trials repeated at 2 sec intervals. The interval between blocks was ∼10 sec. Periods of 20–30 consecutive blocks, lasting altogether ∼1 hr, were alternated with periods of 10–30 consecutive blocks in which the 75 Hz stimulation train was delivered to the MRF 150 msec before each presentation of the visual stimulus (Fig. 1, top; see stimulus traces above raster plots). The EEG and multiunit responses were continuously evaluated on-line with a raster display.
Fig. 1.
Experimental design and data analysis. Spike activity at up to four sites (top right, receptive field for only one site depicted here) was recorded along with the EEG over several hours, under constant levels of anesthesia, in blocks of 10 trials of consecutive presentations of an invariant visual stimulus (top right). The structure of each trial is seen in more detail in the raster display (multi-unit activity); each trial lasted 10 sec, during which the visual stimulus appeared at 3 sec and remained on for 4.5 sec. In blocks with MRF stimulation (top, gray blocks), a 75 Hz stimulation train was delivered to the MRF 150 msec before each presentation of the visual stimulus (see MRF stimulus bars above rasters). The artifact of MRF stimulation is clearly visible in both multiunit and EEG raster displays. Inset to theleft, Digitized trace of the spikes during the visual response and the threshold used for spike discrimination. A 500 msec window of the multiunit responses and the EEG is expanded to show the oscillatory patterning of the spike activity and γ activity in the EEG during individual visual responses. Power spectra and auto-correlation functions were calculated for the EEG and spike activity, respectively, for each trial, and then averaged across the 10 trials in each block.
Data analysis. All data analysis was performed using software programmed by one of us (S.N.) in LabVIEW (National Instruments) running on a Macintosh platform.
Oscillatory modulation and synchronization of multiunit neuronal responses to patches of moving gratings were analyzed by computing auto- and cross-correlation functions averaged over 10 consecutive trials, with a resolution of 1 or 2 msec and over a 160 msec interval (Fig. 1, multi-unit activity). A 4 sec analysis window was used to cover most of the response epoch, beginning 100 msec after visual stimulus onset to avoid the initial transient, stimulus-locked component of the responses. For quantitative analysis, a damped cosine (Gabor) function was fitted to the correlograms (König, 1994). Shift predictor averaged correlograms were calculated, and once established that these were flat, quantification ensued based on non-shift predictor-subtracted correlation functions. This allowed the strength of oscillatory modulation to be assessed from the ratio between the amplitude of the first satellite peak and the offset of the function fitted to auto-correlograms [modulation amplitude of the first satellite peak (MAS)]. Similarly, synchronization was assessed from the modulation amplitude (MA) of the central peak in the correlograms, using the ratio between the peak amplitude and offset of the fitted function for quantification. A correlogram was considered to reveal oscillatory (or synchronized) activity if the first satellite (or central) peak had a Z score >2 and an MAS (or MA) ≥0.1. Because all of our recordings consist of multiunit activity, the fitted central peak of the auto-correlograms, which excludes the 0 msec bin, indicates the degree to which the activity of neighboring neurons is synchronized. The average firing rate for each block of 10 responses was expressed as the average number of spikes within the analysis window per trial per second.
A total of 7281 auto-correlograms averaged over 10 consecutive presentations of the visual stimulus were analyzed, which amounts to an average of 137 auto-correlograms per recording site (range, 30–320 auto-correlograms per site). Of the 7281 averaged visual responses analyzed, 2409 (33%) had been obtained during MRF stimulation. From the visual responses at the 45 pairs of sites recorded simultaneously, 3331 averaged cross-correlograms were computed; of these, 30% corresponded to visual responses obtained during MRF stimulation.
At four recording sites, averaged auto-correlation functions calculated over 4 sec suggested a superposition of oscillatory modulation in two different frequency ranges, around 30 and 90 Hz. To determine whether the two oscillation frequencies occurred simultaneously or successively during visual responses, we analyzed all responses in the recording session using a sliding window correlation algorithm. Averaged sliding auto- and cross-correlation functions were calculated for a 150 msec analysis window, which was placed at time 0 of each trial and moved in steps of 75 msec until the end of the visual response. The analysis windows were then normalized to the total number of spikes and averaged across corresponding windows in ten trials.
To assess the central state at the time of the visual responses, the power spectrum of the EEG was calculated over the same analysis window as the correlation functions (Fig. 1, EEG). Power spectra were averaged over the 10 consecutive trials in each block. The relative power in different frequency bands was obtained by normalizing the integral power in each band to the total power of the spectrum calculated between 1 and 120 Hz. Discrete peaks in EEG power were observed in four frequency bands, of 1–4, 4–8, 8–18, and 21–71 Hz; for the sake of simplicity, these bands will be referred to as δ, θ, α, and γ, respectively.
RESULTS
Oscillations in visual responses
Thirty-nine (74%) of the 53 sites recorded in areas 17 and 18 exhibited oscillatory visual responses in at least one of the averaged auto-correlograms obtained during the 3- to 10-hr-long recording sessions. In no case was oscillatory modulation phase-locked to the visual stimulus or to the screen refresh rate (see Materials and Methods). Overall, oscillation frequency ranged from 20 to 105 Hz, but at each oscillatory site it was either restricted to one of two frequency ranges, between 20 and 65 Hz at 30 sites and between 70 and 105 Hz at 3 sites, or alternated with no gradation between them at 6 sites (Fig. 2). Oscillatory modulation in the two frequency ranges differed markedly with respect to its onset latency and duration. Oscillatory modulation in the range between 70 and 105 Hz occurred at the beginning of the responses and lasted maximally 1 sec (Fig. 2, top right), similar to retinal oscillations (Neuenschwander et al., 1996b), whereas the modulation in the 20–65 Hz range tended to increase over several hundred milliseconds after response onset and lasted until the visual stimulus was turned off (Fig. 2, top left). Henceforth, we shall refer to oscillatory modulation in the 20–65 and 70–105 Hz frequency ranges as γ frequency and retinal-like oscillations, respectively. At four recording sites, retinal-like oscillations occurred at the beginning of single visual responses and were followed by γ frequency oscillatory modulation that persisted until the offset of the visual stimulus. In such cases, averaged correlation functions were calculated for two nonoverlapping windows that contained oscillatory modulation in either of the two frequency ranges, and for statistical analysis, the respective data were treated as if recorded independently. Altogether, γ frequency oscillations were analyzed at 36 recording sites, and retinal-like oscillations were recorded at nine sites.
Fig. 2.
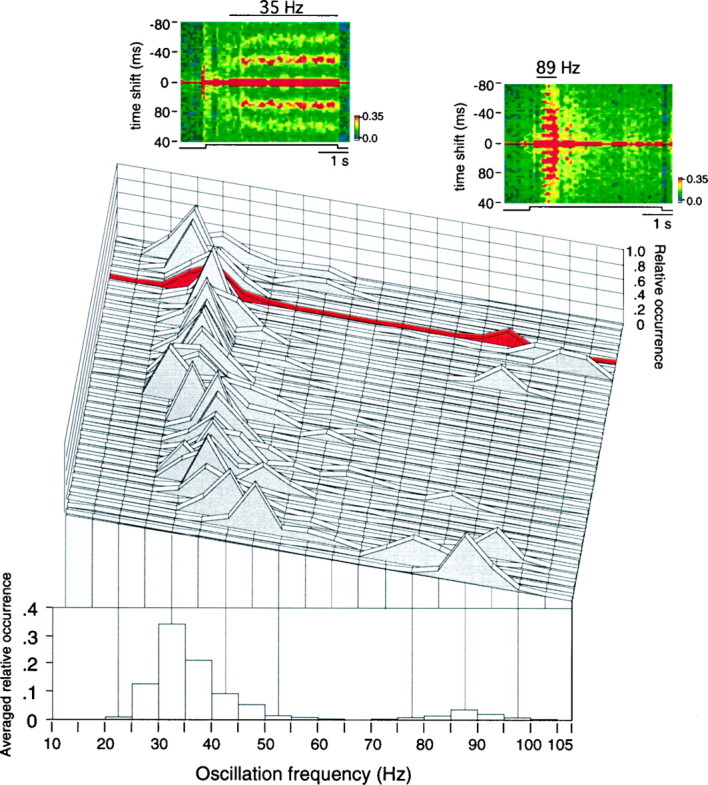
Center graph, Relative occurrence of oscillation frequencies (y-axis) from 15 to 110 Hz (x-axis) at each of 39 recording sites (z-axis). Bottom, Averaged distribution of oscillation frequencies across all recording sites. The relative occurrence of oscillation frequencies in the range of 15–110 Hz was first calculated in 5 Hz bins for each recording site (center graph); each bin was then summed and averaged across all 39 recording sites (bottom). The distribution is clearly bimodal, clustering around 30–35 and 85–90 Hz. Top insets, Sliding window (150 msec windows, 75 msec steps) averaged auto-correlation functions at two different times for the recording site indicated in red in the center graph, showing oscillatory activity at 35 Hz (left) and 89 Hz (right). Notice the difference in response onset and duration between the two oscillation frequencies.
When visual responses exhibited oscillatory modulation, of either γ frequency or the retinal-like type, the EEG displayed on average 88 ± 49% higher γ and 24 ± 21% lower δ power than when responses were nonoscillatory (p < 0.0001, Wilcoxon signed rank test; Fig. 3,bottom and top graphs). No consistent relations existed between the occurrence of γ frequency oscillatory response modulations and θ or α EEG power (Fig. 3, middle graphs).
Fig. 3.
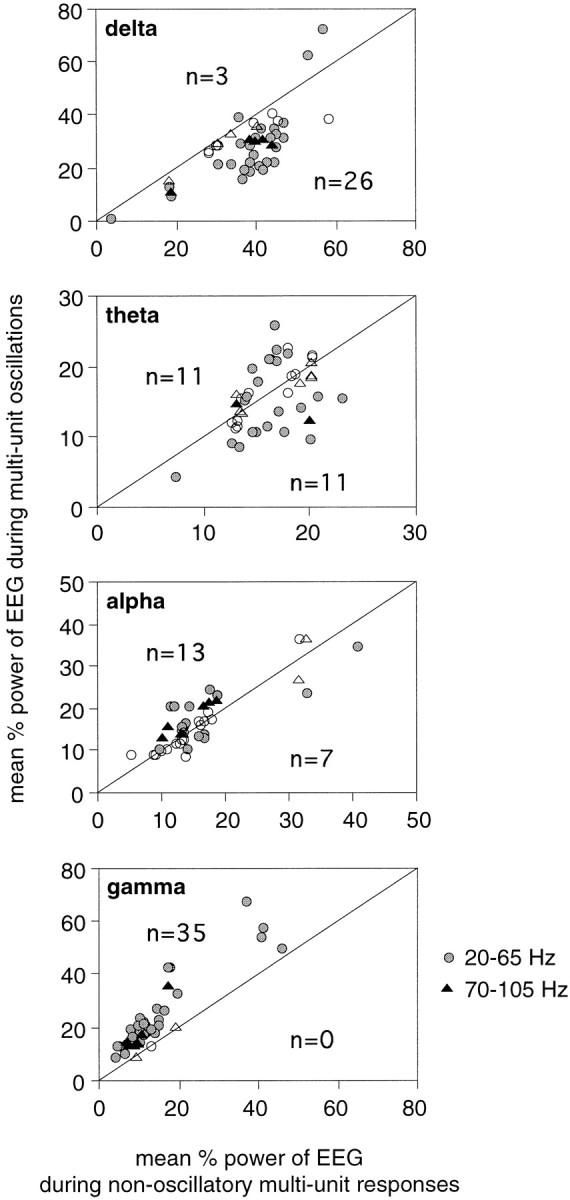
Scatterplots comparing the average power in different EEG bands during epochs associated with oscillatory (ordinate) and nonoscillatory (abscissa) responses. When visual responses exhibited an oscillatory modulation, the EEG contained lower relative δ and higher relative γ activity than when responses were not oscillatory. Each pointrepresents one recording site (n = 39).Symbols, Recording sites exhibiting either γ frequency (circles) or retinal-like (triangles) oscillations. Each block of 10 trials was classified as oscillatory or not, and the concurrent averaged relative EEG power in each band was pooled and averaged accordingly. Filled symbols, Averaged EEG power significantly different between oscillatory and nonoscillatory responses; p < 0.05, Mann–WhitneyU test (indicated in each graph); open symbols, no significant difference. Notice that although γ frequency oscillations had no consistent relationship with α EEG activity, retinal-like oscillations occurred at five of nine sites with significantly stronger and at none with weaker α EEG activity than nonoscillatory responses.
γ frequency oscillations: effect of MRF stimulation on incidence and strength
The probabilities of oscillatory patterning differed markedly between sites and depended on the state of activation. The proportion of averaged auto-correlograms exhibiting significant oscillatory modulation varied from 9 to 97% at the different recording sites exhibiting oscillatory responses. In the absence of MRF stimulation, 28% of the 2918 averaged auto-correlograms recorded from 36 sites exhibited γ frequency oscillations. With MRF stimulation, the incidence of γ frequency oscillations increased to 56% (p < 0.0001, Wilcoxon signed rank test), reaching 100% at several sites (Fig.4A). At five sites, γ frequency oscillations occurred only with MRF stimulation. Additionally, MRF stimulation increased the strength of γ frequency oscillatory modulation by an average of 55 ± 98% across all sites (p < 0.01, Wilcoxon signed rank test; Table 1). Oscillation strength at this frequency range was increased significantly (p< 0.01) at 15 of the 31 sites showing oscillatory modulation in the absence of MRF stimulation (Fig. 4B) and decreased at none of the sites (Table 1; range, 30–482% increase with MRF).
Fig. 4.
Effect of MRF stimulation on oscillatory modulation of visual responses. Scatterplots comparing percentile of averaged auto-correlation functions indicative of oscillatory modulation (A) and average oscillation strength (B) at each recording site, obtained with (ordinate) and without (abscissa) MRF stimulation. Each point represents one recording site.Circles, Sites exhibiting γ frequency oscillations only; crosses, sites exhibiting retinal-like oscillations only; triangles, sites exhibiting both types of oscillations.
Table 1.
Mean effect of MRF
| Parameters | % change with MRF | |||||
|---|---|---|---|---|---|---|
| All sites | Increase | Decrease | ||||
| n | %Δ | n | %Δ | n | %Δ | |
| Osc strength | ||||||
| Low-frequency | 31 | 54 ± 98* | 15 | 117 ± 116 | 0 | |
| High-frequency | 9 | −83 ± 35*** | 0 | 8 | −92 ± 22 | |
| Osc Frequency | ||||||
| Low-frequency | 31 | −9 ± 8*** | 0 | 11 | −18 ± 5 | |
| Sync strength, local | ||||||
| All sites | 53 | 68 ± 107** | 24 | 119 ± 116 | 4 | −36 ± 12 |
| No osc | 14 | 20 ± 56 (NS) | 1 | 124 | 1 | 35 |
| Osc | 39 | 76 ± 112** | 23 | 119 ± 118 | 3 | −37 ± 14 |
| Sync strength, pairs | ||||||
| All pairs | 19 | 55 ± 74** | 8 | 119 ± 73 | 0 | |
| Firing rate | 53 | −18 ± 48* | 13 | 24 ± 13 | 22 | −54 ± 53 |
Effect of MRF stimulation on several visual response parameters. The mean percentage change of each parameter (%Δ) is indicated first for all individual recording sites and pairs of recording sites together (All sites) and then separately for those sites or pairs exhibiting significant (p < 0.01, Mann–WhitneyU test) increases or decreases in each parameter. NS, nonsignificant (p > 0.01), Wilcoxon signed rank test. Osc, Oscillation; Sync, Synchronization.
*p < 0.01.
**p < 0.0001.
***p < 0.001.
The increased incidence and strength of γ frequency oscillatory modulation with MRF stimulation could be attributed to the stable enhancement of EEG activation produced by this treatment. During the 30–60 min period when MRF stimulation preceded each presentation of the visual stimulus, the EEG became characterized by strong and stable γ frequency activity (average increase, 67 ± 56%;p < 0.001, Wilcoxon signed rank test), accompanied by decreased relative δ content (average decrease, 27 ± 27%;p < 0.01, Wilcoxon signed rank test; Fig.5, shaded columns). In the absence of MRF stimulation, the EEG power content exhibited marked variation over time in each frequency band. Epochs of strong γ EEG activity also occurred spontaneously but then never lasted longer than 10 consecutive minutes. During these epochs neuronal responses often exhibited γ frequency oscillations (Fig. 5, nonshaded columns).
Fig. 5.
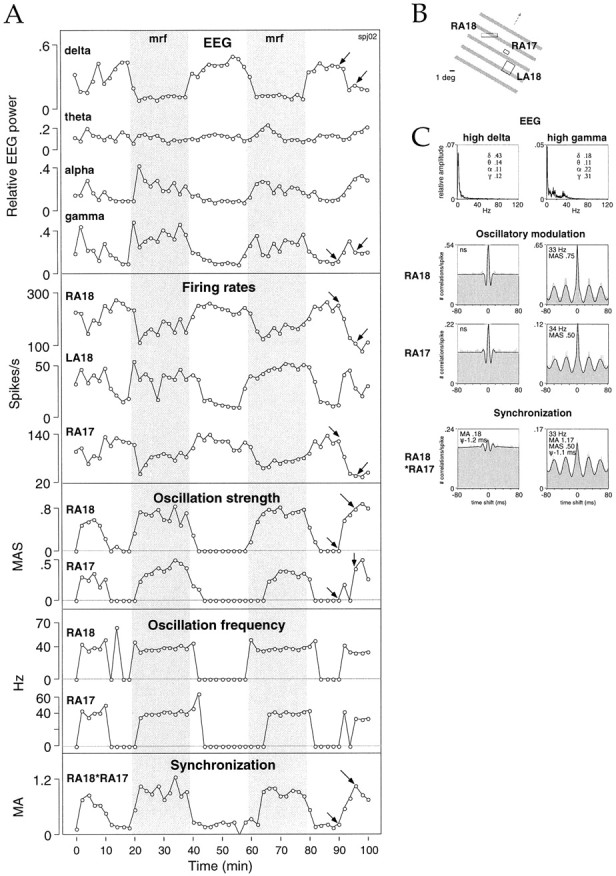
Synchronous oscillatory modulation of visual responses appears and disappears simultaneously in areas 17 and 18 concurrently with changes in the level of cortical activation occurring spontaneously or in response to MRF stimulation. A, Comparison of the time course of changes in EEG power (top box) with response variables (bottom boxes) at three recording sites in left area 18 (LA18), right area 18 (RA18), and right area 17 (RA17): firing rates, oscillation strength, oscillation frequency, and synchronization between RA18 and RA17. As the EEG becomes dominated by activity in the γ frequency range, firing rates increase at recording site LA18 and decrease at recording sites RA18 and RA17; responses at these two sites then begin to exhibit oscillatory modulation in the γ frequency range, and their synchronization becomes stronger. Shaded bars, Periods when MRF stimulation precedes each presentation of the visual stimulus.B, Receptive fields of the recording sites and visual stimulus. C, From top tobottom, averaged power spectra and auto- and cross-correlation functions for sites RA18 and RA17 measured at the times indicated by the arrows in A(duration of analysis window, 4 sec).
Correlation with EEG activation
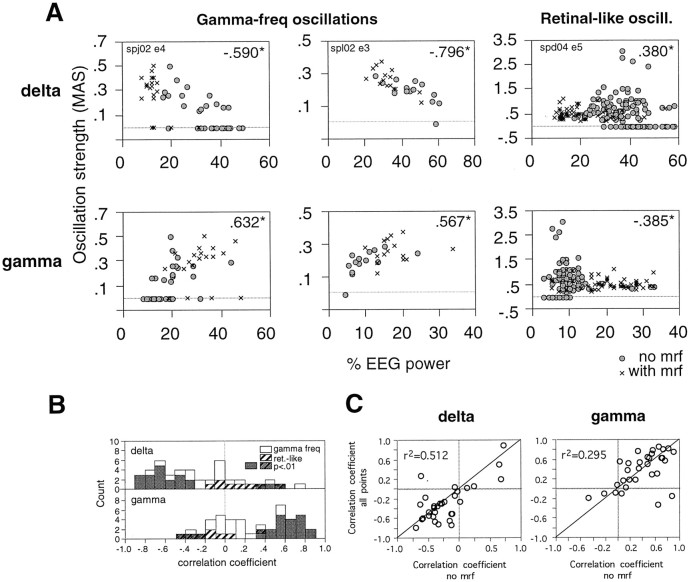
γ frequency oscillatory modulation of visual responses occurred reliably once EEG δ power was below and γ power above a critical level (Fig. 6). A critical γlimit could be defined, for 22 of 36 sites, as the relative γ power of the EEG above which visual responses had a 90% probability of exhibiting oscillatory modulation. At different sites, the critical γ limit for the occurrence of oscillatory modulation ranged from 4 to 29%, averaging 20 ± 8% relative γ power of the EEG. A similar critical δ limit, below which oscillatory modulation had a 90% probability of occurring in visual responses, could also be defined, albeit for fewer sites (n = 15). The average critical δ limit ranged between 10 and 32%, averaging 25 ± 11% relative δ EEG activity.
Fig. 6.
Relationship between strength of oscillatory modulation and EEG activation. A, Three recording sites are shown: two exhibiting γ frequency oscillations (the site depicted on the left corresponds to RA17 in Fig.5) and one exhibiting retinal-like oscillations. Eachpoint represents the strength of oscillatory modulation of visual responses (MAS, ordinate) and concurrent relative power of the EEG in the δ and γ frequency bands (abscissa) averaged over 10 consecutive trials.Insets, Spearman correlation coefficients; *p < 0.01. Circles, Without MRF stimulation; crosses, with MRF stimulation.B, Distribution of Spearman correlation coefficients obtained for each recording site from all data points (with and without MRF stimulation). Filled bars, p < 0.01. C, Correlation between Spearman coefficients calculated from all data points combined (with and without MRF stimulation, ordinate) and Spearman coefficients obtained exclusively from trials without MRF stimulation (abscissa). Five recording sites exhibited oscillatory modulation only during MRF stimulation and are therefore not included.Insets, Linear correlation coefficients;p < 0.01.
Once above the γ or below the δ critical limit of EEG activation, γ frequency oscillations varied in strength as a function of γ and δ EEG activity (average correlation coefficients, 0.361 ± 0.339 and −0.261 ± 0.392, respectively; p < 0.001; Table 2). According to ap < 0.01 significance criterion, γ frequency oscillations increased at 19 of 36 sites and in no case decreased with increasing γ EEG power content. Likewise, γ frequency oscillations increased in strength at 18 of 36 sites with decreasing δ and at only one site with increasing δ (Table 2, Fig. 6). At a few sites the strength of γ frequency oscillations correlated also with changes in θ or α EEG power, but there was no consistent trend across recording sites (Table 2).
Table 2.
Mean correlation values
| n | δ | n | θ | n | α | n | γ | |
|---|---|---|---|---|---|---|---|---|
| Osc strength, low frq | ||||||||
| All osc sites | 36 | −0.261 ± 0.392** | 36 | 0.015 ± 0.314 (NS) | 36 | 0.000 ± 0.378 (NS) | 36 | 0.361 ± 0.339*** |
| Positiver | 1 | 0.502 | 3 | 0.434 ± 0.187 | 5 | 0.604 ± 0.110 | 19 | 0.631 ± 0.140 |
| Negative r | 18 | −0.547 ± 0.146 | 5 | −0.396 ± 0.140 | 5 | −0.597 ± 0.157 | 0 | |
| Sync strength, pairs | ||||||||
| All pairs | 22 | −0.256 ± 0.302** | 22 | 0.064 ± 0.350 (NS) | 22 | 0.012 ± 0.366 (NS) | 22 | 0.364 ± 0.274*** |
| Positiver | 0 | 6 | 0.459 ± 0.182 | 4 | 0.473 ± 0.188 | 13 | 0.564 ± 0.107 | |
| Negativer | 9 | −0.543 ± 0.159 | 5 | −0.358 ± 0.066 | 5 | −0.462 ± 0.064 | 0 | |
| Sync strength, local | ||||||||
| Low-frq osc sites | 36 | −0.156 ± 0.419 (NS) | 36 | 0.061 ± 0.353 (NS) | 36 | 0.038 ± 0.364 (NS) | 36 | 0.341 ± 0.350*** |
| Positiver | 7 | 0.433 ± 0.180 | 10 | 0.426 ± 0.146 | 8 | 0.457 ± 0.236 | 18 | 0.617 ± 0.183 |
| Negative r | 15 | −0.526 ± 0.203 | 6 | −0.439 ± 0.190 | 10 | −0.368 ± 0.152 | 1 | −0.571 |
| Firing rate | ||||||||
| All sites | 53 | −0.095 ± 0.381 (NS) | 53 | −0.045 ± 0.289 (NS) | 53 | 0.080 ± 0.314 (NS) | 53 | 0.058 ± 0.435 (NS) |
| Positive r | 11 | 0.453 ± 0.194 | 7 | 0.425 ± 0.141 | 17 | 0.394 ± 0.138 | 27 | 0.523 ± 0.155 |
| Negativer | 21 | −0.428 ± 0.170 | 11 | −0.377 ± 0.098 | 4 | −0.532 ± 0.191 | 7 | −0.518 ± 0.189 |
Mean Spearman coefficients for correlations between EEG power in the different frequency bands and several visual response parameters. The mean correlation coefficient is first given for all sites or pairs of sites pooled together and then separately for only those sites exhibiting a significant (p < 0.01, Mann–WhitneyU test) positive or negative correlation between visual response variables and EEG power. NS, Nonsignificant (p > 0.01), one-sample rank test. Osc, oscillation; Sync, synchronization; frq, frequency.
*p < 0.001.
**p < 0.0001.
***p < 0.001.
Oscillation frequency versus oscillation strength
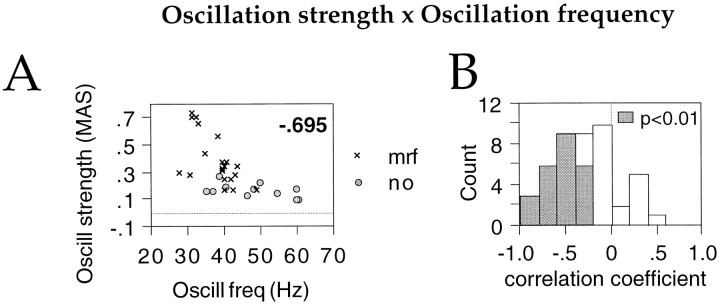
So far, other studies have not found an explanation for the variability in oscillation frequency across visual responses at a given site (Engel et al., 1990; Livingstone, 1996). We found that oscillation frequency in the γ frequency range decreased significantly (p < 0.01) with increasing oscillation strength at 20 of 36 sites (Fig. 7A; average Spearman correlation coefficient for the 20 sites, −0.539 ± 0.175). In no case was stronger oscillatory modulation significantly associated with increased oscillation frequency (Fig.7B).
Fig. 7.
Relationship between oscillation strength and frequency for γ frequency oscillations. A, Scatterplot for one recording site comparing the strength of oscillatory modulation (MAS, ordinate) of visual responses with oscillation frequency (hertz, abscissa). Each pointrepresents averages over 10 consecutive trials.Inset, Spearman correlation coefficient;p < 0.01. Circles, Without MRF stimulation; crosses, with MRF stimulation.B, Distribution of Spearman correlation coefficients between oscillation strength and frequency across all sites exhibiting γ frequency oscillations. Shaded bars, correlation significant at p < 0.01.
Effect of MRF stimulation on visual response oscillation frequency
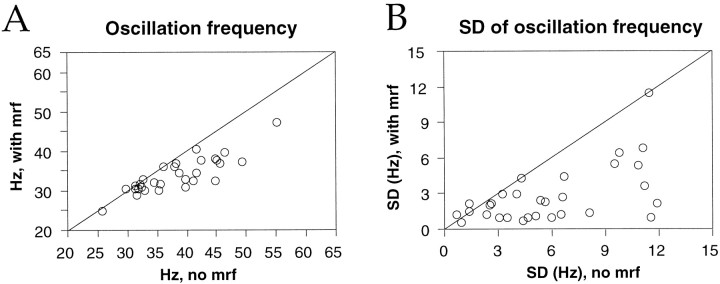
Because oscillation frequency was related to oscillation strength, and the latter depended on EEG activation, we next examined whether oscillation frequency was modulated together with EEG activation by MRF stimulation. The overall effect of MRF stimulation was a significant decrease in the average oscillation frequency in the γ range (Table1). Eleven of 31 sites that exhibited γ frequency oscillations in the absence of MRF stimulation underwent a significant (p < 0.01) reduction in oscillation frequency with MRF stimulation, which on average decreased from 43 ± 5 to 36 ± 5 Hz (Fig.8A); oscillation frequency remained unchanged at the other 20 sites (Table 1).
Fig. 8.
Effect of MRF stimulation on visual response oscillation frequency in the γ frequency range. Scatterplots comparing averaged oscillation frequency (A) and its SD (B) at different recording sites, when measured with (ordinate) and without (abscissa) MRF stimulation. Each pointrepresents one recording site.
The variability in oscillation frequency was consistently reduced with MRF stimulation (Fig. 8B), the sample variance of oscillation frequency decreasing by a factor of 3 at individual recording sites (p < 0.0001, Wilcoxon signed rank test). The stabilizing effect of MRF stimulation on EEG activation and on oscillation frequency of the multiunit responses may reflect the stabilization of the dynamics of underlying cortical circuits.
Relation between oscillation frequency and EEG activation
Interestingly, there was no consistent correlation across the entire sample between oscillation frequency and EEG γ power, the average correlation coefficient being 0.140 ± 0.475 across the 36 sites exhibiting γ frequency oscillations (p = 0.6177, one-sample rank test). This was, however, not attributable to independence between oscillation frequency and γ EEG power; rather, these two parameters were positively or negatively correlated at different sites (Fig. 9A). With increasing γ power of the EEG, oscillation frequency in the 20–65 Hz range increased significantly (p < 0.01) at 10 and decreased at 9 of 36 sites (Fig. 9B).
Fig. 9.
Relationship between oscillation frequency and relative EEG γ power. A, Scatterplots for visual responses obtained at three different recording sites (1 perbox). The oscillation frequency of visual responses (hertz, ordinate) is plotted against the concurrent relative γ power of the EEG (percent, abscissa). Eachpoint represents the averaged values from 10 consecutive trials. Inset, Spearman correlation coefficients;p < 0.01; ns, nonsignificant.Circles, Without MRF stimulation;crosses, with MRF stimulation. B, Distribution of Spearman correlation coefficients between oscillation frequency and EEG γ power across all sites. Shaded bars, Correlation significant at p < 0.01.
Retinal-like oscillations
Effect of MRF stimulation on incidence and strength
Retinal-like 70–105 Hz oscillations were affected by MRF stimulation in a strikingly different manner. With MRF stimulation, retinal-like oscillations were suppressed completely at seven of nine sites and decreased in strength at one (Fig. 4B, crosses). At the six sites that showed both γ frequency and retinal-like oscillations during spontaneous variations in EEG activation, only the former persisted during MRF stimulation.
Correlation with EEG activation
EEG activation was stronger during responses exhibiting retinal-like oscillations than during nonoscillatory responses (Fig. 3,triangles), suggesting that the occurrence of retinal-like oscillations in cortical visual responses also required EEG activation. However, the strength of these retinal-like oscillations was only weakly correlated with EEG power in the different frequency bands (Fig.6). The lack of a consistent covariation between EEG activation and strength of retinal-like oscillations was probably attributable to the suppression of these oscillations once EEG activation exceeded a certain value.
Oscillation frequency
The oscillation frequency of retinal-like oscillations was at four of nine sites correlated at the p < 0.01 level with oscillation strength, stronger oscillations exhibiting lower oscillation frequency (average Spearman correlation coefficient, −0.618 ± 0.184). Oscillation frequency in the 70–105 Hz range, however, was never correlated with γ EEG activity (see example in Fig. 9).
Relationship between retinal-like and γ frequency oscillations
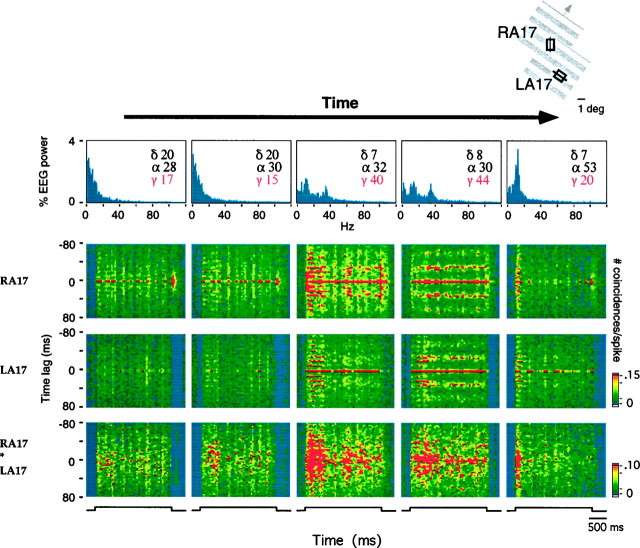
At the six sites that exhibited oscillatory modulation in both frequency ranges, retinal-like oscillations in general disappeared when γ frequency oscillations appeared in the responses (Fig.10). As cortical activation increased spontaneously, the temporal patterning of cortical responses changed in the course of successive visual responses first from nonoscillatory to retinal-like and then to γ frequency oscillatory modulation (Fig. 10,first four columns). With MRF stimulation, which induced maximal EEG activation and strongest oscillatory modulation in the γ frequency range, retinal-like oscillations were suppressed. As EEG activation declined, either spontaneously or at the end of the MRF stimulation period, retinal-like oscillations reappeared and persisted at levels of activation at which γ frequency oscillations had already disappeared (Fig. 10, last column to the right).
Fig. 10.
Transition from nonoscillatory to retinal-like and then to γ frequency oscillatory responses with increasing EEG activation. Top row, Averaged EEG power spectra at consecutive time points without MRF stimulation. Center rows, Averaged sliding window auto-correlograms for responses from sites recorded simultaneously from area 17 in the two hemispheres [right area 17 (RA17), left area 17 (LA17)]. Bottom row, Averaged sliding window cross-correlograms for the two recording sites. Sliding window size, 150 msec; step size, 75 msec; bin width, 2 msec. All sliding window correlation functions are normalized to the total number of spikes in the period. The time course of visual stimulation is indicated at the bottom. Oscillatory modulation was in general absent when the EEG was dominated by δ activity (left column). When the γ EEG content increased, the initial phase of the light responses exhibited retinal-like oscillations at ∼95 Hz that appeared simultaneously at the recording sites in both hemispheres (compare first three columns). As γ EEG power increased further, retinal-like oscillatory modulation decreased again and gave way to a sustained oscillatory modulation in the γ frequency range (30–40 Hz, fourth column). Retinal-like oscillations at this time had disappeared from the responses at site RA17. At site LA17 there is a smooth transition between retinal-like and γ frequency oscillations that is readily seen in single responses. As EEG activation decreased again (right column), γ frequency oscillations disappeared, whereas the transient retinal-like oscillations are again well expressed in the visual responses at both sites.
At three of the six sites showing both γ frequency and retinal-like oscillations, the latter occurred at levels of δ and γ EEG activity intermediate to those observed when oscillatory modulation was absent or occurred in the γ frequency range (Mann–Whitney Utest, p < 0.01; Fig. 10). Together with the fact that in the transition from weak to strong EEG activation retinal-like oscillations preceded γ frequency oscillations, this finding suggests that the occurrence of both types of oscillations require a certain level of EEG activation, but that the level required for the occurrence of retinal-like oscillations is lower than for the occurrence of γ frequency oscillations.
Synchronization of visual responses across sites
If response synchronization plays a role in visual information processing, it should, like visual experience, be modulated with central state. We examined this hypothesis by looking at the variation in response synchronization during different levels of EEG activation. Twenty-four of the 45 pairs of sites recorded simultaneously exhibited at least one averaged cross-correlogram indicative of response synchronization in the millisecond range during the 3- to 10-hr-long recording sessions. This synchronization was not attributable to stimulus-locked rate covariations, as indicated by flat shift predictors. In all 24 pairs, the cross-correlograms exhibited significant satellite peaks, indicating that the underlying responses were oscillatory. This agrees with the observation that responses from at least one of the recording sites in each pair showed oscillatory patterning in the auto-correlogram.
When visual responses were synchronized across sites, the EEG contained on average 18 ± 22% lower δ and 66 ± 52% higher γ than when no synchronization occurred (p < 0.01, Wilcoxon signed rank test; Fig.11, top and bottom graphs; n = 20; four pairs had to be excluded because all or almost all cross-correlograms exhibited synchronization). Two pairs of recording sites exhibited synchronous oscillations at both 20–65 and 70–105 Hz; at both frequency ranges, the EEG contained lower δ and higher γ activity when responses were synchronized than when no synchronization occurred (Fig. 11,triangles).
Fig. 11.
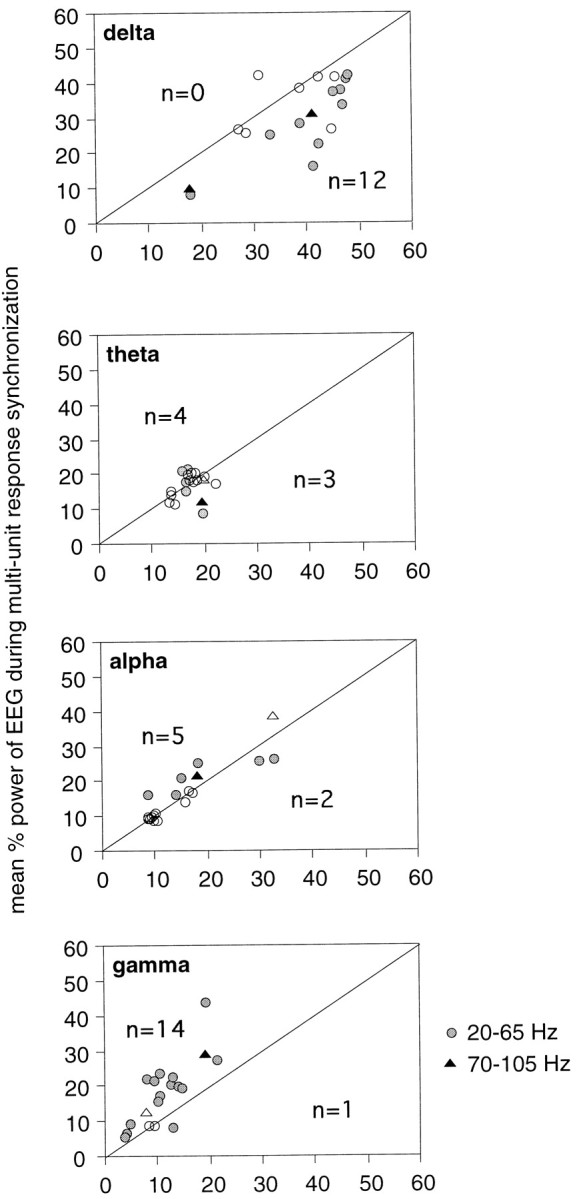
Scatterplots comparing the power in different EEG bands (1 band per box) in epochs associated with synchronized (ordinate) and nonsynchronized (abscissa) responses. When visual responses exhibited synchronization, the EEG contained lower relative δ and higher relative γ activity than when the responses were not synchronized. Each point represents one recording site (n = 20). Symbols, Pairs of sites exhibiting γ frequency (circles) or retinal-like (triangles) oscillations. Responses averaged over each block of 10 trials were classified as synchronized or not, and the concurrent averaged relative EEG power in each band was pooled and averaged accordingly. Filled symbols, Averaged EEG power significantly different between synchronized and nonsynchronized responses; p < 0.05, Mann–WhitneyU test (indicated in each graph); open symbols, no significant difference.
Effect of MRF on incidence and strength
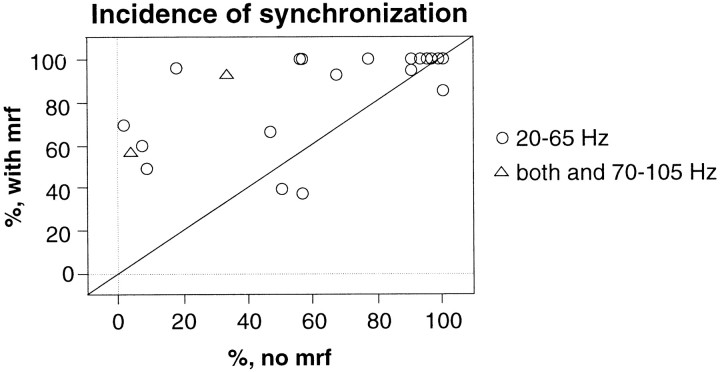
Of the total sample of 2025 averaged cross-correlograms analyzed for the 24 pairs, 1293 (68%) showed synchronization (range, 7–100% for the different pairs). In 18 of 21 pairs, synchronization of visual responses occurred more frequently during MRF stimulation (84%) than during spontaneous EEG fluctuations (60%, p < 0.01, Wilcoxon signed rank test; two pairs not tested under MRF stimulation and another exhibiting synchronization at all times were excluded; Fig.12). For one pair of sites, synchronization occurred only when EEG activation was enhanced by MRF stimulation.
Fig. 12.
Effect of MRF stimulation on incidence of response synchronization. Scatterplot comparing percentile of cross-correlation functions indicative of synchronization at each pair of recording sites for responses obtained with (ordinate) and without (abscissa) MRF stimulation. Each point represents one recording site.Circles, Synchronization across sites exhibiting only γ frequency oscillations; triangles, synchronization across sites exhibiting either γ frequency or retinal-like oscillations.
Additionally, the strength of synchronization across recording sites increased with MRF stimulation in 8 of 17 pairs exhibiting a sufficient number of synchronized correlograms to permit comparison (Table 2; average increase, 55 ± 74% over all 17 sites; p < 0.01, Mann–Whitney Utest). In none of the pairs did MRF stimulation reduce synchronization strength.
Correlation between strength of synchronization across sites and EEG activation
In addition to the dependence of the occurrence of response synchronization on EEG activation, the strength of response synchronization was correlated with γ and δ EEG power (average correlation coefficients, 0.364 ± 0.274 and −0.256 ± 0.302, respectively; Table 2). According to a significance criterion ofp < 0.01 (Spearman correlation test), the strength of synchronization across sites increased with γ EEG activity in 13 of 22 pairs (Fig. 13A–C, Table2; one pair showing synchronization only during MRF stimulation was excluded). In no case was increased γ EEG power associated with reduced synchronization (Table 2). Synchronization became weaker with increasing δ EEG activity in nine pairs and stayed unchanged in the other pairs. The strength of synchronization across sites was occasionally correlated with changes in θ and α EEG power but with no consistent sign (Table 2).
Fig. 13.
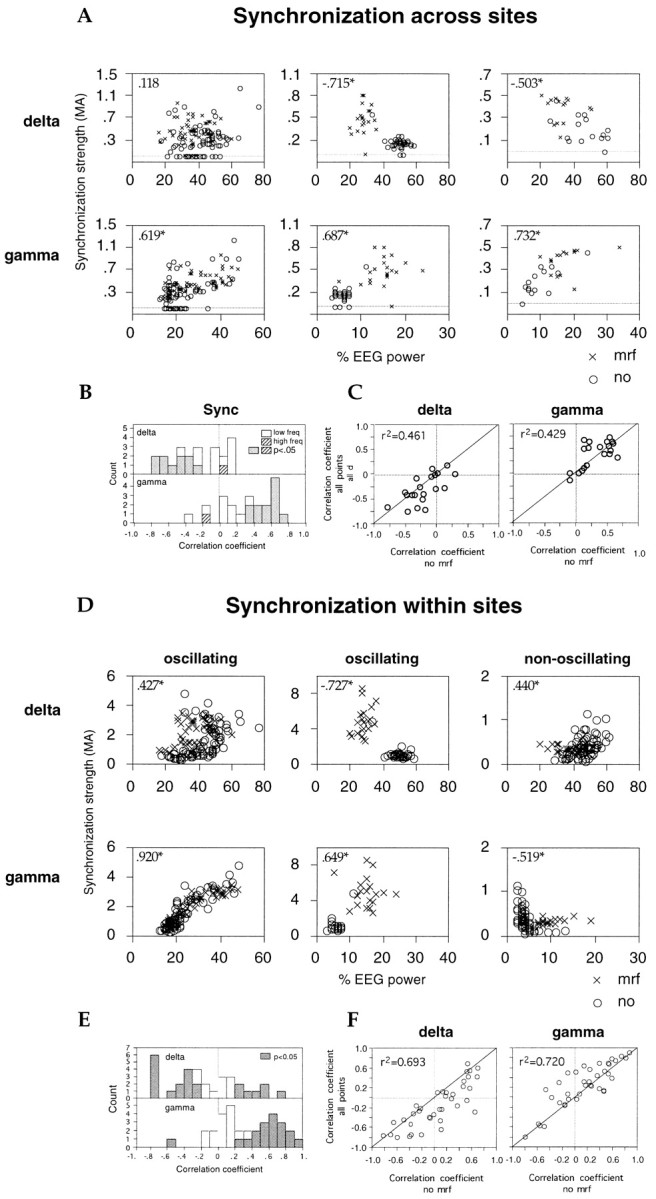
Relationship between EEG activation and strength of synchronization across (A) or within (B) recording sites. A, Data from three different recording site pairs recorded in different sessions (columns). Each point in the scatterplots represents the strength of synchronization in visual responses (MA,ordinate) and concurrent relative power of the EEG in the various frequency bands (abscissa) averaged over 10 consecutive trials. Insets, Spearman correlation coefficients; *p < 0.01. B, Distribution of Spearman correlation coefficients obtained for each recording pair from all data points (with and without MRF stimulation).Filled bars, p < 0.05.C, Correlation between Spearman coefficients calculated from all data points combined (with and without MRF stimulation,ordinate) and Spearman coefficients obtained exclusively from trials without MRF stimulation (abscissa). One recording pair exhibited synchronization only during MRF stimulation and is therefore not included. Insets, Linear correlation coefficients; p < 0.01 and 0.02, respectively. D–F, Local synchronization of visual responses. Conventions as in A–C. Two of the three sites in A exhibited oscillatory modulation (left and center columns), one did not (right column). F, insets, Linear correlation coefficients; p < 0.0001.
Local synchronization of visual responses
Local synchronization of the multiunit responses recorded simultaneously from one electrode was assessed by calculating the relative modulation amplitude of the center peak of the auto-correlograms (see Materials and Methods). The strength of local synchronization increased with MRF stimulation by 68 ± 107% (p < 0.001; Table 1). According to a significance criterion of p < 0.01 (Mann–WhitneyU test), local synchronization strength increased at 23 and decreased at only 3 of 36 sites exhibiting γ frequency oscillations (Table 1). This suggests that local synchronization of oscillatory visual responses increased with EEG activation.
As expected from the coherent effects of MRF stimulation on synchronization and on the EEG, there was a close correlation between the increase in local synchronization strength and in γ power of the EEG across visual responses (average correlation coefficient, 0.341 ± 0.350; p < 0.0001, Wilcoxon signed rank test). At 18 of the 36 sites exhibiting γ frequency oscillations, the correlation between local synchronization strength and γ EEG power was positive and significant at the p < 0.01 level (Fig. 13D–F). Local synchronization decreased with increasing γ EEG power at only one site. In contrast, at 3 of the 14 sites that at no time showed oscillatory responses, local synchronization decreased significantly with increasing EEG γ activity.
Synchronization versus oscillatory modulation
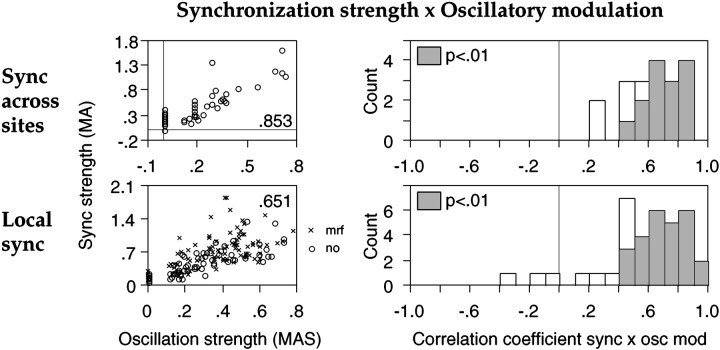
In the pairs exhibiting synchronized visual responses, the cross-correlograms often showed an oscillatory modulation, and the corresponding auto-correlograms were oscillatory at least at one of the two sites. We wondered therefore whether the strength of synchronization and of oscillatory modulation were related, as suggested by previous studies (König et al., 1995; Volgushev et al., 1998). Comparison of the two variables revealed that the amplitude of γ frequency oscillatory modulation at one or both sites was positively correlated at the p < 0.01 level with the strength of synchronization across sites in 14 of 18 pairs (0.699 ± 0.122, average Spearman rank correlation; Fig.14, top). Six of the 24 pairs were excluded because the number of correlograms indicative of synchronous responses was too small for statistical evaluation (n < 15). Likewise, the strength of oscillatory modulation was also positively correlated at the p < 0.01 level with local synchronization at 30 of the 39 sites exhibiting oscillations (average Spearman correlation coefficients: γ frequency oscillations, 0.699 ± 0.148; n = 26; retinal-like oscillations, 0.652 ± 0.229; n = 4; Fig. 14,bottom). In no case was there a significant (p < 0.01) negative correlation between the strength of synchronization and the strength of oscillatory modulation of the visual responses (Fig. 14, right).
Fig. 14.
Relationship between synchronization and oscillation strength of visual responses. Left, Examples of scatterplots of synchronization strength (MA,ordinates) and oscillation strength (MAS,abscissa), where each point represents the average over 10 consecutive trials. Top, Synchronization across two recording sites; bottom, local synchronization at a different site. Insets, Spearman correlation coefficient; p < 0.01.Circles, Without MRF stimulation;crosses, with MRF stimulation. Right, Distribution of Spearman correlation coefficients between strength of oscillation and of synchronization across sites (top) or locally (bottom). Shaded bars, Correlation significant at p < 0.01.
Interdependence of oscillation frequency, oscillatory modulation, synchronization, and EEG activation
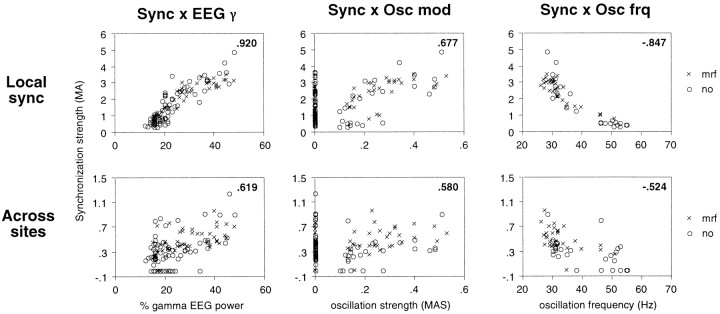
An increase in synchronization strength often went along with a decrease but never with an increase in oscillation frequency of the visual responses. For local synchronization, this relation reached significance (p < 0.01) at 25 of 39 oscillatory sites and for synchronization across sites in 15 of 18 pairs (average Spearman correlation coefficients, −0.644 ± 0.204 and −0.614 ± 0.174, respectively; Fig.15, right column).
Fig. 15.
Relationship between local synchronization (top row) or synchronization across sites (bottom row) and γ power of the EEG (Sync ×EEG γ, left column), oscillatory modulation (Sync × Osc mod,center column), and oscillation frequency (Sync × Osc frq, right column). Two sites were recorded from A17 of the same hemisphere; the strength of local synchronization is depicted for only one of the two sites. Ordinates, Strength of synchronization (MA). Abscissas, fromleft to right, Relative γ power of the EEG, strength of oscillatory modulation (MAS), and oscillation frequency (hertz) at the site depicted in the top row. Examples of correlograms from the two sites are displayed in Figure 16.Circles, No MRF; crosses, during MRF stimulation. Insets, Spearman correlation coefficients;p < 0.01.
At 21 of 36 recording sites, increasing local synchronization was correlated at the p < 0.01 level with bothincreasing oscillatory modulation and decreasing oscillation frequency and at 12 of these sites additionally with increasing γ EEG power (Fig. 15, top row). Likewise, in 12 of 18 pairs stronger intersite synchronization was correlated with both lower oscillation frequency and stronger oscillatory modulation at least at one of the sites and additionally with higher γ EEG power in 7 of these pairs (Fig. 15, bottom row).
For the nine sites where the γ oscillation frequency of visual responses decreased with increasing γ power of the EEG, the strength of the oscillations and of the synchronization increased consistently with decreasing oscillation frequency and increasing γ EEG power (Fig. 16, compare auto-correlograms from left to right). As the γ power of the EEG increased, the modulation of the γ frequency oscillations became stronger, and their oscillation frequency decreased. Local synchronization also increased significantly with both increasing oscillatory modulation and decreasing oscillation frequency at seven of the nine recording sites and with increasing γ EEG power at six of these sites. Likewise, the strength of synchronization across sites increased for 12 pairs with increasing oscillatory modulation and decreasing oscillation frequency in at least at one of the sites and with increasing γ EEG power in seven of these pairs (Figs. 15, 16, compare correlograms from left to right).
Fig. 16.
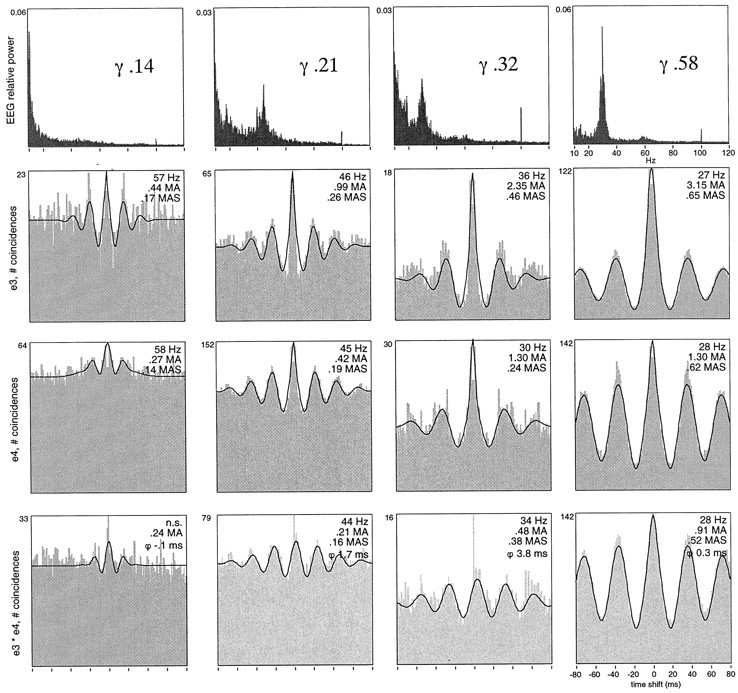
Covariation of EEG γ activity with oscillation frequency, oscillatory modulation, local synchronization, and intrahemispheric synchronization of visual responses recorded from two sites in A17 (e3, e4, same as in Fig.15). Top row, Averaged EEG power spectra at four nonconsecutive time points, the second one having been obtained during MRF stimulation. Numbers refer to relative γ power in the respective epochs. Second row, Averaged auto-correlation functions of visual responses recorded during corresponding epochs from site e3; third row, averaged auto-correlation functions of responses from e4; bottom row, averaged cross-correlation functions of visual responses across sites e3 and e4. For each correlogram, oscillation frequency (hertz), oscillation strength (MAS), and synchronization strength (MA) and phase (ϕ, milliseconds) are indicated. With increasing relative γ content in the EEG (left to right columns), the oscillation frequency of the visual responses decreases from ∼60 to <30 Hz at both sites. At the same time, the strength of oscillatory modulation of local synchronization and of synchronization across the sites increases.
Taken together, our results demonstrate that oscillatory modulation, oscillation frequency, and synchronization are interrelated. Moreover, all three variables depend on EEG activation, whereby this dependence is most consistent for the strength of oscillation and of synchronization. Because visual responses have been reported to change in strength with central states, we next examined how oscillatory modulation and synchronization related to response firing rates.
Firing rates
Correlation with EEG activation
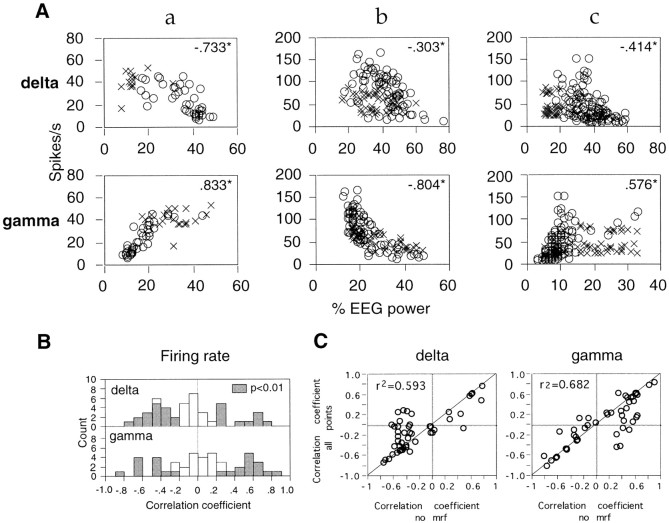
Overall, variations in response firing rate were not significantly correlated with EEG γ power (Table 2). This was, however, not attributable to independence between firing rates and γ EEG power; rather, these two parameters were often significantly correlated but with opposite signs at different sites (Fig.17). With spontaneously increasing γ power of the EEG, response firing rates increased significantly (p < 0.01) at 27 and decreased at 7 of 53 sites (Table 2). At 21 of these 34 sites, changes in firing rates were also significantly (p < 0.01) correlated with changes in δ EEG power, and as expected, this relation was inverse to that found for the dependence on γ EEG power. At five other sites, firing rates correlated only with δ and not with γ power, positively at three sites and negatively at two. At another two sites, response firing rates correlated exclusively with changes in θ EEG power, negatively at one site and positively at the other. At three sites, response firing rates correlated exclusively with α EEG power, in all three cases positively, and at one site the firing rate was positively correlated with changes in both θ and α EEG power. On several occasions, discharge rates at different, simultaneously recorded sites changed in opposite directions as a function of EEG activation (see Fig. 5).
Fig. 17.
Relationship between firing rates and EEG activation. A, Three different recording sites are illustrated (a–c). Each point in the scatterplots represents the response firing rate at a recording site and the concurrent relative power of the EEG in the δ (top row) and γ (bottom row) frequency bands, averaged over 10 consecutive trials. Circles, No MRF;crosses, during MRF stimulation. Insets, Spearman correlation coefficient; *p < 0.01.B, Distribution of Spearman correlation coefficients obtained for each recording site from all data points (with and without MRF stimulation). Filled bars, p < 0.01. C, Correlation between Spearman coefficients calculated from all data points combined (with and without MRF stimulation, ordinate) and Spearman coefficients obtained exclusively from trials without MRF stimulation (abscissa). Insets, Linear correlation coefficients; p < 0.0001.
Effect of MRF stimulation
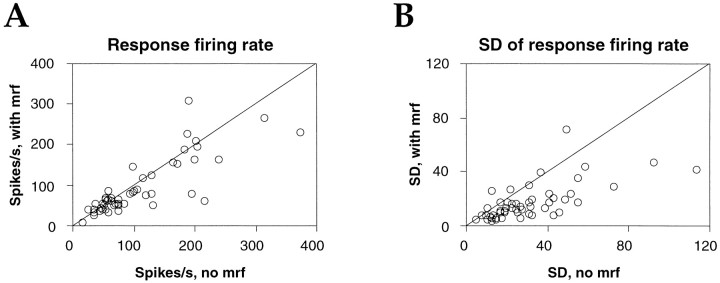
The general effect of MRF stimulation was a decrease in response firing rates by 18 ± 48%; however, firing rates could either increase or decrease at different sites during this treatment (Table 1). At the p < 0.01 significance level (Mann–Whitney U test), MRF stimulation had significant effects on average response firing rate at 33 of the 53 sites, causing an increase at 10 sites (average, 42 ± 26%) and a decrease at 23 sites (average, 27 ± 21%; Fig.18A). Because MRF stimulation caused in most cases an increase in EEG γ power, this implies that MRF stimulation affected firing rates and γ frequency oscillations and synchronization differently. This is in line with the fact that changes in firing rate with MRF stimulation were not always in the same direction as changes associated with spontaneous EEG activation. Of 27 recording sites at which response ratesincreased with spontaneously increasing γ EEG activity, 8 showed an increase and another 8 showed a decrease in firing rate with MRF stimulation (Fig. 17c), indicating that there is no simple correlation between firing rates and EEG activation. Of the seven sites at which response rates decreased with increasing EEG γ activity, six also showed a decrease with MRF stimulation. The remaining site was unaffected by MRF stimulation. However, irrespective of whether MRF stimulation enhanced or reduced firing rates, it stabilized the responses, reducing sample variance by 56 ± 40% (p < 0.0001, Wilcoxon signed rank test; Fig.18B).
Fig. 18.
Effect of MRF stimulation on visual response firing rates. Scatterplots comparing averaged firing rate (A) and its SD (B) at each recording site, obtained with (ordinate) and without (abscissa) MRF stimulation. Each pointrepresents one recording site.
Relation among firing rate, oscillations, and synchronization
Variations in firing rate alone could not account for the variations in oscillatory modulation or synchronization. When γ frequency oscillation strength increased with increasing EEG γ power (n = 19 sites), firing rates increased at six sites, decreased at five sites, and remained unchanged at eight sites (significance criterion, p < 0.01, Spearman correlation test). Likewise, of the 13 recording pairs for which synchronization across sites increased coordinately with EEG activation, response rates changed jointly at both sites in 4 pairs (as in Fig. 5), changed in opposite directions in 7 pairs, and were not at all affected at either site in 2 pairs when EEG activation increased. These observations indicate that there is no simple relationship between firing rates and oscillations or synchronization during visual responses, excluding the possibility that increased oscillatory modulation and synchronization of responses with increased central activation was simply a consequence of enhanced responses.
DISCUSSION
Our results demonstrate that synchronous oscillations of visual responses are state-dependent, and that this dependence cannot be attributed to modulation of response firing rates. In fact, there is a clear dissociation in the state dependence of the amplitude of responses on the one hand and their temporal patterning on the other. During states when the EEG was dominated by δ waves, visual responses were still vigorous but exhibited no oscillatory modulation or synchronization. Furthermore, progressive increases in EEG activation are more consistently reflected at the unitary level in the strength of γ frequency oscillations and of both local and intercolumnar synchronization than in the firing rate of the underlying visual responses. Thus, transitions from central states that are compatible with sensory processing to states that are not are reflected better by changes in the precise temporal patterning of visual responses than by changes in firing rates.
Oscillatory modulation and synchronization of responses in the mammalian visual cortex are dynamic phenomena that exhibit a high degree of variability in both strength and frequency (Engel et al., 1990; Livingstone, 1996). The present study shows that this variability is tightly linked to state changes. Oscillatory modulation of visual responses and their synchronization do not occur during high levels of δ EEG activity characteristic of slow-wave sleep but are prominent when the EEG exhibits strong γ activity, characteristic of waking or dreaming states. There is in addition a tight and positive correlation among the strength of oscillatory modulation, the strength of response synchronization, and the amount of γ power in the EEG, indicating a very dynamic and direct relationship between the temporal patterning of visual responses and the state of cortical activation. The most parsimonious interpretation of this finding is that states characterized by a desynchronized EEG such as arousal or REM sleep facilitate the oscillatory patterning and the synchronization of neuronal responses in the γ frequency range.
When interpreting variations of neuronal response patterns over several hours, recording stability is a concern. It is unlikely that the observed variability resulted from uncontrolled electrode slip because of the tight and systematic covariation among the various response parameters. Another reason for response variability could have been that a subpopulation of previously silent neurons became responsive during EEG desynchronization. If these newly recruited cells were intrinsically oscillatory, such as chattering cells (Gray and McCormick, 1996), this could account for the close correlation between EEG states and oscillatory patterning of responses. In this scenario, the appearance of an oscillatory modulation should be systematically associated with increased firing rates in the multiunit recordings, but this was not the case. On the contrary, often the increase in oscillatory modulation and synchronicity in the γ frequency range was associated with a decrease in firing rate, especially with MRF stimulation. The most likely interpretation is, therefore, that activated states are associated with a change in the temporal patterning of individual neuronal responses. This agrees with the evidence obtained from intracellular recordings in the auditory and somatosensory cortex that individual neurons undergo a change in membrane potential fluctuations from large-amplitude, slow (1–5 Hz) oscillations to low-amplitude, fast (20–40 Hz) oscillations when the state of cortical activation changes, either spontaneously (Steriade et al., 1996) or in response to electrical stimulation of the nucleus basalis (Metherate et al., 1992).
Synchronization and oscillatory modulation of visual responses occurred in two distinct frequency ranges (20–65 and 70–105 Hz), and these two patterns differed markedly in their time course during individual responses, in their dependence on central states, and in the way they were affected by MRF stimulation. The oscillatory modulation in the high-frequency range resembles that described previously in the retina and lateral geniculate nucleus of the anesthetized cat (Neuenschwander and Singer, 1996), suggesting a subcortical origin. This is supported by the evidence that these high-frequency oscillations are synchronized between the retina and cortical areas 17 and 18, whereby the cortical oscillations exhibit a phase lag compatible with feed-forward synchronization (Castelo-Branco et al., 1998). In contrast, the low-frequency oscillations have no retinal counterpart. In the rare cases in which thalamic responses are correlated with the low-frequency cortical oscillations, phase relations indicate a cortical origin of the oscillatory patterning (Castelo-Branco et al., 1998). This agrees with the present evidence that the oscillation frequency and strength of 20–65 Hz oscillations were state-dependent, whereas the respective parameters of the 70–105 Hz oscillations were not. Thus, the oscillatory patterning and the synchronization in the low frequency range appear to be attributable to intracortical interactions, whereas the high-frequency oscillations are secondary to temporally patterned subcortical input.
The occurrence of both γ frequency and retinal-like oscillations required a minimal level of EEG activation, but the respective thresholds were different. The activation of the mechanisms mediating γ frequency synchronous oscillations required more activation than the ability of cortical neurons to follow high-frequency oscillatory subcortical input. During transitions from δ-dominated to γ-dominated EEG activity, the retinal-like oscillations appeared first, and the γ frequency oscillations appeared only a couple of minutes later (Fig. 10), in which case both oscillatory phenomena could coexist within single visual responses. When activation was further enhanced by MRF stimulation, γ frequency synchronous oscillations became more prominent, whereas retinal-like synchronous oscillations became reduced or completely suppressed. We propose the following interpretation for the differential state dependence of retinal-like and γ frequency oscillations. In the nonactivated state, in which the EEG is dominated by δ waves, geniculate neurons would still be able to relay the fast 70–105 Hz retinal oscillations, but cortical neurons can neither follow these oscillations nor engage in the interactions required for the generation of 20–65 Hz oscillations. At higher activation levels, cortical neurons become able to follow the high-frequency modulation of subcortical input, and with further activation, the intracortical synchronizing mechanisms become eventually effective and generate synchronous oscillatory responses in the γ frequency range. Once the synchronous γ oscillations appear, they override the oscillatory patterning of the thalamic input, but they are not entirely independent of it. On occasions, a fraction of the discharges of cortical cells oscillating in the range of 30 Hz can be synchronized with activity of other cortical cells or neurons in the lateral geniculate nucleus that oscillate at ∼90 Hz (Castelo-Branco et al., 1998), suggesting that the high-frequency oscillatory thalamic input could affect the timing of low-frequency cortical oscillations.
Concerning the oscillations in the γ frequency range, we consistently observed that responses at some recording sites were nonoscillatory, whereas those at other sites exhibited a strong oscillatory modulation. One possibility is that not all neurons are capable of engaging in oscillatory activity (Engel et al., 1990). Another possibility is that the activation thresholds of the intracortical mechanism responsible for γ frequency oscillations and their synchronization differ among cell populations. This latter interpretation is supported by the observation that some recording sites exhibited oscillations already at intermediate levels of activation, whereas others became oscillatory only when activation was enhanced further by MRF stimulation. This scenario is further supported by the finding that the probability for a particular cell group to engage in synchronous oscillatory activity can be altered by conditioning. Repeated induction of highly synchronous responses by combining MRF and light stimulation was found to lead to a lowering of the threshold for the synchronization within the conditioned cell assembly, so that its neurons start to engage in synchronous oscillatory responses at levels of EEG activation lower than prior to conditioning (Herculano et al., 1997).
Despite their different origins, retinal-like and γ frequency oscillations were similar in that oscillatory modulation and synchronization in both frequency ranges increased in strength as oscillation frequency decreased. Interestingly, at some sites oscillation frequency increased within the 20–65 Hz range with increased activation, but in these cases the frequency change was correlated neither with oscillatory modulation nor with synchronization strength. These findings suggest that our recording sites comprised neurons from two physiologically distinct populations. One population could consist of intrinsically oscillatory neurons, which start to oscillate in response to a visual stimulus as soon as sufficient EEG activation occurs, and thereafter increase in oscillation frequency with increasing activation. This latter property is reminiscent of chattering cells, whose visual responses are modulated at higher oscillation frequencies with stronger current injection (Gray and McCormick, 1996). Oscillation frequency in this neuronal population would thus be determined by the interaction between intrinsic cellular properties and the level of EEG activation and would not necessarily correlate with the strength of oscillatory modulation. A second population would, in contrast, consist of neurons whose oscillation frequency is determined not intrinsically but by the actual size of the synchronously oscillating assembly in which they participate. Our data indicate that enhanced EEG activation facilitates neuronal synchronization, both locally and across different recording sites, including cells in different visual areas and even hemispheres. This implies that enhanced cortical activation is associated with recruitment of more neurons into synchronously oscillating assemblies. We propose that this recruitment is the likely reason for the increase in amplitude of the modulation of the correlograms and for the reduction in oscillation frequency (Woelbern et al., 1994; Traub et al., 1996). This interpretation is in agreement with the common observation that there is an inverse relation between oscillation frequency and the modulation amplitude of oscillatory patterning in EEG and field potential recordings. It also agrees with the finding that the very low frequency oscillations characteristic of slow wave sleep are synchronous over very large cortical distances (Steriade et al., 1993).
Although precise synchronization in the γ frequency range became consistently stronger with increased cortical activation, response firing rates could either increase or decrease. This challenges the notion that the main correlate of arousal is an increase in response rate. Rather, our data suggest that states characteristic of the aroused brain differ from those of deep sleep mainly in that the temporally precise stimulus-induced and feature-specific synchronization of neuronal responses occurs exclusively in the former. This suggests that response synchronization is an integrated component of the processes supporting visual perception. Synchronization of visual responses in primary visual cortex is likely to affect profoundly the propagation and integration of synaptic activity at subsequent processing stages (Abeles et al., 1994; König et al., 1996; Singer et al., 1997). Recent evidence from experiments on binocular rivalry indicates that the degree of synchronization among neurons in primary visual cortex is one of the critical variables that determine which of the responses are processed further and control behavior (Fries et al., 1997). We propose that cortical processes supporting sensory experience depend not only on the ability of individual neurons to respond to the features to which they are tuned but also on the ability of cortical neurons to establish temporal relations between their discharges in a stimulus- and context-dependent way, with high temporal precision and spatial selectivity. Such patterning, in turn, appears to be possible only during activated states that are characterized by macroscopically desynchronized EEG activity. Further experiments will be necessary to determine to which extent response synchronization and its spatiotemporal patterning are modulated in addition by attentional mechanisms in the awake, performing brain.
Footnotes
This work was supported by the Max-Planck-Gesellschaft. We thank Drs. Yves Frégnac and Jean-Christophe Houzel and two anonymous referees for comments on this manuscript, Michaela Klinkmann for excellent technical help, Michael Stephan for computer assistance, and Sabine Zydorek and Dr. Christiane Kiefert for excellent animal care.
Correspondence should be addressed to Dr. Wolf Singer, Max-Planck-Institut für Hirnforschung, Deutschordenstraße 46, 60528 Frankfurt/Main, Germany.
Dr. Herculano-Houzel’s present address: Espaço Museu da Vida, Fundação Oswaldo Cruz, Avenida Brasil 4365, 21040-360 Rio de Janeiro, Brazil.
REFERENCES
- 1.Abeles M, Prut Y, Bergman H, Vaadia E. Synchronization in neuronal transmission and its importance for information processing. In: Buzsáki G, editor. Temporal coding in the brain. Springer; Heidelberg: 1994. pp. 39–50. [DOI] [PubMed] [Google Scholar]
- 2.Castelo-Branco M, Neuenschwander S, Singer W. Synchronization of visual responses between the cortex, lateral geniculate nucleus, and retina in the anesthetized cat. J Neurosci. 1998;18:6395–6410. doi: 10.1523/JNEUROSCI.18-16-06395.1998. [DOI] [PMC free article] [PubMed] [Google Scholar]
- 3.Engel AK, König P, Gray CM, Singer W. Stimulus-dependent neuronal oscillations in cat visual cortex: intercolumnar interaction as determined by cross-correlation analysis. Eur J Neurosci. 1990;2:588–606. doi: 10.1111/j.1460-9568.1990.tb00449.x. [DOI] [PubMed] [Google Scholar]
- 4.Engel AK, König P, Singer W. Direct physiological evidence for scene segmentation by temporal coding. Proc Natl Acad Sci USA. 1991;88:9136–9140. doi: 10.1073/pnas.88.20.9136. [DOI] [PMC free article] [PubMed] [Google Scholar]
- 5.Freiwald WA, Kreiter AK, Singer W. Oscillatory and synchronous activity states in the macaque inferotemporal cortex. Soc Neurosci Abstr. 1998;24:355. [Google Scholar]
- 6.Frien A, Eckhorn E, Bauer E, Woelbern T, Kehr H. Stimulus-specific fast oscillations at zero phase between visual areas V1 and V2 of awake monkey. NeuroReport. 1994;5:2273–2277. doi: 10.1097/00001756-199411000-00017. [DOI] [PubMed] [Google Scholar]
- 7.Fries P, Roelfsema PR, Engel AK, König P, Singer W. Synchronization of oscillatory responses in visual cortex correlates with perception in interocular rivalry. Proc Natl Acad Sci USA. 1997;94:12699–12704. doi: 10.1073/pnas.94.23.12699. [DOI] [PMC free article] [PubMed] [Google Scholar]
- 8.Gray CM, McCormick DA. Chattering cells: superficial pyramidal neurons contributing to the generation of synchronous oscillations in the visual cortex. Science. 1996;274:109–113. doi: 10.1126/science.274.5284.109. [DOI] [PubMed] [Google Scholar]
- 9.Gray CM, König P, Engel AK, Singer W. Oscillatory responses in cat visual cortex exhibit inter-columnar synchronization which reflects global stimulus properties. Nature. 1989;338:334–337. doi: 10.1038/338334a0. [DOI] [PubMed] [Google Scholar]
- 10.Herculano S, Munk M, Singer S. Use-dependent reversible modification in the composition of synchronously firing ensembles in cat visual cortex. Soc Neurosci Abstr. 1997;23:14. [Google Scholar]
- 11.Hobson JA. Sleep and dreaming: induction and mediation of REM sleep by cholinergic mechanisms. Curr Opin Neurobiol. 1992;2:759–763. doi: 10.1016/0959-4388(92)90130-d. [DOI] [PubMed] [Google Scholar]
- 12.König P. A method for the quantification of synchrony and oscillatory properties of neuronal activity. J Neurosci Methods. 1994;54:31–37. doi: 10.1016/0165-0270(94)90157-0. [DOI] [PubMed] [Google Scholar]
- 13.König P, Engel AK, Singer W. Relation between oscillatory activity and long-range synchronization in cat visual cortex. Proc Natl Acad Sci USA. 1995;92:290–294. doi: 10.1073/pnas.92.1.290. [DOI] [PMC free article] [PubMed] [Google Scholar]
- 14.König P, Engel AK, Singer W. Integrator or coincidence detector? The role of the cortical neuron revisited. Trends Neurosci. 1996;19:130–137. doi: 10.1016/s0166-2236(96)80019-1. [DOI] [PubMed] [Google Scholar]
- 15.Kreiter AK, Singer W. Global stimulus arrangement determines synchronization of neuronal activity in the awake macaque monkey. Eur J Neurosci [Suppl] 1994;7:153. [Google Scholar]
- 16.Kreiter AK, Singer W. Stimulus-dependent synchronization of neuronal responses in the visual cortex of the awake macaque monkey. J Neurosci. 1996;16:2381–2396. doi: 10.1523/JNEUROSCI.16-07-02381.1996. [DOI] [PMC free article] [PubMed] [Google Scholar]
- 17.Laurent G. Dynamical representation of odors by oscillating and evolving neural assemblies. Trends Neurosci. 1996;19:489–496. doi: 10.1016/S0166-2236(96)10054-0. [DOI] [PubMed] [Google Scholar]
- 18.Laurent G, Davidowitz H. Encoding of olfactory information with oscillating neural assemblies. Science. 1994;265:1872–1875. doi: 10.1126/science.265.5180.1872. [DOI] [PubMed] [Google Scholar]
- 19.Livingstone MS. Oscillatory firing and interneuronal correlations in squirrel monkey striate cortex. J Neurophysiol. 1996;75:2467–2485. doi: 10.1152/jn.1996.75.6.2467. [DOI] [PubMed] [Google Scholar]
- 20.Llinás R, Ribary U. Coherent 40-Hz oscillation characterizes dream state in humans. Proc Natl Acad Sci USA. 1993;90:2078–2081. doi: 10.1073/pnas.90.5.2078. [DOI] [PMC free article] [PubMed] [Google Scholar]
- 21.Metherate R, Cox CL, Ashe JH. Cellular bases of neocortical activation: modulation of neural oscillations by the nucleus basalis and endogenous acetylcholine. J Neurosci. 1992;12:4701–4711. doi: 10.1523/JNEUROSCI.12-12-04701.1992. [DOI] [PMC free article] [PubMed] [Google Scholar]
- 22.Moruzzi G, Magoun HW. Brain stem reticular formation and activation of the EEG. Electroencephalogr Clin Neurophysiol. 1949;1:455–473. [PubMed] [Google Scholar]
- 23.Munk MHJ, Herculano S, Singer W. Relation between oscillation frequency of the EEG and of synchronously discharging cell assemblies. Soc Neurosci Abstr. 1996a;22:644. [Google Scholar]
- 24.Munk MHJ, Roelfsema PR, König P, Engel AK, Singer W. Role of reticular activation in the modulation of intracortical synchronization. Science. 1996b;272:271–274. doi: 10.1126/science.272.5259.271. [DOI] [PubMed] [Google Scholar]
- 25.Neuenschwander S, Singer W. Long-range synchronization of oscillatory light responses in the cat retina and lateral geniculate nucleus. Nature. 1996;379:728–733. doi: 10.1038/379728a0. [DOI] [PubMed] [Google Scholar]
- 26.Neuenschwander S, Engel AK, König P, Singer W, Varela FJ. Synchronization of neuronal responses in the optic tectum of awake pigeons. Vis Neurosci. 1996a;13:575–584. doi: 10.1017/s0952523800008257. [DOI] [PubMed] [Google Scholar]
- 27.Neuenschwander S, Herculano S, Singer W. Synchronous oscillations in the LGN reflect stimulus-dependent long-range interactions in the retina. Soc Neurosci Abstr. 1996b;22:1605. [Google Scholar]
- 28.Prechtl JC. Visual motion induces synchronous oscillations in turtle visual cortex. Proc Natl Acad Sci USA. 1994;91:12467–12471. doi: 10.1073/pnas.91.26.12467. [DOI] [PMC free article] [PubMed] [Google Scholar]
- 29.Roelfsema PR, König P, Engel AK, Sireteanu R, Singer W. Reduced synchronization in the visual cortex of cats with strabismic amblyopia. Eur J Neurosci. 1994;6:1645–1655. doi: 10.1111/j.1460-9568.1994.tb00556.x. [DOI] [PubMed] [Google Scholar]
- 30.Singer W. The effect of mesencephalic reticular stimulation on intracellular potentials of cat lateral geniculate neurons. Brain Res. 1973;61:35–54. doi: 10.1016/0006-8993(73)90514-3. [DOI] [PubMed] [Google Scholar]
- 31.Singer W, Gray CM. Visual feature integration and the temporal correlation hypothesis. Annu Rev Neurosci. 1995;18:555–586. doi: 10.1146/annurev.ne.18.030195.003011. [DOI] [PubMed] [Google Scholar]
- 32.Singer W, Engel AK, Kreiter AK, Munk MHJ, Neuenschwander S, Roelfsema PR. Neuronal assemblies: necessity, signature, detectability. Trends Cognit Sci. 1997;1:252–261. doi: 10.1016/S1364-6613(97)01079-6. [DOI] [PubMed] [Google Scholar]
- 33.Steriade M, McCarley RW. Brainstem control of wakefulness and sleep. Plenum; New York: 1990. [Google Scholar]
- 34.Steriade M, McCormick DA, Sejnowski TJ. Thalamocortical oscillations in the sleeping and aroused brain. Science. 1993;262:679–685. doi: 10.1126/science.8235588. [DOI] [PubMed] [Google Scholar]
- 35.Steriade M, Amzica F, Contreras D. Synchronization of fast (30–40 Hz) spontaneous cortical rhythms during brain activation. J Neurosci. 1996;16:392–417. doi: 10.1523/JNEUROSCI.16-01-00392.1996. [DOI] [PMC free article] [PubMed] [Google Scholar]
- 36.Traub RD, Whittington MA, Stanford IM, Jefferys JGR. A mechanism for generation of long-range synchronous oscillations in the cortex. Nature. 1996;383:621–624. doi: 10.1038/383621a0. [DOI] [PubMed] [Google Scholar]
- 37.Volgushev M, Chistiakova M, Singer W. Modification of discharge patterns of neocortical networks by induced oscillations of the membrane potential. Neuroscience. 1998;83:15–25. doi: 10.1016/s0306-4522(97)00380-1. [DOI] [PubMed] [Google Scholar]
- 38.Wang X, Merzenich MM, Beitel R, Schreiner CE. Representation of a species-specific vocalization in the primary auditory cortex of the common marmoset: temporal and spectral characteristics. J Neurophysiol. 1995;74:2685–2706. doi: 10.1152/jn.1995.74.6.2685. [DOI] [PubMed] [Google Scholar]
- 39.Woelbern TC, Frien A, Eckhorn R, Bauer R, Kehr H. Distributions of oscillation frequencies depend on stimulus size and velocity in monkey visual cortex. In: Elsner N, Breer H, editors. Sensory transduction. Thieme; New York: 1994. [Google Scholar]


