

Abstract
This study was undertaken to determine how dopamine influences cortical development. It focused on morphogenesis of GABAergic neurons that contained the calcium-binding protein parvalbumin (PV). Organotypic slices of frontoparietal cortex were taken from neonatal rats, cultured with or without dopamine, harvested daily (4–30 d), and immunostained for parvalbumin. Expression of parvalbumin occurred in the same regional and laminar sequence as in vivo. Expression in cingulate and entorhinal preceded that in lateral frontoparietal cortices. Laminar expression progressed from layer V to VI and finally II-IV. Somal labeling preceded fiber labeling by 2 d.
Dopamine accelerated PV expression. In treated slices, a dense band of PV-immunoreactive neurons appeared in layer V at 7 d in vitro (DIV), and in all layers of frontoparietal cortex at 14 DIV, whereas in control slices such labeling did not appear until 14 and 21 DIV, respectively. The laminar distribution and dendritic branching of PV-immunoreactive neurons were quantified. More labeled neurons were in the superficial layers, and their dendritic arborizations were significantly increased by dopamine. Treatment with a D1 receptor agonist had little effect, whereas a D2 agonist mimicked dopamine’s effects. Likewise, the D2 but not the D1 antagonist blocked dopamine-induced changes, indicating that they were mediated primarily by D2 receptors.
Parvalbumin expression was accelerated by dopaminergic reinnervation of cortical slices that were cocultured with mesencephalic slices.
Coapplication of the glutamate NMDA receptor antagonist MK801 or AP5 blocked dopamine-induced increases in dendritic branching, suggesting that changes were mediated partly by interaction with glutamate to alter cortical excitability.
Keywords: organotypic, tissue culture, corticogenesis, interneuron, GABA, dopamine, development
Early perturbations to neurotransmitters that regulate cortical development change the time course and outcome of corticogenesis. Prenatally altered catecholamine levels cause persistent changes in dendritic morphology of pyramidal neurons, numbers of GABAergic neurons, and dendritic lengths of interneurons (Wang et al., 1995, 1996; Jones et al., 1996). Neonatal monoamine depletion delays normal cortical lamination (Osterheld-Haas and Hornung, 1996). These developmental influences may be mediated by transmitter-induced alterations of neuronal activity.
Subsets of GABAergic neurons contain calcium-binding proteins (Celio, 1986, 1990; Hendry et al., 1989; van Brederode et al., 1990, 1991;DeFelipe, 1993; Conde et al., 1994) that may protect developing neurons against fluctuating levels of metabolic activity by buffering intracellular calcium (Seto-Ohshima et al., 1990; Lukas and Jones, 1994). Parvalbumin (PV), a calcium-binding protein in basket and chandelier cells (Hendry et al., 1989; DeFelipe, 1993), is thought to regulate intracellular free calcium fluctuations caused by membrane depolarization (Chard et al., 1993). Parvalbumin expression occurs late in rodent and primate development through a sequence of postnatal events (Hendrickson et al., 1991; Alcantara et al., 1993; Yan et al., 1995; Berger and Alvarez, 1996): somata appear first in layer V, then in layer VI, and finally in superficial layers. Fiber labeling, including pericellular baskets, succeeds that of somata by ∼2 d.
Parvalbumin expression is linked to neuronal activity in adult and developing cortex. Parvalbumin-containing neurons occur in areas of high metabolic activity, such as cytochrome oxidase-rich blobs of visual cortex (Celio et al., 1986) and barrels of somatosensory cortex (Cohen et al., 1993). Conversely, chronic monocular deprivation in adult primates causes decreases in PV and cytochrome oxidase staining in the deprived ocular dominance column (Gutierrez and Cusick, 1994;Carder et al., 1996). Individual neurons in barrel cortex stain intensely for 2-deoxyglucose and PV (Maier and McCasland, 1997). Furthermore, PV is localized in fast spiking cells of rodent cortex (Kawaguchi et al., 1987; Kawaguchi and Kubota, 1993, 1997). In the developing monkey striate and rat visual cortex, PV expression begins in late fetal life but increases with postnatal onset of visual function (Hendrickson et al., 1991; Solbach and Celio, 1991). Conversely, decreased activity induced by monocular deprivation during the critical period of development in rats leads to reduced PV expression in the cortex contralateral to the deprived eye (Cellerino et al., 1992).
It seems then that neurotransmitter-induced increases in cortical activity will enhance PV expression. Dopamine (DA) may increase cortical activity by activation of adenylate cyclase, which enhances glutamate channel conductivity (McMahon et al., 1994). Dopamine innervation of rodent cortex begins prenatally, but peaks at approximately postnatal day (PN) 14 (Berger et al., 1983). D1 and D2 receptor mRNA expression also peaks late (PN 7–30) (Leslie et al., 1991; Schambra et al., 1994). Timing of these events suggests that the mesocortical DA system modulates PV expression through mechanisms that increase cortical activity, such as synaptogenesis, receptor activation, or glutamatergic interactions. This study was undertaken to determine whether DA affects the morphogenesis of GABAergic neurons that contain PV, and the mechanisms mediating these changes.
MATERIALS AND METHODS
Organotypic slice cultures were prepared from neonatal rats aged PN 2 or 3. All animal procedures were approved by the Institutional Committee for Evaluation of Animal Care and Use and were in compliance with National Institutes of Health Guidelines for the Care and Use of Animals. The pups were anesthetized by hypothermia and then quickly decapitated under aseptic conditions. The brains were rapidly removed and placed into cold sterile MEM (Life Technologies, Gaithersburg, MD) with 200 mm Tris buffer (dissecting medium). The brains were hemisected mid-sagittally. Coronal cuts were made to remove portions of the rostral and caudal poles, leaving the frontoparietal region intact. Midline and lateral regions of the cortex were included in the slices, whereas subcortical structures were cut away. The overlying pia was gently removed. The right and left cortices were cut simultaneously in the coronal plane at a thickness of 250 μm with a McIlwain tissue chopper. The slices were transferred into dissecting medium and separated gently by agitation with a fire-polished glass pipette. Three or four slices were placed into a Millicell-CM (Millipore, Bedford, MA) insert that was immersed in dissecting medium. Four inserts were placed together in a single sterile Petri dish and designated as a control or treatment group to ensure that the 12–16 slices in each group were cultured under identical conditions. The control and treatment groups for a single trial were obtained from the same litter, prepared at the same time, and cultured for the same durations. Dissecting medium was replaced with culture medium [MEM supplemented with 25% normal horse serum (NHS) (Life Technologies) and 200 nm glutamine]. Slices were maintained in medium at a level that provided an air–medium interface (Stoppini et al., 1991), in a humid atmosphere at 35°C, in 5% CO2. Medium was refreshed every 2–3 d by removing half of the existing medium and replacing it with fresh medium. Serum levels were reduced to 15% after 1 week. Culture medium alone was used as control medium in all trials. The following pharmacological treatments were applied: for Trial 1, slices were treated with DA (1 μm, 10 μm) or ascorbic acid (0.01%; to slow DA decomposition), the vehicle for DA. The decomposition of exogenous DA is slowed considerably by the addition of tissue or ascorbic acid to culture medium (0–19% decay over 3 hr) (Marien et al., 1984) and even more so by the addition of both tissue and ascorbic acid in buffer (3–10% over 6 hr in buffer) (Heikkila and Cabbat, 1983). For Trial 2, slices were treated with DA (10 μm) or the D1 (SK&F 38393; 1 μm) or D2 (quinpirole; 1 μm) receptor agonist. For Trial 3, slices were treated with DA (10 μm), DA and either the D1 (SCH 23390; 1 μm, 10 μm) or the D2 (eticlopride; 1 μm, 10 μm), or both receptor antagonists. For Trial 4, slices were treated with DA (10 μm), DA and MK801 (1 μm), DA and AP5 (100 μm), MK801, or AP5. Treatments are summarized in Table 1. In all instances, the treatments were applied throughout the entire cultivation period. Each trial was repeated at least four times using different litters. Fresh stock solutions were prepared at 1 week intervals. Initially, cortical slice cultures grown in control medium or treated with DA were harvested daily at 4 through 14, 21, 26, and 30 d in vitro (DIV). Subsequently, for Trials 1–4, slices were harvested at 7 and 14 DIV only, by removing two of four inserts from each group at these time points.
Table 1.
Culture treatments
| Trial 1 | Trial 2 | Trial 3 | Trial 4 |
|---|---|---|---|
| Control medium | Control medium | Control medium | Control medium |
| 10 μmDA1-a | 10 μmDA | 10 μm DA | 10 μm DA |
| 1 μm DA | 1 μmQuinpirole1-b | 10 μm DA and 1 μm eticlopride1-c | 10 μm DA and 1 μm MK 8011-d |
| Ascorbic acid1-e | 1 μm SK&F 383931-f | 10 μm DA and 1 μm SCH233901-g | 1 μmMK 801 |
| 10 μm DA and 1 μm SCH23390 and 1 μm eticlopride | 100 μm AP51-h |
Stock solutions were stored for a maximum of 1 week at 4°C and diluted to working concentrations in control medium at the time of medium exchanges. Each group consists of 12–16 slices, half of which were harvested at 7 or 14 DIV.
DA HCl in 0.01% ascorbic acid in H2O, stock solution = 10 mm.
Quinpirole, a selective D2 agonist, in H2O, stock solution = 1.0 mm.
Eticlopride, a selective D2 antagonist, in H2O, stock solution = 1.0 mm.
MK801, an NMDA receptor antagonist, in H2O, stock solution = 1.0 mm.
Ascorbic acid 0.01% in H2O.
SK&F, a selective D1 agonist, in H2O, stock solution = 1.0 mm.
SCH 23390, a selective D2 antagonist, in H2O, stock solution = 1.0 mm.
AP5, an NMDA receptor antagonist, in H2O, stock solution = 100 mm.
Cortical and mesencephalic slices were cocultured to allow dopaminergic reinnervation of the cortex. Slices of the midbrain, containing substantia nigra pars compacta, were collected from brains prepared as described above, cut in the coronal plane at 300 μm, and placed in a Millicell insert adjacent to a cortical slice taken from a litter mate. The ventrolateral surface of the midbrain was placed ∼0.5–1 mm away from the pial surface of the cortex. Control cocultures were prepared by placing the cortex and midbrain slices in separate inserts but in the same Petri dish. Initially, the cocultures were maintained in serum-enhanced MEM for 1–17 d to determine the time course and pattern of DA reinnervation. Subsequently, control and cocultures were harvested at 14 DIV for examination of PV expression.
The slices and cocultures were fixed by immersion in 4% paraformaldehyde, rinsed in 0.1 m phosphate buffer (2 × 15 min), and subsequently processed for immunohistochemical detection of various neuronal markers as follows. Slices were preincubated in 2% normal rabbit serum, in 0.05 m Tris buffer and 0.6% NaCl with 0.2% Triton X-100 for 50 min, and incubated for 24–48 hr at 4°C in primary antibody (Ab) against the calcium-binding proteins PV, calbindin, or calretinin (dilution for all, 1:5000; SWant, Bellinzona, Switzerland), or cytoskeletal proteins [medium-size neurofilaments clone FNP7, dilution 1:1000 (Zymed, San Francisco, CA), or the microtubule-associated proteins MAP2a+b clone AP14, dilution 1:20 (gift from Dr. B. Riederer, Université de Lausanne)]. Cocultures were processed for dual immunostaining (cobalt chloride and nickel enhancements) of tyrosine hydroxylase (TH; 1:10,000; mouse monoclonal, Incstar, Stillwater, MN) and PV. The primary antibodies were detected with the use of biotinylated secondary antibodies (Jackson ImmunoResearch, West Grove, PA) and the Vector-Elite ABC kit (Vector Laboratories, Burlingame, CA). The slices and cocultures were mounted on glass slides, dried, dehydrated, and covered.
Tissue was examined with a Nikon microscope, outfitted with a computer-driven stage controller. All cortical regions in the slices were examined histologically, but quantitative analysis was performed only on frontoparietal regions of the slices. The digitized images were recorded and analyzed with the Neurolucida Image Analysis (MicroBrightfield) software program. For each trial, the laminar distribution of PV-immunoreactive (PV-ir) neurons was determined for experimental and control groups of slices harvested at 14 DIV. The locations of labeled neurons in each slice were plotted from the digitized images relative to the distance between the white matter and the pial surface. The percentage of labeled neurons within each 10% increment in distance from the pial surface were calculated for each slice. The distributions of labeled neurons in slices from each experimental group were compared with that of control slices (Student’s t test). Approximate laminar boundaries were determined from a cytoarchitectonic study of cultured slices, prepared in the same manner and harvested at the same time points as in the present study, then stained for Nissl (J-P Hornung, unpublished observations) in which laminar boundaries were correlated to percentage depth from the pia to the white matter. Layer I corresponded to 0–10%, layers II–III corresponded to 10–40%, layer V corresponded to 50–70%, and layer VI corresponded to 80–100% of depth. No attempt was made to discriminate layer IV from layers II–III, because many slices were from agranular frontal regions.
In addition, for each trial the dendritic branching patterns of PV-ir neurons were determined in slices harvested at 14 DIV. Ten cells per treatment were randomly selected from among the most intensely labeled neurons that were located in layer V of frontoparietal cortex. Their dendritic arbors were reconstructed on high-magnification video-captured images with the Neurolucida software program. An automated Scholl analysis was performed on each of the reconstructed neurons to measure the number of intersections between dendrites and concentric radii (20 μm intervals) drawn relative to the soma. In addition, the sum of lengths of all dendrites within each concentric radius was calculated from the reconstructions. These measures of dendritic arborization were compared between experimental and control groups of slices (Student’s t test).
RESULTS
Dopamine specifically modulates the expression of PV in cortical neurons during development
To screen for neuronal proteins whose expression would be affected by the presence of DA, an immunocytochemical analysis of DA-treated and control slices at 14 DIV was performed, using markers for interneurons (calbindin, parvalbumin, calretinin) and pyramidal neurons (neurofilaments, MAP2a+b). All proteins were readily detected in the cultures (data not shown) and were localized in the predicted cell types. Of all the markers, only PV appeared to have an expression and distribution altered by the DA treatment, as described below. Therefore, the quantitative assessments focused only on PV-labeled slices.
In the control slices, PV-ir neurons first appeared in the deep laminae of cingulate and perirhinal cortices at 6 DIV. At this time, these neurons had only their somata immunolabeled. Both PV-ir dendrites and axons (as evidenced by beaded fibers in the neuropil) were observed around these neurons at 8 DIV. Parvalbumin-ir somata appeared next in the superficial layers of the cingulate and perirhinal cortices at 7 DIV, and a band of sparse PV-ir somata in layer V first appeared in frontoparietal cortex at 8 DIV. Dendritic branches on labeled somata and well labeled fibers in the neuropil began to appear 2 d after the appearance of labeled somata in each region and layer, and fiber labeling in the surrounding neuropil continued to increase in density over the next several days. The PV-ir somata appeared next in deeper portions (layer VI) of frontoparietal cortex at 12 DIV. Labeling of dendrites of deeper layer VI and axonal specializations in more superficial layer V neurons were not apparent until 14 DIV. Thus, after 14 d in culture, PV-ir somata, dendrites, and axons were observed throughout all layers of the cingulate and perirhinal regions but were mostly limited to the deep laminae of the frontoparietal regions (Fig.1B). Pericellular axonal baskets were found in the deep laminae of frontoparietal cortex at this time, but they were extremely difficult to distinguish, even in deeper portions of the superficial laminae (Fig.2A,B), and axons were not visible in upper layer III and layer II. By 21 DIV a dense population of extensively labeled neurons and fibers were noted in layers V and VI, and both well labeled neurons (somata and dendritic label) and fibers had extended throughout the superficial layers II–IV (Fig. 1D,F). At 26 DIV, fiber staining in superficial laminae was more dense (data not shown).
Fig. 1.
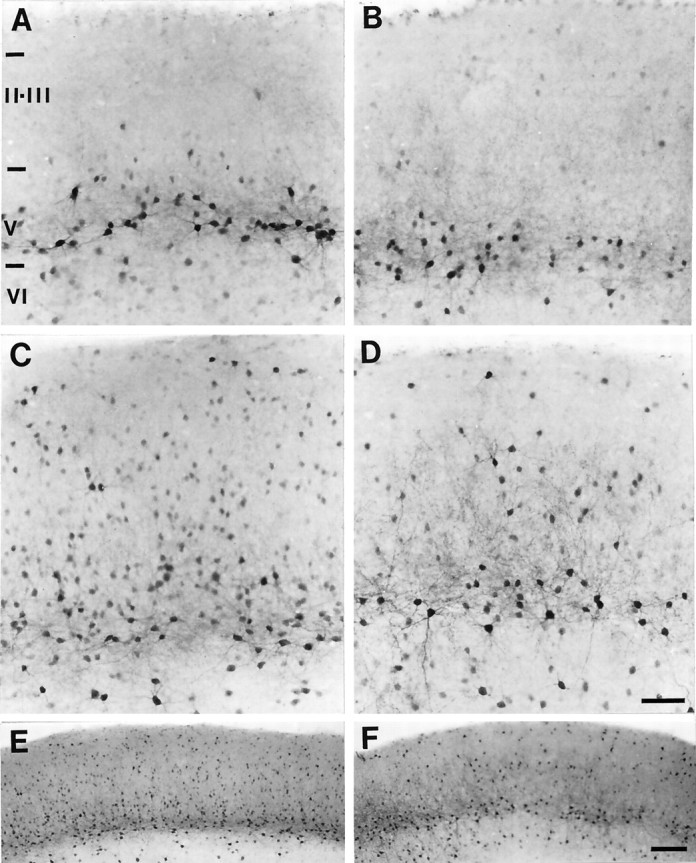
Micrographs of frontoparietal cortical slices stained for PV-ir (all with the pial surface toward the top).A, A slice culture treated with DA and harvested at 7 DIV. A dense band of PV-ir neuronal somata with labeled dendrites is evident in layer V, and a few lightly labeled cells are evident in layer VI. B, An untreated sister culture harvested at 14 DIV. The pattern of labeling for PV is similar to that in the 7 DIV DA-treated culture. C, A slice culture, treated with DA and harvested at 14 DIV. The dense band of PV-ir neuronal somata in layer V and the neurons in layer VI have extensive dendritic labeling. PV-ir neurons are seen throughout the superficial laminae, and some of these cells have labeled dendrites. D, An untreated sister culture harvested at 21 DIV. The pattern of PV labeling is similar to that in the 14 DIV DA-treated culture. E,F, The laminar distribution of PV-ir neurons in a low magnification of the slices shown in C andD, respectively. Roman numerals denote laminar boundaries. Scale bars: in D forA–D, 50 μm; in F for E,F, 600 μm.
Fig. 2.

Micrographs showing axonal labeling in slice cultures maintained for 14 DIV. A, PV-ir axons in deep layer III of an untreated culture. Note that the axonal labeling is light, even in deep portions of layer III. B, PV-ir axons in layer V of an untreated culture. The labeling is more prominent in varicosities than in the intervaricose segments. Pericellular baskets are partially defined at this time point.C, PV-ir axons in layer III of a DA-treated culture. The labeling is more dense than that seen in the untreated culture inA. The varicosities are heavily labeled and the intervaricose segments are sparsely labeled. The pericellular basket pattern is visible, but weakly defined at this time point.D, PV-ir axons in layer V of DA-treated culture. The density of axonal labeling is high, and heavy labeling is evident in both varicose and intervaricose segments. The pericellular basket is seen enveloping an unlabeled somata and its proximal dendrites. Scale bar (shown in D for A–D): 15 μm.
The DA-treated slices exhibited a similar pattern of emergence of PV expression, but labeled profiles appeared at consistently earlier time points. At 4 DIV, the earliest time examined, labeled somata with dendrites were already present in the deep layers of cingulate and perirhinal cortices. By 6 DIV, some labeled somata were also present in the superficial layers of cingulate and perirhinal cortex, and a few scattered PV-ir neurons were present in layer V of frontoparietal cortex. On the following day, 7 DIV, a band of neurons containing label in both their somata and dendrites was observed in layer V throughout the frontoparietal cortex. Lightly labeled neuronal somata were also observed in layer VI at this time point (Fig. 1A). The layer VI neurons exhibited labeled dendrites by 9 DIV. The number of labeled neurons and the density of labeled fibers in both layers V and VI increased gradually over the next several days. Parvalbumin-ir somata appeared in the superficial laminae at 13 DIV, with a few labeled axons and dendrites also apparent at this time. Dense dendrites and axonal specializations in the surrounding neuropil were first noted to be immunostained at 14 DIV. The density of labeled profiles continued to increase over the next several days. Thus, at 2 weeks, neurons with labeled dendrites and labeled axons in the neuropil were clearly evident throughout all cellular layers of the frontoparietal region (Fig. 1C,E), with the most extensive dendritic labeling and fiber labeling in the deep layers. Intricate pericellular baskets were observed in the deep laminae, but distinguishable baskets were commonly observed throughout the superficial laminae as well (Fig. 2C,D). At 21 DIV, the density of label was further increased, and a dense band of horizontal fibers was evident in layer I (data not shown). These features did not show significant changes when examined at later times. The developmental sequence of events for cortical expression of PV and the time of their emergence in the control and DA-treated slices are summarized in Table 2. The lower dose of DA (1 μm) was only minimally effective in mediating changes in PV expression. Although our culture conditions (tissue and ascorbic acid) may be optimal for slowing the decomposition rate of DA (Heikkila and Cabbat, 1983; Marien et al., 1984), this lower dose may not have been stable for a sufficient time to be effective, as was the 10 μm DA treatment. Vehicle (ascorbic acid)-treated slice cultures showed the same time course of PV expression as did the control slices.
Table 2.
Sequence of parvalbumin expression
| DIV | ||||||||||||||
|---|---|---|---|---|---|---|---|---|---|---|---|---|---|---|
| 4 | 5 | 6 | 7 | 8 | 9 | 10 | 11 | 12 | 13 | 14 | 21 | 26 | 30 | |
| Control cultures | 1 | 2 | 3 | 4 | 5 | 6 | 7 | 9 | 13 | 14 | ||||
| 8 | 10 | |||||||||||||
| 11 | ||||||||||||||
| Dopamine-treated cultures | 1 | 2 | 3 | 7 | 8 | 11 | 13 | |||||||
| 4 | 9 | 12 | 14 | |||||||||||
| 5 | 10 | |||||||||||||
| 6 | ||||||||||||||
1, Somata in layers V–VI of cingulate/perirhinal cortex; 2, somata in layers II–III of cingulate/perirhinal cortex; discontinuous band of somata in layer V of frontoparietal cortex 3, continuous band of somata in layer V of frontoparietal cortex; 4, sparse fibers in layer V of frontoparietal cortex; 5, somata with dendrites and dense fibers in layer V of frontoparietal cortex; 6, somata in layer VI of frontoparietal cortex; 7, somata with dendrites in layer VI of frontoparietal cortex; 8, pericellular axonal baskets in layer V of frontoparietal cortex; 9, somata in layers II–III of frontoparietal cortex; 10, sparse fibers in layers II–III of frontoparietal cortex; 11, dense fibers and pericellular baskets in layers II–III of frontoparietal cortex; 12, somata with dendrites in layers II–III of frontoparietal cortex; 13, horizontal band of axons in layer I of frontoparietal cortex; bilaminar distribution of somata in II and V–VI of frontoparietal cortex; 14, dense axons and extensive dendrites in layers I–VI of frontoparietal cortex.
The effects of DA on PV expression are differentially mediated by the dopamine D1 and D2 receptors
The laminar distribution and dendritic branching patterns of PV-ir neurons in control slices were compared with the slices treated with DA, vehicle, D1 or D2 receptor agonists, and DA + D1 or DA + D2 antagonists at 14 DIV. In the DA-treated slices, a greater proportion of labeled neurons appeared to be in the superficial layers, and PV-ir neurons appeared to have more extensive dendritic arbors than those of control slices (Fig. 3). Although the D1 agonist treatment did not mimic the effects of DA, the D2 agonist-treated slices showed a shift in the distribution of PV-ir neurons toward the superficial layers and an increase in dendritic labeling similar to that seen with the DA treatment (Fig.4). A quantitative analysis showed that DA significantly altered the laminar distribution of labeled neurons across all intervals (Student’s t test, p = 0.00065) as compared with untreated slices. In the DA-treated slices, a higher percentage of PV-ir neurons were located at intervals of cortical depth that corresponded to the superficial layers (Fig.5A). The D1 agonist treatment did not cause significant changes in laminar distribution of labeled neurons, but the D2 agonist treatment caused a shift in distribution of PV-ir neurons toward the superficial layers in comparison to control slices (Student’s t test, p = 0.014). Ascorbic acid treatment had little effect on laminar distribution of PV-ir neurons.
Fig. 3.

Micrographs of 14 DIV sister cultures stained for PV. A, Laminar distribution of PV-ir neurons in an untreated slice. A dense band of PV-ir neurons is in layer V. These neurons have labeled dendrites. A few labeled somata are seen in layer VI, and scattered somata with light labeling are seen in the superficial layers. B, Higher magnification of layers V–VI of the slice in A. Dendritic labeling is evident on most PV-ir neurons. Fiber labeling in the neuropil is moderate.C, DA-treated slice showing the laminar distribution of labeled neurons. Parvalbumin-ir neurons with extensive dendritic labeling are visible in layers V and VI. Both neuronal and fiber labeling are visible in the superficial layers. D, Higher magnification of layers V–VI of the slice in C. Extensive dendritic labeling is evident on most PV-ir neurons. Fiber labeling in the neuropil is dense. Roman numerals denote laminar boundaries. Scale bars: in C forA, C, 150 μm: in D forB, D, 20 μm.
Fig. 4.

Micrographs of PV-ir neurons in 14 DIV sister cultures. A, Labeled neurons in an untreated culture form a band in layer V with a few scattered neurons also visible in VI and II–III. B, Labeled neurons in a DA-treated culture are dense in all layers. C, Labeled neurons in a D1 agonist-treated culture form a band in layer V with a few scattered neurons also visible in VI. D, Labeled neurons in a D2 agonist-treated culture form a band in layer V with numerous neurons also visible in VI and III. E, High magnification of PV-ir neurons in layer V of the slice shown in C. Many somata are labeled, but only a few neurons show extensive dendritic branching. F, High magnification of PV-ir neurons in layer V of the slice shown in D. Many somata with extensive dendritic labeling are visible. Fiber labeling in the neuropil is dense. Scale bars: in D forA–D, 50 μm; in F for E,F, 20 μm.
Fig. 5.

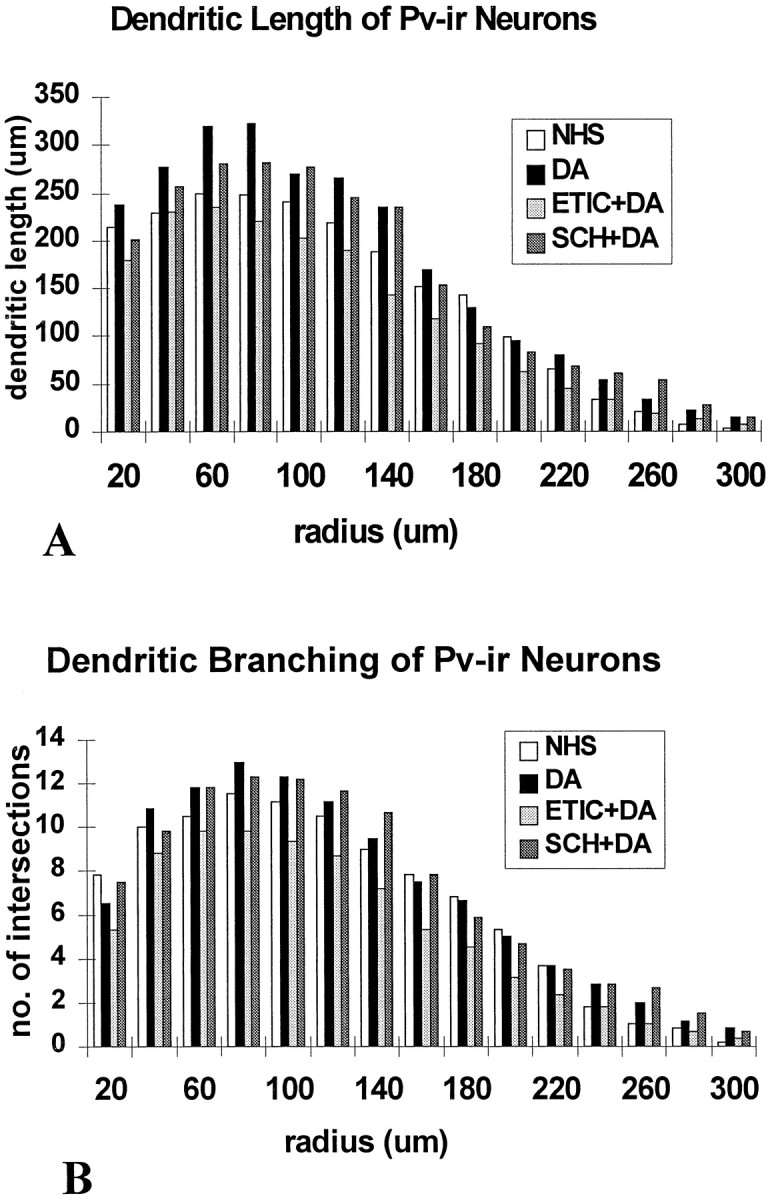
Histograms of the depth distribution and the dendritic branching patterns of PV-ir neurons in slices from the agonist trials that were maintained for 14 DIV. A, The distribution of PV-ir neurons is shown relative to the depth from the pial surface. The DA-treated slices had a higher percentage of neurons in the superficial laminae than in control slices. The other treatment groups were not significantly different from controls.B, The lengths of labeled dendrites at concentric radii from the soma are shown. Neurons in the DA-treated slices showed an increase in dendritic lengths overall and at all individual concentric radii compared with controls. Quinpirole treatment showed a slight increase in dendritic lengths at all radial distances but was significantly different only at 100 μm from the soma.C, The number of intersections at concentric radii from the soma are shown. DA- and quinpirole-treated slices showed significant increases in dendritic branching of PV-ir neurons overall and at many individual radial distances. Dendritic intersections with concentric radii were noted up to 520 μm from the soma in the DA-treated group but only up to 360 μm in other groups (*p < 0.05; Student’s ttest).
Dopamine treatment also affected the dendritic arborizations of PV-ir neurons. This effect appeared to be mediated primarily by D2 receptors. Dopamine treatment resulted in a significant increase in dendritic length (Student’s t test, p = 0.0033) (Fig. 5B) and in the number of dendritic intersections (Student’s t test, p = 0.0000045) (Fig. 5C) within concentric radial intervals (20 μm) from the somata as compared with controls. Moreover, the longest labeled dendrites by far, extending up to 520 μm in length, were observed only on neurons in the DA-treated slices (data not shown). The D2 agonist treatment also caused consistent overall increases in dendritic length and number of intersections (Student’s ttest, p = 0.000087 and 0.000154, respectively) as compared with controls. The increases in dendritic length induced by the D2 agonist treatment is evident in Figure 5B. The D1 agonist caused no significant changes in either the length of dendrites or the number of dendritic intersections either overall or at any individual radial distances. Ascorbic acid treatment had no significant effect on either measure of dendritic arborization of PV-ir neurons.
Trials in which slices were treated with DA and the D1 antagonist SCH 23390 or with DA and the D2 antagonist eticlopride also indicated that the DA-induced changes in PV expression were primarily mediated by D2 receptors. Coapplication of the D1 antagonist with DA was ineffective in blocking DA-induced changes, but the D2 antagonist appeared to block the DA-induced shift in laminar distribution and increase in fiber density (Fig. 6). A quantitative analysis showed that PV expression in slices treated with DA and the D1 antagonist was not significantly different from slices treated with DA only. Measures for dendritic intersections and lengths/concentric radii are shown in Figure7. These same measures were significantly different between the DA + D2 antagonist-treated slices and the DA-only-treated slices (Student’s t test, p= 0.000035 for intersections, 0.00024 for lengths). In slices treated with both the D1 and D2 antagonists, the density and laminar distribution of PV-ir neurons appeared to be similar to that of untreated slices (Fig. 8). Indeed, quantitative analysis showed no significant differences between controls and the dual antagonist-treated group. The laminar distribution of PV-ir neurons for these trials is shown in Figure9.
Fig. 6.

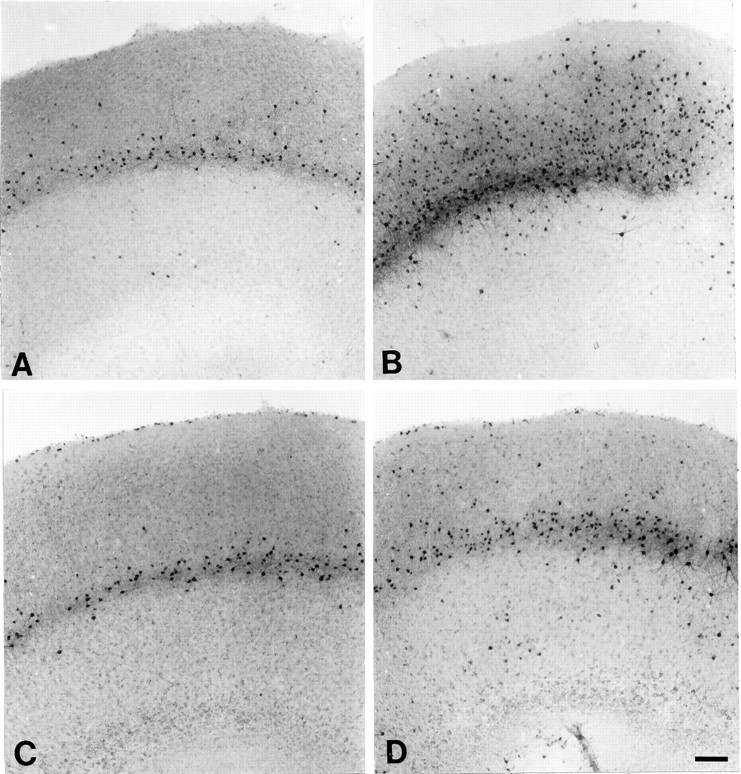
Micrographs of PV-ir neurons in 14 DIV sister cultures from the DA receptor antagonist trial. These cultures were prepared from PN 4 pups and are slightly more mature than those in other micrographs. A, Labeled neurons in an untreated culture form a dense band in layer V with numerous neurons in layer VI. Only scattered neurons are visible in superficial layers.B, Labeled neurons in a DA-treated culture are dense and have elaborate dendritic arbors in all layers. C, Labeled neurons in a DA + D1 antagonist-treated culture are visible throughout all laminae. D, Labeled neurons in a DA + D2 antagonist-treated culture form a dense band in layer V with numerous neurons also visible in VI, but only scattered neurons in layers II–III. Roman numerals denote laminar boundaries. Scale bar (shown in D for A–D): 100 μm.
Fig. 7.
Histograms of the dendritic branching patterns of PV-ir neurons in slices from the DA receptor antagonist trials, which were maintained for 14 DIV. A, The lengths of labeled dendrites at concentric radial distances from the soma are shown. Neurons in the DA-treated slices showed increased dendritic lengths compared with controls. These measures were similar in the DA and the DA + SCH (D1 antagonist) groups, but relatively lower in the DA + ETIC (D2 antagonist)-treated slices. B, The number of dendritic intersections at concentric radial distances measured from the soma are shown. Neurons in the DA-treated slices showed increased dendritic branching compared with controls. These measures were similar in the DA and the DA + SCH (D1 antagonist) groups but relatively lower in the DA + ETIC (D2 antagonist) groups.
Fig. 8.

Micrograph of PV-ir neurons in a slice treated with DA and both the D1 and D2 antagonists and maintained for 14 DIV. A band of labeled neurons is visible in layer V, but very few labeled neurons appear in either layer VI or the superficial layers.Roman numerals denote laminar boundaries. Scale bar, 150 μm.
Fig. 9.

Histogram showing the laminar distribution of PV-ir neurons, expressed as percentage of total labeled neurons in each 10% increment of cortical depth, for slices from the dual antagonists trials. The distribution of PV-ir neurons is shown relative to the depth from the pial surface. The DA-treated slices had a higher percentage of neurons in the superficial laminae than the control slices or antagonist-treated slices. The sparse numbers of labeled neurons in the dual antagonist-treated slices (Fig. 8) were narrowly clustered in layer V (50–70% depth).
Changes in PV expression may be mediated by DA–glutamate interactions
Cortical slices were treated with the glutamate NMDA receptor antagonists MK801 or AP5 to determine whether the effects of DA on PV expression were linked to DA-mediated changes in cortical excitability. Both MK801 and AP5 were effective in substantially blocking the DA-induced changes in laminar distribution and dendritic branching patterns of PV-ir neurons. The increase in percentage of PV-ir neurons in the superficial cortical layers at 14 DIV induced by DA treatment was attenuated in slices treated with both DA and MK801. Treatment with the antagonists alone had little effect on the laminar distribution of labeled neurons as compared with controls. Slices from the MK801 trials illustrate these effects (Fig. 10). A quantitative analysis of the depth distribution of PV-ir neurons showed that DA alone induced a significant increase in the percentage of PV-ir neurons in the superficial layers, concomitant with a decrease in the deeper layers. Although the addition of MK-801 with DA attenuated the laminar shift, it did not fully block the effect, in that the portion of labeled neurons in the superficial layers remained significantly increased compared with controls in the superficial layers (20–40% uppermost part of total cortical depth) and decreased in portions of the deeper layers (60% of depth) (Fig.11A). MK801 was effective in blocking the DA-induced increases in dendritic arborizations of PV-ir neurons as illustrated in Figure11B,C. Similar findings were observed with the AP-5 trials. Coapplication of AP5 with DA effectively blocked the laminar shift in PV-ir neuron distribution. In addition, the density of neurons in each lamina of the AP5 + DA-treated slices was reduced in comparison to DA-treated slices but similar to that in controls (Fig. 12). The number of neurons per layer was significantly lower in both of these groups than in the DA-only slices (p = 0.0004 for DA vs DA + AP5 and p = 0.00038 for DA vs NHS).
Fig. 10.
Micrographs of labeled neurons in slices from the MK801 trials that were maintained for 14 DIV. A, An untreated slice with PV-ir neurons visible as a band in layer V and a few scattered neurons in layers VI and III. B, A DA-treated slice with PV-ir neurons throughout the depth of the slice. C, An MK801-treated slice with a band of neurons in layer V, similar to that in the control. D, A slice treated with DA and MK801. PV-ir neurons are primarily in a band in layer V, with scattered neurons in layers VI and III. Scale bar (shown in D for A–D): 200 μm.
Fig. 11.

Histograms of the laminar distribution and the dendritic branching patterns of PV-ir neurons in slices from the MK801 trials that were maintained for 14 DIV. A, The distribution of PV-ir neurons is shown relative to the depth from the pial surface. A higher percentage of neurons is in the superficial laminae of DA-treated slices in comparison with controls. Treatment with MK801 in addition to DA did not block this effect of DA.B, The lengths of PV-ir dendrites at concentric radii from the soma are shown for each group. Neurons in the DA-treated slices showed increased dendritic lengths at all concentric radii examined compared with controls. MK801 completely blocked the DA-induced increases in dendritic length. C, The dendritic intersections at concentric radii from the soma are shown. DA treatment resulted in an increase in number of intersections at nearly all radial distances. This effect was blocked by MK801 at all radial distances, except 40 μm from the soma (*p < 0.05; Student’s t test).
Fig. 12.

Histogram showing the laminar distribution of PV-ir neurons expressed as percentage of total labeled neurons in each 10% increment of cortical depth, in slices from the AP5 trials. The distribution of PV-ir neurons is shown relative to the depth from the pial surface. The DA-treated slices had a higher percentage of neurons in the superficial laminae than in control slices or those treated with DA + AP5.
Parvalbumin expression is accelerated by the ingrowth of dopaminergic fibers
Dopaminergic reinnervation to the developing cortex was established with the mesencephalon–cortical cocultures. The characteristics of DA fiber ingrowth at daily time points were examined. At DIV 1–2, the axotomized DA fibers that were present at the time of culture preparation remained in the deep laminae of the cortex. By DIV 3 all of these fibers had virtually disappeared, and TH-positive fibers from the midbrain slice had reached the pial surface of the cortical slice. Fibers crossed from the mesencephalic slice, entered the cortex over the next few days (Fig.13), and initially ran in two bundles: one bundle of fibers ran radially down to enter the white matter, and a second bundle ran horizontally in layer I. From DIV 5 to 8, TH-positive fibers entered the deep laminae from the white matter and extended along the horizontal axis of the slice. These fibers arborized extensively over the next few days, and some branches reached into the superficial layers where they also began to branch. The deep laminae remained the most densely innervated. The bundle of fibers that extended into layer I early in the cocultures remained in this position. Its horizontal extent lagged behind that of the deeply running fiber bundle. Eventually a mature bilaminar pattern of fibers emerged.
Fig. 13.

Micrographs of a cortex–mesencephalon coculture immunostained for TH. The cortex is at the top in A andB. A, Coculture showing TH-labeled fibers crossing the gap between the two slices. B, High magnification of the same coculture showing dense TH-labeled fibers in the cortex. Scale bar, 200 μm.
The reinnervation of cortical slices with DA axons accelerated PV expression in comparison to cortical slices cultured without an adjacent midbrain slice (Student’s t test,p = 0.00054 for laminar distribution). At 14 DIV, the laminar distribution of PV-ir neurons was comparable to that of cortical slices treated with DA (no significant difference) in that labeled neurons were observed not only in the deep, but also in the superficial cortical layers (Fig. 14). Furthermore, the increased density of labeled neurons seen with DA-treated cortical slices was evident in the reinnervated cocultures as well (Fig. 15).
Fig. 14.

Graph showing the laminar distribution and density of PV-ir neurons, expressed as number of labeled neurons in each 10% increment of cortical depth, in the coculture trials. The distribution of PV-ir neurons is shown relative to the depth from the pial surface. The reinnervated cortices had a greater number of labeled neurons overall and greater densities in the superficial layers as compared with cortices cultured separately from mesencephalic slices. These measures were similar, however, to those in sister cultures treated with exogenous DA.
Fig. 15.

Micrograph of a cortical slice cocultured with a mesencephalic slice, immunostained for both TH and PV. Labeled fibers (arrowheads) show the extent of dopaminergic reinnervation. Numerous PV-ir neurons are visible in all cortical layers. Scale bar, 250 μm.
DISCUSSION
Parvalbumin expression follows similar sequential events in vitro and in vivo. Dopamine, acting preferentially at D2 receptors, accelerates developmental expression of PV. Ingrowth of dopaminergic axons in the coculture system also accelerates PV expression. MK801 and AP5 block the effects of DA on PV expression.
Technical considerations
Organotypic slice cultures are ideal for studying developmental events mediated by connectivity and exogenous influences in isolated systems. Features of intrinsic organization such as neuronal morphology and cytoarchitecture are maintained (Bolz et al., 1990; Stoppini et al., 1991; Gähwiler et al., 1997). Parvalbumin-ir neurons, in particular, maintain similar densities in organotypic cultures asin vivo (Weisenhorn et al., 1998). Moreover, neurons cocultured with target tissues form appropriate efferent connections (Bolz et al., 1990, 1992). Afferents distribute to and synapse with appropriate targets (Frotscher et al., 1995). Although difficult to assess morphologically, functional intrinsic connections are detectable physiologically: long-term potentiation in hippocampal cultures (Stoppini et al., 1991, Müller et al., 1996). Developmental events occur in response to the same influences and in the same manner as in vivo: downregulation of neuropeptide Y in vivo and in organotypic cultures that receive specific (thalamic/cortical) afferents, but not in deafferented slices (Obst and Wahle, 1997).
Our measurements of dendritic arbors were taken from portions of immunoreactive dendrites that express PV. Because observations were made during a period of sharp increases in PV expression, it was not possible to determine whether observed dendritic changes reflected actual morphological changes or merely differences in PV expression that yield incomplete dendritic filling. Therefore, although our observed differences in dendritic measures can be attributed to direct effects of DA on PV expression, they only suggest that dendritic growth is altered by DA.
Developmental expression of PV in vitro
The developmental sequence of PV expression is similar in organotypic cultures and in vivo. In the intact rodent cortex, PV expression appears first in somata of cingulate and retrosplenial cortices at PN 8–9 and of occipital, frontoparietal, and temporal cortices at PN 10–11 (Soriano et al., 1992; Alcantara et al., 1993). Our findings show similar in vitro events. Cingulate–perirhinal precedes frontoparietal labeling. Parvalbumin appears sequentially in layers V, VI, and then II–III, with somal preceding axonal and dendritic labeling. The earlier appearance in layer V than in VI indicates that expression is not concordant with neuronal migration and subsequent maturation, because migration occurs earlier and progresses from layer VI to II (Miller, 1988, Ignacio et al., 1995). Weisenhorn and colleagues (1998) were able to elicit mature patterns of PV expression only in organotypic slices of parietal cortex explanted at PN 7 or later, and not in slices explanted at PN 3. They concluded that extrinsic influences, such as late onset of tactile responsiveness in sensory cortex, were needed for normal PV expression. Different findings may have arisen from variable conditions (serum deprivation does not alter results in either study), but Plenz and Aertsen (1996) also achieved mature PV expression patterns in early organotypic explants (PN 0–2). Our observation that PV expression is delayed but not prevented in early, untreated cultures suggests that intrinsic factors trigger PV expression, whereas extrinsic influences, including DA, accelerate it.
Dopamine accelerates PV expression
If PN age at explant plus time in culture are considered equivalent to age in vivo, then the timing of PV expression in DA-treated slices, rather than controls, corresponds more closely to that in intact animals. Slices from PN 2–3 pups maintained for 7 DIV would be considered 10 d cortices. The PV expression pattern (dense band in frontoparietal layer V) in these DA-treated slices corresponds to that in intact animals at PN 10 (Soriano et al., 1992;Alcantara et al., 1993). This pattern does not occur until cortical age 16–17 (PN 2–3 donors + 14 DIV) in controls. Parvalbumin-ir somata appear in all frontoparietal layers by cortical age 16 d in DA-treated slices and 15 DIV. The appearance of labeled neurons in cingulate cortex and of somata, fibers, and baskets in specific laminae also occurs at similar times in vivo and in DA-treated cultures (Soriano et al., 1992; Alcantara et al., 1993). This observation is not surprising considering that the intact cortex is exposed to DA during development. Indeed, prenatal exposure to cocaine, which increases DA levels by interfering with uptake, increases PV-ir dendrites on interneurons in cingulate cortex. Interestingly, PV-containing interneurons in visual cortex, where DA innervation is sparse, are unaffected (Wang et al., 1996). These studies focused on morphogenesis of one subset of GABAergic neurons, but DA may affect others. Neurite extension of cultured primary neurons, which comprise a mixed neuronal population, is also altered by DA (Reinoso et al., 1996).
Dopamine reinnervation accelerates PV expression
Although development of the DA system varies across cortical regions, the pattern of DA innervation in our organotypic coculture system mimics that of similar cortical regions in vivo(Lindvall et al., 1978). The ingrowth of DA axons in the mesencephalon–cortex cocultures accelerated cortical PV expression in the same manner as in slices treated with exogenous DA. This observation suggests that perturbations to the developing DA system occurring in intact animals may modulate circuit formation during the period of PV expression.
D2 receptor mediation of DA-induced effects
Our findings indicate that D2 receptor activation preferentially, but not exclusively, enhances PV expression. Coapplication of D1 and D2 antagonists is more effective in blocking DA-induced acceleration of PV expression, suggesting that interaction between the two receptor subtypes is involved. Developing dopaminergic axons and D1 and D2 receptor mRNA expression are detected well in advance of PV appearance (Verney et al., 1982; Kalsbeek et al., 1988; Mack et al., 1991;Schambra et al., 1994), but their peak densities occur at PN 14, 14–30, and 7, respectively (Schmidt et al., 1982; Berger et al., 1983;Schambra et al., 1994). Onset of receptor binding, indicating function, occurs concurrently (PN 14–21) (Leslie et al., 1991). These similarities to timing of PV appearance suggest a link between receptor activation and PV expression. D2 mRNA is widespread in the adult rodent frontal cortex (Gaspar et al., 1995; Awenowicz and Porter, 1998), but binding is weak (Richfield et al., 1989; Schambra et al., 1994). Dense adult D2 mRNA suggests the possibility of transient increases in expression that are correlated with developmental PV expression.
Although the D2 receptor agonist is implicated in enhancing PV expression, its mechanism of action is uncertain. Both facilitatory and inhibitory responses to D2 receptor activation occur in the cortex (Bunney and Aghajanian, 1976; Reader et al., 1979; Sawaguchi et al., 1986; Penit-Soria et al., 1987; Pirot et al., 1992; Geijo-Barrientos and Pastore, 1995). Facilitatory responses of glutamatergic neurons could increase cortical excitability, which has been linked with increased PV expression (Celio et al., 1986; Hendrickson et al., 1991;Solbach and Celio, 1991; Cohen et al., 1993), but further studies are needed to determine the mechanisms of D2-mediated effects.
Dopamine and glutamate interactions
Our observation that the NMDA receptor antagonists MK801 and AP5 effectively block DA-induced effects on PV expression suggests that DA alters glutamatergic transmission. DA–glutamate interactions have been observed in slices of human neocortex where DA facilitates glutamate-induced responses in layer V pyramidal neurons by increasing depolarization and firing rate and decreasing latency of NMDA-induced EPSPs (Cepeda et al., 1992). Conversely, DA decreases depolarization and firing frequency of quisqualate-induced EPSPs (Cepeda et al., 1992). Thus, modulatory effects of DA depend on the glutamate receptor subtype involved. In layer V pyramidal neurons of rodent cortex, D1 agonists decrease both NMDA and AMPA components of EPSPs (Law-Tho et al., 1994). Interactions may differ during development. In prefrontal cortex of young but not of aged rats, nonspecific DA receptor activation increases extracellular glutamate (Porras et al., 1997). Perhaps this age-related alteration in DA receptor function reflects unique developmental roles for receptor subtypes. The predicted presynaptic effects of DA on glutamatergic transmission (Pralong and Jones, 1993; Law-Tho et al., 1994) have a putative morphological correlate. Triads, composed of a DA axon terminal, a postsynaptic spine, presumably of a pyramidal neuron, and an unlabeled asymmetric, presumably glutamatergic terminal, have been observed in the cortex (Goldman-Rakic et al., 1989).
Onset of synapse formation is another candidate for regulation of PV expression. Although the pattern of synaptogenesis in cortical slices is unknown, synaptic responses are detected early and increase dramatically at 2–3 weeks in hippocampal cultures (Stoppini et al., 1991). A recent study shows that synaptic maturation is accelerated by DA (Rizzo et al., 1998) and supports the notion that increased activity enhances PV expression.
Although PV expression occurs regardless of the presence of DA, it is increased and accelerated by DA in vivo (Wang et al., 1996) and in vitro (present study). The extent of dopaminergic innervation varies between species, projecting preferentially to medial frontal cortex in rodents but to the entire frontal lobe in primates (Berger and Gaspar, 1994). Thus, perturbations to the DA system might have broader effects on primate cortical development than that in rodents.
Footnotes
This work was supported by grants from CIBA-Geigy, Sandoz-Stiftung, Swiss National Science Foundation No. 31-40852.94 to J.P.H., and National Institutes of Health Grant NS 27038 to L.L.P. L.L.P. was a Visiting Professor at the Institut de Biologie Cellulaire et de Morphologie, Universite de Lausanne, Lausanne, Switzerland. We thank Elisabeth Köstner for her assistance with the culture preparations.
Correspondence should be addressed to Linda L. Porter at her present address: Department of Anatomy and Cell Biology, Uniformed Services University, 4301 Jones Bridge Road, Bethesda, MD 20814.
REFERENCES
- 1.Alcantara S, Ferrer I, Soriano E. Postnatal development of parvalbumin and calbindin D28K immunoreactivities in the cerebral cortex of the rat. Anat Embryol (Berl) 1993;188:63–73. doi: 10.1007/BF00191452. [DOI] [PubMed] [Google Scholar]
- 2.Awenowicz PW, Porter LL. Dopamine receptor distribution in rodent motor cortex: an immunohistochemical and in situ hybridization analysis. Soc Neurosci Abstr. 1998;24:788. [Google Scholar]
- 3.Berger B, Alvarez C. Neurochemical development of the hippocampal region in the fetal rhesus monkey, III: calbindin-D28K: calretinin and parvalbumin with special mention of Cajal-Retzius cells and the retrosplenial cortex. J Comp Neurol. 1996;366:674–699. doi: 10.1002/(SICI)1096-9861(19960318)366:4<674::AID-CNE8>3.0.CO;2-1. [DOI] [PubMed] [Google Scholar]
- 4.Berger B, Gaspar P. Comparative anatomy of the catecholaminergic innervation of rat and primate cerebral cortex. In: Smeets WJAJ, Reiner A, editors. Phylogeny and development of catecholamine systems in the CNS of vertebrates. Cambridge UP; Cambridge: 1994. pp. 293–324. [Google Scholar]
- 5.Berger B, Verney C, Gay M, Vigny A. Immunocytochemical characterization of the dopaminergic and noradrenergic innervation of the rat neocortex during early ontogeny. Prog Brain Res. 1983;58:263–267. doi: 10.1016/S0079-6123(08)60028-X. [DOI] [PubMed] [Google Scholar]
- 6.Bolz J, Novak N, Gotz M, Bonheoffer T. Formation of target-specific neuronal projections in organotypic slice cultures from rat visual cortex. Nature. 1990;346:359–362. doi: 10.1038/346359a0. [DOI] [PubMed] [Google Scholar]
- 7.Bolz J, Novak N, Staiger V. Formation of specific afferent connections in organotypic slice cultures from rat visual cortex cocultured with lateral geniculate nucleus. J Neurosci. 1992;12:3054–3070. doi: 10.1523/JNEUROSCI.12-08-03054.1992. [DOI] [PMC free article] [PubMed] [Google Scholar]
- 8.Bunney BS, Aghajanian GK. Dopamine and norepinephrine innervated cells in rat prefrontal cortex: pharmacological differentiation using microiontophoretic techniques. Life Sci. 1976;19:1783–1792. doi: 10.1016/0024-3205(76)90087-4. [DOI] [PubMed] [Google Scholar]
- 9.Carder RK, Leclerc SS, Hendry SHC. Regulation of calcium-binding protein immunoreactivity in GABA neurons of macaque primary visual cortex. Cereb Cortex. 1996;6:271–287. doi: 10.1093/cercor/6.2.271. [DOI] [PubMed] [Google Scholar]
- 10.Celio MR. Parvalbumin in most gamma-aminobutyric acid-containing neurons of the rat cerebral cortex. Science. 1986;231:995–997. doi: 10.1126/science.3945815. [DOI] [PubMed] [Google Scholar]
- 11.Celio MR. Calbindin D-28k and parvalbumin in the rat nervous system. Neuroscience. 1990;35:375–475. doi: 10.1016/0306-4522(90)90091-h. [DOI] [PubMed] [Google Scholar]
- 12.Celio MR, Scharer L, Morrison JH, Norman AW, Bloom FE. Calbindin immunoreactivity alternates with cytochrome c-oxidase-rich zones in some layers of the primate visual cortex. Nature. 1986;323:715–717. doi: 10.1038/323715a0. [DOI] [PubMed] [Google Scholar]
- 13.Cellerino A, Siciliano R, Domenici L, Maffei L. Parvalbumin immunoreactivity: a reliable marker for the effects of monocular deprivation in the rat visual cortex. Neuroscience. 1992;51:749–753. doi: 10.1016/0306-4522(92)90514-3. [DOI] [PubMed] [Google Scholar]
- 14.Cepeda C, Radisavljevic Z, Peacock W, Levine MS, Buchwald NA. Differential modulation by dopamine of responses evoked by excitatory amino acids in human cortex. Synapse. 1992;11:330–341. doi: 10.1002/syn.890110408. [DOI] [PubMed] [Google Scholar]
- 15.Chard PS, Bleakman D, Christakos S, Fullmer CS, Miller RJ. Calcium buffering properties of calbindin D-28K and parvalbumin in rat sensory neurons. J Physiol (Lond) 1993;472:341–358. doi: 10.1113/jphysiol.1993.sp019950. [DOI] [PMC free article] [PubMed] [Google Scholar]
- 16.Cohen MH, Zatezalo R, Land PW. Parvalbumin and calbindin immunoreactivity in the somatosensory barrel cortex and the effect of tactile experience. Soc Neurosci Abstr. 1993;19:1568. [Google Scholar]
- 17.Conde F, Lund JS, Jacobowitz DM, Baimbridge KG, Lewis DA. Local circuit neurons immunoreactive for calretinin, calbindin D-28k or parvalbumin in monkey prefrontal cortex: distribution and morphology. J Comp Neurol. 1994;341:95–116. doi: 10.1002/cne.903410109. [DOI] [PubMed] [Google Scholar]
- 18.DeFelipe J. Neocortical neuronal diversity: chemical heterogeneity revealed by colocalization studies of classic neurotransmitters, neuropeptides, calcium-binding proteins, and cell surface molecules. Cereb Cortex. 1993;3:273–289. doi: 10.1093/cercor/3.4.273. [DOI] [PubMed] [Google Scholar]
- 19.Frotscher M, Zafirov S, Heimrich B. Development of identified neuronal types and of specific synaptic connections in slice cultures of rat hippocampus. Prog Neurobiol. 1995;45:143–164. doi: 10.1016/0301-0082(94)00040-o. [DOI] [PubMed] [Google Scholar]
- 20.Gähwiler B, Capogna M, Debanne D, McKinney RA, Thompson SM. Organotypic slice cultures: a technique has come of age. Trends Neurosci. 1997;20:471–477. doi: 10.1016/s0166-2236(97)01122-3. [DOI] [PubMed] [Google Scholar]
- 21.Gaspar P, Bloch B, LeMoine C. D1 and D2 receptor gene expression in the rat frontal cortex: cellular localization in different classes of efferent neurons. Eur J Neurosci. 1995;7:1050–1063. doi: 10.1111/j.1460-9568.1995.tb01092.x. [DOI] [PubMed] [Google Scholar]
- 22.Geijo-Barrientos E, Pastore C. The effects of dopamine on the subthreshold electrophysiological responses of rat prefrontal cortex neurons in vitro. Eur J Neurosci. 1995;7:358–366. doi: 10.1111/j.1460-9568.1995.tb00331.x. [DOI] [PubMed] [Google Scholar]
- 23.Goldman-Rakic PS, Leranth PSC, Williams SM, Mons N, Geffard M. Dopamine synaptic complex with pyramidal neurons in primate cerebral cortex. Proc Natl Acad Sci USA. 1989;86:9015–9019. doi: 10.1073/pnas.86.22.9015. [DOI] [PMC free article] [PubMed] [Google Scholar]
- 24.Gutierrez C, Cusick CG. Effects of chronic monocular enucleation on calcium binding proteins calbindin-D28k and parvalbumin in the lateral geniculate nucleus of adult rhesus monkeys. Brain Res. 1994;651:300–310. doi: 10.1016/0006-8993(94)90710-2. [DOI] [PubMed] [Google Scholar]
- 25.Heikkila RE, Cabbat FS. Studies on the stability of 3H-dopamine in neostriatal membrane preparations: effects of ascorbic acid. Life Sci. 1983;32:847–853. doi: 10.1016/0024-3205(83)90221-7. [DOI] [PubMed] [Google Scholar]
- 26.Hendrickson AE, Van Brederode JFM, Mulligan KA, Celio MR. Development of the calcium-binding proteins parvalbumin and calbindin in monkey striate cortex. J Comp Neurol. 1991;307:626–646. doi: 10.1002/cne.903070409. [DOI] [PubMed] [Google Scholar]
- 27.Hendry SHC, Jones EG, Emson PC, Lawson DEM, Heizmann CW, Streit P. Two classes of cortical GABA neurons defined by differential calcium binding protein immunoreactivities. Exp Brain Res. 1989;76:467–472. doi: 10.1007/BF00247904. [DOI] [PubMed] [Google Scholar]
- 28.Ignacio MPD, Kimm EJ, Kageyama GH, Yu J, Robertson RT. Postnatal migration of neurons and formation of laminae in rat cerebral cortex. Anat Embryol (Berl) 1995;191:89–100. doi: 10.1007/BF00186782. [DOI] [PubMed] [Google Scholar]
- 29.Jones L, Fischer I, Levitt P. Nonuniform alteration of dendritic development in the cerebral cortex following prenatal cocaine exposure. Cereb Cortex. 1996;6:431–445. doi: 10.1093/cercor/6.3.431. [DOI] [PubMed] [Google Scholar]
- 30.Kalsbeek A, Voorn P, Buijs RM, Pool LW, Uylings HBM. Development of the dopaminergic innervation in the prefrontal cortex of the rat. J Comp Neurol. 1988;269:58–62. doi: 10.1002/cne.902690105. [DOI] [PubMed] [Google Scholar]
- 31.Kawaguchi Y, Kubota Y. Correlation of physiological subgroupings of nonpyramidal cells with parvalbumin- and calbindin D28k-immunoreactive neurons in layer V of rat frontal cortex. J Neurophysiol. 1993;70:387–396. doi: 10.1152/jn.1993.70.1.387. [DOI] [PubMed] [Google Scholar]
- 32.Kawaguchi Y, Kubota K. GABAergic cell types and their synaptic connections in rat frontal cortex. Cereb Cortex. 1997;7:476–486. doi: 10.1093/cercor/7.6.476. [DOI] [PubMed] [Google Scholar]
- 33.Kawaguchi Y, Katsumaru H, Kosaka T, Heizmann CW, Hama K. Fast spiking cells in rat hippocampus (CA1) regions contain the calcium-binding protein parvalbumin. Brain Res. 1987;416:369–374. doi: 10.1016/0006-8993(87)90921-8. [DOI] [PubMed] [Google Scholar]
- 34.Law-Tho D, Hirsch JC, Crepel F. Dopamine modulation of synaptic transmission in rat prefrontal cortex: an in vitro electrophysiological study. Neurosci Res. 1994;21:151–160. doi: 10.1016/0168-0102(94)90157-0. [DOI] [PubMed] [Google Scholar]
- 35.Leslie CA, Robertson MW, Cutler AJ, Bennet JP. Postnatal development of D1 dopamine receptors in the medial prefrontal cortex, striatum and nucleus accumbens of normal and neonatal 6-hydroxydopamine treated rats: a quantitative autoradiographic analysis. Dev Brain Res. 1991;62:109–114. doi: 10.1016/0165-3806(91)90195-o. [DOI] [PubMed] [Google Scholar]
- 36.Lindvall O, Bjorklund A, Divac I. Organization of catecholamine neurons projecting to the frontal cortex in the rat. Brain Res. 1978;142:1–24. doi: 10.1016/0006-8993(78)90173-7. [DOI] [PubMed] [Google Scholar]
- 37.Lukas W, Jones KA. Cortical neurons containing calretinin are selectively resistant to calcium overload and excitotoxicity in vitro. Neuroscience. 1994;61:307–316. doi: 10.1016/0306-4522(94)90233-x. [DOI] [PubMed] [Google Scholar]
- 38.Mack KJ, O’Malley KL, Todd RD. Differential expression of dopaminergic D2 receptor messenger RNAs during development. Dev Brain Res. 1991;59:249–251. doi: 10.1016/0165-3806(91)90105-r. [DOI] [PubMed] [Google Scholar]
- 39.Maier DL, McCasland JS. Calcium-binding protein phenotype defines metabolically distinct groups of neurons in barrel cortex of behaving hamsters. Exp Neurol. 1997;145:71–80. doi: 10.1006/exnr.1997.6426. [DOI] [PubMed] [Google Scholar]
- 40.Marien MR, Shin SH, Cooper GR, Jhamandas K. Stability of dopamine in an in vitro incubation system using Medium 199. Can J Physiol Pharmacol. 1984;62:600–603. doi: 10.1139/y84-096. [DOI] [PubMed] [Google Scholar]
- 41.McMahon DG, Rischert JC, Dowling JE. Protein content and CAMP-dependent phosphorylation of fractionated white perch retina. Brain Res. 1994;659:110–116. doi: 10.1016/0006-8993(94)90869-9. [DOI] [PubMed] [Google Scholar]
- 42.Miller MW. Development of projection and local circuit neurons in neocortex. In: Peters A, Jones EG, editors. Cerebral cortex. Plenum; New York: 1988. pp. 133–166. [Google Scholar]
- 43.Müller D, Wang D, Skibo G, Toni N, Cremer H, Calaora V, Rougon G, Kiss JZ. PSA-NCAM is required for activity-induced synaptic plasticity. Neuron. 1996;17:413–422. doi: 10.1016/s0896-6273(00)80174-9. [DOI] [PubMed] [Google Scholar]
- 44.Obst K, Wahle P. Phenotype specification of cortical neurons during a period of molecular plasticity. Eur J Neurosci. 1997;12:2571–2580. doi: 10.1111/j.1460-9568.1997.tb01686.x. [DOI] [PubMed] [Google Scholar]
- 45.Osterheld-Haas MC, Hornung JP. Laminar development of the mouse barrel cortex: effects of neurotoxins against monoamines. Exp Brain Res. 1996;110:183–195. doi: 10.1007/BF00228550. [DOI] [PubMed] [Google Scholar]
- 46.Penit-Soria J, Audinat E, Crepel F. Excitation of rat prefrontal cortical neurons by dopamine: an in vitro electrophysiological study. Brain Res. 1987;425:263–274. doi: 10.1016/0006-8993(87)90509-9. [DOI] [PubMed] [Google Scholar]
- 47.Pirot S, Godbout R, Mantz J, Tassin JP, Glowinski J, Thierry AM. Inhibitory effects of ventral tegmental area stimulation on the activity of prefrontal cortical neurons: evidence for the involvement of both dopaminergic and GABAergic components. Neuroscience. 1992;49:857–865. doi: 10.1016/0306-4522(92)90362-6. [DOI] [PubMed] [Google Scholar]
- 48.Plenz D, Aertsen A. Neural dynamics in cortex-striatum co-cultures-I. Anatomy and electrophysiology of neuronal cell types. Neuroscience. 1996;70:861–891. doi: 10.1016/0306-4522(95)00406-8. [DOI] [PubMed] [Google Scholar]
- 49.Porras A, Sanz B, Mora F. Dopamine-glutamate interactions in the prefrontal cortex of the conscious rat: studies on ageing. Mech Ageing Dev. 1997;99:9–17. doi: 10.1016/s0047-6374(97)00084-5. [DOI] [PubMed] [Google Scholar]
- 50.Pralong E, Jones RSG. Interactions of dopamine with glutamate- and GABA-mediated synaptic transmission in the rat entorhinal cortex in vitro. Eur J Neurosci. 1993;5:760–767. doi: 10.1111/j.1460-9568.1993.tb00540.x. [DOI] [PubMed] [Google Scholar]
- 51.Reader TA, Ferron A, Descarries L, Jasper HH. Modulatory role for biogenic amines in the cerebral cortex. Microiontophoretic studies. Brain Res. 1979;160:217–229. doi: 10.1016/0006-8993(79)90420-7. [DOI] [PubMed] [Google Scholar]
- 52.Reinoso BS, Undie AS, Levitt P. Dopamine receptors mediate differential morphological effects on cerebral cortical neurons in vitro. J Neurosci Res. 1996;43:439–453. doi: 10.1002/(SICI)1097-4547(19960215)43:4<439::AID-JNR5>3.0.CO;2-G. [DOI] [PubMed] [Google Scholar]
- 53.Richfield EK, Young AB, Penney JB. Comparative distributions of dopamine D-1 and D-2 receptors in the cerebral cortex of rats, cats, and monkeys. J Comp Neurol. 1989;286:409–426. doi: 10.1002/cne.902860402. [DOI] [PubMed] [Google Scholar]
- 54.Rizzo E, Pralong E, Hornung JP. Dopamine influences the maturation rate of rat cerebral cortex in vitro: electrophysiological and morphological observations. Soc Neurosci Abstr. 1998;24:351. [Google Scholar]
- 55.Sawaguchi T, Matsumura M, Kubota K. Dopamine modulates neuronal activities related to motor performance in the monkey prefrontal cortex. Brain Res. 1986;371:404–408. doi: 10.1016/0006-8993(86)90385-9. [DOI] [PubMed] [Google Scholar]
- 56.Schambra UB, Duncan GE, Breese GR, Fornaretto MG, Caron MG, Fremeau RT., Jr Ontogeny of D1A and D2 dopamine receptor subtypes in rat brain using in situ hybridization and receptor binding. Neuroscience. 1994;62:65–85. doi: 10.1016/0306-4522(94)90315-8. [DOI] [PubMed] [Google Scholar]
- 57.Schmidt RH, Bjorklund A, Lindvall O, Loren I. Prefrontal cortex: dense dopaminergic input in the newborn rat. Dev Brain Res. 1982;5:222–228. doi: 10.1016/0165-3806(82)90163-8. [DOI] [PubMed] [Google Scholar]
- 58.Seto-Ohshima A, Aoki E, Semba R, Emson PC, Heizmann CW. Appearance of parvalbumin-specific immunoreactivity in the cerebral cortex and hippocampus of the developing rat and gerbil brain. Histochemistry J. 1990;94:579–589. doi: 10.1007/BF00271984. [DOI] [PubMed] [Google Scholar]
- 59.Solbach S, Celio MR. Ontogeny of the calcium binding protein parvalbumin in the rat nervous system. Anat Embryol (Berl) 1991;184:103–124. doi: 10.1007/BF00942742. [DOI] [PubMed] [Google Scholar]
- 60.Soriano E, Del Río JA, Ferrer I, Auladell C, De Lecea L, Alcantara S. Late appearance of parvalbumin-immunoreactive neurons in the rodent cerebral cortex does not follow an “inside-out” sequence. Neurosci Lett. 1992;142:147–150. doi: 10.1016/0304-3940(92)90360-j. [DOI] [PubMed] [Google Scholar]
- 61.Stoppini L, Buchs P-A, Muller D. A simple method for organotypic cultures of nervous tissue. J Neurosci. 1991;37:173–182. doi: 10.1016/0165-0270(91)90128-m. [DOI] [PubMed] [Google Scholar]
- 62.van Brederode JFM, Mulligan KA, Hendrickson AE. Calcium-binding proteins as markers for subpopulations of GABAergic neurons in monkey striate cortex. J Comp Neurol. 1990;298:1–22. doi: 10.1002/cne.902980102. [DOI] [PubMed] [Google Scholar]
- 63.van Brederode JFM, Helliesen MK, Hendrickson AE. Distribution of the calcium-binding proteins parvalbumin and calbindin-D28k in the sensorimotor cortex of the rat. Neuroscience. 1991;44:157–171. doi: 10.1016/0306-4522(91)90258-p. [DOI] [PubMed] [Google Scholar]
- 64.Verney C, Berger B, Adrien J, Vigny A, Gay M. Development of the dopaminergic innervation of the rat cerebral cortex. A light microscopic immunocytochemical study using anti-tyrosine hydroxylase antibodies. Dev Brain Res. 1982;5:41–52. doi: 10.1016/0165-3806(82)90111-0. [DOI] [PubMed] [Google Scholar]
- 65.Wang XH, Levitt P, Grayson DR, Murphy EH. Intrauterine cocaine exposure of rabbits: persistent elevation of GABA immunoreactive neurons in anterior cingulate cortex but not visual cortex. Brain Res. 1995;689:32–46. doi: 10.1016/0006-8993(95)00528-x. [DOI] [PubMed] [Google Scholar]
- 66.Wang XH, O’Brien A, Jenkins, Choi L, Murphy EH. Altered neuronal distribution of parvalbumin in anterior cingulate cortex of rabbits exposed in utero to cocaine. Exp Brain Res. 1996;112:359–371. doi: 10.1007/BF00227942. [DOI] [PubMed] [Google Scholar]
- 67.Weisenhorn DMV, Celio MR, Rickmann M. The onset of parvalbumin expression in interneurons of the rat parietal cortex depends upon extrinsic factors. Eur J Neurosci. 1998;10:1027–1036. doi: 10.1046/j.1460-9568.1998.00120.x. [DOI] [PubMed] [Google Scholar]
- 68.Yan YH, Van Brederode JFM, Hendrickson AE. Transient co-localization of calretinin, parvalbumin, and calbindin-D28K in developing visual cortex of monkey. J Neurocytol. 1995;24:825–837. doi: 10.1007/BF01179982. [DOI] [PubMed] [Google Scholar]