Abstract
AMPA receptors mediate rapid glutamatergic synaptic transmission. In the mammalian cochlear nuclei, neurons receive excitatory input from either auditory nerve fibers, parallel fibers, or both fiber systems. The functional correlates of differences in the source of input were examined by recording AMPA receptor-mediated, miniature EPSCs (mEPSCs) in whole-cell voltage-clamp mode from identified neurons. Bushy, octopus, and T-stellate cells of the ventral cochlear nucleus (VCN) and tuberculoventral cells of the dorsal cochlear nucleus (DCN) receive most of their excitatory input from the auditory nerve; fusiform cells receive excitatory inputs from both the auditory nerve and parallel fibers; cartwheel cells receive excitatory input from parallel fibers alone. mEPSCs from bushy, octopus, T-stellate, and tuberculoventral cells had significantly faster decay time constants (0.35–0.40 msec) than did those from fusiform and cartwheel cells (1.32–1.79 msec). Some fusiform cells had two populations of mEPSCs with distinct time courses. mEPSCs in cells with auditory nerve input alone were inhibited by philanthotoxin, a blocker of calcium-permeable AMPA receptors, whereas mEPSCs in cells with parallel fiber input were not. Thus AMPA receptors postsynaptic to the auditory nerve differ from those postsynaptic to parallel fibers both in channel-gating kinetics and in their permeability to calcium. These results confirm the conclusion that synaptic AMPA receptors are specialized according to the source of input (Hunter et al., 1993; Rubio and Wenthold, 1997;Wang et al., 1998).
Keywords: mEPSCs, cochlear nuclei, AMPA receptors, auditory nerve, parallel fibers, time course, auditory pathways, philanthotoxin, calcium permeability, GluR2 subunit, polyamine
The mammalian cochlear nuclei offer an opportunity to relate the functional properties of AMPA receptors with neuronal function, because those properties contribute to the ability of these cells to convey the phase and frequency of sounds. Strong, rapid, and robust synaptic responses are required for conveying acoustic information contained in the timing of firing (Oertel, 1983;Wu and Oertel, 1984; Zhang and Trussell, 1994a; Golding et al., 1995;Isaacson and Walmsley, 1995, 1996) (for review, see Oertel, 1997, 1999; Trussell, 1997, 1999). In contrast with ventral cochlear nucleus (VCN) neurons, for which the temporal precision in firing is in the range of 100 μsec (Godfrey et al., 1975; Rhode and Smith, 1986;Joris et al., 1994) (for review, see Oertel, 1999), cartwheel cells of the dorsal cochlear nucleus (DCN) respond to repeated sound bursts with action potentials for which the timing varies over 100 msec (Parham and Kim, 1995; Davis and Young, 1997).
Synaptic responses in the mammalian VCN and its avian homolog reflect, in part, the rapid channel-gating kinetics of postsynaptic AMPA receptors (Raman and Trussell, 1992, 1994; Zhang and Trussell, 1994a,b;Isaacson and Walmsley, 1996). AMPA receptors in avian auditory nuclei are faster than those in adjacent regions of the brainstem (Raman et al., 1994). This finding raises the questions of whether receptors and the currents they mediate are specialized in mammalian auditory neurons and whether the time course of synaptic currents is associated specifically with synapses that involve the auditory nerve.
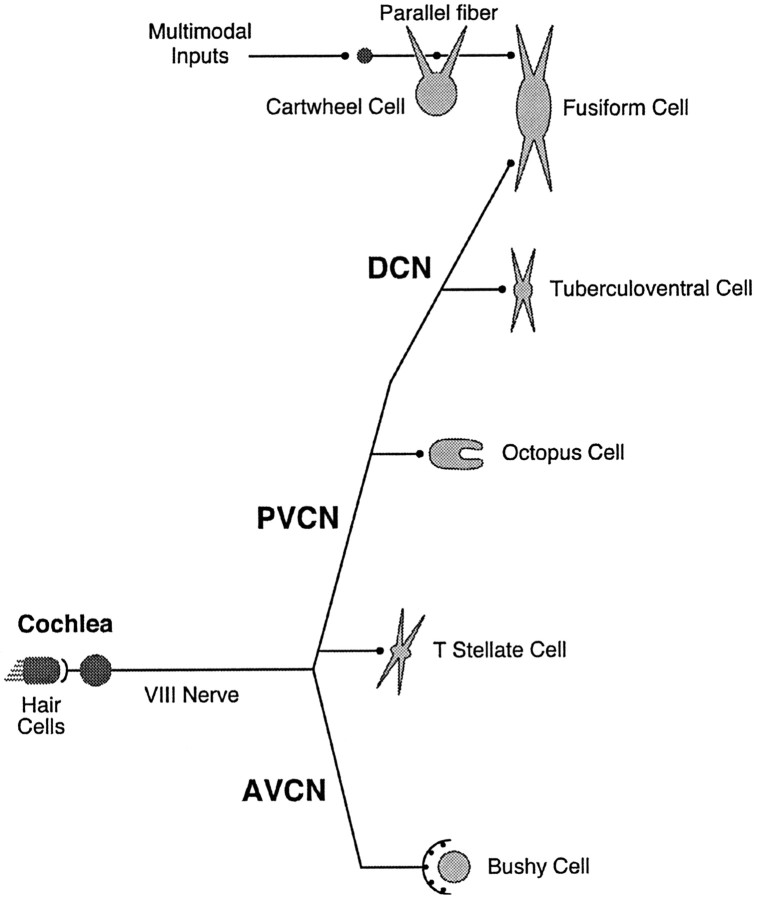
Neurons in the mammalian cochlear nuclei receive excitatory input via either or both of two fiber systems: auditory nerve fibers from the cochlea or parallel fibers of granule cells (Fig.1). In the VCN the bushy, T-stellate, and octopus cells are contacted by auditory nerve fibers (Osen, 1969;Brawer et al., 1974; Oertel et al., 1990). In the DCN the auditory nerve fibers terminate in the deep layer, contacting tuberculoventral cells and the basal dendrites of fusiform cells. Parallel fibers terminate in the molecular layer on spines of the apical dendrites of fusiform cells and on cartwheel cells.
Fig. 1.
Glutamatergic inputs to cells of the cochlear nuclei. Schematic representation depicts the major sources of excitatory input to some of the cells of the cochlear nuclei. Auditory nerve fibers bifurcate to innervate cells in the unlayered ventral cochlear nucleus (VCN) and in the deep layer of the dorsal cochlear nucleus (DCN). An anterior branch of each fiber innervates bushy and T-stellate cells in the anteroventral cochlear nucleus (AVCN), and the posterior branch innervates T-stellate cells in rostral posteroventral cochlear nucleus (PVCN) and octopus cells in the most caudal and dorsal PVCN. The posterior branch continues into the deep layer of the DCN where its terminals contact dendrites of tuberculoventral and fusiform cells. Parallel fibers, the axons of granule cells that lie in clusters around the VCN and within the DCN, course dorsoventrally in the molecular layer of the DCN, innervating the dendrites of cartwheel and fusiform cells.
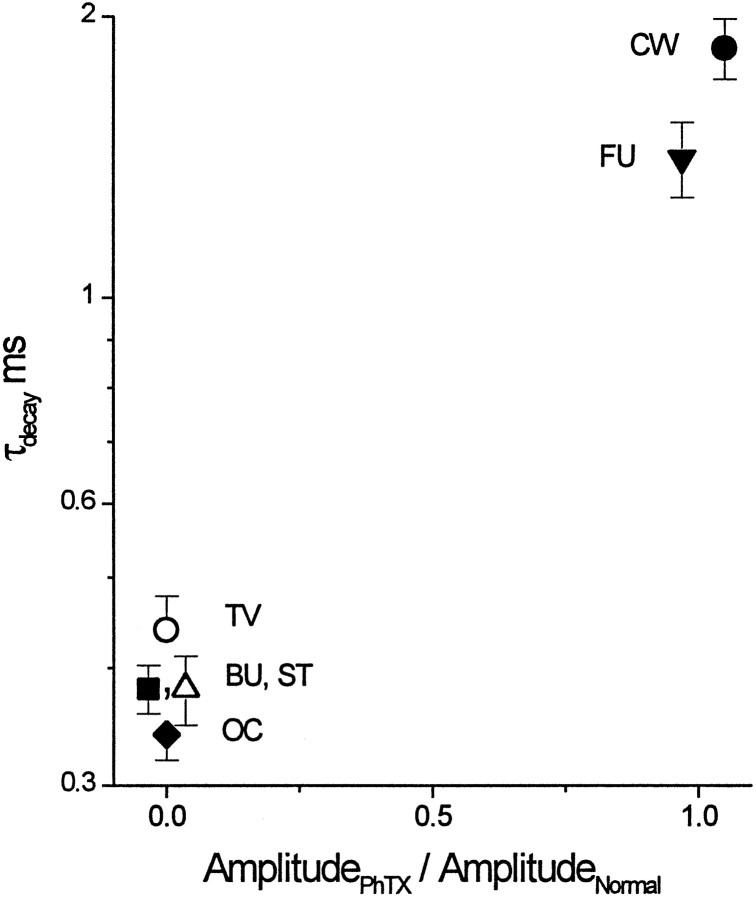
Immunohistochemical studies indicate that the AMPA receptor subunits are distributed differentially in accordance with the type of synaptic input. Although most of the AMPA receptor subunits, designated GluR1–GluR4 (GluRA–GluRD), are found at synapses of both fiber systems in the mammalian cochlear nuclei, GluR4 subunits are targeted selectively to dendrites and somata that are contacted by auditory nerve fibers (Hunter et al., 1993; Rubio and Wenthold, 1997; Wang et al., 1998). AMPA receptors that contain the GluR4 subunit gate rapidly (Sommer et al., 1990; Mosbacher et al., 1994). The GluR2 subunit, which is associated with AMPA receptors with slower kinetics and low calcium permeability, has been observed with the GluR4 subunit at some presumed auditory nerve synapses (Rubio and Wenthold, 1997). Our recordings of miniature EPSCs (mEPSCs) indicate that slowly decaying, PhTX-insensitive mEPSCs are associated with parallel fiber inputs and rapidly decaying, PhTX-sensitive mEPSCs with auditory nerve fiber inputs.
MATERIALS AND METHODS
All experiments were done in accordance with the protocols and guidelines of the Animal Care and Use Committee at the University of Wisconsin–Madison.
Slice preparation. Inbred CBA and ICR mice (Harlan Sprague Dawley, Madison, WI) ages 18- to 25-d-old were used for whole-cell patch-clamp experiments. The dissection and slicing were done at 34°C in oxygenated (95% O2/5% CO2) physiological saline composed of the following (in mm): 130 NaCl, 3 KCl, 1.3 MgSO4, 2.4 CaCl2, 20 NaHCO3, 3 HEPES, 10 glucose, and 1.2 KH2PO4, pH 7.4. Coronal slices of cochlear nuclei, 200 μm thick, were cut with a vibrating tissue slicer (Frederick Haer, Brunswick, ME) and immediately transferred to a nylon mesh in a beaker containing oxygenated saline at 34°C for 15–45 min. Then the slices were placed in the recording chamber, immobilized with strands of nylon attached to platinum wire, and superfused with oxygenated normal saline at 33–34°C. The flow of saline was maintained at 8–10 ml/min throughout the duration of the experiment, and drug applications [containing (in μm) 1 TTX, 20 DNQX, 1 strychnine, 50 kainic acid (Sigma, St. Louis, MO), and 50 philanthotoxin-343 (Research Biochemicals, Natick, MA)] were accomplished by a stopcock system that ensured continuous flow to the slices.
Whole-cell recordings. Cells were visualized with Nomarski differential interference contrast optics with a Zeiss Axioskop (Zeiss, Oberkochen, Germany) and a water immersion lens (63× magnification). Patch electrodes (4–10 MΩ) were fashioned from borosilicate glass tubes with a Flaming-Brown micropipette puller (Sutter Instrument, San Francisco, CA). They were coated with Sylgard (Dow Corning, Midland, MI) and fire-polished (Narishige Scientific Instruments, Tokyo, Japan) before use. The pipettes were filled with an intracellular solution composed of the following (in mm): 70 Cs2SO4, 7 KCl, 1 MgSO4·7 H2O, 1 CaCl2·2 H2O, 10 EGTA, 10 HEPES, and 2 Na2ATP, pH 7.3. In addition, 0.1% biocytin (Sigma) was included in the pipettes to label the cells for subsequent anatomical identification.
All recordings were made with the Axopatch 200A patch-clamp amplifier (Axon Instruments, Foster City, CA). The headstage was in the whole-cell, resistor feedback mode. Once it was in the whole-cell configuration, cell health and stability were evaluated. Cells were accepted for recording according to previously established criteria from this lab particular to each cell type for input resistance, membrane time constant, and action potential shape and size (Oertel, 1983; Oertel and Wu, 1989; Oertel et al., 1990; Zhang and Oertel, 1993a,b, 1994; Golding et al., 1995).
To record AMPA receptor-mediated mEPSCs, we held cells at −65 to −70 mV in the whole-cell voltage-clamp configuration (a liquid junction potential of −8 mV is corrected in the holding potentials). The series resistance (<12 MΩ) was compensated by 80–90%. mEPSCs were low-pass-filtered at 10 kHz and recorded at a sampling rate of 33 kHz with pClamp6 software (Axon Instruments).
Event detection and analysis of mEPSCs. Amplitude, 10–90% rise time, decay time constant, and inter-event intervals were measured off-line with pClamp software and the SpontEx program (Dr. M. I. Banks, University of Wisconsin, Madison, WI) written in Microcal Origin v5.0 software (Microcal Software, Northampton, MA). Events were detected with a sliding window, using a detection threshold of 3 SDs above the noise. Amplitudes were measured from the current baseline to the peak amplitude of the event. Rise times were measured as the time it took for the event to rise from 10 to 90% of the peak amplitude. Single exponentials were fit to the falling phase of individual events. Noise histograms were constructed from individual cells, using the concatenated data between events.
Histograms were constructed and statistical tests were performed with Origin v5.0 software. Although the data did not always follow a normal distribution, nonparametric statistics always gave the same result as Student’s t tests for two independent populations (α = 0.01 for all tests).
Histology. To verify the identification of each cell that was recorded, we included 0.1% biocytin in the recording pipette, and slices containing recorded cells were placed immediately in 4% paraformaldehyde after the whole-cell recording and stored at 4°C for between 24 hr and 2 weeks. The tissue was embedded in gelatin and albumin, cross-linked by glutaraldehyde, and sectioned at 60 μm with a vibratome. Slices were incubated with avidin conjugated to horseradish peroxidase (Vector ABC kit, Vector Laboratories, Burlingame, CA), and the cells were visualized after processing for horseradish peroxidase with cobalt and nickel intensification (Zhang and Oertel, 1993a). The sections were mounted on slides and counterstained with cresyl violet to view the cytoarchitecture of the cochlear nuclei. Cell identification was made according to previously reported light microscopic descriptions in the cochlear nuclei (Wu and Oertel, 1984; Oertel et al., 1990; Zhang and Oertel, 1993b, 1994; Manis et al., 1994).
RESULTS
Cell identification
The identification of cell type was crucial for the present study. All cells were identified during the experiments on the basis of their location in the cochlear nuclei and their electrophysiological properties; in 30 of 53 recorded cells the identification was verified histologically. In the living slices the unlayered VCN, criss-crossed with thick fascicles of myelinated axons that appear opaque when visualized with Nomarski optics, and layered DCN, with myelination confined to the deep layer, were distinct and easily identifiable. Where cells were intermingled, the size and shape of the cell body aided in identifying and targeting particular types of cells. For most cells in the cochlear nuclei, depolarizing somatic current injection elicits a hallmark response that is correlated with anatomical classifications (Oertel, 1983; Oertel et al., 1990; Zhang and Oertel, 1993b, 1994; Golding et al., 1995). The complex spikes of cartwheel cells identify them uniquely; six slices in which recordings were made from cartwheel cells thus were not processed histologically. Withdrawal of the patch electrodes sometimes damaged neurons.
Kinetic properties of AMPA receptor-mediated mEPSCs
All recorded neurons in the VCN and DCN had mEPSCs mediated by AMPA receptors from patch recordings in the whole-cell configuration. Most neurons in the cochlear nuclei of mice receive glycinergic input. In the present experiments, glycinergic mEPSCs in many cells were so frequent that they obscured glutamatergic mEPSCs and thus were blocked routinely by 1 μm strychnine. In octopus cells no outward mEPSCs were detected, and inward mEPSCs were not affected by bath-applied strychnine in three cells that were tested. These findings are consistent with the observation that no glycine-positive boutons were observed in the octopus cell area (Wickesberg et al., 1991, 1994;Kolston et al., 1992) and that strychnine had no effect on synaptic responses recorded in vitro (Golding et al., 1995). In all five cells that were tested, all mEPSCs recorded at −65 to −70 mV in the presence of 1 μm TTX and 1 μm strychnine were abolished by 20 μm DNQX and thus were identified as being mediated by AMPA receptors. Inward currents mediated by NMDA receptors were not observed because cells were held near their resting potential in a bath that contained magnesium, conditions under which NMDA receptors are blocked.
Examples of spontaneous mEPSCs in bushy, octopus, T-stellate, tuberculoventral, fusiform, and cartwheel cells appear as downward deflections in the current traces in Figure2. In these examples (Fig. 2,left), as in all recordings, the amplitudes of mEPSCs were variable. Although frequencies of events varied somewhat from cell to cell, there was a large and consistent difference in the frequency of spontaneous mEPSCs in octopus cells relative to their frequency in other cell types. Events occurred with an average frequency of 71 Hz in octopus cells, nearly an order of magnitude higher than any other group of cells in the cochlear nuclei (Fig. 2, left, Table1). Ensemble averages of events in individual cells are shown also (Fig. 2, right). These show that events are generally brief in bushy, octopus, T-stellate, and tuberculoventral cells and are slower in fusiform and cartwheel cells (Fig. 2, Table 1).
Fig. 2.
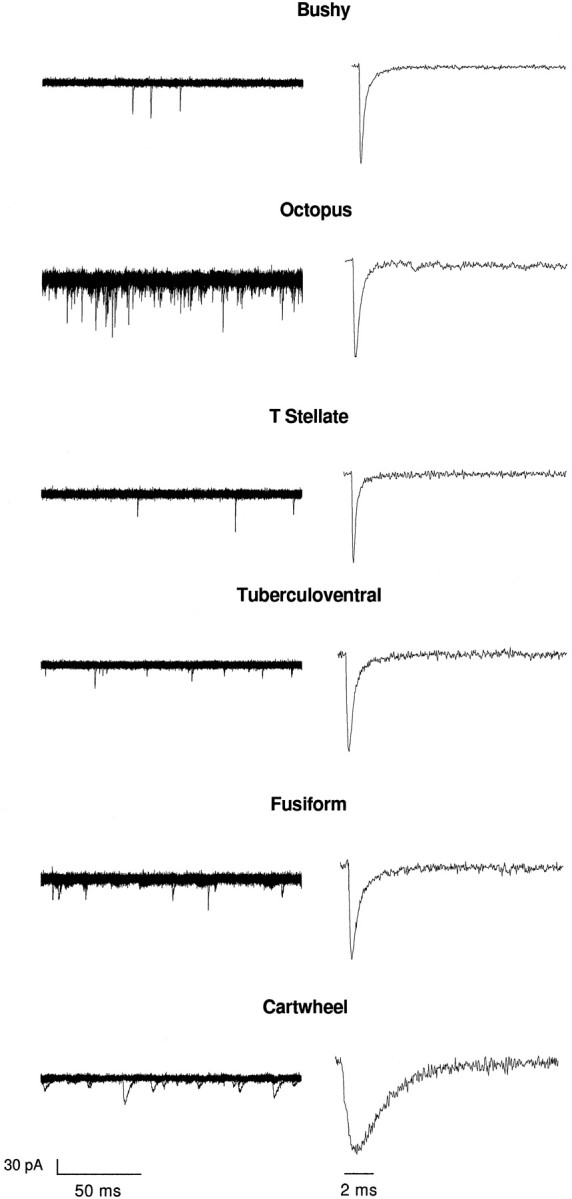
mEPSCs differ between cells with only auditory nerve input and those with input from parallel fibers.Left, mEPSCs appear as spontaneous inward currents of varying amplitude. Ten consecutive superimposed traces show that mEPSCs occur in all of the recorded cells. In fusiform cells some mEPSCs are rapid, whereas other mEPSCs are small and slow. In cartwheel cells mEPSCs are slow. The observation that they occur more frequently in octopus cells than in other types of cells is consistent.Right, Normalized ensemble averages of individual events from single cells (31–108 events) show that events in bushy, octopus, T-stellate, and tuberculoventral cells are more rapid than in fusiform and cartwheel cells of the DCN. The ensemble average of events in fusiform cells includes both the rapid and slow events. The time of peak was used to align all of the events to be averaged; this leads to an inflection in the rising phase of the average current in the cartwheel cell because the rise times were variable.
Table 1.
Comparison of properties of mEPSCs in six types of cells in the cochlear nuclei
| Cell type | Amplitude (pA) | 10–90% rise (msec) | τdecay (msec) | Frequency of events (Hz) | Number of events | Number of cells |
|---|---|---|---|---|---|---|
| Bushy | 65 ± 44 | 0.14 ± 0.06 | 0.40 ± 0.15 | 10 ± 6 | 2281 | 7 |
| Octopus | 57 ± 23 | 0.20 ± 0.12 | 0.35 ± 0.16 | 71 ± 100 | 1498 | 5 |
| T-stellate | 88 ± 59 | 0.15 ± 0.08 | 0.36 ± 0.22 | 3 ± 2 | 625 | 6 |
| Tuberculoventral | 43 ± 17 | 0.18 ± 0.06 | 0.40 ± 0.16 | 10 ± 7 | 1451 | 5 |
| Fusiform | 42 ± 19 | 0.43 ± 0.39 | 1.32 ± 1.50 | 11 ± 10 | 916 | 6 |
| Cartwheel | 44 ± 22 | 0.67 ± 0.54 | 1.99 ± 1.72 | 9 ± 8 | 676 | 6 |
All values are expressed as the mean ± SD.
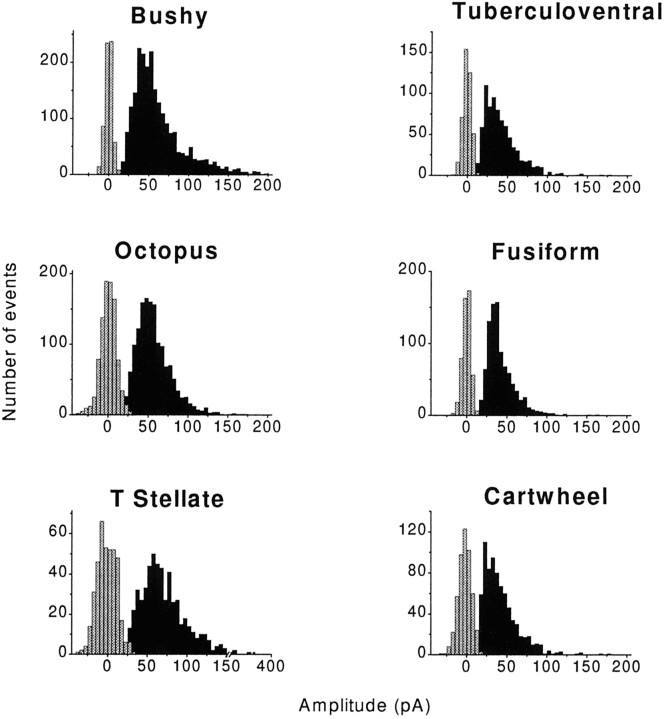
The amplitude of the mEPSCs showed a wide distribution for each cell type. Amplitudes of events varied between ∼20 and 350 pA, with means ranging from ∼40 to 90 pA (Table 1). Figure3 shows histograms of measurements summed over all of the recorded cells. mEPSCs generally rose distinctly from the noise (Fig. 3, gray bars). In the VCN, amplitudes were largest in T-stellate cells, smaller in bushy cells, and smallest in octopus cells. In the DCN, amplitudes of events in tuberculoventral, fusiform, and cartwheel cells did not differ significantly. Events in cells of the VCN were significantly larger than those in DCN cells (p < 0.01; Student’s t test). The range in the amplitudes for each cell type could not be attributed to dendritic filtering (see below).
Fig. 3.
Amplitudes of events are variable in all cell types. The majority of mEPSCs was distinguishable from the noise (gray bars). Amplitudes varied widely within each of the cell types, on average being largest in T-stellate cells and smallest in cartwheel cells. The data are binned at 10 pA; each histogram represents data pooled from several cells of each cell type. The data are summarized numerically in Table 1.
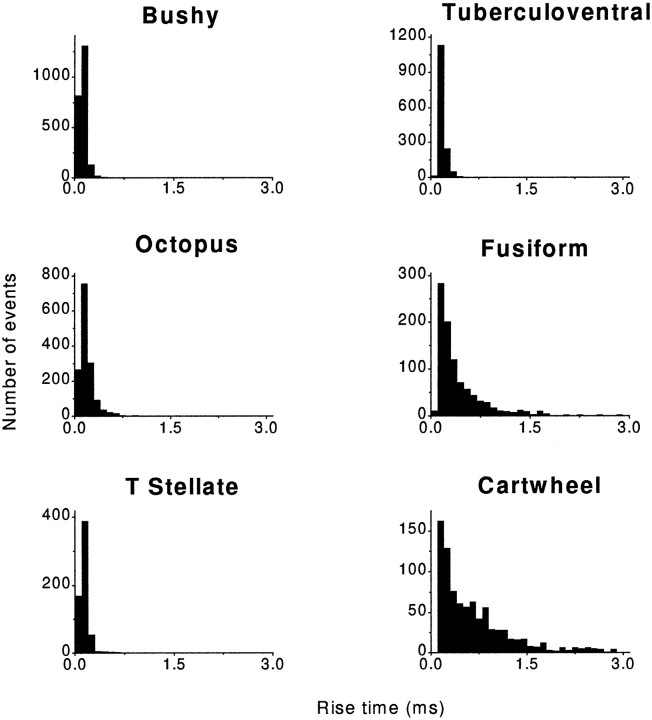
The mEPSCs rose significantly faster in bushy, octopus, T-stellate, and tuberculoventral cells than in fusiform and cartwheel cells (Fig.4). The 10–90% rise times for mEPSCs in cells of the VCN and the tuberculoventral cell of the DCN were, on average, <200 μsec whereas those in fusiform and cartwheel cells of the DCN were, on average, two to three times larger, ∼430 and 660 μsec, respectively; the differences were statistically significant (p < 0.01; Student’s t test) (Table1). Furthermore, the distributions of rise times of mEPSCs were narrower for bushy, T-stellate, octopus, and tuberculoventral cells, indicating that their shapes were more stereotyped than those in fusiform and cartwheel cells. The distant location of synapses may account for some of the slower rise times observed in these cells as a consequence of dendritic filtering (see below).
Fig. 4.
Rise times of mEPSCs were fast in cells with auditory nerve input. The 10–90% rise times of mEPSCs from bushy, octopus, and T-stellate cells of the VCN and the tuberculoventral cell of the DCN were, on average, faster than those from fusiform and cartwheel cells of the DCN. Rise times in bushy, octopus, T-stellate, and tuberculoventral cells had narrow distributions, whereas those of fusiform and cartwheel cells had broad distributions. Rapidly rising events, events in the first 0.1 msec bin, were observed in all of the cells that receive input from the auditory nerve, but not in the cartwheel cells that do not get input from the auditory nerve. Each histogram represents data pooled from several cells of each cell type. These data are summarized numerically in Table 1.
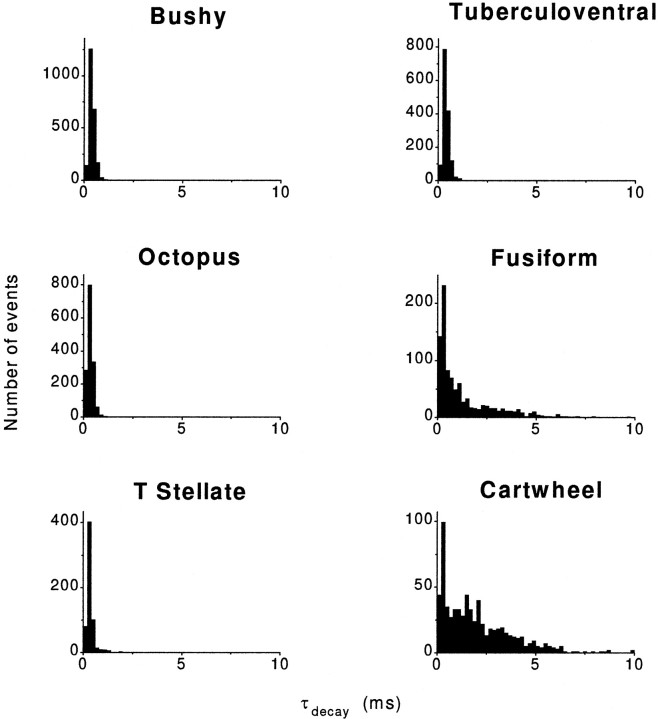
The decay time constants of the mEPSCs were also significantly shorter in cells that receive only auditory nerve input than in cells that have parallel fiber input (Fig. 5). Individual events measured in bushy, octopus, T-stellate, and tuberculoventral cells decayed with single exponential decay time constants of ∼350–400 μsec. In contrast, mEPSCs recorded in fusiform and cartwheel cells of the DCN decayed with time constants that were, on average, three to four times longer, ∼1–2 msec, and were significantly different from the cells with only auditory nerve input (p ≪ 0.01) (Table 1).
Fig. 5.
Decay of mEPSCs in cells with auditory nerve input is faster than in cells with parallel fiber input. Single exponential decay time constants fit to individual events were generally faster in bushy, octopus, T-stellate, and tuberculoventral cells for which the excitatory input is from the auditory nerve rather than in cartwheel cells for which the excitatory input is from parallel fibers. The range of decay time constants was broad in cells with parallel fiber input, the fusiform and cartwheel cells. The data are binned at 0.2 msec. Each histogram was constructed from several cells of each cell type. The data are summarized numerically in Table 1.
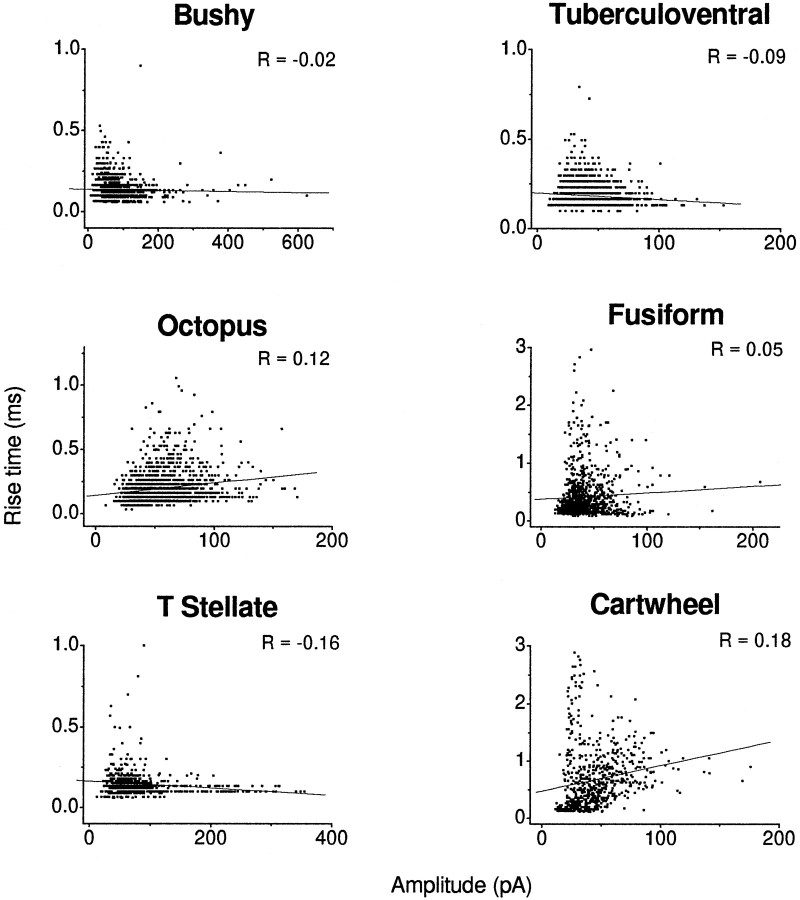
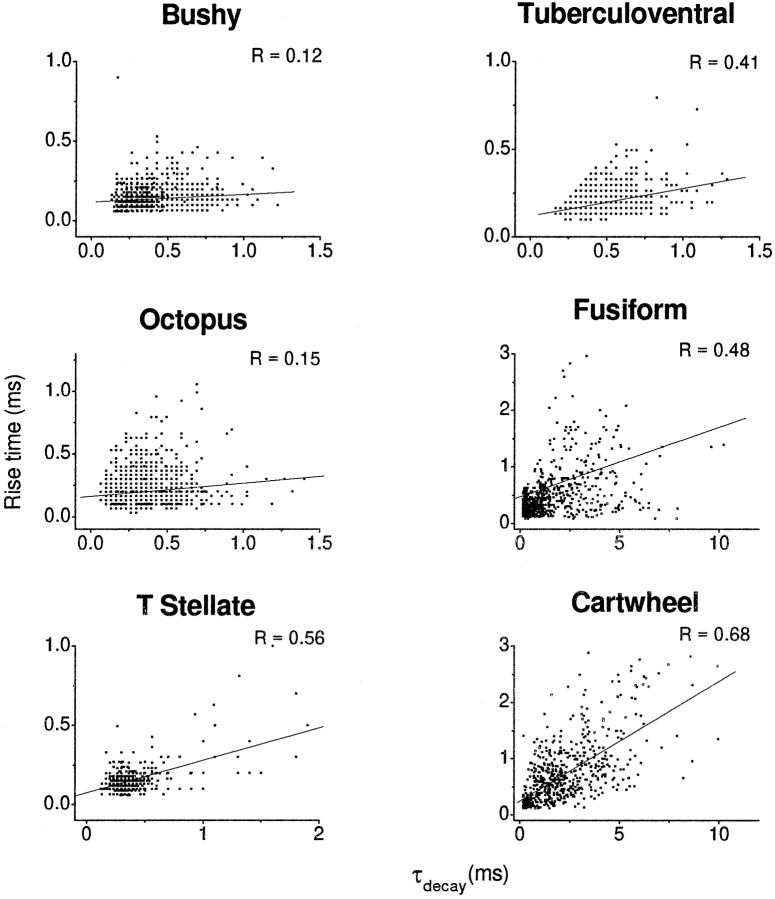
To determine the degree to which dendritic filtering might play a role in shaping the properties of the mEPSCs measured in the different cell types, we evaluated the relationships between the rise time and amplitude and decay time constant. Figure6 shows plots of the rise time of the combined events measured from all of the cells as a function of amplitude. If there were significant filtering, those events with the longest rise times would have the smallest amplitudes and those with the shortest rise times would have the largest amplitudes, giving these plots negative slopes. There was no significant correlation between rise time and amplitude in any of the six cell types; correlation coefficients ranged from 0.19 to −0.16. Plots of rise time as a function of decay time constant were examined also (Fig.7). If there were significant filtering, those events with the longest rise times also would be expected to have the longest decay time constants, giving these plots a positive slope. There was a slight correlation of rise time and decay time constant in bushy and octopus cells (r = 0.12 and 0.15, respectively). In T-stellate, tuberculoventral, fusiform, and cartwheel cells there was a stronger correlation between the rise time and decay time constants (r = 0.56, 0.41, 0.48, and 0.64, respectively). Thus, although a correlation between rise times and amplitudes was not observed in any of the cells, the positive correlation between rise and decay times indicates that some of the events probably are affected by dendritic filtering in T-stellate, tuberculoventral, fusiform, and cartwheel cells.
Fig. 6.
Plots of rise times against amplitudes show no evidence for dendritic filtering. Plots of rise times as a function of amplitude had positive or slightly negative correlations. For each scatterplot a simple regression line was fit through the data, and the correlation coefficient was computed. Negative correlations between rise time and amplitude are indicative of filtering; an absence of correlation can be the result of the large variability in amplitude that commonly is observed in these cells. The data represent values pooled from several cells of each cell type.
Fig. 7.
Plots of rise times against decay time constants show evidence for dendritic filtering of events in some cell types. Plots of rise time against the decay time constant showed a strong positive correlation for T-stellate, tuberculoventral, fusiform, and cartwheel cells. The correlation of rise time and decay time constant are indicative of an effect on the time course of some events by dendritic filtering. For each scatterplot a linear regression line was fit through the data, and the correlation coefficient was computed. The data were pooled from several cells of each cell type.
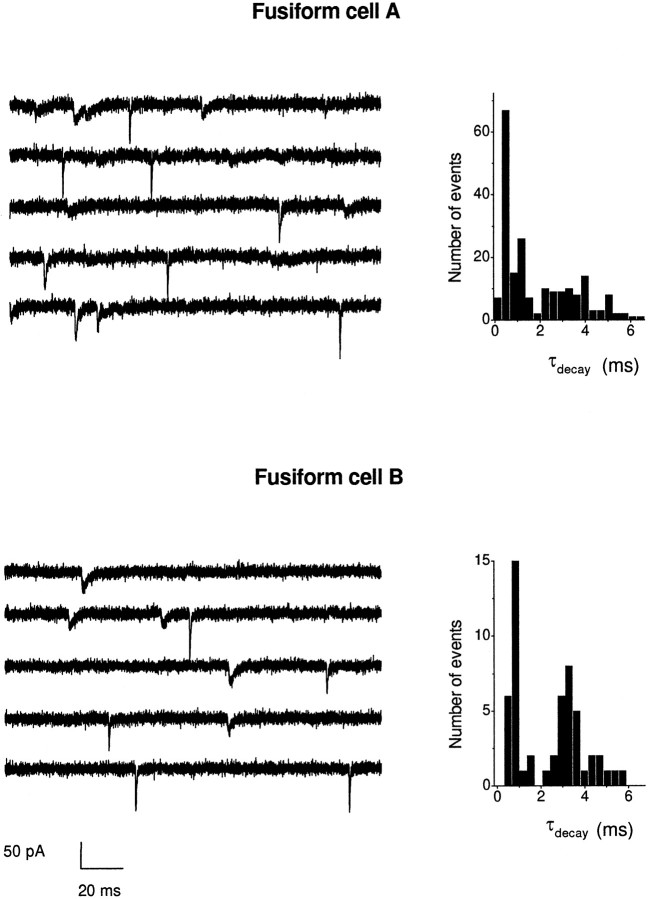
Fusiform cells have two distinct, anatomically segregated inputs with differentially distributed glutamate receptor subunits, suggesting that mEPSCs might be of two kinetically distinct populations. In the histograms in which the measurements of rise time, decay time constant, and amplitude of several cells were combined (see Figs. 4-6), events did not appear to belong to two separate populations. In two of the six individual fusiform cells that were studied, however, two populations of kinetically different mEPSCs were observed (Fig.8). There were rapidly rising, rapidly decaying events (10–90% rise 179 μsec, τdecay 660 μsec in cell A; 10–90% rise 207 μsec, τdecay 820 μsec in cell B) and rapidly rising, slowly decaying events (10–90% rise 334 μsec, τdecay 3.64 msec in cell A; 10–90% rise 385 μsec, τdecay 3.59 msec in cell B). These two populations formed a bimodal distribution in the decay time constant histograms (Fig. 8, right). The differences in the decay times that gave rise to two populations in the decay time constant histograms were not attributable to dendritic filtering because there were no large correlations between the rise times and the amplitude and decay time constants for the events in the two cells (data not shown). The two types of mEPSCs in these fusiform cells may represent AMPA receptors with different kinetic properties as a function of the selective targeting of receptor subunits.
Fig. 8.
Some fusiform cells have two populations of mEPSCs. Left, Some fusiform cells had two kinetically distinct groups of mEPSCs. Five consecutive traces are shown for each cell in which rapid events can be distinguished by eye from slow events. Right, Histograms for the decay time constant for each cell show a bimodal distribution representing two populations. The data are binned at 0.45 msec for both fusiform cells.
Permeation properties of AMPA receptors in the cochlear nuclei
The polyamine-containing wasp toxin, philanthotoxin-343 (PhTX), was used as a tool to probe for the presence of GluR2 subunits in AMPA receptors in the six cell types that were studied. PhTX selectively blocks AMPA receptors that lack the GluR2 subunit (Washburn and Dingledine, 1996; Tóth and McBain, 1998). The presence of GluR2 has been shown to block calcium permeability (Hollmann et al., 1991;Geiger et al., 1995). Whole-cell voltage-clamp recordings were made as before. After events were collected for a baseline measurement of amplitude, rise and decay times, and frequency of events, 50 μm PhTX was bath-applied to the slice for 5 min. Initial experiments showed no effect of PhTX on mEPSCs when it was applied alone. PhTX is an open-channel blocker (Bähring and Mayer, 1998); presumably, the frequency of mEPSCs was not sufficiently high to open many channels during the application of the toxin. Therefore, in later experiments (all of those specifically reported in this study) 50 μm kainate was coapplied for 2–3 min with the toxin to increase the likelihood of blocking PhTX-sensitive channels. To eliminate any effects that the toxin may have on presynaptic calcium channels, we also coapplied 50 μmCdCl2 (Karst et al., 1994). mEPSCs were acquired after washout of the kainate, PhTX, and cadmium, and the holding current returned to baseline.
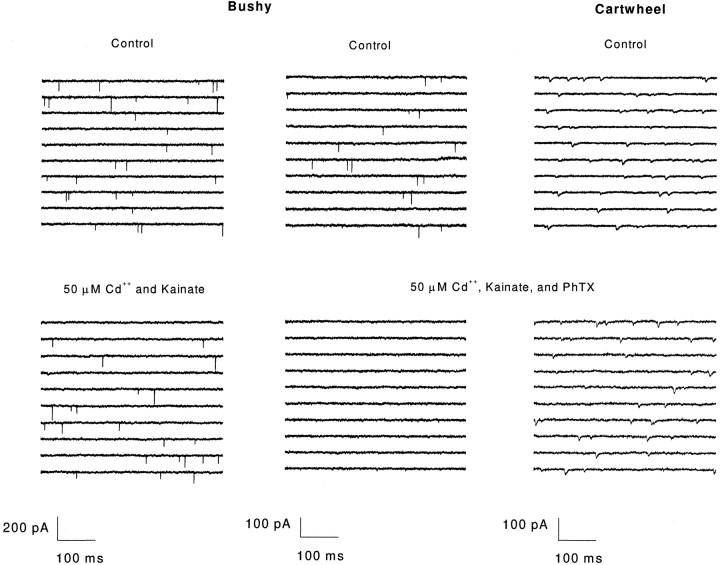
In eight neurons, including bushy, T-stellate, octopus, and tuberculoventral cells, mEPSCs were abolished by the addition of PhTX with kainate (two cells each; Fig. 9). In contrast, PhTX had no detectable effect on the mEPSCs in both fusiform and cartwheel cells. Amplitudes and rise and decay times in these cells were identical before and after PhTX was added (three cells each;p > 0.01; Student’s t test) (Fig. 9). In the three fusiform cells that were tested, however, two populations of kinetically distinct mEPSCs were not observed. It is possible that the fast mEPSCs would have been PhTX-sensitive. The effect of PhTX was reversed in two bushy, one T-stellate, and one tuberculoventral cell by washing for 45–90 min. The blockade of events was not attributable to kainate exposure because 50 μm kainate and Cd2+ had no effect on mEPSCs in two cells that were tested (Fig. 9). These results indicate that those cells with mEPSCs that have rapid kinetics are blocked by PhTX and thus have calcium-permeable AMPA receptors (Fig.10). Those cells with slower mEPSC decays, the fusiform and cartwheel cells, were not affected by PhTX and therefore do not use calcium-permeable AMPA receptors.
Fig. 9.
PhTX blocks AMPA receptors only with auditory nerve input and not with parallel fiber input. Left, The 50 μm cadmium and kainate alone had no effect on mEPSCs in a bushy cell. The amplitude, rise and decay time, and frequency of events before and after were not significantly different (p < 0.01; Student’s ttest). Center, mEPSCs were abolished completely by 50 μm PhTX in a bushy cell. Right, 50 μm PhTX did not affect mEPSCs in a cartwheel cell. The amplitude, rise and decay time, and frequency before and after were not significantly different (p < 0.01; Student’s t test). Strychnine (1 μm) was present in the bath for the duration of the recording to isolate the mEPSCs. All traces were filtered off-line at 5 kHz for presentation purposes.
Fig. 10.
Cells with auditory nerve input alone have rapidly gating calcium-permeable AMPA receptors. Plotting the average decay time constant (±SEM) versus the average amplitude of events after PhTX relative to before shows that those cells with rapidly decaying mEPSCs (bushy, T-stellate, octopus, and tuberculoventral cells) are also sensitive to PhTX. Those cells with slower mEPSC decays (fusiform and cartwheel cells) were insensitive to PhTX. Thex-axis was calculated from average amplitude values for each cell. The decay time constants represent the average decay of events in each cell before the application of PhTX, kainate, and Cd2+. The amplitudes were not changed significantly in fusiform and cartwheel cells (p < 0.01; Student’s t test) but were not identical before and after PhTX (AmplitudePhTX/AmplitudeNormal ≠ 1).
DISCUSSION
The synaptic transfer of signals from the auditory nerve to neurons in the cochlear nuclei is a key step in determining to what extent periodicity and transients in sound are preserved and sharpened as acoustic information passes along the auditory pathways. The present study provides a comparison of spontaneous mEPSCs mediated by synaptic AMPA receptors in cochlear nuclear neurons that receive input from the auditory nerve and from parallel fibers in widely differing configurations. Three findings are noteworthy. First, rapid, PhTX-sensitive mEPSCs were measured in neurons that receive input from only the auditory nerve and not in neurons that receive input from parallel fibers (Fig. 10). Second, dendritic filtering was most profound in cells that have dendritic spines. Third, there was a striking difference in the frequency of mEPSCs among cells. These data offer physiological evidence to complement studies in avian auditory nuclei (Raman et al., 1994; Otis et al., 1995) and support immunohistochemical data that propose that the source of excitatory input is an important factor in determining the properties of postsynaptic AMPA receptors (Hunter et al., 1993; Rubio and Wenthold, 1997; Wang et al., 1998).
mEPSCs associated with input from the auditory nerve have fast decay kinetics and are PhTX-sensitive
Cells that receive a direct input from the auditory nerve had mEPSCs that decayed significantly faster than those in cells that are contacted by parallel fibers. Decay time constants were significantly faster in bushy, octopus, T-stellate, and tuberculoventral cells than in cartwheel cells and most fusiform cells. Two fusiform cells showed events having bimodal distributions; some mEPSCs had fast rise times and fast decay times, whereas others had fast rise times and slow decay times (see Fig. 8). A simple explanation for these observations that takes into account immunohistochemical findings (Rubio and Wenthold, 1997) is that fast mEPSCs arise from the auditory nerve and that slow mEPSCs arise from the parallel fibers. Two kinetically distinct populations of mEPSCs could not be resolved in all fusiform cells or in the total population of measured mEPSCs, however. Some events in fusiform cells were affected by dendritic filtering (see Fig. 7) contributing to the spread in the distribution and perhaps obscuring differences. The occurrence of rapidly and slowly decaying mEPSCs also could be affected by the relative abundance of basal dendrites. Fusiform cells in mice consistently have large apical dendritic arbors, but the basal dendritic arbors vary from lush to sparse (Oertel and Wu, 1989). One might expect, therefore, that in some fusiform cells the frequency of fast events might be low. We conclude that all fusiform cells have two populations of decay times of mEPSCs but that they cannot always be resolved.
AMPA receptor-mediated mEPSCs from the auditory nerve were blocked by 50 μm PhTX, whereas mEPSCs from parallel fiber input were not affected in all cell types except fusiform cells. In the three fusiform cells that were tested there was no detectable effect of PhTX on the mEPSCs. It is not clear how to interpret this result. It is possible that the receptors in the basal dendrites are different from others postsynaptic to the auditory nerve. Because basal dendrites probably receive excitatory input from other neurons, including cells in the VCN (Oertel et al., 1990), PhTX insensitivity is possibly, but not necessarily, associated with auditory nerve inputs. On the other hand, it is difficult to measure the blockade of a small proportion of mEPSCs; in the three cells that were tested, rapid mEPSCs were rare.
The differences in decay kinetics and the related permeation properties among cells of the cochlear nuclei are likely to be associated with differences in the subunit composition of AMPA receptors. Although the distribution of flip/flop splice variants of the subunits has not been examined closely in the cochlear nuclei, the GluR4 subunit, which has been associated with currents with rapid rates of decay (Sommer et al., 1990; Mosbacher et al., 1994), appears to be associated consistently with auditory nerve synapses. AMPA receptor subunit protein on bushy cells opposite the endbulbs has been identified as being mainly GluR3 and GluR4 (Wang et al., 1998). In addition, GluR4 subunits have been shown to be localized on the basal dendrites that receive input from the auditory nerve and not on apical dendrites that receive input from parallel fibers (Rubio and Wenthold, 1997). These studies suggest that the kinetic properties of AMPA receptors are specialized according to the source of input; receptors postsynaptic to the auditory nerve have high levels of the GluR4 and are fast, whereas receptors postsynaptic to parallel fibers lack GluR4 and are slow. The GluR2 subunit, which is associated with slower kinetics and low calcium permeability (Hollmann et al., 1991; Geiger et al., 1995), is absent in synapses of bushy cells (Wang et al., 1998). In fusiform cells both the apical and basal dendrites contain GluR2. The question then arises whether GluR2 in basal dendrites is associated with all excitatory synapses or whether it is excluded from auditory nerve synapses, making possible the rapid kinetics of mEPSCs observed in some fusiform cells. This issue could not be resolved in the present experiments, which probed for the presence of GluR2 with PhTX, nor was it resolved in immunohistochemical studies (Rubio and Wenthold, 1997). With the possible exception of fusiform cells, therefore, all experimental evidence is consistent with the conclusion that GluR4 is present and that GluR2 is absent from auditory nerve synapses.
mEPSCs are filtered most in cells that get input from parallel fibers through dendritic spines
Plots of rise times against the decay time constants provided evidence of dendritic filtering of mEPSCs in T-stellate, tuberculoventral, fusiform, and cartwheel cells. This result is consistent with the observation that these cells receive excitatory input on their dendrites (Mugnaini et al., 1980; Cant, 1981; Wouterlood and Mugnaini, 1984; Wickesberg and Oertel, 1988; Smith and Rhode, 1989). However, whereas T-stellate and tuberculoventral cells showed evidence for the filtering of events, most mEPSCs were very rapid. The pattern of auditory nerve inputs to the tuberculoventral cell is unknown; inputs to T-stellate cells may be mainly proximal (Smith and Rhode, 1989). Interestingly, octopus cells have long, broad dendrites but showed little evidence for filtering. It is possible that the cells are electrically compact.
mEPSCs in fusiform and cartwheel cells revealed more dendritic filtering than T-stellate and tuberculoventral cells although the length of their dendrites is similar (see Fig. 7) (Oertel and Wu, 1989;Zhang and Oertel, 1993a, 1994). A major difference is that both cartwheel and fusiform cells get excitatory input from parallel fibers through dendritic spines, which may cause the greater attenuation of synaptic currents seen at the cell body (Segev and Rall, 1998). This attenuation may underlie their diminished ability to encode timing information in response to auditory stimuli (Rhode et al., 1983).
The result that plots of rise times against amplitudes did not indicate the presence of dendritic filtering in any of the cells is probably a consequence of the variability of mEPSC amplitude that generally is observed in the CNS (Bekkers and Stevens, 1994). This variability can obscure any systematic changes in amplitude as a function of dendritic filtering.
Frequency of mEPSCs
The frequency of mEPSCs was between seven and 20 times higher in octopus cells than in other cell types. The frequency is correlated approximately with the number of auditory nerve fibers that innervate cells. Bushy cells and T-stellate cells in the mouse receive relatively few inputs, approximately four to seven (Oertel, 1985; Ferragamo et al., 1998). The dendrites of tuberculoventral and the basal dendrites of fusiform cells are aligned within isofrequency laminae and probably receive input from a limited number of auditory nerve fibers, but estimates of the numbers of inputs have not been made (Oertel and Wu, 1989; Zhang and Oertel, 1993b, 1994). Octopus cells, in contrast, receive input from many auditory nerve fibers, probably >50 (Golding et al., 1995). Estimates of the relative numbers of release sites have not been made in these cells.
The correlation of the frequency of spontaneous mEPSCs with number inputs seems to be limited to auditory nerve fibers. Apical dendrites of fusiform and cartwheel cells receive numerous inputs from the parallel fibers (Mugnaini et al., 1980; Wouterlood and Mugnaini, 1984), yet a high frequency of mEPSCs was not observed in these cells. It is possible that these synapses have a lower probability of transmitter release.
Functional relevance
The difference in the kinetics of the mEPSCs between the cells that are the targets of the auditory nerve and those that have the parallel fibers as a source of excitation parallels the ability to encode timing in responses to sound in vivo. Bushy, octopus, T-stellate, and tuberculoventral cells (which probably correspond to vertical cells in the cat) are characterized by their ability to encode timing information (Rhode et al., 1983; Rhode and Smith, 1986; Smith and Rhode, 1989; Joris et al., 1994; Joris and Yin, 1998; Rhode, 1999). Fusiform and cartwheel cells preserve neither the fine structure nor the timing of the onset of sounds in vivo (Rhode et al., 1983; Smith and Rhode, 1985; Parham and Kim, 1995; Ding and Voigt, 1997).
Footnotes
This work was supported by National Institutes of Health Grants DC-17590 and DC-02004. We thank Inge Siggelkow, Joan Meister, and Jo Ann Ekleberry for histologically processing mini pieces of tissue; Ed Bartlett and Josh Lawrence for their thoughtful comments; and Matt Banks for the use of his event detection program and many helpful discussions. Additionally, we thank the two reviewers whose suggestions greatly improved this manuscript.
Correspondence should be addressed to Dr. Donata Oertel, Department of Physiology, University of Wisconsin, Medical School, 1300 University Avenue, Madison, WI 53706.
REFERENCES
- 1.Bähring R, Mayer ML. An analysis of philanthotoxin block for recombinant rat GluR6(Q) glutamate receptor channels. J Physiol (Lond) 1998;509:635–650. doi: 10.1111/j.1469-7793.1998.635bm.x. [DOI] [PMC free article] [PubMed] [Google Scholar]
- 2.Bekkers JM, Stevens CF. The nature of quantal transmission at central excitatory synapses [review]. Adv Second Messenger Phosphoprotein Res. 1994;29:261–273. doi: 10.1016/s1040-7952(06)80020-0. [DOI] [PubMed] [Google Scholar]
- 3.Brawer JR, Morest DK, Kane EC. The neuronal architecture of the cochlear nucleus of the cat. J Comp Neurol. 1974;155:251–300. doi: 10.1002/cne.901550302. [DOI] [PubMed] [Google Scholar]
- 4.Cant NB. The fine structure of two types of stellate cells in the anterior division of the anteroventral cochlear nucleus of the cat. Neuroscience. 1981;6:2643–2655. doi: 10.1016/0306-4522(81)90109-3. [DOI] [PubMed] [Google Scholar]
- 5.Davis KA, Young ED. Granule cell activation of complex-spiking neurons in dorsal cochlear nucleus. J Neurosci. 1997;17:6798–6806. doi: 10.1523/JNEUROSCI.17-17-06798.1997. [DOI] [PMC free article] [PubMed] [Google Scholar]
- 6.Ding J, Voigt HF. Intracellular response properties of units in the dorsal cochlear nucleus of unanesthetized decerebrate gerbil. J Neurophysiol. 1997;77:2549–2572. doi: 10.1152/jn.1997.77.5.2549. [DOI] [PubMed] [Google Scholar]
- 7.Ferragamo MJ, Golding NL, Oertel D. Synaptic inputs to stellate cells in the ventral cochlear nucleus. J Neurophysiol. 1998;79:51–63. doi: 10.1152/jn.1998.79.1.51. [DOI] [PubMed] [Google Scholar]
- 8.Geiger JR, Melcher T, Koh DS, Sakmann B, Seeburg PH, Jonas P, Monyer H. Relative abundance of subunit mRNAs determines gating and Ca2+ permeability of AMPA receptors in principal neurons and interneurons in rat CNS. Neuron. 1995;15:193–204. doi: 10.1016/0896-6273(95)90076-4. [DOI] [PubMed] [Google Scholar]
- 9.Godfrey DA, Kiang NY, Norris BE. Single unit activity in the posteroventral cochlear nucleus of the cat. J Comp Neurol. 1975;162:247–268. doi: 10.1002/cne.901620206. [DOI] [PubMed] [Google Scholar]
- 10.Golding NL, Robertson D, Oertel D. Recordings from slices indicate that octopus cells of the cochlear nucleus detect coincident firing of auditory nerve fibers with temporal precision. J Neurosci. 1995;15:3138–3153. doi: 10.1523/JNEUROSCI.15-04-03138.1995. [DOI] [PMC free article] [PubMed] [Google Scholar]
- 11.Hollmann M, Hartley M, Heinemann S. Ca2+ permeability of KA–AMPA-gated glutamate receptor channels depends on subunit composition. Science. 1991;252:851–853. doi: 10.1126/science.1709304. [DOI] [PubMed] [Google Scholar]
- 12.Hunter C, Petralia RS, Vu T, Wenthold RJ. Expression of AMPA-selective glutamate receptor subunits in morphologically defined neurons of the mammalian cochlear nucleus. J Neurosci. 1993;13:1932–1946. doi: 10.1523/JNEUROSCI.13-05-01932.1993. [DOI] [PMC free article] [PubMed] [Google Scholar]
- 13.Isaacson JS, Walmsley B. Receptors underlying excitatory synaptic transmission in slices of the rat anteroventral cochlear nucleus. J Neurophysiol. 1995;73:964–973. doi: 10.1152/jn.1995.73.3.964. [DOI] [PubMed] [Google Scholar]
- 14.Isaacson JS, Walmsley B. Amplitude and time course of spontaneous and evoked excitatory postsynaptic currents in bushy cells of the anteroventral cochlear nucleus. J Neurophysiol. 1996;76:1566–1571. doi: 10.1152/jn.1996.76.3.1566. [DOI] [PubMed] [Google Scholar]
- 15.Joris PX, Yin TCT. Envelope coding in the lateral superior olive. III. Comparison with afferent pathways. J Neurophysiol. 1998;79:253–269. doi: 10.1152/jn.1998.79.1.253. [DOI] [PubMed] [Google Scholar]
- 16.Joris PX, Carney LH, Smith PH, Yin TC. Enhancement of neural synchronization in the anteroventral cochlear nucleus. I. Responses to tones at the characteristic frequency. J Neurophysiol. 1994;71:1022–1036. doi: 10.1152/jn.1994.71.3.1022. [DOI] [PubMed] [Google Scholar]
- 17.Karst H, Joels M, Wadman WJ, Piek T. Philanthotoxin inhibits Ca2+ currents in rat hippocampal CA1 neurons. Eur J Pharmacol. 1994;270:357–360. doi: 10.1016/0926-6917(94)90012-4. [DOI] [PubMed] [Google Scholar]
- 18.Kolston J, Osen KK, Hackney CM, Ottersen OP, Storm-Mathisen J. An atlas of glycine- and GABA-like immunoreactivity and colocalization in the cochlear nuclear complex of the guinea pig. Anat Embryol (Berl) 1992;186:443–465. doi: 10.1007/BF00185459. [DOI] [PubMed] [Google Scholar]
- 19.Manis PB, Spirou GA, Wright DD, Paydar S, Ryugo DK. Physiology and morphology of complex spiking neurons in the guinea pig dorsal cochlear nucleus. J Comp Neurol. 1994;348:261–276. doi: 10.1002/cne.903480208. [DOI] [PubMed] [Google Scholar]
- 20.Mosbacher J, Schoepfer R, Monyer H, Burnashev N, Seeburg PH, Ruppersberg JP. A molecular determinant for submillisecond desensitization in glutamate receptors. Science. 1994;266:1059–1062. doi: 10.1126/science.7973663. [DOI] [PubMed] [Google Scholar]
- 21.Mugnaini E, Warr WB, Osen KK. Distribution and light microscopic features of granule cells in the cochlear nuclei of cat, rat, and mouse. J Comp Neurol. 1980;191:581–606. doi: 10.1002/cne.901910406. [DOI] [PubMed] [Google Scholar]
- 22.Oertel D. Synaptic responses and electrical properties of cells in brain slices of the mouse anteroventral cochlear nucleus. J Neurosci. 1983;3:2043–2053. doi: 10.1523/JNEUROSCI.03-10-02043.1983. [DOI] [PMC free article] [PubMed] [Google Scholar]
- 23.Oertel D. Use of brain slices in the study of the auditory system: spatial and temporal summation of synaptic inputs in cells in the anteroventral cochlear nucleus of the mouse. J Acoust Soc Am. 1985;78:328–333. doi: 10.1121/1.392494. [DOI] [PubMed] [Google Scholar]
- 24.Oertel D. Encoding of timing in the brain stem auditory nuclei of vertebrates [review]. Neuron. 1997;19:959–962. doi: 10.1016/s0896-6273(00)80388-8. [DOI] [PubMed] [Google Scholar]
- 25.Oertel D. The role of timing in the brain stem auditory nuclei of vertebrates. Annu Rev Physiol. 1999;61:497–519. doi: 10.1146/annurev.physiol.61.1.497. [DOI] [PubMed] [Google Scholar]
- 26.Oertel D, Wu SH. Morphology and physiology of cells in slice preparations of the dorsal cochlear nucleus of mice. J Comp Neurol. 1989;283:228–247. doi: 10.1002/cne.902830206. [DOI] [PubMed] [Google Scholar]
- 27.Oertel D, Wu SH, Garb MW, Dizack C. Morphology and physiology of cells in slice preparations of the posteroventral cochlear nucleus of mice. J Comp Neurol. 1990;295:136–154. doi: 10.1002/cne.902950112. [DOI] [PubMed] [Google Scholar]
- 28.Osen KK. The intrinsic organization of the cochlear nuclei. Acta Otolaryngol (Stockh) 1969;67:352–359. doi: 10.3109/00016486909125462. [DOI] [PubMed] [Google Scholar]
- 29.Otis TS, Raman IM, Trussell LO. AMPA receptors with high Ca2+ permeability mediate synaptic transmission in the avian auditory pathway. J Physiol (Lond) 1995;482:309–315. doi: 10.1113/jphysiol.1995.sp020519. [DOI] [PMC free article] [PubMed] [Google Scholar]
- 30.Parham K, Kim DO. Spontaneous and sound-evoked discharge characteristics of complex-spiking neurons in the dorsal cochlear nucleus of the unanesthetized decerebrate cat. J Neurophysiol. 1995;73:550–561. doi: 10.1152/jn.1995.73.2.550. [DOI] [PubMed] [Google Scholar]
- 31.Raman IM, Trussell LO. The kinetics of the response to glutamate and kainate in neurons of the avian cochlear nucleus. Neuron. 1992;9:173–186. doi: 10.1016/0896-6273(92)90232-3. [DOI] [PubMed] [Google Scholar]
- 32.Raman IM, Zhang S, Trussell LO. Pathway-specific variants of AMPA receptors and their contribution to neuronal signaling. J Neurosci. 1994;14:4998–5010. doi: 10.1523/JNEUROSCI.14-08-04998.1994. [DOI] [PMC free article] [PubMed] [Google Scholar]
- 33.Rhode WS. Vertical cell responses to sound in cat dorsal cochlear nucleus. J Neurophysiol. 1999;82:1019–1032. doi: 10.1152/jn.1999.82.2.1019. [DOI] [PubMed] [Google Scholar]
- 34.Rhode WS, Smith PH. Encoding timing and intensity in the ventral cochlear nucleus of the cat. J Neurophysiol. 1986;56:261–286. doi: 10.1152/jn.1986.56.2.261. [DOI] [PubMed] [Google Scholar]
- 35.Rhode WS, Oertel D, Smith PH. Physiological response properties of cells labeled intracellularly with horseradish peroxidase in cat ventral cochlear nucleus. J Comp Neurol. 1983;213:448–463. doi: 10.1002/cne.902130408. [DOI] [PubMed] [Google Scholar]
- 36.Rubio ME, Wenthold RJ. Glutamate receptors are selectively targeted to postsynaptic sites in neurons. Neuron. 1997;18:939–950. doi: 10.1016/s0896-6273(00)80333-5. [DOI] [PubMed] [Google Scholar]
- 37.Segev I, Rall W. Excitable dendrites and spines: earlier theoretical insights elucidate recent direct observations. Trends Neurosci. 1998;21:453–460. doi: 10.1016/s0166-2236(98)01327-7. [DOI] [PubMed] [Google Scholar]
- 38.Smith PH, Rhode WS. Electron microscopic features of physiologically characterized, HRP-labeled fusiform cells in the cat dorsal cochlear nucleus. J Comp Neurol. 1985;237:127–143. doi: 10.1002/cne.902370110. [DOI] [PubMed] [Google Scholar]
- 39.Smith PH, Rhode WS. Structural and functional properties distinguish two types of multipolar cells in the ventral cochlear nucleus. J Comp Neurol. 1989;282:595–616. doi: 10.1002/cne.902820410. [DOI] [PubMed] [Google Scholar]
- 40.Sommer B, Keinanen K, Verdoorn TA, Wisden W, Burnashev N, Herb A, Kohler M, Takagi T, Sakmann B, Seeburg PH. Flip and flop: a cell-specific functional switch in glutamate-operated channels of the CNS. Science. 1990;249:1580–1585. doi: 10.1126/science.1699275. [DOI] [PubMed] [Google Scholar]
- 41.Tóth K, McBain CJ. Afferent-specific innervation of two distinct AMPA receptor subtypes on single hippocampal interneurons. Nat Neurosci. 1998;1:572–578. doi: 10.1038/2807. [DOI] [PubMed] [Google Scholar]
- 42.Trussell LO. Cellular mechanisms for preservation of timing in central auditory pathways [review]. Curr Opin Neurobiol. 1997;7:487–492. doi: 10.1016/s0959-4388(97)80027-x. [DOI] [PubMed] [Google Scholar]
- 43.Trussell LO. Synaptic mechanisms for coding timing in auditory neurons. Annu Rev Physiol. 1999;61:477–496. doi: 10.1146/annurev.physiol.61.1.477. [DOI] [PubMed] [Google Scholar]
- 44.Wang YX, Wenthold RJ, Ottersen OP, Petralia RS. Endbulb synapses in the anteroventral cochlear nucleus express a specific subset of AMPA-type glutamate receptor subunits. J Neurosci. 1998;18:1148–1160. doi: 10.1523/JNEUROSCI.18-03-01148.1998. [DOI] [PMC free article] [PubMed] [Google Scholar]
- 45.Washburn MS, Dingledine R. Block of α-amino-3-hydroxy-5-methyl-4-isoxazolepropionic acid (AMPA) receptors by polyamines and polyamine toxins. J Pharmacol Exp Ther. 1996;278:669–678. [PubMed] [Google Scholar]
- 46.Wickesberg RE, Oertel D. Tonotopic projection from the dorsal to the anteroventral cochlear nucleus of mice. J Comp Neurol. 1988;268:389–399. doi: 10.1002/cne.902680308. [DOI] [PubMed] [Google Scholar]
- 47.Wickesberg RE, Whitlon D, Oertel D. Tuberculoventral neurons project to the multipolar cell area but not to the octopus cell area of the posteroventral cochlear nucleus. J Comp Neurol. 1991;313:457–468. doi: 10.1002/cne.903130306. [DOI] [PubMed] [Google Scholar]
- 48.Wickesberg RE, Whitlon D, Oertel D. In vitro modulation of somatic glycine-like immunoreactivity in presumed glycinergic neurons. J Comp Neurol. 1994;339:311–327. doi: 10.1002/cne.903390302. [DOI] [PubMed] [Google Scholar]
- 49.Wouterlood FG, Mugnaini E. Cartwheel neurons of the dorsal cochlear nucleus: a Golgi-electron microscopic study in rat. J Comp Neurol. 1984;227:136–157. doi: 10.1002/cne.902270114. [DOI] [PubMed] [Google Scholar]
- 50.Wu SH, Oertel D. Intracellular injection with horseradish peroxidase of physiologically characterized stellate and bushy cells in slices of mouse anteroventral cochlear nucleus. J Neurosci. 1984;4:1577–1588. doi: 10.1523/JNEUROSCI.04-06-01577.1984. [DOI] [PMC free article] [PubMed] [Google Scholar]
- 51.Zhang S, Oertel D. Cartwheel and superficial stellate cells of the dorsal cochlear nucleus of mice: intracellular recordings in slices. J Neurophysiol. 1993a;69:1384–1397. doi: 10.1152/jn.1993.69.5.1384. [DOI] [PubMed] [Google Scholar]
- 52.Zhang S, Oertel D. Tuberculoventral cells of the dorsal cochlear nucleus of mice: intracellular recordings in slices. J Neurophysiol. 1993b;69:1409–1421. doi: 10.1152/jn.1993.69.5.1409. [DOI] [PubMed] [Google Scholar]
- 53.Zhang S, Oertel D. Neuronal circuits associated with the output of the dorsal cochlear nucleus through fusiform cells. J Neurophysiol. 1994;71:914–930. doi: 10.1152/jn.1994.71.3.914. [DOI] [PubMed] [Google Scholar]
- 54.Zhang S, Trussell LO. Voltage clamp analysis of excitatory synaptic transmission in the avian nucleus magnocellularis. J Physiol (Lond) 1994a;480:123–136. doi: 10.1113/jphysiol.1994.sp020346. [DOI] [PMC free article] [PubMed] [Google Scholar]
- 55.Zhang S, Trussell LO. A characterization of excitatory postsynaptic potentials in the avian nucleus magnocellularis. J Neurophysiol. 1994b;72:705–718. doi: 10.1152/jn.1994.72.2.705. [DOI] [PubMed] [Google Scholar]


