

Abstract
The POU-IV or Brn-3 class of transcription factors exhibit conserved structure, DNA-binding properties, and expression in specific subclasses of neurons across widely diverged species. In the mouse CNS, Brn-3.0 expression characterizes specific neurons from neurogenesis through the life of the cell. This irreversible activation of expression suggests positive autoregulation. To search for cis-acting elements that could mediate autoregulation we used a novel method, complex stability screening, which we applied to rapidly identify functional Brn-3.0 recognition sites within a large genomic region encompassing the mousebrn-3.0 locus. This method is based on the observation that the kinetic stability of Brn-3.0 complexes with specific DNA sequences, as measured by their dissociation half-lives, is highly correlated with the ability of those sequences to mediate transcriptional activation by Brn-3.0. The principal Brn-3.0 autoregulatory region lies ∼5 kb upstream from the Brn-3.0 transcription start site and contains multiple Brn-3.0-binding sites that strongly resemble the optimal binding site for this protein class. This region also mediates transactivation by the closely related protein Brn-3.2, suggesting a regulatory cascade of POU proteins in specific neurons in which Brn-3.2 expression precedes Brn-3.0.
Keywords: Brn-3, POU-domain, autoregulation, transcription factor, homeodomain, dissociation kinetics, retina, habenula, inferior olive, tectum
The development of the vertebrate brain requires the differentiation of a large number of specific types of neurons from a relatively undifferentiated cell layer, the neural plate. Many developing neurons and their precursors express characteristic DNA-binding transcription factors. The expression domains of these factors overlap in unique combinations in specific regions of the neural tube and in groups of differentiating neurons, suggesting that development of each neuronal type is guided by a transcriptional code. However, little is known about how these factors act at the molecular level to determine and maintain specific neuronal phenotypes.
Many of the transcription factors that are expressed in specific groups of neurons belong to the POU, Pax, and LIM families of variant homeodomain proteins. Some of these factors appear early in development in regions of the dividing neuroepithelium, whereas others are restricted to terminally differentiating neurons. Factors of the POU-IV or Brn-3 class are expressed as specific sets of CNS and peripheral sensory neurons exit the cell cycle (Fedtsova and Turner, 1995;Artinger et al., 1998), and they have been shown to be necessary for the normal development of the retina, auditory system, cranial sensory ganglia, and certain CNS nuclei (Ryan and Rosenfeld, 1997).
The expression patterns of most of the neuron-specific transcription factors have been characterized only in the developing brain, and in many cases little information is available about their expression in the adult nervous system. Here we demonstrate that expression of the POU-domain factor Brn-3.0 is permanently activated in development, and characterizes specific neuronal groups throughout the life of the organism. This expression pattern suggests that Brn-3.0 positively regulates and maintains its own expression.
POU proteins have been shown to form remarkably stable complexes with their highest affinity recognition sequences, exhibiting dissociation half-lives of 10–100 min under conditions routinely used to measure protein–DNA binding (Gruber et al., 1997; Rhee et al., 1998). Using a series of synthetic variants of the optimal Brn-3.0 recognition sequence, we have demonstrated here that the kinetic stability of a Brn-3.0 complex with a particular DNA site is highly correlated with the transcriptional activation of reporters containing that site by Brn-3.0. Because Brn-3.0 forms a highly stable complex with its functional recognition sites, we have been able to use a novel method, complex stability screening (CoSS), to rapidly search the genomic region encompassing the mouse brn-3.0 locus for potential autoregulatory regions. This method has revealed two clusters of Brn-3.0 recognition sites residing ∼5 and 10 kb upstream from the Brn-3.0 transcriptional start site. These sites closely resemble the optimal POU-IV class recognition sequence, and the proximal cluster is a strong facilitator of Brn-3.0 transcriptional activation. Thus, these regions are likely to mediate Brn-3.0 autoregulation and regulation of Brn-3.0 expression by the closely related POU-protein Brn-3.2 in the developing and mature nervous system.
MATERIALS AND METHODS
Immunohistochemistry. For the detection of Brn-3.0 protein by immunohistochemistry, mouse embryos and neonatal brains were immersion-fixed in 4% paraformaldehyde in PBS, and adult mouse brains were treated with the same fixative by transcardiac perfusion. Aged mouse brains were obtained from retired breeder female mice at 9 months of age. The rabbit polyclonal anti-Brn-3.0 antibody and immunohistochemical methods used here have been previously described (Fedtsova and Turner, 1995). A rabbit polyclonal anti-Brn-3.2 antibody was raised to a bacterially expressed protein containing the region immediately N-terminal to the Brn-3.2 POU domain (Turner et al., 1994). These Brn-3.2 antibodies did not cross-react with Brn-3.0, and were antigen–affinity-purified before use in immunofluorescence (Fedtsova and Turner, 1995). Anti-proliferating cell nuclear antigen (PCNA) antibodies were obtained from Novocastra.
Electrophoretic mobility shift assays. DNA probes derived from plasmid constructs were isolated in agarose gels, dephosphorylated with alkaline phosphatase, and radiolabeled with [γ32P]ATP and polynucleotide kinase. DNA probes derived from synthetic oligonucleotides were radiolabeled to a similar specific activity using the same method. Each electrophoretic mobility shift assay (EMSA) binding reaction consisted of a 20 μl total volume containing (in mm): 20 Tris, pH 8.0, 100 KCl, 5 MgCl2, and 0.2 EDTA, and 100 μg/ml poly(dI-dC), 100 μg/ml BSA, 10% glycerol, 1 mm DTT, 2.5–5 × 10⁻¹⁴ mol of radiolabeled DNA, and 5–10 × 10−15 mol of active Brn-3.0 protein (DNA excess). For cases in which the glutathione S-transferase (GST)–Brn-3.0 POU domain fusion protein was cleaved with thrombin before use, the EMSA cocktail contained 25 mm KCl. Electrophoresis was performed in 6% polyacrylamide gels for oligonucleotide probes, and 4–5% polyacrylamide for longer plasmid-derived sequences.
Dissociation rates for Brn-3.0 complexes with various DNA sequences were determined by EMSA. In these assays Brn-3.0 protein was incubated with radiolabeled DNA in the EMSA cocktail for 30 min at 20°C. Then, at designated times before the start of electrophoresis, 4 × 10⁻¹² mol of an unlabeled high-affinity competitor oligonucleotide was added to the reaction mix. The high-affinity competitor oligonucleotides were GATCTCTCCTGCATAATTAATTACCCCCGGAT and GATCCGGGGGTAATTAATTATGCAGGAGAGAT. When annealed, these produce a previously described consensus Brn-3-binding site ATAATTAAT (b3s1;Gruber et al., 1997). The amount of competitor oligonucleotide added was at least 200-fold in excess of the total Brn-3.0 protein in the assay. The Brn-3.0–DNA complex remaining at various times after the addition of competitor oligonucleotide was quantified on dried gels using a PhosphorImager (ImageQuant; Molecular Dynamics, Sunnyvale, CA), and the half-life of the complex was determined based on first-order kinetics.
Except where noted, the dissociation rate data given here are for complexes containing a GST-Brn-3.0 POU-domain fusion protein. As previously noted (Rhee et al., 1998), linkage to the GST moiety results in an ∼10-fold stabilization of Brn-3.0-binding relative to Brn-3.0 preparations in which the GST and DNA-binding moieties are separated by thrombin cleavage. A very similar stabilization of the Brn-3.0–DNA complex can also be achieved for the isolated POU-domain by reducing the ionic strength of the binding buffer from 0.1 m KCl to 0.025 m KCl.
Complex stability screening using paramagnetic beads. To identify stable Brn-3.0–DNA complexes we adapted a separation strategy using paramagnetic beads previously used to isolate POU-domain complexes with random oligonucleotides (Gruber et al., 1997). In this method, the target genomic DNA was digested to an average size of 200–300 bp with one or more of the restriction enzymesHinPI, MspI and Aci1, all of which leave ClaI-compatible CG overhangs. The fragments were then dephosphorylated with alkaline phosphatase and 32P end-labeled with [γ32P]ATP and polynucleotide kinase.
In a typical selection reaction, a DNA digest representing 1 × 10⁻¹² mol of the parent plasmid was incubated with 0.5 × 10⁻¹² mol of a GST–Brn-3.0 fusion protein for 30 min at 20°C. Binding was performed in the EMSA buffer described above, except the dI/dC was omitted. As previously described, the fusion protein contains a FLAG epitope between the GST and POU moieties (Gruber et al., 1997). After the binding reaction, 0.4 × 10⁻⁶ gm of mouse monoclonal anti-flag antibody was added (IBI; Eastman Kodak, Rochester, NY), followed by a second 30 min incubation. Finally, paramagnetic beads linked to sheep anti-mouse IgG (Dynabeads M-280; Dynal, Great Neck, NY) were added. For each reaction, 16 μl of the supplied bead slurry was washed in binding buffer and pelleted in a magnetic stand (Stratagene, La Jolla, CA) before addition of the binding mixture. For complex stability selections, 1 × 10⁻¹¹ mol of competitor oligonucleotide (see the kinetic EMSA assays described above) was added at the same time as the paramagnetic beads. The bead-binding reaction, with or without competitor, was incubated 30 min at 20°C, with gentle agitation every 2 min, followed by magnetic separation and two rapid washes in the binding buffer.
After the washes, the bound DNA fragments were removed from the matrix with 0.5% SDS in TE buffer at 65°C, extracted with phenol chloroform, precipitated with ethanol, and analyzed by electrophoresis in 6% acrylamide/urea (sequencing) gels. For ligation of selected fragments into the ClaI site of pBKS, the binding reaction was scaled-up fivefold, and nonradioactive DNA fragments were used.
Transfection assays. Transient transfections were performed in CV-1 epithelial cells by the calcium phosphate method as previously described (Gruber et al., 1997), or with Effectene transfection reagent (Qiagen, Hilden, Germany) according to the manufacturer’s protocol. Luciferase reporter constructs for transfection assays contained three copies of a Brn-3 recognition site or one copy of a native genomic regulatory domain linked to a minimal promoter derived from the rat prolactin gene in the vector pGL-2. The oligonucleotide sequences used to make the reporter construct for the consensus Brn-3.0 recognition element were GATCTCTCCTGCATAATTAATTACGCCCG and GATCCGGGCGTAATTAATTATGCAGGAGA. In reporter constructs containing variants of the consensus recognition element, the sequence in italics was replaced with the sequences shown in Figure 2. Reporter constructs for naturally occurring Brn-3 recognition elements were made using the oligonucleotide sequences that appear in Figure 4. For each transfection experiment, the results shown represent the mean of triplicate assays in a single experiment, and very similar results were obtained in at least three independent experiments.
Fig. 2.

Transcriptional activation by Brn-3.0 is correlated with the kinetic stability of the Brn-3.0–DNA complex. Transcriptional activation by Brn-3.0 was assessed in CV-1 cells as described in Materials and Methods. Three copies of a Brn-3 consensus recognition sequence (ATAATTAAT) or variants of that sequence were linked to a minimal promoter (-36prl) derived from the rat prolactin gene and to a luciferase reporter in the plasmid pGL-2. The reporter plasmids were cotransfected with a plasmid containing the full Brn-3.0 open reading frame in the expression vector pcDNA-amp, or with empty expression vector plasmid. The dissociation half-time (T0.5) for a GST–Brn-3.0 POU-domain fusion protein complex with each site in vitro is shown in the column at right.
Fig. 4.

The structure of the mouse brn-3.0genomic locus and location of stable Brn-3.0-binding sites. Restriction mapping, Southern hybridization, and automated sequencing were used to map the stable Brn-3.0-binding sites identified by complex stability screening relative to the Brn-3.0 transcription start site. The sequences shown were then used to make reporter constructs for cotransfection assays with Brn-3 expression plasmids (Figs. 6,8). Reporters contained one copy of the entire distal and proximal sequences or three copies of the discrete regulatory elements that appear in bold. As shown in the site alignment, both the proximal and distal regions contain sequences that strongly resemble the consensus Brn-3 recognition sequence (cons) previously obtained by random oligonucleotide selection (Gruber et al., 1997). The GenBank accession numbers for the proximal and distal sites are AF149843 and AF149844, respectively.
RESULTS
Brn-3.0 expression is permanently activated throughout development and aging
Brn-3.0 expression characterizes the development of highly specific sets of neurons in the CNS and PNS. In the CNS, Brn-3.0 expression is exclusively postmitotic, whereas in the PNS, the onset of Brn-3.0 expression slightly precedes the exit of developing sensory neurons from the cell cycle (Fedtsova and Turner, 1995). Figure1 shows the temporal pattern of Brn-3.0 expression through development and aging in representative CNS loci in the mouse. In the habenula (Fig. 1A–C), Brn-3.0 expression is activated at approximately embryonic day 12 (E12), as the first habenular neurons migrate away from their neuroepithelium of origin, differentiate, and soon give rise to the fibers of the interpeduncular tract. The habenula of the postnatal day 1 (P1) mouse resembles that of the adult, in which Brn-3.0 expression characterizes nearly all of the neurons of the medial habenula and a significant number of cells in the lateral habenula. In the aged (9 months) mouse, the pattern established in development remains qualitatively unchanged.
Fig. 1.

Brn-3.0 expression is irreversibly activated in brain development. Three of the main regions of Brn-3.0 expression in the CNS were examined at E12.5 (A, D, G), P1 (B, E, H), and in mature animals aged 9 months (C, F, I). In all views, the expression of Brn-3.0 was examined by HRP immunohistochemistry (Materials and Methods). ViewsA–C show the medial habenula and associated structures in coronal section. ViewsD–F show the midbrain tectum (E12.5 sagittal, others coronal). Views G–Ishow the inferior olive and medulla (E12.5 sagittal, others coronal).Aq, Aqueduct; Hb, habenula;IC, inferior colliculus; isth, isthmus;LHb, lateral habenula; MHb, medial habenula; ne, neuroepithelium; pcne, precerebellar neuroepithelium; SC, superior colliculus;IO, inferior olive. The arrow inA indicates the growing fibers of the habenulopeduncular tract; arrows in G indicate the path of migrating olivary precursors; small arrows inH indicate examples of the Brn-3.0-expressing cells of the hindbrain reticular formation. Scale bars, 50 μm.
Expression of Brn-3.0 can also be detected as early as E9 in the mouse tectum, where this factor characterizes neurons that are among the first to differentiate in any CNS location (Fedtsova and Turner, 1995). By E12.5 (Fig. 1D), postmitotic Brn-3.0 neurons form an extensive layer from the pretectum to the inferior colliculus. The somewhat region- and lamina-specific pattern of Brn-3.0 expression is fully established in the tectum by P1 and is also maintained in the aged mouse (Fig. 1E,F). In the hindbrain, Brn-3.0 expression characterizes the inferior olivary nucleus, scattered neurons of the hindbrain reticular formation, and the nucleus ambiguus. Neurons of the inferior olive originate in the precerebellar neuroepithelium and migrate toward the ventral aspect of the hindbrain to form this nucleus. At E12.5, Brn-3.0-expressing olivary neurons can be observed adjacent to their neuroepithelium of origin and also in the region of the presumptive inferior olive (Fig.1G). By P1, Brn-3.0 expression clearly demarcates the lobular structure of the inferior olive, and this pattern of expression is maintained throughout life (Fig.1H,I).
In the development of the spinal cord and the midbrain, Brn-3.0-expressing neurons differentiate in regional zones established by neuroepithelial patterning genes such as Pax-3 and sonic hedgehog (SHH), and are repatterned by changes in these signals (Fedtsova and Turner, 1995, 1997). Yet, in the mature spinal cord and midbrain, the Brn-3.0-positive neurons intermingle closely with later-developing Brn-3.0-negative cells, indicating that regional signals no longer control Brn-3.0 expression. This observation, together with the permanence of Brn-3.0 expression, suggest that control of Brn-3.0 expression switches from an exogenous signal to a cell-autonomous mechanism during embryonic development.
Transcriptional activation by Brn-3.0 is highly correlated with the temporal stability of the Brn-3.0–DNA complex
Previously we have shown that a GST–Brn-3.0 POU domain fusion protein dissociates very slowly from its highest affinity-binding site (b3s1), with a dissociation half-life of ∼60 min at room temperature. We have also shown that reporter constructs containing three of these optimal recognition sites upstream of a luciferase reporter gene will activate transcription ∼35-fold in the presence of Brn-3.0 (Gruber et al., 1997). In Figure 2, we have extended this analysis to a range of variant Brn-3.0-binding sites in which the optimal Brn-3.0 recognition site (ATAATTAAT) has been altered to contain G/C base pairs at positions that have different effects on the stability of Brn-3.0-binding to DNA. In this analysis, the stability of the Brn-3.0–DNA complex is closely correlated with transcriptional activation of reporter constructs containing the variant sites. The only exception to this relationship among the sites tested is the target sequence ATGATTCAT, which exhibits much greater transcriptional activation than predicted based on the stability of its interaction with Brn-3.0. However, this reporter also exhibits high transcriptional activity in the absence of cotransfected Brn-3.0 plasmid and is clearly activated by endogenous factors in the transfected cells.
The affinity of Brn-3.0 for its recognition sites can be expressed as the equilibrium dissociation constant of the Brn-3.0-oligonucleotide complex, which is in turn determined by the rate constants for the association and dissociation of the complex (Gruber et al., 1997). Because the rate of complex dissociation is a major determinant of the relative affinity of Brn-3.0 for its recognition sites, it is not surprising that complex stability is highly correlated with transactivation potential. However, unlike the equilibrium-binding affinity, the kinetic stability of the Brn-3.0–DNA complexes can be more readily adapted to identify and isolate functional Brn-3.0 recognition sites from a pool of much more abundant but lower affinity sequences.
Complex stability provides a rapid screening method for Brn-3.0 recognition sites within a large region of genomic DNA
Because the “locked-in” temporal pattern of Brn-3.0 expression suggests positive autoregulation, we decided to use complex stability to screen the mouse brn-3.0 genomic locus for functional Brn-3.0-binding sites. The regulatory regions of the brn-3.0gene necessary to produce correct temporal and spatial expression of this factor have not been defined. For this reason, we chose to first examine a large genomic region containing the brn-3.0 gene locus for stable sites of Brn-3.0 binding. A P1 genomic clone containing ∼80 kb of genomic sequence was digested with restriction endonucleases to an average fragment size of 200–300 bp. The fragments were then radiolabeled and incubated with GST–Brn-3.0 POU-domain fusion protein for 30 min. After the binding reaction, the Brn-3.0–DNA complexes were incubated an additional 30 min with or without an excess of an oligonucleotide containing a high-affinity Brn-3.0 recognition sequence. Finally, the Brn-3.0–DNA complexes were isolated using paramagnetic beads (Materials and Methods), and the bound fragments were resolved on polyacrylamide gels or ligated into a cloning vector for further analysis.
Figure 3A shows the complex stability screening of the genomic region containing the Brn-3.0 locus. The restriction digest (lane D) of the P1 genomic clone shows too many fragments to be resolved into individual bands by electrophoresis. Isolation of the Brn-3.0–DNA complexes from the P1 digest (lane S) yields numerous fragments containing specific Brn-3.0-binding sites. However, incubation with a high-affinity competitor oligonucleotide for 30 min (lane +C) reveals that Brn-3.0 binding to only a limited set of the fragments is kinetically stable. As discussed below, the number of stably bound DNA fragments seen by autoradiography is greater than the number of unique Brn-3.0 recognition sequences because of the variable use of adjacent restriction endonuclease sites.
Fig. 3.

Complex stability screening of the Brn-3.0 genomic locus. A large genomic clone encompassing the Brn-3.0 genomic locus (A), and two subclones of this sequence (B), were digested with restriction enzymesHinPI and Aci1, radiolabeled, and selected using recombinant Brn-3.0 protein linked to paramagnetic beads. DNA fragments were then resolved in a 6% denaturing polyacrylamide gel. A large number of DNA fragments were selected, but only a few remain bound after a 30 min exposure to a specific competitor oligonucleotide, corresponding to sites that are likely to mediate transactivation by Brn-3.0 in vivo.D, Total restriction digest; S, selected digest; S + C, digest selected after 30 min incubation with competitor oligonucleotide. In C, subcloned sequences from B are individually screened for stable binding to Brn-3.0 by complex stability EMSA, which identifies sites with stable enough binding to effectively mediate transcription (see Results). C, Control without Brn-3.0 protein;0, Brn-3.0 EMSA, no competitor; 30, Brn-3.0 EMSA after 30 min exposure to competitor oligonucleotide with consensus Brn-3.0-binding sequence.
To localize the Brn-3.0-binding sites with respect to the Brn-3.0 transcribed sequences we screened two smaller regions within the parent 80 kb genomic clone for stable binding sites. A proximal 6 kb region contains the Brn-3.0 transcriptional start site and ∼6 kb of the 5′ flanking sequence, and a distal 5 kb region contains the contiguous genomic sequence that maps from approximately −6 to −11 kb relative to the start of Brn-3.0 transcription. As shown in Figure3B, several of the fragments containing Brn-3.0-binding sites identified by screening the entire Brn-3.0 locus reside within these regions, and binding to some of these sites is kinetically stable.
The 100–500 bp fragments from the proximal and distal regions that remained bound to Brn-3.0 in the presence of competitor oligonucleotide were ligated into a cloning vector, and the cloned fragments were then screened individually for stable binding in kinetic mobility shift assays (Fig. 3C). Kinetic EMSAs use the stability of Brn-3.0–DNA complexes in the presence of a specific competitor to distinguish sites with high enough affinity to function transcriptionally from weaker sites that can be bound in gelshift and footprinting assays but do not mediate transcriptional effects. Subcloned DNA fragments that showed >50% dissociation of the Brn-3.0–DNA complex within 30 min were discarded, whereas those which showed stable binding were sequenced. One advantage of the kinetic EMSA is that it is not sensitive to the concentration of DNA-binding protein used in the assay. The concentration of the protein may exceed that of the radiolabeled DNA probe and still give accurate results, as long as the competitor oligonucleotide is in large excess and prevents the protein from reassociating with the probe if it dissociates during the time course of the assay.
All of the cloned fragments from the proximal 6 kb region that showed stable Brn-3.0 binding revealed overlapping sequences. This indicates that the multiple electrophoresis bands that appear in the selected digestion product of the proximal region represent use of alternative restriction endonuclease sites within a common genomic region, and that the proximal genomic region contains a single Brn-3-binding site or a closely spaced cluster of sites. Similarly, all of the cloned fragments with stable binding sites obtained from the distal 5 kb region contained overlapping sequences.
Brn-3.0 recognition sites are clustered ∼5 and ∼10 kb upstream of the brn-3.0 transcription start site
Restriction mapping, automated sequencing, and Southern hybridization were used to localize the stable Brn-3.0-binding sites within the brn-3.0 locus. Brn-3.0 transcription is initiated from multiple closely spaced sites lacking a TATA sequence but containing multiple GC-rich elements located ∼300 bp upstream from the Brn-3.0 initiator methionine codon. As shown in Figure4, the proximal Brn-3.0-binding domain resides at ∼5.4–5.6 kb from the start of transcription, and the distal binding site is found at approximately −9 kb.
The distal and proximal Brn-3.0-binding regions contained one and four copies, respectively, of a sequence motif that conforms closely to the optimal Brn-3.0 recognition site previously identified by oligonucleotide selection (Gruber et al., 1997). To confirm that these specific sequences mediate stable Brn-3.0 binding, oligonucleotides were prepared corresponding to the Brn-3.0 recognition motifs designated dist1, prox1, prox2, and prox3 (Fig. 4). Among these elements, the prox3 oligonucleotide exhibits the most stable binding to Brn-3.0, with a dissociation t½ of ∼60 min, whereas the t½ of the dist1 site is ∼30 min. The dissociation times of the other proximal oligonucleotide probes were faster, witht½ < 10 min, but the presence of multiple sites in the proximal cluster suggests that Brn-3.0 interaction with these sites is stabilized by cooperative binding.
To test directly the stoichiometry and stability of Brn-3.0 binding to the distal and proximal autoregulatory regions, complex stability EMSA assays were conducted with genomic fragments encompassing the potential recognition sites within each region. As expected from its sequence, the distal region showed stable binding to a single Brn-3.0 molecule (Fig. 5A).
Fig. 5.

The Brn-3.0 autoregulatory domains contain multiple stable Brn-3-binding sites. Complex stability EMSAs were performed as described in Materials and Methods. A andB show the interaction of a GST-Brn-3.0 POU-domain fusion protein with DNA fragments containing the distal (A) and proximal (B) autoregulatory domains from the Brn-3.0 locus. Lanes are designated by the time in minutes between the addition of a competitor oligonucleotide and the start of electrophoresis. The − lane represents electrophoresis of the complexes without competitor oligonucleotide. In the pre lane the competitor was added before the formation of the Brn-3.0 complex with the radiolabeled probe to demonstrate that the amount of competitor added is in large excess over Brn-3.0 protein. In C, the Brn-3.0 protein used was cleaved with thrombin to remove the GST-moiety, and complex stability EMSAs were conducted with the isolated Brn-3.0 POU-domain. As previously noted (Rhee et al., 1998), dissociation of the Brn-3.0–DNA complex is somewhat faster for the isolated POU domain than for the GST-fusion protein. The legend at rightrepresents the number of Brn-3.0 molecules contained in the Brn-3.0–DNA complexes, where zero denotes the free DNA probe. These results show that the proximal Brn-3.0 autoregulatory region can interact stably with at least six Brn-3.0 monomers, and that complexes containing an even number of Brn-3.0 molecules are highly favored, suggesting cooperative binding in pairs (Rhee et al., 1998). The lane designated −P contains the DNA probe alone.
The presence of the GST moiety has been shown to interfere with POU-domain dimerization on certain classes of sites and also to slow dissociation of Brn-3.0–DNA complexes (Rhee et al., 1998). For this reason EMSAs for the proximal binding region were conducted using Brn-3.0 POU-domain protein with (Fig. 5B) and without (Fig.5C) the GST moiety. For the GST fusion protein, the dissociation half-life of the most stable proximal site was >90 min, and the dissociation of binding to the weaker sites within the proximal region was significantly prolonged relative to the oligonucleotide probes for individual binding sites within this region. DNA complexes with Brn-3.0 protein lacking the GST moiety (Fig. 5C) dissociate somewhat faster, as expected, and also show that as many as six Brn-3.0 monomers may interact with this region. Based on a recent detailed examination of the dimerization properties of the Brn-3 protein class (Rhee et al., 1998), the most likely explanation for this pattern of binding is DNA-dependent cooperative binding by pairs of Brn-3.0 monomers.
The proximal Brn-3.0 autoregulatory locus is a strong mediator of Brn-3.0-activated transcription
The potential Brn-3.0 autoregulatory sites were then tested for their ability to mediate transcriptional activation by Brn-3.0. Transcription assays were performed by cotransfection in CV-1 epithelial cells, which do not express any of the neural POU factors endogenously. The distal and three proximal binding sites were tested individually by linking three copies of each site to a minimal promoter (-36prl) derived from the rat prolactin gene (Fig.6A). Reporters containing the dist1 site exhibited high luciferase expression even in the absence of cotransfected Brn-3.0, indicating activation of this site by endogenous factors. Among the isolated proximal elements, only prox3 showed marked activation by Brn-3.0.
Fig. 6.
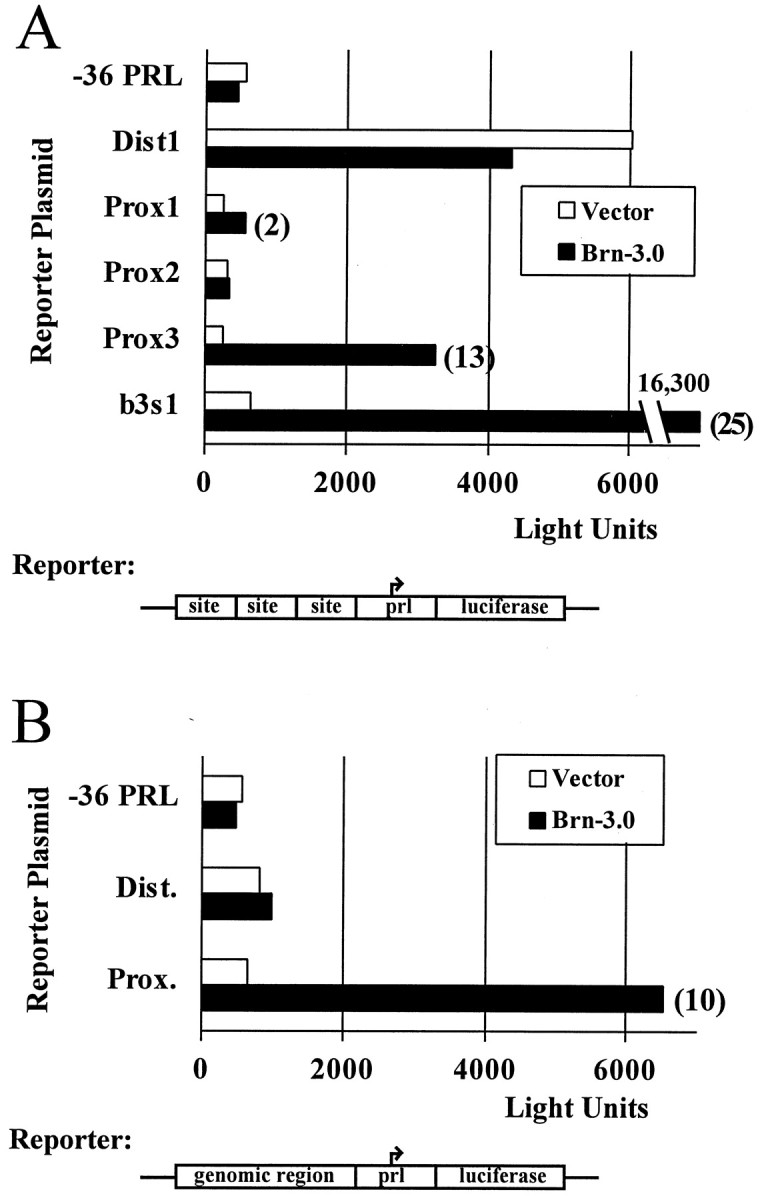
Brn-3.0 activates transcription from its autoregulatory sites in heterologous cells. In A, three copies of the potential Brn-3.0 autoregulatory sequences from the proximal and distal genomic regions, or a Brn-3 consensus recognition site (b3s1), were linked to a luciferase reporter and cotransfected with a Brn-3.0 expression plasmid or an expression vector control plasmid. In B, cotransfection assays were performed with reporters containing a single copy of the distal and proximal genomic regions shown in Figure 4. Where significant, the fold transcriptional activation stimulated by Brn-3.0 appears to the right of the data bars.
In a second set of transfection experiments, single copies of the intact proximal and distal binding domains (diagrammed in Fig. 4) were tested in cotransfection assays. The intact proximal binding region was highly effective in these assays, whereas transcriptional stimulation from the distal region was minimal (Fig. 6B). Taken together, the protein binding and transcription results demonstrate that the proximal autoregulatory region is a functional Brn-3.0 regulatory target, but transcriptional function for the distal site is difficult to demonstrate in this context. Based on these results and an extensive previous examination of the dimerization properties of the POU proteins (Rhee et al., 1998), it is likely that the strongest proximal site, prox3, functions cooperatively with the adjacent somewhat weaker sites to produce the overall enhancement of transcription observed.
Brn-3.2 is a transcriptional activator of the proximal Brn-3.0 autoregulatory region
Like Brn-3.0, the closely related POU factor Brn-3.2 is expressed in specific neurons in the retina, midbrain, hindbrain, and sensory ganglia (Xiang et al., 1993; Turner et al., 1994). However, unlike Brn-3.0, Brn-3.2 exhibits transient expression in several locations. In the inferior olive and interpeduncular nucleus, for instance, Brn-3.2 is expressed transiently during cellular migration in neurons that also activate Brn-3.0 expression permanently.
In the retina, Brn-3.0 and Brn-3.2 are both restricted to the ganglion cell layer (Turner et al., 1994; Fedtsova and Turner, 1995) where they identify sets of cells that at least partially overlap (Xiang et al., 1995). Detailed examination of the ontogeny of Brn-3.0 and Brn-3.2 expression in the retinal ganglion cells reveals that Brn-3.2 expression precedes Brn-3.0 in the first centrally located ganglion cells to exit the cell cycle on mouse E12.5. By E15.5, Brn-3.2 expression is largely confined to the outer margin of the retina, whereas Brn-3.0 is expressed centrally (Fig.7). Because maturation of the retina proceeds from the center to the periphery, it is very likely that a majority of the ganglion cells express Brn-3.2 before Brn-3.0. This hypothesis is also confirmed by the presence of postmitotic Brn-3.2-expressing cells, which have presumably just exited the cell cycle, scattered within the neuroepithelial layer (Fig. 7A,arrows), whereas Brn-3.0-expressing cells are restricted to the defined layer of postmitotic cells.
Fig. 7.

Sequential expression of Brn-3.2 and Brn-3.0 in the developing retina. A and B show the pattern of Brn-3.2 and Brn-3.0 expression at E15.5 in the mouse retina in adjacent 5 μm paraffin sections. The Brn-3 factors appear ingreen, and dividing cells stained with PCNA appear inred. Note that the Brn-3.2-expressing ganglion cells are exclusively postmitotic, but unlike Brn-3.0-expressing cells they intermingle with still-dividing precursors (arrows) and at this stage are largely confined to newly postmitotic neurons at the periphery of the retina. ne, Neuroepithelium;pml, postmitotic layer. Scale bars, 50 μm.
The early expression of Brn-3.2 in several sets of neurons that also express Brn-3.0 suggests that it may also be an activator of Brn-3.0 transcription. The optimal DNA recognition sites for Brn-3.2 and Brn-3.0 have previously been shown to be indistinguishable (Gruber et al., 1997), and the stability of binding of the Brn-3.2 POU-domain to the proximal and distal Brn-3.0 autoregulatory sites is similar to that of Brn-3.0 itself (data not shown).
To test the possibility of Brn-3.2 activation of Brn-3.0 expression, we examined the transcriptional effect of Brn-3.2 on Brn-3.0 autoregulatory sequences. Overall, Brn-3.2 was a less powerful activator of transcription than Brn-3.0. On a reporter containing the synthetic optimal site for both proteins, Brn-3.2 typically stimulated transcription 5- to 10-fold, in contrast to 20- to 50-fold for Brn-3.0. Given that Brn-3.2 is a less effective activator of transcription, its transcriptional effects on the Brn-3.0 autoregulatory sequences were very similar to Brn-3.0 itself (Fig. 8). Brn-3.2 produced significant activation of reporter constructs containing one copy of the intact proximal Brn-3.0 autoregulatory domain, or three copies of the Prox3 element within this domain. As discussed below, these results suggest that Brn-3.2 is a positive regulator of Brn-3.0 expression in several classes of neurons in which Brn-3.2 expression precedes Brn-3.0.
Fig. 8.

Brn-3.0 autoregulatory sites are activated by Brn-3.2. An expression plasmid containing a full-coding Brn-3.2 cDNA was cotransfected with reporter plasmids, including the proximal Brn-3.0 autoregulatory domain (Prox) and three copies of the discrete Brn-3.0 recognition element prox3. The Brn-3.0 autoregulatory sequences mediate activation of transcription by Brn-3.2 at levels similar to the optimal Brn-3 class recognition site (b3s1, ATAATTAAT).
DISCUSSION
In this study we have used a novel, direct in vitroscreening method to rapidly identify functional Brn-3 regulatory sites in a large region of genomic DNA. Two properties of DNA recognition by Brn-3.0 make the successful application of this method possible. First, the kinetic stability of the Brn-3.0–DNA complex in vitrocorrelates well with transcriptional activation by Brn-3.0 in vivo. Second, the dissociation of Brn-3.0 from its functional binding sites is slow enough that biochemical separations can be conveniently performed before dissociation is complete. Together these properties allow biochemical identification and isolation of functional binding sites by complex stability screening.
It is likely that CoSS will provide an efficient general method for relating POU proteins to their regulatory targets. Although the major subclasses of the POU proteins have distinctive binding sites (Verrijzer et al., 1992; Li et al., 1993; Gruber et al., 1997; Rhee et al., 1998), we have recently demonstrated that all subfamilies of POU-domain proteins expressed in the nervous system exhibit very stable binding to their optimal recognition sequences, with dissociation half-times of 10–100 min (Gruber et al., 1997; Rhee et al., 1998). Thus, the CoSS method could be rapidly adapted to identify regulatory targets for any of these proteins.
The application of this method to other structural classes of transcription factors will depend on finding conditions under which protein–DNA complexes are stable in solution for at least several minutes. The dissociation kinetics of protein–DNA complexes have not been studied for most families of transcription factors, nor have their optimal binding sites been identified. However, a dissociationt½ of 30 min has been reported for an Ultrabithorax complex with a high affinity site (Ekker et al., 1991), and a half-life of 89 min has been observed for an Antennapedia–DNA complex (Affolter et al., 1990), suggesting that this method can be generalized at least to other homeodomain classes.
The CoSS method may also be adaptable to the screening of larger subgenomic regions and possibly whole eukaryotic genomes for functional regulatory sites. The methods applied here to screen an ∼80 kb genomic fragment could readily be applied to screening and isolating functional binding domains from subgenomic fragments in the 105-106 bp range, such as bacterial and yeast artificial chromosomes. Application of CoSS to entire eukaryotic genomes is limited by the difficulty of relating the derived sequences to functional transcription units. Thus, screening of whole genomes by this method will probably only be practical when the genomic sequence databases currently in development are more complete.
We initially decided to apply the CoSS method to the Brn-3.0 genomic locus because the locked in developmental expression pattern of Brn-3.0 expression suggests autoregulation. Autoregulation is not the only mechanism which could lead to persistent expression of Brn-3.0. It is also possible that the mechanisms which initially activate Brn-3.0 expression during terminal differentiation are maintained throughout life. However, persistence of the initiating signals for neuron-specific gene expression is a much less likely hypothesis. These signals clearly act only on defined regions of the neural tube, because the Brn-3.0 neurons arise from specific areas of the neuroepithelium, and expression of Brn-3.0 can be repatterned by the ventral signal SHH early in development (Fedtsova et al., 1997). However, in the mature CNS, Brn-3.0 neurons are distributed widely and closely intermingle with cells which are negative for this factor, strongly suggesting that the expression of Brn-3.0 becomes cell-intrinsic at some point in development.
Autoregulation by a key transcription factor is an attractive mechanism for the maintenance of any cell phenotype, with the best understood examples being from non-neural tissues. In the anterior pituitary, the development of three principal cell types depends on the POU-domain transcription factor Pit-1. Like Brn-3.0, Pit-1 expression is activated in development and marks its target cells for the life of the organism. Although Pit-1-binding sites have been identified flanking the TATA element of the Pit-1 promoter (Chen et al., 1990), the principal autoregulatory region in vivo resides in an enhancer region ∼10 kb upstream from the transcriptional start site (Rhodes et al., 1993; DiMattia et al., 1997). This region is not required for the initial developmental expression of Pit-1, but is necessary for high-level expression from the day of birth onward. Like the Brn-3.0 autoregulatory region identified here, the Pit-1 autoregulatory enhancer contains several clustered high-affinity Pit-1-binding sites. The Pit-1 and Brn-3.0 autoregulatory loci are also similar in that both are located several kilobases upstream from the site of transcription initiation.
Autoregulation has also been described for several of the homeodomain proteins that regulate segmentation in the Drosophilaembryo, including fushi tarazu (ftz), deformed,ultrabithorax, and even-skipped (Bateman, 1998). Perhaps the best described of these is ftz, a pair-rule gene required for the establishment of the early regional stripes in the developing embryo that in turn direct formation of the embryonic parasegments. The regulatory region from the ftz gene that directs reporter gene expression to the embryonic stripes has been well described. A proximal enhancer within this region contains several clustered Ftz-binding sites (Pick et al., 1990; Han et al., 1993) that interact directly with this protein to produce the native pattern of Ftz expression (Schier and Gehring, 1992).
Like the pituitary cell types that express Pit-1, many classes of vertebrate neurons are characterized by the expression of cell-specific transcription factors. Neuron-specific transcription factors have been identified from the POU, Pax, LIM, variant homeodomain, MEF and helix-loop-helix gene families, among others. Typically, these neuron-specific regulators appear as developing neurons leave the cell cycle, and show persistent expression. The expression patterns of most of these factors have not been well characterized in the adult nervous system, but it is clear that at least some of them share with Brn-3.0 the property of cell-specific expression throughout the life of the organism. Isl-1, for example, is an LIM-homeodomain transcription factor that characterizes developing spinal motor neurons, neurons of the brainstem motor nuclei, and primary sensory neurons of the dorsal root ganglia, and is essential for the survival of some of these neurons (Ericson et al., 1992; Pfaff et al., 1996). Like Brn-3.0, Isl-1 expression appears soon after motor neurons exit the cell cycle, and has been shown to persist in each of these neuronal groups in the adult rat (Thor et al., 1991). The regulatory sequences of most neuron-specific transcription factors have not been described. However, previous studies of Pit-1 and the results reported here for Brn-3.0 suggest that autoregulation of key transcription factors is likely to be a conserved mechanism for the maintenance of differentiated neuronal phenotypes.
The present study also helps to clarify the relationship between the structurally similar and sometimes coexpressed transcription factors Brn-3.0 and Brn-3.2. We have previously demonstrated that the DNA recognition properties of Brn-3.0 and Brn-3.2 are indistinguishable (Gruber et al., 1997). However, previous studies have reported that Brn-3.2 is both a transcriptional activator (Turner et al., 1994) and a transcriptional inhibitor (Morris et al., 1994, 1996; Budhram-Mahadeo et al., 1995). In the present study, Brn-3.2 functioned only as a transcriptional activator (or had no effect) on the expression constructs tested, although it was a somewhat less potent activator than Brn-3.0. The previous studies showing transcriptional inhibition have used a truncated form of Brn-3.2, termed Brn-3b (Theil et al., 1993) or Brn-3b(s) (Theil et al., 1995), which lacks the N-terminal domain contributed by the conserved first exon of the Brn-3 proteins, and this may explain some of the differences in these results. We have also noted that cotransfection of very high levels of Brn-3.2 expression plasmid may inhibit reporter gene expression by mechanisms that do not depend on the presence of high-affinity Brn-3 recognition sites in the reporter construct, and presumably represent interference with general transcriptional mechanisms. Other possible explanations for the opposite transcriptional effects of Brn-3.2 in various studies include the different cell lines and different reporter plasmids used.
In addition to Brn-3.0 autoregulation, the results presented here provide a molecular basis for cross-regulation between POU proteins of the Brn-3 class in the retina, and perhaps also in the inferior olivary and interpeduncular nuclei, where transient Brn-3.2 expression also precedes Brn-3.0. Brn-3.2 null mice exhibit a significant loss of retinal ganglion cells and have a more severe retinal defect than Brn-3.0 knock-out mice (Erkman et al., 1996; Gan et al., 1996; Xiang, 1998). One conclusion of these studies is that although Brn-3.0 is more abundant in the mature retina (Turner et al., 1994), Brn-3.2 is somehow more essential for ganglion cell viability, perhaps because of its earlier expression. Also, the lack of an obvious retinal defect in Brn-3.0 null mice (McEvilly et al., 1996; Xiang et al., 1996) has been attributed to redundancy with Brn-3.2 beyond the earliest stages of ganglion cell development.
Our data strongly suggest that the action of Brn-3.2 as a developmental activator of Brn-3.0 expression may contribute to the severity of the retinal defect in Brn-3.2 null mice. A role for Brn-3.2 in control of Brn-3.0 expression is also supported by the observation that Brn-3.2 (−/−) mice exhibit a profound decrease in retinal expression of Brn-3.0, out of proportion to the overall decrease in ganglion cell number. At E15.5 Brn-3.0 is essentially undetectable in these mice (Erkman et al., 1996; Xiang, 1998), and in postnatal mice only a few Brn-3.0-immunoreactive neurons appear by a Brn-3.2-independent mechanism. The Brn-3.2 activation of the Brn-3.0 autoregulatory enhancer demonstrated here suggests that the Brn-3.2 null mutation may effectively produce a mouse defective in the expression of both Brn-3 factors, leading to a more severe phenotype.
Footnotes
This work was supported in part by the Scottish Rite Schizophrenia Research Program, Department of Veterans Affairs MERIT funding and VISN 22 MIRECC (E.E.T.), National Institutes of Health Training Grant 5-T32-MH19934 (N.F.), and National Institutes of Health Awards MH58447, MH01581, and HD33442. Natalia Fedtsova and Eric E. Turner are National Alliance for Research on Schizophrenia and Depression Young Investigators. We thank Raisa Eng for careful reading of this manuscript.
Correspondence should be addressed to Dr. Eric Turner, Department of Psychiatry, 0603, University of California San Diego, 9500 Gilman Drive, La Jolla, CA 92093-0603.
REFERENCES
- 1.Affolter M, Percival-Smith A, Muller M, Leupin W, Ghering WJ. DNA binding properties of the purified Antennapedia homeodomain. Proc Natl Acad Sci USA. 1990;87:4093–4097. doi: 10.1073/pnas.87.11.4093. [DOI] [PMC free article] [PubMed] [Google Scholar]
- 2.Artinger KB, Fedtsova N, Rhee JM, Bronner-Fraser M, Turner EE. Placodal origin of Brn-3-expressing cranial sensory neurons. J Neurobiol. 1998;36:572–585. doi: 10.1002/(sici)1097-4695(19980915)36:4<572::aid-neu10>3.0.co;2-a. [DOI] [PubMed] [Google Scholar]
- 3.Bateman E. Autoregulation of eukaryotic transcription factors. Prog Nucleic Acids Res Mol Biol. 1998;60:133–163. doi: 10.1016/s0079-6603(08)60892-2. [DOI] [PubMed] [Google Scholar]
- 4.Budhram-Mahadeo V, Morris PJ, Lakin ND, Theil T, Ching GY, Lillycrop KA, Moroy T, Liem RK, Latchman DS. Activation of the a-internexin promoter by the Brn-3a transcription factor is dependent on the N-terminal region of the protein. J Biol Chem. 1995;270:2853–2858. doi: 10.1074/jbc.270.6.2853. [DOI] [PubMed] [Google Scholar]
- 5.Chen R, Ingraham HA, Treacy MN, Albert VR, Wilson L, Rosenfeld MG. Autoregulation of pit-1 gene expression mediated by two cis-active promoter elements. Nature. 1990;346:583–586. doi: 10.1038/346583a0. [DOI] [PubMed] [Google Scholar]
- 6.DiMattia GE, Rhodes SJ, Krones A, Carriere C, O’Connell S, Kalla K, Arias C, Sawchenko P, Rosenfeld MG. The Pit-1 gene is regulated by distinct early and late pituitary enhancers. Dev Biol. 1997;182:180–190. doi: 10.1006/dbio.1996.8472. [DOI] [PubMed] [Google Scholar]
- 7.Ekker SC, Young KE, von Kessler DP, Beachy PA. Optimal DNA sequence recognition by the ultrabithorax homeodomain of Drosophila. EMBO J. 1991;10:1179–1186. doi: 10.1002/j.1460-2075.1991.tb08058.x. [DOI] [PMC free article] [PubMed] [Google Scholar]
- 8.Erkman L, McEvilly RJ, Luo L, Ryan AK, Hooshmand F, O’Connell SM, Keithley EM, Rapaport DH, Ryan AF, Rosenfeld MG. Role of transcription factors Brn-3.1 and Brn-3.2 in auditory and visual system development. Nature. 1996;381:603–606. doi: 10.1038/381603a0. [DOI] [PubMed] [Google Scholar]
- 9.Ericson J, Thor S, Edlund T, Jessel T, Yamada T. Early stages of motor neuron differentiation revealed by expression of homeobox gene Islet-1. Science. 1992;256:1555–1560. doi: 10.1126/science.1350865. [DOI] [PubMed] [Google Scholar]
- 10.Fedtsova N, Turner EE. Brn-3.0 Expression identifies early post-mitotic CNS neurons and sensory neural precursors. Mech Dev. 1995;53:291–304. doi: 10.1016/0925-4773(95)00435-1. [DOI] [PubMed] [Google Scholar]
- 11.Fedtsova N, Turner EE. Inhibitory effects of ventral signals on the development of Brn-3.0-expressing neurons in the dorsal spinal cord. Dev Biol. 1997;190:18–31. doi: 10.1006/dbio.1997.8691. [DOI] [PubMed] [Google Scholar]
- 12.Gan L, Xiang M, Zhou L, Wagner DS, Klein WH, Nathans J. POU-domain factor Brn-3b is required for the development of a large set of retinal ganglion cells. Proc Natl Acad Sci USA. 1996;93:3920–3925. doi: 10.1073/pnas.93.9.3920. [DOI] [PMC free article] [PubMed] [Google Scholar]
- 13.Gruber CA, Rhee JM, Gleiberman A, Turner EE. POU-domain factors of the Brn-3 class recognize functional DNA elements which are distinctive symmetrical and highly conserved in evolution. Mol Cell Biol. 1997;17:2391–2400. doi: 10.1128/mcb.17.5.2391. [DOI] [PMC free article] [PubMed] [Google Scholar]
- 14.Han W, Yu Y, Altan N, Pick L. Multiple proteins interact with the fushi tarazu proximal enhancer. Mol Cell Biol. 1993;13:5549–5559. doi: 10.1128/mcb.13.9.5549. [DOI] [PMC free article] [PubMed] [Google Scholar]
- 15.Li P, He X, Gerrero MR, Mok M, Aggarwal A, Rosenfeld MG. Spacing and orientation of bipartite DNA-binding motifs as potential functional determinants for POU-domain factors. Genes Dev. 1993;7:2483–2496. doi: 10.1101/gad.7.12b.2483. [DOI] [PubMed] [Google Scholar]
- 16.McEvilly RJ, Erkman L, Luo L, Sawchenko PE, Ryan AF, Rosenfeld MG. Requirement for Brn-3.0 in differentiation and survival of sensory and motor neurons. Nature. 1996;384:574–577. doi: 10.1038/384574a0. [DOI] [PubMed] [Google Scholar]
- 17.Morris PJ, Theil T, Ring CT, Lillycrop K, Moroy T, Latchman DS. The opposite and antagonistic effects of the closely related POU family transcription factors Brn-3a and Brn-3b on the activity of target promoters are dependent on differences in the POU domain. Mol Cell Biol. 1994;14:6907–6914. doi: 10.1128/mcb.14.10.6907. [DOI] [PMC free article] [PubMed] [Google Scholar]
- 18.Morris PJ, Lakin ND, Dawson SJ, Ryabinin AE, Kilimann MW, Wilson MC, Latchman DS. Differential regulation of genes encoding synaptic proteins by members of the Brn-3 subfamily of POU transcription factors. Mol Brain Res. 1996;43:279–285. doi: 10.1016/s0169-328x(96)00207-0. [DOI] [PubMed] [Google Scholar]
- 19.Pfaff SL, Mendelsohn M, Stewart CL, Edlund T, Jessell TM. Requirement for LIM homeobox gene Isl-1 in motor neuron generation reveals a motor neuron-dependent step in interneuron differentiation. Cell. 1996;84:309–320. doi: 10.1016/s0092-8674(00)80985-x. [DOI] [PubMed] [Google Scholar]
- 20.Pick L, Schier A, Affolter M, Schmidt-Glenewinkel T, Gehring WJ. Analysis of the ftz upstream element: gem layer-specific enhancers are independently autoregulated. Genes Dev. 1990;4:1224–1239. doi: 10.1101/gad.4.7.1224. [DOI] [PubMed] [Google Scholar]
- 21.Rhee JM, Gruber CA, Brodie TB, Trieu M, Turner EE. Highly cooperative homodimerization is a conserved property of neural POU proteins. J Biol Chem. 1998;273:34196–34205. doi: 10.1074/jbc.273.51.34196. [DOI] [PubMed] [Google Scholar]
- 22.Rhodes SJ, Chen R, DiMattia GE, Scully KM, Kalla KA, Lin SC, Yu VC, Rosenfeld MG. A tissue-specific enhancer confers Pit-1-dependent morphogen inducibility and autoregulation on the Pit-1 gene. Genes Dev. 1993;7:913–932. doi: 10.1101/gad.7.6.913. [DOI] [PubMed] [Google Scholar]
- 23.Ryan AK, Rosenfeld MG. POU domain family values: flexibility partnerships, and developmental codes. Genes Dev. 1997;11:1207–1225. doi: 10.1101/gad.11.10.1207. [DOI] [PubMed] [Google Scholar]
- 24.Schier AF, Gehring WJ. Direct homeodomain-DNA interaction in the autoregulation of the fushi tarazu gene. Nature. 1992;356:804–807. doi: 10.1038/356804a0. [DOI] [PubMed] [Google Scholar]
- 25.Theil T, McLean-Hunter S, Zornig M, Moroy T. Mouse Brn-3 family of POU transcription factors: a new aminoterminal domain is crucial for the oncogenic activity of Brn-3a. Nucleic Acids Res. 1993;21:5921–5929. doi: 10.1093/nar/21.25.5921. [DOI] [PMC free article] [PubMed] [Google Scholar]
- 26.Theil T, Rodel B, Spiegelhalter F, Moroy T. Short isoform of POU factor Brn-3b can form a heterodimer with Brn-3a that is inactive for octamer motif binding. J Biol Chem. 1995;270:30958–30964. doi: 10.1074/jbc.270.52.30958. [DOI] [PubMed] [Google Scholar]
- 27.Thor S, Ericson J, Brannstrom T, Edlund T. The homeodomain LIM protein Isl-1 is expressed in subsets of neurons and endocrine cells in the adult rat. Neuron. 1991;7:881–889. doi: 10.1016/0896-6273(91)90334-v. [DOI] [PubMed] [Google Scholar]
- 28.Turner EE, Jenne K, Rosenfeld MG. Brn-3.2: A POU-domain transcription factor with distinctive CNS expression and regulation by retinoic acid. Neuron. 1994;12:205–218. doi: 10.1016/0896-6273(94)90164-3. [DOI] [PubMed] [Google Scholar]
- 29.Verrijzer CP, Alkema MJ, vanWeperen WW, VanLeeuwen HC, Strating MJ, van der Vliet PC. The DNA binding specificity of the bipartite POU domain and its subdomains. EMBO J. 1992;11:4993–5003. doi: 10.1002/j.1460-2075.1992.tb05606.x. [DOI] [PMC free article] [PubMed] [Google Scholar]
- 30.Xiang M. Requirement for Brn-3b in early differentiation of postmitotic retinal ganglion cell precursors. Dev Biol. 1998;197:155–169. doi: 10.1006/dbio.1998.8868. [DOI] [PubMed] [Google Scholar]
- 31.Xiang M, Zhou L, Peng Y-W, Eddy R, Shows TB, Nathans J. Brn-3b: a POU domain gene expressed in a subset of retinal ganglion cells. Neuron. 1993;11:689–701. doi: 10.1016/0896-6273(93)90079-7. [DOI] [PubMed] [Google Scholar]
- 32.Xiang M, Zhou L, Macke JP, Yoshioka T, Hendry S, Eddy RL, Shows TB, Nathans J. The Brn-3 family of POU-domain factors: primary structure binding specificity and expression in subsets of retinal ganglion cells and somatosensory neurons. J Neurosci. 1995;15:4762–4785. doi: 10.1523/JNEUROSCI.15-07-04762.1995. [DOI] [PMC free article] [PubMed] [Google Scholar]
- 33.Xiang M, Lin G, Zhou L, Klein WH, Nathans J. Targeted deletion of the mouse POU-domain gene Brn-3a causes a selective loss of neurons in the brainstem and trigeminal ganglion uncoordinated limb movement and impaired suckling. Proc Natl Acad Sci USA. 1996;93:11950–11955. doi: 10.1073/pnas.93.21.11950. [DOI] [PMC free article] [PubMed] [Google Scholar]