

Abstract
Several lines of evidence suggest that neuronal mitochondria accumulate calcium when the cytosolic free Ca2+concentration ([Ca2+]i) is elevated to levels approaching ∼500 nm, but the spatial, temporal, and quantitative characteristics of net mitochondrial Ca uptake during stimulus-evoked [Ca2+]ielevations are not well understood. Here, we report direct measurements of depolarization-induced changes in intramitochondrialtotal Ca concentration ([Ca]mito) obtained by x-ray microanalysis of rapidly frozen neurons from frog sympathetic ganglia. Unstimulated control cells exhibited undetectably low [Ca]mito, but high K+depolarization (50 mm, 45 sec), which elevates [Ca2+]i to ∼600 nm, increased [Ca]mito to 13.0 ± 1.5 mmol/kg dry weight; this increase was abolished by carbonyl cyanidep-(trifluoromethoxy) phenylhydrazone (FCCP). The elevation of [Ca]mito was a function of both depolarization strength and duration. After repolarization, [Ca]mito recovered to prestimulation levels with a time course that paralleled the decline in [Ca2+]i. Depolarization-induced increases in [Ca]mito were spatially heterogeneous. At the level of single mitochondria, [Ca]mito elevations depended on proximity to the plasma membrane, consistent with predictions of a diffusion model that considers radial [Ca2+]i gradients that exist early during depolarization. Within individual mitochondria, Ca was concentrated in small, discrete sites, possibly reflecting a high-capacity intramitochondrial Ca storage mechanism. These findings demonstrate that in situ Ca accumulation by mitochondria, now directly identified as the structural correlate of the “FCCP-sensitive store,” is robust, reversible, graded with stimulus strength and duration, and dependent on spatial location.
Keywords: mitochondria, calcium, calcium signaling, calcium regulation, neurons, depolarization, electron probe x-ray microanalysis
Classical studies have demonstrated that isolated mitochondria from various tissues accumulate Ca via a Ca2+-sensitive uniporter whose activity is half-maximal when the extramitochondrial free Ca2+concentration is ∼10–20 μm (for review, see Gunter and Gunter, 1994). With improved methods for measuring cytosolic free Ca2+ concentration ([Ca2+]i) (Grynkiewicz et al., 1985), it became clear that many physiological stimuli elevate global [Ca2+]i to submicromolar levels and that higher levels are achieved only after excessive stimulation. These two lines of evidence led to the conclusion that mitochondria serve as low-affinity Ca2+ buffers during Ca overload but do not participate in the physiological control of [Ca2+]i (Somlyo, 1984; Carafoli et al., 1995). This conclusion was supported by the observation that in some cells intramitochondrial Ca concentration rises only after excessive stimulation (Moravec et al., 1997; Horikawa et al., 1998).
Despite these observations, a growing body of evidence suggests that mitochondria in various cells do accumulate Ca even when [Ca2+]i rises within the physiological range (Babcock and Hille, 1998; Miller, 1998). Much of this evidence is based on measurements of [Ca2+]i, which provide only indirect indications of mitochondrial Ca2+ transport (Thayer and Miller, 1990; Friel and Tsien, 1994; White and Reynolds, 1995; Drummond and Fay, 1996; Herrington et al., 1996; Hoth et al., 1997; David et al., 1998; Peng, 1998), although similar conclusions have been reached using Ca2+ indicators that provide estimates of intramitochondrial free Ca2+concentration (Miyata et al., 1991; Rizzuto et al., 1992; Hajnoczky et al., 1995; Babcock et al., 1997; Hoth et al., 1997). Nevertheless, reversible elevations of the total Ca concentration in structurally identified neuronal mitochondria after stimuli evoking submicromolar [Ca2+]i elevations have not been reported so far.
Sympathetic neurons contain an intracellular pool that accumulates Ca2+ during membrane depolarization as [Ca2+]i approaches ∼500 nm. Ca2+ accumulation by this pool slows the rise in [Ca2+]i and speeds the initial phase of recovery that follows repolarization. Subsequent Ca2+ release greatly prolongs the [Ca2+]i recovery (Friel and Tsien, 1994). Because Ca2+ sequestration by this pool is inhibited by proton ionophores such as carbonyl cyanidep-(trifluoromethoxy) phenylhydrazone (FCCP) that collapse the mitochondrial membrane potential, the pool appears to be mitochondrial. In the present study, we used energy-dispersive x-ray (EDX) microanalysis (Hall and Gupta, 1983; Somlyo, 1985; Roomans, 1988) to measure directly depolarization-induced changes in the total Ca concentration ([Ca]mito) within structurally identified mitochondria of sympathetic neurons. The measurements demonstrate that mitochondria accumulate Ca when [Ca2+]i rises to levels as low as ∼300 nm and that [Ca]mito elevations are graded with stimulus strength and duration, blocked by FCCP, and reversed on repolarization, with a recovery that parallels the decline of [Ca2+]i. Moreover, mitochondrial Ca accumulation is fast enough that activation of Ca2+-sensitive mitochondrial dehydrogenases would be expected within seconds of depolarization. Finally, the rise in [Ca]mito is strikingly heterogeneous, both among and within individual mitochondria.
Some of these results have been published previously in abstract form (Andrews et al., 1998; Pivovarova et al., 1998).
MATERIALS AND METHODS
Cell dissociation and culture. Sympathetic ganglia were obtained using a modification of a procedure described previously (Friel and Tsien, 1992). In brief, adult male bullfrogs (Rana catesbeiana) were killed by decapitation and pithing, after which the sympathetic chains were removed, desheathed, and incubated, first for 40 min at 35°C in low Ca2+ Ringer’s solution containing 3 mg/ml collagenase (Worthington, Type I) and subsequently for 10 min in Ringer’s solution supplemented with 1.5 mg/ml trypsin (EC 3.4.21.4; Sigma, St. Louis, MO). All procedures conform with guidelines established by our institutional animal care and use committees. The composition of low Ca2+ Ringer’s solution was (in mm): 128 NaCl, 2 KCl, 10 HEPES, 10 glucose, pH adjusted to 7.3 with NaOH. The ganglia were then washed in this solution with gentle trituration and transferred to normal Ringer’s solution that contained 2 mm added CaCl2. This procedure yielded individual ganglia consisting of clusters of Schwann cell-free neurons tethered by their proximal axons, with neurons resembling grapes on a vine. To obtain dissociated cells, the ganglia were further triturated, and cells were plated onto poly-lysine-coated coverslips and placed in primary culture as described in Friel and Tsien (1992).
Cytosolic calcium measurements. To measure cytosolic free Ca2+ concentration, cells were incubated with 3 μm fura-2 AM in normal Ringer’s solution for ∼40 min at room temperature with gentle agitation followed by a rinse with normal Ringer’s solution. Fura-2 AM was dispensed from a 1 mm stock solution in DMSO containing 25% (w/w) pluronic F127 (BASF Corporation). Fura-2 AM-loaded ganglia were transferred with a fire-polished Pasteur pipette to poly-d-lysine-coated coverslips that were affixed with Sylgard (Dow Corning) to the underside of 60 mm culture dishes so that the coverslips covered 20 mm holes in the dish. After ganglia settled onto the substrate, dishes were placed on the stage of an inverted microscope (Nikon Diaphot TMD) and superfused continuously (∼5 ml/min) with normal (Ca2+-containing) Ringer’s solution. Recordings began ∼20 min after washing away fura-2 AM, permitting de-esterification of the Ca2+ indicator. Depolarization-evoked [Ca2+]i changes in single neurons within ganglia were made using cells from the periphery of the ganglia that were attached to the substrate. Solution changes (∼250 msec) were made using a multi-tube system of microcapillaries (Drummond microcaps, 20 μl) mounted on a micromanipulator.
Cells were illuminated with light from a 150 W xenon lamp that was alternately filtered by bandpass filters (350 ± 5 nm, 380 ± 5 nm) mounted on a filter wheel rotating at 40 Hz and then focused by a 40× objective (Nikon, Fluor, NA 1.3). Emitted light passed through a dichroic mirror (400 nm) and longpass filter (510/20 nm) and was detected by a photomultiplier tube. The filter wheel was controlled by a Cairn spectrophotometer, and data acquisition was controlled by a laboratory computer. [Ca2+]i was calculated according to the method of Grynkiewicz et al. (1985) as described previously (Friel and Tsien, 1994).
Rapid freezing, cryosectioning, and electron microscopy.Dispersed ganglia were transferred from normal Ringer’s solution to various test solutions in 35 mm culture dishes with a P-20 Pipetman whose tips were cut off with a razor blade to give an opening (∼1–2 mm) that was much larger than the diameter of the ganglia, thus avoiding mechanical injury during transfer. After a ganglion was incubated in a given test solution, it was incubated for 15 sec in another dish containing the same solution supplemented with 5% (w/w) polyvinylpyrrolidone (PVP-10), which served to increase the mass content of the extracellular milieu. This step was also performed on untreated control ganglia. Ganglia were then transferred to a freezing stage consisting of a one-quarter-inch-diameter, ∼500-μm-thick pad of agar/gelatin (2%/2%, equilibrated with appropriate Ringer’s solution) mounted on an aluminum disk designed to fit the specimen chuck of a Leica ultracryomicrotome, as described in Buchanan et al. (1993). Just before freezing, excess saline was wicked away from the edge of the ganglion with filter paper. Rapid freezing was carried out by impact against an LN2-cooled copper block using a modified LifeCell CF-100 freezing machine (The Woodlands, TX).
Cryosectioning of frozen ganglia was performed essentially as described in Buchanan et al. (1993). In brief, cryosections (80 nm nominal thickness) were cut with a Diatome cryodiamond knife (Diatome, Fort Washington, PA) mounted in a Leica Ultracut S/FCS ultracryomicrotome (Leica, Deerfield, IL) equipped with an antistatic device (Hauf Static Line, Diatome). Sections were obtained as smooth, continuous ribbons from the superficial, well frozen surface (<20 μm deep) of each ganglion at less than −160°C and mounted on carbon/Formvar-coated grids (EMS, Fort Washington, PA). Grids containing frozen-hydrated sections were cryotransferred into a LEO EM912 Omega electron microscope (LEO Electron Microscopy, Thornwood, NY), where they were freeze-dried at approximately −100°C and recooled to less than −160°C before imaging and elemental analysis. Structural images of freeze-dried sections were obtained as low-dose, zero-loss images, recorded digitally by means of a calibrated ProScan slow-scan CCD camera (1024 × 1024 pixels, LEO) and AnalySIS software (Soft-Imaging Software GmbH, Munster, Germany). Distances measured on images of cryosections were corrected for unrelieved unidirectional compression that occurs during cryosectioning (Shi et al., 1996) by means of DigitalMicrograph software (Gatan, Pleasanton, CA). Only sections through or near the equatorial plane of these essentially spherical neurons (Pick, 1963) were selected for distance measurements.
For conventional electron microscopy, cultured cells were fixed in a 2% paraformaldehyde, 2% glutaraldehyde cacodylate buffer, pH 7.4, for 1 hr, washed 3 times, post-fixed in 1% OsO4 for 1 hr, and then rinsed with distilled water. Cells were stained with 1% uranyl acetate in distilled water for 1 hr, followed by dehydration, embedding (Spurr’s), and sectioning using standard procedures. Sections were viewed and photographed using a JEOL 1200EX transmission electron microscope (JEOL, Inc., Peabody, MA).
X-ray microanalysis. EDX microanalysis was performed as described in Buchanan et al. (1993) and Pozzo-Miller et al. (1997). In brief, compartment-specific x-ray emission was elicited by focusing an electron probe of ∼5 nA beam current on morphologically selected subcellular regions of sectioned neurons. The size of the probe was small enough (diameter ∼100 nm) to fit well within a typical mitochondrion in section, but not so small that it would resolve differences between the matrix and individual cristae. Such measurements provide information about the spatial average of total Ca concentration over ∼104 nm2regions of the mitochondrial matrix.
Spectra from single analyses were recorded for 100 sec at less than −160°C using a Linksystem Pentafet EDX detector (Oxford Instruments, Concord, MA) and were subsequently processed and quantified by established procedures (Shuman et al., 1976; Hall and Gupta, 1983;Buchanan et al., 1993; Pozzo-Miller et al., 1997) as implemented by the program NIST/NIH DeskTop Spectrum Analyzer (DTSA) for the Macintosh (C. E. Fiori, C. R. Swyt, and R. Mykelbust, available athttp://micro.nist.gov/DTSA/dtsa.html). The Simplex fitting routine and the Hall peak/continuum method were used to quantify thetotal elemental concentrations of Na, Mg, P, S, Cl, K, and Ca. This procedure directly provides total (i.e., free plus bound) elemental concentrations (Cdry) in units of millimoles per kilogram dry weight. Conversion to concentrations in millimoles per liter of water-accessible volume (Caq) was performed according to the following formula:
| Equation 1 |
where fw is the fractional water weight and ρ is the density of the cellular compartment under consideration. The basis for this approach, as well as the underlying assumptions, is discussed by Roomans (1988). Values of fw for mitochondria (0.60) and cytosol (0.88) were estimated on the basis of the continuum x-ray emission of EDX spectra and are consistent with literature data (cf. Buchanan et al., 1993; Andrews et al., 1994), taking ρ = 1.0 for both mitochondria and cytosol:
| Equation 2 |
| Equation 3 |
Statistics. Population measurements are expressed as mean ± SEM (n), where n is the number of individual measurements. Typically, measurements from 5–15 mitochondria or cytosolic regions were performed in each of 11–13 neurons taken from three to four ganglia per experimental condition. The overall variability of elemental concentrations reflected differences within regions of individual cells, differences between cells and ganglia, and instrumental variability. Analysis of errors showed that instrumental variability and cell–cell variability were negligible compared with regional variability within individual cells. Statistical significance was assessed using Student’s ttest (two-tailed).
Computer simulations. Simulations were based on a model of Ca transport in sympathetic neurons described in Friel and Tsien (1994). Mitochondrial Ca transport was represented by a [Ca2+]i-sensitive unidirectional uptake pathway operating at constant membrane potential, which gives a flux (per unit volume) that is proportional to [Ca2+]i, with a proportionality factor that increases sigmoidally with [Ca2+]i(kmax = 165 × 103/sec, EC50 = 10 μm, nHill = 2). Ca2+ release was described by a saturable efflux pathway (Vmax = 300 nm/sec, EC50 = 3 μm,nHill=1), and a small linear leak (rate constant 0.2 × 10⁻⁹/sec). Plasma membrane Ca2+ extrusion was represented by a linear pump and leak (rate constants 0.3/sec and 5 × 10⁻⁶/sec) and Ca2+ entry was described by an inactivating Ca2+ currentICa(t) =Ifaste−t/τfast +Islowe−t/τslow +Iss, whereIfast = 4 nA,Islow = 0.5 nA, Iss= 20 pA, τfast = 80 msec, τslow = 500 msec. Diffusion was modeled as in Sala and Hernandez-Cruz (1990)but with a single diffusible cytosolic Ca2+ buffer (on and off rate constants 108m/sec and 1000 sec, total concentration 1 mm, diffusion coefficient 0.5 × 10⁻⁶ cm2/sec). Mitochondria were assumed to be uniformly distributed and to occupy a fractional volume of 0.05, in keeping with morphometric analysis of our electron micrographs, as well as those in the literature (Pick, 1963). A single nondiffusible intramitochondrial Ca buffer was included with the same on and off rate constants as the cytosolic buffer but a 10-fold higher total concentration (10 mm). Simulated responses to Ca2+ entry depend on the distribution of mitochondria but are largely insensitive to the properties of the intramitochondrial Ca buffer. Changes in buffer characteristics have little effect, because during stimulation Ca2+accumulation is dominated by (unidirectional) uptake. For simplicity, it was also assumed that mitochondria are stationary within the cell; mobility and remodeling of these organelles would be expected to partially dissipate spatial [Ca]mito gradients. The model cell was assumed to be spherically symmetrical (radius 30 μm) and was represented as a series of 60 0.5-μm-thick shells. It was assumed that for a given distance from the plasma membrane, all intramitochondrial species (free and bound Ca and buffer) are distributed uniformly. Integration step size was 1 μsec.
Chemicals and drugs. Concentrated aliquots of FCCP (10 mm) in 100% ethanol were stored at −80 C° and diluted in normal Ringer’s solution just before each experiment. Fura-2 AM was obtained from Molecular Probes (Eugene, OR). Unless indicated otherwise, all reagents were obtained from Sigma and EMS.
RESULTS
Pharmacological evidence implicating mitochondrial Ca2+ transport during depolarization-evoked Ca responses
Sympathetic neurons respond to membrane depolarization with a rise in [Ca2+]i that is initiated by Ca2+ entry through voltage-gated Ca2+ channels but is strongly influenced by Ca2+ uptake and release by intracellular stores. Pharmacological evidence for mitochondrial Ca2+transport during these responses is illustrated in Figure1. Exposure to 30 mmK+, which steadily depolarizesVm from a resting potential of approximately −70 mV to approximately −35 mV (Friel and Tsien, 1992), elevates [Ca2+]i from a resting level of ∼50–80 nm to ∼200–300 nm (Fig.1a, left); repolarization initiates a recovery with a simple time course. In the presence of the proton ionophore FCCP, the same stimulus elicits a [Ca2+]i response (Fig. 1a,right) that is very similar to the control response.
Fig. 1.

Comparison between [Ca2+]i responses elicited by weak and strong depolarization and their sensitivity to FCCP in fura-2 AM-loaded sympathetic neurons. a, [Ca2+]i responses from a sympathetic neuron in primary culture elicited by weak depolarization (30 mm K+) before (left) and after (right) treatment with 1 μm FCCP.b, [Ca2+]i responses elicited from the same cell by stronger depolarization (50 mm K+) before (left) and after (right) treatment with 1 μm FCCP. In this cell, the initial rate of recovery after repolarization was −71 nm/sec in the absence of FCCP, whereas the rate of decline in the presence of FCCP measured over the same range of [Ca2+]i was −18 nm/sec. Collected results indicate that FCCP slows the rate of recovery to ∼14% of the control value (from −121 ± 15 nm/sec to −17 ± 3 nm/sec; n = 11) measured over the same range of [Ca2+]i. Cell b13j.c, [Ca2+]i response recorded from a cell (b16f) on the periphery of a ganglion like those used in this study for EDX microanalysis. This ganglion was treated enzymatically according to the same procedure used to prepare dissociated cells, but cells were not dispersed by trituration.
In contrast, stronger depolarizations induced by exposure to 50 mm K+, which depolarizesVm to approximately −20 mV (Friel and Tsien, 1992), elicit larger [Ca2+]ielevations followed by complex recoveries that are strongly modified by FCCP. In the absence of FCCP (Fig. 1b, left), such depolarizations elevate [Ca2+]ito ∼500–800 nm, whereas repolarization initiates a recovery consisting of an initial rapid decline followed by a slow plateau phase that lasts for many seconds. Similar response kinetics are observed when [Ca2+]i is elevated by other means, including trains of stimulated action potentials (Friel and Tsien, 1994) and voltage-clamp depolarization (data not shown). In the presence of FCCP, the same stimulus elevates [Ca2+]i to a much higher level, and the subsequent recovery occurs without the fast and slow phases seen in control responses (Fig. 1b, right). It is unlikely that these effects of FCCP reflect reduced ATP availability and suppression of ATP-dependent Ca2+ extrusion because FCCP does not alter resting [Ca2+]i, and overall recoveries are speeded, not slowed, by the drug. Taken together, these observations implicate Ca2+ uptake and release by an FCCP-sensitive intracellular store, presumably mitochondrial, that becomes increasingly influential as [Ca2+]i rises above several hundred nanomolar. According to this idea, net Ca2+accumulation by the store blunts the rise in [Ca2+]i during depolarization and speeds the initial phase of recovery after repolarization, with net Ca2+ release slowing the return of [Ca2+]i to its resting level. Similar observations have been reported for a variety of excitable cells (Babcock and Hille, 1998; Miller, 1998).
The interpretation described above is indirect and relies on the mitochondrial specificity of FCCP. To determine directly whether membrane depolarization causes reversible mitochondrial Ca accumulation, EDX microanalysis was used. This approach requires a cell preparation that can be rapidly frozen and cryosectioned. To this end, sympathetic ganglia were treated enzymatically as in the preparation of dissociated cells but were not dispersed by trituration. This procedure yielded clusters of neurons whose individual response properties closely resembled those of cells in primary culture. For example, Figure 1c illustrates a [Ca2+]i response induced by 50 mm K+ from a fura-2 AM-loaded cell on the periphery of such a ganglion (a location similar to that from which cells were cryosectioned for microanalysis). This response was essentially indistinguishable from those elicited from single cells in culture, with quantitative differences being well within the range of cell-to-cell variability. Similar responses were seen in five of five cells. Therefore, ganglia prepared in this way were used for EDX microanalysis in the following experiments.
Subcellular structure and elemental composition of sympathetic neurons
The appearance and subcellular distribution of mitochondria in cultured sympathetic neurons as seen using conventional fixation procedures is illustrated in Figure2A, whereas Figure2B shows a freeze-dried cryosection from a rapidly frozen ganglion, prepared as described above without chemical fixation or staining. In both preparations, mitochondria can be readily identified by their characteristic electron density, shape, size (∼200 nm in cross section, of variable length), and distribution. The extent to which mitochondria of sympathetic neurons exist as an interconnected reticulum is unknown. If they do form a continuous network, it is perhaps more accurate to refer to mitochondrial profiles in section as “local regions of the mitochondrial network” rather than “individual mitochondria.” The distinction is not material to the results of this study, however, and so we shall use the term “individual mitochondria” as a convenient formalism.
Fig. 2.

Subcellular structure of sympathetic neurons.A, Transmission electron micrograph of conventionally prepared thin section of chemically fixed, plastic embedded neuron under resting conditions. Field illustrates typical peripheral region of the neuronal soma. Cytoplasm contains numerous, polymorphic mitochondria (arrows) and a rich network of small cisterns of endoplasmic reticulum (arrowheads).B, Digital transmission electron micrograph (1024 × 1024) of freeze-dried cryosection prepared from superficial neuron of an unfixed, rapidly frozen sympathetic ganglion. Micrograph was recorded at low dose in the zero-loss mode of an energy-filtering cryoanalytical electron microscope at approximately −170° C by means of a slow-scan CCD camera. Image of cryosection reveals the same organelles and same subcellular organization as in the reference-fixed preparation. Inset, White dot on enlargement of one mitochondrion indicates the relative size of 100-nm-diameter electron probe used for EDX analysis. Scale bars, 1 μm.
In cryosections of rapidly frozen cells, all elements remain distributed essentially as they were at the instant of freezing, making them suitable for quantitatively analyzing the elemental composition of defined subcellular compartments. Figure3a shows representative EDX spectra recorded from similar 100-nm-diameter regions of cytosol and mitochondria (thin and thick traces, respectively) in freeze-dried cryosections of resting neurons maintained in normal Ringer’s solution before freezing. These spectra exhibit large peaks corresponding to the characteristicKα,β x-ray lines for the abundant elements P and K, smaller peaks for the other major elements Na, Mg, S, and Cl, and a slowly varying background, the continuum, that is proportional to the dry mass of the target cell compartment. Quantitative analysis of such spectra (see Materials and Methods) provides total dry weight concentrations of all cellular elements between Z = 11 (Na) and Z = 20 (Ca), as summarized by the collected results for selected elements in Table 1. These data indicate that the neurons maintained an appropriate nonequilibrium distribution of Na and K across the plasma membrane (extracellular concentrations of K+ and Na+ were 2 and 128 mm, respectively). Calculation of the cytoplasmic [K+]/[Na+] ratio gives 950/31 ≈ 30; conversion to millimoles per liter cell water (see Materials and Methods) gives [K]cyto = 133 mm and [Na]cyto = 4.3 mm, both values being typical for living cells.
Fig. 3.

Detection and quantitation of changes in [Ca]mito by elemental analysis. a, EDX spectra recorded from typical areas (<104nm2, size indicated by white dot on mitochondrion in Fig. 2b, inset) of cytoplasm (fine line) and mitochondrial matrix (heavy line) within cryosectioned neurons from a control ganglion. Spectra are plots of the number of binned x-ray counts versus energy (resolution 10 eV per channel). So-called characteristic peaks identify individual elements, and the integrated counts for each peak are proportional to the amount of that element. Elements corresponding to the major characteristic K-shell x-ray peaks are identified; in the case of K and Ca, two K-shell transitions arising from alternative electronic transitions are resolved, indicated asKα and Kβaccording to standard spectroscopic notation. Spectra ina, representing the sum of eight individual spectra each recorded for 100 sec at a beam current of ∼4.0 nA, illustrate typical distributions of major elements in living neurons. Note the approximately twofold difference in the slowly varying continuum radiation, e.g., between 1.50 and 1.75 keV, which reflects differences in the mass density of these cellular compartments. b, Mitochondrial EDX spectrum (sum of 10 individual spectra, each recorded for 100 sec) over the energy range 3.0–4.2 keV (dashed boxin a) recorded under control conditions. Superimposed are best-fit Gaussians for the K Kα plusKβ peaks (dotted curve) obtained as described in Materials and Methods. Vertical lines indicate energies of the K and Ca lines.c, Residual spectrum, obtained by subtracting the calculated K Kα andKβ counts from the experimental spectrum, indicates the absence of resolvable Ca peaks. d, Mitochondrial EDX spectrum (sum of 11 individual spectra, 100 sec each) recorded from a ganglion after a 45 sec exposure to 50 mmK+. Dotted and dashed traces show best-fit Gaussians for characteristic K and Ca peaks, respectively. e, Difference spectrum illustrating contributions from the Ca Kα andKβ peaks. The mean depolarization-induced elevation in [Ca]mito over these 11 mitochondria was ∼25 mmol/kg dry weight.
Table 1.
Elemental concentrations in subcellular compartments of frog sympathetic ganglion neurons
| n | Na | Mg | P | K | Ca | |
|---|---|---|---|---|---|---|
| (mmol/kg dry weight) | ||||||
| Mitochondria | ||||||
| Control | 107 | 11 ± 2 | 21 ± 1 | 380 ± 7 | 347 ± 6 | −0.4 ± 0.2*** |
| Depolarization | ||||||
| 50 mm K+, 45 sec | 77 | 27 ± 2** | 19 ± 1 | 384 ± 13 | 308 ± 10 | 13.0 ± 1.5** |
| 50 mm K+, 45 sec + FCCP | 28 | 10 ± 1 | 12 ± 1 | 327 ± 14 | 251 ± 15 | 0.6 ± 0.7*** |
| 50 mm K+, 2 min | 114 | 34 ± 1** | 27 ± 2 | 364 ± 9 | 285 ± 8 | 32.7 ± 5.1** |
| 30 mm K+, 45 sec | 113 | 17 ± 2* | 20 ± 1 | 350 ± 6 | 344 ± 9 | 3.0 ± 0.4** |
| 30 mm K+, 2 min | 111 | 31 ± 2** | 22 ± 1 | 417 ± 9 | 363 ± 8 | 12.8 ± 2.5* |
| Recovery from 50 mmK+, 2 min | ||||||
| 2 min | 106 | 26 ± 2** | 20 ± 1 | 380 ± 6 | 397 ± 12 | 4.7 ± 1.2** |
| 5 min | 93 | 13 ± 2 | 18 ± 1 | 349 ± 5 | 312 ± 6 | 0.8 ± 0.4 |
| 15 min | 69 | 10 ± 2 | 26 ± 2 | 387 ± 7 | 330 ± 10 | 1.4 ± 0.5 |
| Cytoplasm | ||||||
| Control | 59 | 31 ± 5 | 47 ± 3 | 470 ± 32 | 950 ± 50 | 3.3 ± 1.0 |
| Depolarization | ||||||
| 50 mm K+, 45 sec | 81 | 37 ± 2 | 33 ± 2 | 456 ± 22 | 739 ± 37 | 7.3 ± 1.1** |
| 50 mm K+, 45 sec + FCCP | 31 | 20 ± 2* | 39 ± 3 | 479 ± 28 | 736 ± 44 | 6.9 ± 1.5* |
| 50 mm K+, 2 min | 67 | 42 ± 4 | 38 ± 3 | 376 ± 21 | 558 ± 35 | 7.0 ± 1.2* |
| 30 mm K+, 45 sec | 116 | 43 ± 6 | 33 ± 1 | 419 ± 14 | 779 ± 16 | 6.6 ± 0.9* |
| 30 mm K+, 2 min | 47 | 42 ± 5 | 47 ± 4 | 491 ± 34 | 825 ± 47 | 6.7 ± 2.2 |
| Recovery from 50 mm K+, 2 min | ||||||
| 2 min | 128 | 40 ± 3 | 42 ± 3 | 506 ± 15 | 852 ± 21 | 5.5 ± 0.7* |
| 5 min | 94 | 23 ± 3 | 36 ± 2 | 514 ± 16 | 815 ± 24 | 5.6 ± 1.2 |
| 15 min | 28 | 23 ± 5 | 53 ± 5 | 580 ± 34 | 888 ± 42 | 5.4 ± 1.4 |
Data are given as mean ± SEM, where column n is the number of mitochondria or cytoplasmic regions analyzed. The number of neurons analyzed was 8–18 per experimental condition taken from three to four ganglion (except for 15 min Recovery, which represents measurements from two ganglia). Concentrations were also obtained for S and Cl (range 100–150 mmol/kg dry weight for S and 100–200 and 30–60 mmol/kg for Cl in cytoplasm and mitochondria, respectively). For these elements, there were no significant concentration differences between locations or conditions. Concentrations are given in units of mmol/kg dry weight; conversion to mmol/l H2O-accessible volume is described in Materials and Methods.
*Significantly higher than control values by Student’s ttest, p < 0.05, except cytoplasmic Na in the presence of FCCP, which was lower than control.
**Significantly higher than control values by Student’s ttest, p < 0.01.
***Not significantly different from zero. The actual concentration must be positive, but negative experimental values, reflecting statistical fluctuations, sometimes occur for populations with concentrations effectively below the limit of detection.
It is apparent from Figure 3a that a distinct x-ray peak for Ca is not evident under resting conditions. This reflects an intracellular K concentration that is typically 100-fold greater than the Ca concentration, combined with overlap between the potassiumKβ and calcium Kαpeaks (centered at 3.59 and 3.69 keV, respectively). Figure3b shows the 3.0–4.2 keV region of the mitochondrial x-ray spectrum along with the fitted potassium peaks (Kα and Kβ, dotted trace). If the fitted curve is subtracted from the spectrum, the resulting residual spectrum (Fig. 3c) is flat, indicating that the peaks in this energy range can be completely accounted for by K. The minimum concentration of total Ca that can be detected with this technique is ∼0.4 mmol/kg dry weight (Kitazawa et al., 1983, Somlyo, 1985; Andrews et al., 1994; Moravec et al., 1997), which places an upper limit on [Ca]mito of resting sympathetic neurons in our preparation of ∼250 μmol/l water-accessible matrix volume. Assuming that the ratio of total to free Ca concentration within mitochondria is ∼4000 (Babcock et al., 1997), this would correspond to a resting [Ca2+]mito of 250 μm/4000 ∼ 63 nm, in rough agreement with literature estimates of 100–200 nm[summarized in Babcock et al. (1997)].
Effects of 50 K+ depolarization on total mitochondrial and cytosolic Ca concentrations
To evaluate the effects of depolarization on mitochondrial calcium concentration, sympathetic ganglia were exposed to high K+ Ringer’s solution (50 mmK+, equimolar substitution of Na+) and then rapidly frozen. A depolarization-induced rise in [Ca]mito is apparent by inspection of the relevant EDX spectra. Figure 3d shows the 3.0–4.2 keV region of a spectrum representing measurements from 11 mitochondria at the end of a 45 sec exposure to 50 mmK+. After stimulation, the peak in the 3.5–3.8 keV range was broadened and shifted to the right; this occurs because of overlap between the K Kβ peak and a newly appearing Ca Kα peak (dotted and dashed traces, respectively, with peaks at 3.59 and 3.69 keV, respectively). Subtraction of the fitted K peaks from the original spectrum in Figure3d reveals a prominent peak centered at the CaKα line (Fig. 3e), indicating that membrane depolarization leads to a resolvable increase in the total mitochondrial Ca concentration. Collected results from sympathetic ganglia after a 45 sec exposure to 50 mmK+ Ringer’s solution are shown in Figure4 (also see Table 1). Total mitochondrial Ca concentration was undetectably low in resting cells (−0.4 ± 0.2 mmol/kg dry weight; n = 107) but was elevated to 13.0 ± 1.5 mmol/kg dry weight by depolarization (n = 77; significantly higher than control,p < 0.01) (Fig. 4a). The depolarization-induced rise in [Ca]mito was prevented by treatment with 1 μm FCCP ([Ca]mito = 0.6 ± 0.7 mmol/kg dry weight; n = 28; not significantly elevated compared with control).
Fig. 4.

Depolarization-induced calcium entry elevates mitochondrial and cytosolic total calcium concentrations. Collected results describing the effects of depolarization on total mitochondrial (a) and cytosolic Ca concentrations (b). Ganglia were exposed to 2 mm K+Ringer’s solution (Control) and then to 50 mm K+ for 45 sec, either in the absence (50 K) or presence of 1 μm FCCP (50 K+FCCP). FCCP was applied 2 min before depolarization and remained until the instant of freezing. Results show mean ± SEM over the indicated number of individual measurements, in each case taken from three or more different ganglia. Statistical significance of the difference relative to control values is indicated by ** (p < 0.01) or * (p < 0.05).
Parallel measurements of cytosolic total Ca2+concentration ([Ca]cyto) are shown in Figure4b. Under resting conditions, [Ca]cyto was 3.3 ± 1.0 mmol/kg dry weight (n = 59), higher than [Ca]mito, and increased during depolarization to 7.3 ± 1.1 or 6.9 ± 1.5 mmol/kg dry weight (n = 81) in the absence or presence, respectively, of FCCP. These results demonstrate that during depolarizations that elevate [Ca2+]i to ∼500–800 nm and [Ca]cyto to levels of ∼7 mmol/kg dry weight, [Ca]mito rises in an FCCP-sensitive manner to concentrations in excess of 10 mmol/kg dry weight. Given that resting [Ca2+]i is ∼65 nm in these cells, it is also possible to estimate the ratio of total to free cytosolic Ca as ∼(0.14 × 3.3 × 10−3)/(65 × 10−9) = 7000 (±30%). Therefore, under resting conditions >99.9% of Ca within the cytosol is bound. A similar calculation of the total to free cytosolic Ca ratio after depolarization gives a value of ∼1500. The fact that [Ca2+]i and [Ca]cyto increase in a nonlinear manner hints at saturation of endogenous cytosolic Ca2+ buffers. Nonlinear buffering may also explain, at least in part, the observation that although FCCP-treated cells exhibit larger [Ca2+]i responses than untreated controls (Fig. 1), they do not respond with a proportionate increase in [Ca]cyto (Fig. 4b). Assuming a simple linear buffering model, [Ca]cyto in the presence of FCCP should have risen to ∼11 mmol/kg, which would have been detectable, given the precision of the present cytosolic EDX measurements. Failure to detect a significant increase in [Ca]cyto under these conditions implies that with larger cytosolic Ca2+loads, a larger fraction of entering Ca2+ remains free. These points remain speculative, and a definitive demonstration of this and related possibilities requires further investigation.
Time- and voltage-dependence of depolarization-evoked [Ca]mito elevations
Longer depolarizations lead to larger elevations in [Ca]mito. For example, a 2 min exposure to 50 mm K+, which raises [Ca2+]i to ∼500–800 nm(Fig. 5a), elevates average [Ca]mito to 32.7 ± 5.1 mmol/kg dry weight (n = 114) (Fig. 5b, Table 1); this is more than twice the level reached after a 45 sec depolarization (13.0 ± 1.5 mmol/kg dry weight). After repolarization, [Ca]mito recovers within 2–5 min, reaching in 5 min a level (0.8 ± 0.4 mmol/kg dry weight; n = 93) that is indistinguishable from the prestimulation value. Therefore, the rise in [Ca]mito evoked by depolarization is completely reversible. [Ca]mito recovers with a time course that is similar to the [Ca2+]i recovery after depolarizations of the same strength and duration in single cells (Fig.5a), providing good evidence that the [Ca2+]i recovery is slowed, at least in part, by Ca2+ release from loaded mitochondria.
Fig. 5.
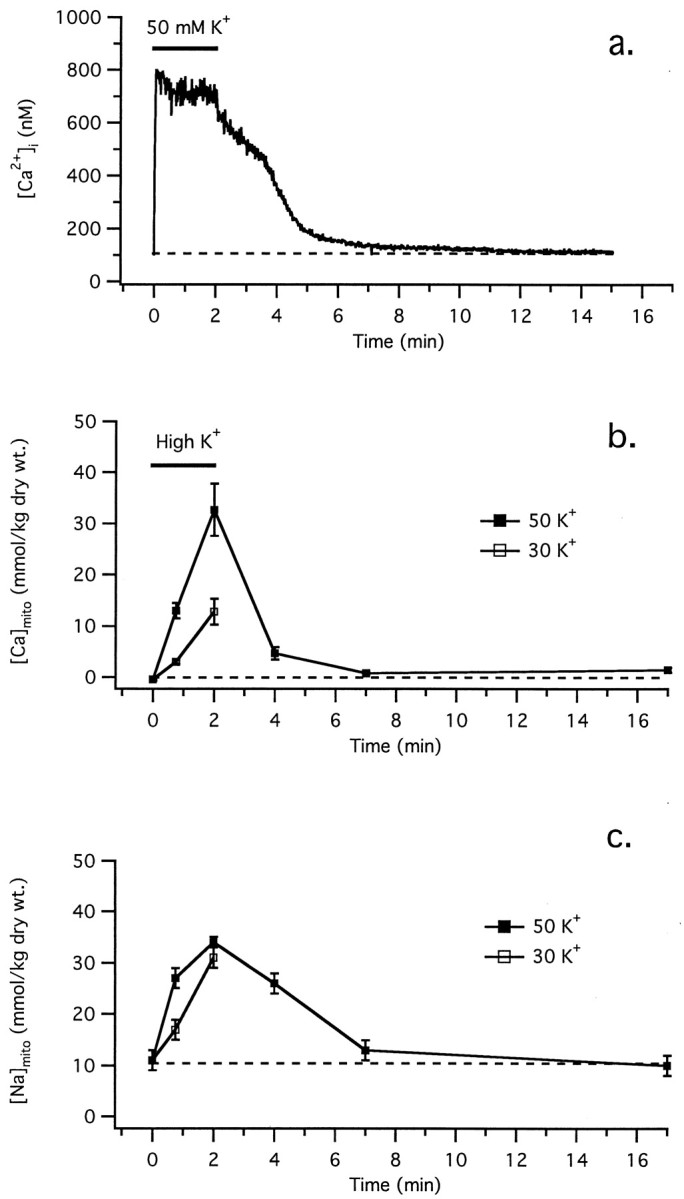
Comparison between the time courses of [Ca2+]i, [Ca]mito, and [Na]mito during and after depolarization. a, Typical [Ca2+]i response elicited by exposing a single cultured cell to 50 mm K+ for 2 min. b, Collected results (mean ± SEM) showing how [Ca]mito responds to 50 mmK+ (▪) or 30 mm K+(■). Ganglia were exposed to the indicated concentrations of K+ for either 45 or 120 sec and then were rapidly frozen. Using another population of ganglia, a 120 sec exposure to 50 mm K+ was followed by a 2, 5, or 15 min recovery period during which ganglia were incubated in normal Ringer’s solution, followed by rapid freezing. For a given depolarization strength, the rise in [Ca]mito increased with the duration of depolarization, and for a given stimulus duration, [Ca]mito increased with stimulus strength.c, The rise in [Ca]mito was accompanied by a reversible increase in [Na]mito, whose peak magnitude was also graded with depolarization strength and duration.
The observed rate of mitochondrial Ca accumulation is consistent with known properties of mitochondrial Ca2+ transport. Our measurement of ∼33 mmol/kg dry weight after a 2 min depolarization converts to ∼0.37 nmol/mg mitochondrial protein per second (assuming that protein accounts for ∼75% of mitochondrial dry weight). This is compatible with published rates of Ca2+ uptake by the uniporter, e.g., 0.2 nmol/mg protein per second by liver mitochondria at −150 mV in the presence of 1 μm Ca2+ (Gunter and Pfeiffer, 1990). Maintained over several seconds, this rate of uptake would be sufficient to activate Ca2+-sensitive dehydrogenases in heart mitochondria (Gunter et al., 1994). It is interesting to note that, consistent with the remarkable Ca buffering capacity of isolated mitochondria (Gunter and Gunter, 1994), mitochondrial Ca2+ accumulation continues at a nearly constant rate even 120 sec after the onset of depolarization, when [Ca2+]i is 554 ± 88 nm (n = 5). The observation that during maintained depolarization mitochondrial Ca2+accumulation continues despite a nearly steady elevation in [Ca2+]i indicates that under these conditions Ca2+ accumulation nearly balances net Ca2+ entry across the plasma membrane, as proposed by Friel and Tsien (1994).
Weak depolarizations also elevate [Ca]mito. For example, a 45 sec exposure to 30 mm K+ produces a small elevation in [Ca]mito to 3.0 ± 0.4 (n = 113), whereas longer exposures (120 sec) elevate [Ca]mito to levels that are similar to those seen after a 45 sec exposure to 50 K+ (Fig. 5b). This is interesting in view of the observation that FCCP has little or no effect on small [Ca2+]i responses induced by 30 K+ depolarization (Fig.1a). We will return to this point in Discussion.
Neuronal mitochondria release Ca2+ principally via a Na+/Ca2+ exchanger that couples energetically uphill Ca2+ release with downhill Na+ uptake driven by its strong electrochemical gradient (Gunter and Gunter, 1994). During the 2 min exposure to 50 mm K+, [Na]mito rose from 11 ± 2 to 34 ± 1 mmol/kg dry weight (Fig. 5c), equivalent to a rise in [Na+]mito from 7 ± 1 to 23 ± 1 mmol/l matrix water (assuming that only an insignificant fraction of Na+ ions are bound). This elevation was reversed on repolarization, with [Na]mitodeclining to its resting level roughly in parallel with [Ca]mito. These parallel changes in [Ca]mito and [Na]mito are consistent with coupled movements of Na+ and Ca2+, presumably reflecting operation of the mitochondrial Na+/Ca2+exchanger.
Spatial heterogeneity of depolarization-evoked elevations in [Ca]mito
The [Ca]mito results presented so far reflect averages of measurements taken from many mitochondria from different cells and ganglia. These measurements were obtained using a 100-nm-diameter electron probe, with generally 10 or more mitochondria sampled per cell. This sampling strategy provides an estimate of [Ca]mito averaged over whole cells. However, frequency histograms illustrating how [Ca]mito is distributed over the entire population of analyzed mitochondria indicate that the distribution is more complex than can be adequately conveyed by population averages (Fig. 6). Under resting conditions, [Ca]mito was normally distributed near zero with a small dispersion (Fig. 6a). After depolarization, the distribution was skewed toward higher [Ca]mito, reflecting the emergence of a subpopulation of mitochondria with elevated [Ca]mito(Fig. 6b). This subpopulation appeared as a pronounced shoulder on the distribution, with a tail extending to values of [Ca]mito well over 100 mmol/kg dry weight. At the same time, some mitochondria continued to exhibit low [Ca]mitolevels much like those seen in unstimulated cells. After a 5 min recovery period, the distribution of [Ca]mito closely resembled that seen before stimulation (Fig. 6c).
Fig. 6.
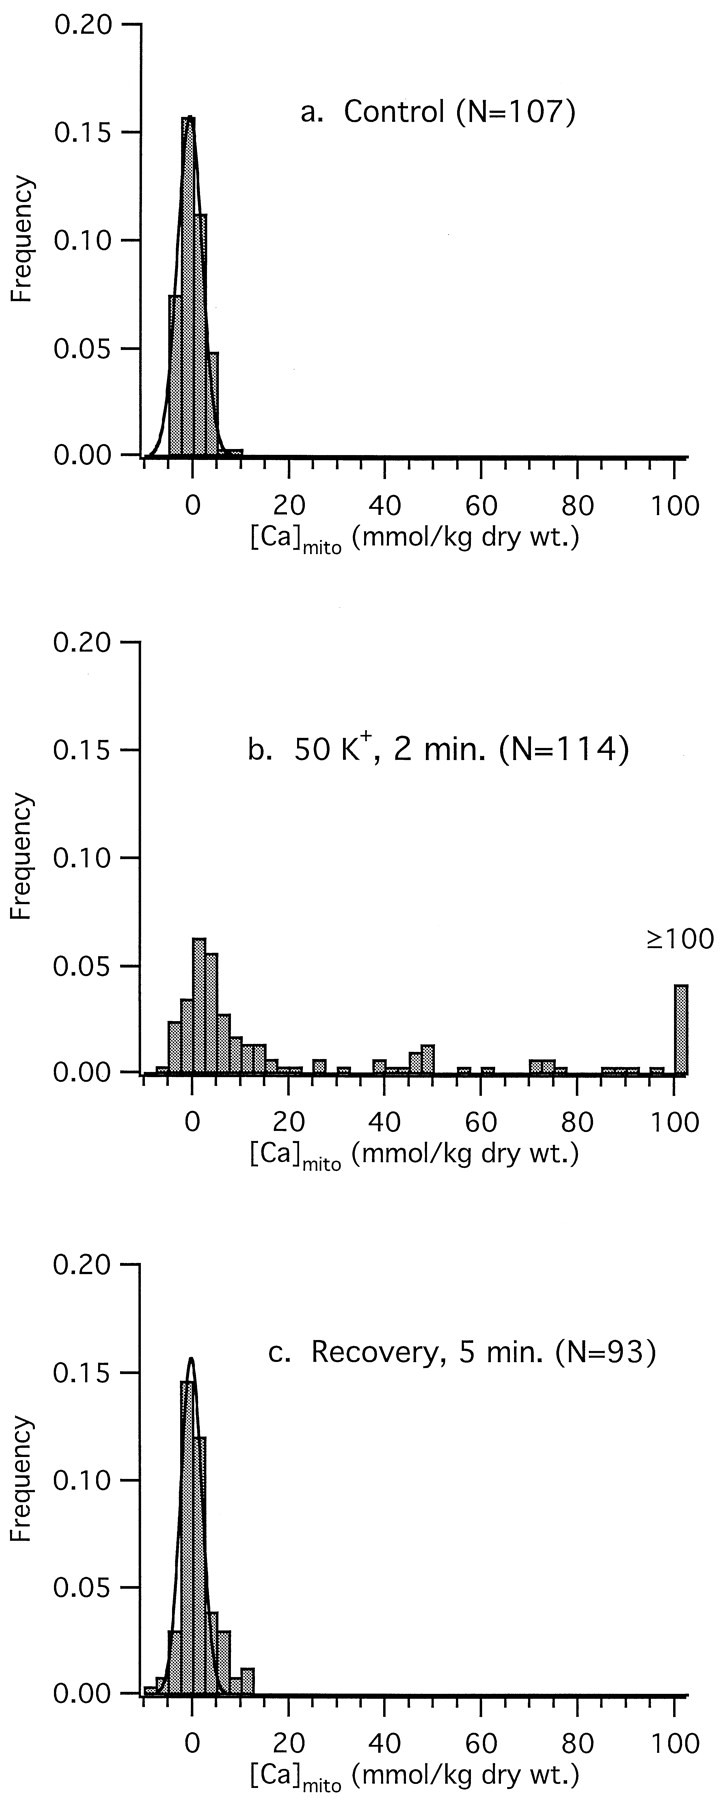
Frequency distributions of [Ca]mitoreveal intermitochondrial heterogeneity during depolarization.a, [Ca]mito in resting neurons is low and normally distributed with no detectable differences between cells or between individual mitochondria within a given cell. Smooth curve represents fitted Gaussian with mean and SD −0.6 and 3.6 mmol/kg dry weight, respectively. b, Collected results from 114 mitochondria from 12 cells illustrating the distribution of [Ca]mito after a 2 min, 50 K+depolarization. All 12 cells tested responded in a qualitatively similar manner. The skewed distribution of mitochondrial responses persists into the recovery phase, as revealed by a continued nonuniform distribution of [Ca]mito at 2 min after repolarization (data not shown). c, At 5 min after repolarization, the [Ca]mito distribution is indistinguishable from that observed in control neurons. Mean and SD for fitted Gaussian are −0.14 and 3.1 mmol/kg dry weight.
The skewed distribution of [Ca]mito observed during depolarization could reflect (1) cell-to cell variability, (2) intracellular differences in mitochondrial Ca2+accumulation arising from nonuniformities in local [Ca2+]i or mitochondrial energetics, or (3) heterogeneity in the spatial distribution of Ca within individual mitochondria resolved by the 100-nm-diameter electron beam. It is possible that all three factors contribute to the observed distribution of [Ca]mito. The similarity of depolarization-induced mitochondrial responses found in all 12 cells examined implicates [Ca]mito heterogeneity within individual cells. To examine this point in more detail, [Ca]mito was measured in multiple mitochondria from individual cells. If the dispersion of the collected results reflects intracellular mitochondrial heterogeneity, then single-cell distributions should resemble the collected results. Alternatively, if cell-to-cell variability is dominant, single-cell distributions of [Ca]mito should be narrow (as in Fig. 6a), with mean [Ca]mito varying widely among cells. Figure7a shows a tracing of an equatorial section containing 45 analyzed mitochondria from a representative neuron after a 45 sec, 50 mmK+ depolarization. Figure 6b shows the distribution of [Ca]mito over this population of mitochondria. The similarity between this distribution and the results in Figure 6b indicates that a significant contribution to the variability of [Ca]mito in the collected results arises from differences between individual mitochondria in single cells (or between different regions of the mitochondrial network).
Fig. 7.

Heterogeneity of [Ca]mito responses in a single cell. a, Tracing indicating spatial distribution and location of 45 mitochondria within a cryosection of a single representative neuron that was frozen after a 45 sec exposure to 50 mm K+. Much of the plasma membrane was present in this section, and the position of the nucleus was clear because although it was torn away in this particular section (indicated by Cut Edge), it was present in an adjacent fragment of the same section. These characteristics, together with the diameter of the neuronal profile (∼25 μm), ensure that the section was taken from near the equatorial plane of the cell. Numbersidentify specific mitochondria in c andd. Thirty-three of these could be analyzed in two or three different intramitochondrial locations. b, Frequency distribution of [Ca]mito in this cell is similar to that for the collected results representing mitochondria from many cells under the same conditions (Fig. 6b).c, Plot of [Ca]mito versus distance from the plasma membrane (●) showing dependence on proximity to the plasma membrane. Distances were corrected for section compression as described in Materials and Methods. Because these measurements were performed only on equatorial sections, it is unlikely that a given mitochondrion was close to regions of the plasma membrane that were out of the plane of section. Filled squares show the mean ± SEM calculated over five contiguous 2.5 μm subintervals.d, Histograms of [Ca]mito measurements from 10 of the 26 mitochondria that were analyzed at three separate intramatrix locations; these 10 were selected because they span the range of distances and are representative of the entire population. The intramitochondrial regions selected were near the two extremities and the center. Given that a typical mitochondrial profile was rarely longer than 3 μm, the spacing between analyzed regions was usually 1 μm or less. Large differences in [Ca]mito are evident within each of these mitochondria, indicating pronounced spatial heterogeneity of [Ca]mito within individual organelles. Similar results were obtained in each of four cells.
One possible explanation for the intracellular heterogeneity of [Ca]mito is provided by the analysis illustrated in Figure 6c, which shows how [Ca]mito varies with distance from the plasma membrane. A decline in [Ca]mito with increasing distance from the plasma membrane can be demonstrated by averaging [Ca]mito from mitochondria in contiguous 2.5 μm subintervals and comparing the means (Fig. 7c, ▪). For example, average [Ca]mito in the shell closest to the plasma membrane (43.5 ± 7.3 mmol/kg dry weight; n = 11 mitochondria) is significantly higher than the average over the shell furthest from the plasma membrane (12.2 ± 2.9 mmol/kg dry weight;n = 12 mitochondria; p < 0.0005). The basis for this form of intermitochondrial heterogeneity is unclear, but it could reflect mitochondrial proximity to cell surface Ca channels or differential regulation of mitochondrial energetics in a way that depends on distance from the plasma membrane.
Figure 7c indicates that there is still appreciable variability between [Ca]mito measurements even when they are taken from mitochondria that are similarly distant from the plasma membrane, indicating that there are additional factors contributing to the dispersion of [Ca]mito. To assess the uniformity of the Ca distribution within individual mitochondria, the 33 largest mitochondria from the section shown in Figure 7a were each analyzed in two or three maximally spaced, nonoverlapping 100-nm-diameter regions within the same mitochondrion. Figure7d shows the distribution of [Ca]mito within 10 selected but representative mitochondria in which three measurements were made; corresponding spatial averages of [Ca]mito are indicated in c. In virtually every mitochondrion, regions of high [Ca]mito co-exist near regions of low [Ca]mito. Heterogeneity of [Ca]mito within mitochondria was evidently more pronounced in peripheral organelles, where the spatially averaged [Ca]mito was also higher. Such heterogeneity explains, at least in part, the scatter in Figure7c. If intramitochondrial Ca is concentrated in small regions that are distributed at moderate or low density, such regions could be missed by a randomly placed 100 nm probe. This would occur even in mitochondria with the highest spatially averaged [Ca]mito. Thus, more detailed quantitative information about the way [Ca]mito declines with distance from the plasma membrane will require higher spatial resolution and better sampling than is practical with EDX analysis, perhaps using mapping techniques.
For those analysis sites with the highest [Ca]mito (>200 mmol/kg), there was a significant correlation between [Ca]mito and [P]mito (r = 0.97, molar ratio ∼1:1), but this correlation was weak at lower [Ca]mito, possibly because of contributions from matrix phosphorus in regions between sites of high [Ca]mito. Local regions of high [Ca]mitowere not observed in cells from ganglia that had not been depolarized or that were depolarized (50 K+, 2 min) and then allowed to recover for ≥5 min in normal Ringer’s solution (11 cells), indicating that the foci of high Ca, whatever their chemical form, readily exchange Ca with the mitochondrial matrix.
DISCUSSION
Summary and comparison with previous studies
Mitochondria in sympathetic neurons accumulate Ca when global [Ca2+]i is elevated to submicromolar levels during membrane depolarization. Ca accumulation is reversible, graded with depolarization strength and duration, and is inhibited by FCCP, much like Ca accumulation by the FCCP-sensitive store previously described in these cells (Friel and Tsien, 1994). Our results agree with previous studies implicating mitochondrial Ca accumulation during physiological [Ca2+]i elevations in various cell types. The findings contrast with x-ray microanalytical [Ca]mito measurements in muscle, indicating that [Ca]mito rises only during excessive stimulation (Somlyo, 1984; Moravec et al., 1997; Horikawa et al., 1998; but seeWendt-Gallitelli and Isenberg, 1991), implying that mitochondria do not participate in physiological Ca2+ regulation. The reason for this discrepancy is unclear, but it likely reflects differences between experimental preparations and the duration of [Ca2+]i elevations.
Mitochondrial Ca2+ accumulation at low [Ca2+]i
Isolated mitochondria accumulate Ca2+ via a [Ca2+]i-sensitive uniporter with EC50 ∼10–20 μm (Gunter and Gunter, 1994). Yet the present study indicates that mitochondria accumulate Ca2+ during depolarization even when spatially averaged [Ca2+]i is <1 μm. Moreover, Ca2+ accumulation continues after spatial [Ca2+]igradients should be largely dissipated (Fig. 5b) (see below), arguing against a requirement for microdomains of high [Ca2+]i. One likely explanation is that although activity of the Ca2+ uniporter is far from maximal when [Ca2+]i is <1 μm, it is not zero (Carafoli, 1979; McCormack et al., 1989). Assuming an EC50 of 10 μm and Hill coefficient of 2 (Gunter and Gunter, 1994), the uniporter would have an activity when [Ca2+]i is 300 nm and 500 nm that is 9 and 25%, respectively, of that observed at 1 μm, where Ca2+uptake is appreciable; activity could transiently be even higher with the rapid uptake mode described by Sparagna et al. (1995). Therefore, if mitochondria behave in intact cells as they do in isolation, Ca2+ uptake would be expected when [Ca2+]i ∼300 nm. This provides a clear way to reconcile the low affinity and steep [Ca2+]i-dependence of the uniporter with the widely reported finding that mitochondria accumulate Ca2+ at submicromolar [Ca2+]i.
If mitochondria accumulate Ca during weak depolarization, why does FCCP have so little effect on [Ca2+]iresponses elicited by such depolarizations, in contrast to the pronounced effects seen with stronger depolarizations that elevate [Ca2+]i to higher levels? One possible explanation is provided by the finding that although inhibition of Ca2+ accumulation either by the endoplasmic reticulum (with thapsigargin) or by mitochondria (with FCCP) has only a small effect on [Ca2+]i responses elicited by weak depolarization, simultaneous inhibition of Ca2+uptake by both organelles strongly potentiates [Ca2+]i responses (our unpublished observations). This suggests that when Ca2+ uptake by one organelle is inhibited, uptake by the second is enhanced, possibly because reduced Ca2+ buffering by the first organelle enhances stimulus-evoked local [Ca2+]ielevations near the second. Overall, this mechanism would reduce the impact of inhibitors on [Ca2+]iresponses to depolarization. The pronounced effects of FCCP on responses to strong depolarization may reflect a steeper [Ca2+]i dependence of uptake by mitochondria than for the endoplasmic reticulum (ER), such that at high [Ca2+]i, compensatory ER Ca2+ accumulation is overwhelmed. Thus, although microdomains of high [Ca2+]i are not required for mitochondrial Ca2+ accumulation during depolarization, they may influence quantitatively the spatial and temporal properties of accumulation (Rizzuto et al., 1998).
Intermitochondrial heterogeneity
In resting cells, [Ca]mito is normally distributed near zero with small dispersion. During maintained depolarization, the distribution becomes skewed, with some mitochondria exhibiting low [Ca]mito and others having very high [Ca]mito. Analysis of mitochondria from single cells reveals a similar skewed [Ca]mito distribution, indicating marked intracellular mitochondrial heterogeneity.
One possible explanation for such a distribution comes from the finding that during depolarization [Ca]mito tends to be highest in mitochondria that are close to the plasma membrane (Fig. 7). This may reflect more avid Ca2+ accumulation by peripheral versus central mitochondria owing to differences in energetic state. Alternatively, different mitochondria may be exposed to distinctive [Ca2+]i environments. Sympathetic neurons respond to depolarization under voltage clamp with a rise in [Ca2+]i that is initially highest near the plasma membrane (Hernandez-Cruz et al., 1990; Hua et al., 1993). Therefore, peripheral mitochondria would be exposed to higher [Ca2+]i, and accumulate Ca2+ at a higher rate, than central organelles during this phase of depolarization. A similar role of mitochondrial proximity to a Ca2+ source has been proposed previously (Rizzuto et al., 1994; Hajnoczky et al., 1995; Lawrie et al., 1996).
Because radial [Ca2+]i gradients are largely dissipated within seconds of a step depolarization (Hua et al., 1993), it must be asked whether differences in the rate of Ca2+ uptake by central and peripheral mitochondria during the first few seconds of depolarization could account for differences in [Ca]mito that persist for 45 sec. Diffusion simulations incorporating [Ca2+]i-sensitive mitochondrial Ca2+ uptake (Fig. 8) show that [Ca]mito could retain a record of early differences between central and peripheral [Ca2+]i even after [Ca2+]i gradients are largely dissipated, so long as mitochondrial Ca2+accumulation continues. This condition is clearly satisfied at 45 sec during maintained depolarization with 50 mmK+, because [Ca]mito is rising at this time (Fig. 5b). Even more pronounced spatial heterogeneity of [Ca]mito would be expected if inactivation of voltage-sensitive Ca2+ channels occurred more rapidly than the radial spread of Ca2+ within the cytosol. In this case, peripheral [Ca2+]i could reach levels during the initial phase of depolarization that are never attained deep within the cell interior.
Fig. 8.
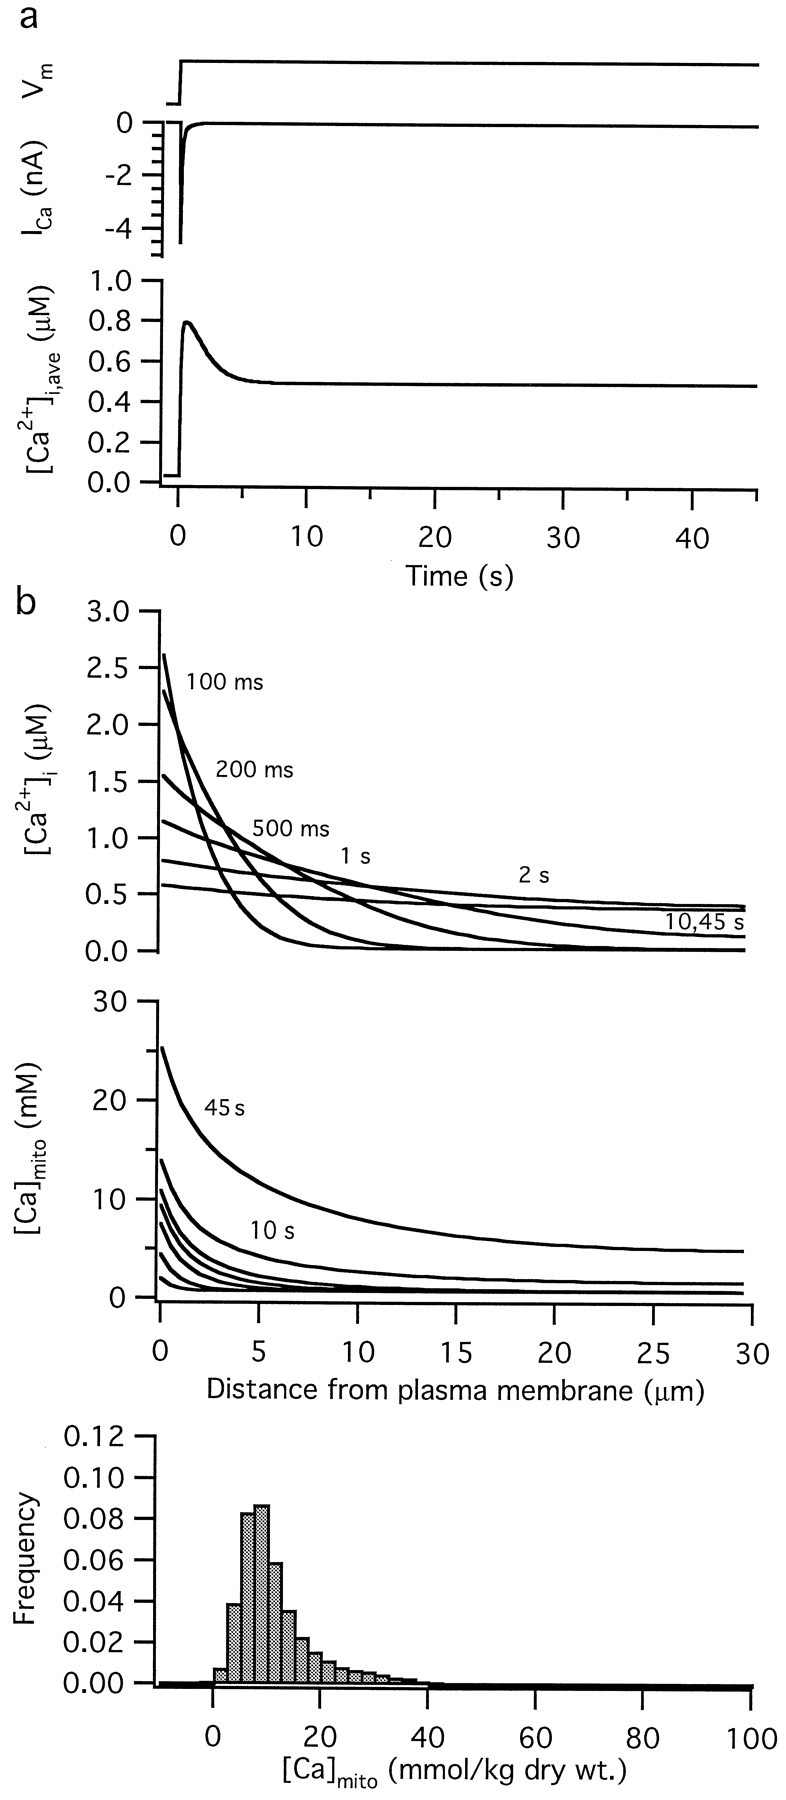
Simulated changes in [Ca2+]i and [Ca]mitoduring a 45 sec depolarization. Diffusion simulation illustrating radial dependence of [Ca2+]i and [Ca]mito at different times after membrane depolarization. a, Step depolarization of the membrane potential (Vm, top, arbitrary ordinate scale) elicits an inactivating Ca current (ICa, middle) that causes spatially averaged [Ca2+]i([Ca2+]i,ave,bottom) to increase with both transient and maintained components. b, During the first 500 msec of the depolarization, [Ca2+]i(top) is much higher near the plasma membrane than it is in the cell interior, leading to a spatially nonuniform rise in [Ca]mito (middle). After several seconds, [Ca2+]i is nearly uniform spatially, but [Ca]mito continues to rise, retaining a strong dependence on position. The bottom panel shows the calculated distribution of [Ca]mito after conversion to dry weight concentrations and convolution with the fitted distribution of measurements taken from unstimulated cells (normalized Gaussian with zero mean and SD 3.5 mmol/kg dry weight). The general form of this plot is qualitatively similar to the experimentally observed distributions, e.g., Figures 6b, 7b.
Mitochondrial Ca2+ uptake is exquisitely sensitive to [Ca2+]i; therefore, stimulation is expected to elicit complex, interdependent changes in cytosolic and mitochondrial free Ca2+([Ca2+]m) concentrations. Stimulated Ca2+ entry (e.g., during trains of action potentials) would be expected to influence both [Ca2+]i and [Ca]mitoover a spatial range that depends critically on stimulus frequency and duration. Mitochondrial proximity to sites of Ca2+entry may permit regulation of [Ca2+]m-sensitive dehydrogenases so that ATP production meets local energy demands (Robb-Gaspers et al., 1998). Reciprocally, changes in local [Ca2+]i resulting from mitochondrial Ca2+ uptake or release may modulate Ca2+ entry (Budd and Nicholls, 1996; Hoth et al., 1997). Finally, conjunctive elevations in [Ca2+]i and mitochondria-dependent oxidative activity, occurring preferentially at the neuronal periphery, may be important in activity-dependent changes in gene expression (Bito et al., 1996).
Intramitochondrial Ca heterogeneity and its relationship to Ca2+ buffering
It is clear that the vast majority of Ca within mitochondria is bound, not free (Babcock et al., 1997; Horikawa et al., 1998), but the mechanisms of intramitochondrial Ca2+ buffering are poorly understood. These mechanisms are critically important because, when exhausted, [Ca2+]m may rise to levels that trigger opening of the mitochondrial permeability transition pore, leading to cell death (Miller, 1998). Mitochondria do not express large quantities of Ca-binding proteins such as calsequestrin or calreticulin, yet they have an enormous capacity for storing Ca (Gunter and Pfeiffer, 1990). Possible contributors to intramitochondrial buffering include phospholipids (Gunter et al., 1978), Ca2+-binding proteins (Lucas-Heron et al., 1995; Evtodienko et al., 1998), andinorganic complexes formed with anions such as phosphate (Nicholls and Akerman, 1982). It has long been known that electron-dense Ca- and P-containing deposits can form within the mitochondrial matrix in a variety of cells, including sympathetic neurons (Fujimoto et al., 1980), after exposure to high Ca2+ (Lehninger, 1964). Such inclusions are known to occur as fixation artifacts, or alternatively, as hallmarks of cell injury (Somlyo et al., 1979; Somlyo, 1984). On the other hand, there is evidence that soluble Ca2+ complexes are involved in cell protection (Nicholls, 1985; Carafoli et al., 1995).
Our results demonstrate that Ca-enriched regions (≤100 nm diameter) form transiently within individual mitochondria during depolarizations that raise [Ca2+]i to levels well within the physiological range. [Ca]mito within these regions sometimes exceeded 100 mmol/kg dry weight, yet Ca must have been readily mobilized because they were not observed in mitochondria 5 min after repolarization. Because our measurements were obtained from neurons rapidly frozen without chemical fixation, they show that focal sites of Ca accumulation are compatible with normally functioning mitochondria in situ and suggest that the deposits reflect a mechanism of mitochondrial Ca buffering. Preliminary Ca mapping experiments (Andrews et al., 1999) using spectrum imaging by electron energy loss spectroscopy (for review, see Leapman et al., 1994) reveal mitochondria in peripheral regions of depolarized sympathetic neurons (45 sec and 120 sec, 50 K+) in which Ca and P are colocalized in small (<20 nm diameter), discrete inclusions, each containing only a few thousand atoms of Ca, within an otherwise low-Ca matrix. The chemical form of Ca in these sites is unknown, but the Ca/P ratio of ∼1:1 suggests the presence of calcium phosphate complexes. It is possible that such complexes are chemically related to both the coarse deposits implicated in cell injury and to the soluble complexes important for cell protection; this in turn suggests a continuum of calcium phosphate compounds, differing mainly in size, solubility, and number. Under physiological conditions of stimulation, the smaller complexes might serve as a fast, reversible, Ca2+ buffering system, but under conditions of Ca overload, they might grow in size until exhaustion of counter ions (e.g., phosphate) causes an uncontrolled [Ca2+]m elevation and its sequellae. According to this view, large intramitochondrial Ca deposits observed under conditions favoring Ca overload would be a correlate, not a cause, of mitochondrial dysfunction and cell death.
Footnotes
This work was supported by a grant (No. 96011490) from the American Heart Association and by the National Institutes of Health Intramural Research Program. We thank Dr. R. D. Leapman (National Institutes of Health) for helpful discussion and critical evaluation.
Correspondence should be addressed to Dr. David Friel, Department of Neuroscience, Case Western Reserve University, 10900 Euclid Avenue, Cleveland, OH 44106. E-mail: ddf2@po.cwru.edu
REFERENCES
- 1.Andrews SB, Buchanan RA, Leapman RD. Quantitative dark-field mass analysis of ultrathin cryosections in the field-emission STEM. Scanning Microsc [Suppl] 1994;8:13–24. [PubMed] [Google Scholar]
- 2.Andrews SB, Pivovarova NB, Hongpaisan J, Friel DD. Depolarization-induced calcium accumulation in mitochondria of sympathetic neurons. Proc Soc Neurosci. 1998;24:1501. doi: 10.1523/JNEUROSCI.19-15-06372.1999. [DOI] [PMC free article] [PubMed] [Google Scholar]
- 3.Andrews SB, Pivovarova NB, Leapman RD (1999) Quantitative imaging and analysis of biological specimens in the field-emission STEM: capabilities and limitations. Scanning Microsc [Suppl], in press.
- 4.Babcock DF, Hille B. Mitochondrial oversight of cellular Ca2+ signaling. Curr Opin Neurobiol. 1998;8:398–404. doi: 10.1016/s0959-4388(98)80067-6. [DOI] [PubMed] [Google Scholar]
- 5.Babcock DF, Herrington J, Goodwin PC, Park YB, Hille B. Mitochondrial participation in the intracellular Ca2+ network. J Cell Biol. 1997;136:833–844. doi: 10.1083/jcb.136.4.833. [DOI] [PMC free article] [PubMed] [Google Scholar]
- 6.Bito H, Deisseroth K, Tsien RW. CREB phosphorylation and dephosphorylation: a Ca2+- and stimulus duration-dependent switch for hippocampal gene expression. Cell. 1996;87:1203–1214. doi: 10.1016/s0092-8674(00)81816-4. [DOI] [PubMed] [Google Scholar]
- 7.Buchanan RA, Leapman RD, O’Connell MF, Reese TS, Andrews SB. Quantitative scanning transmission electron microscopy of ultrathin cryosections: subcellular organelles in rapidly frozen liver and cerebellar cortex. J Struct Biol. 1993;110:244–255. doi: 10.1006/jsbi.1993.1027. [DOI] [PubMed] [Google Scholar]
- 8.Budd SL, Nicholls DG. A re-evaluation of the role of mitochondria in neuronal Ca2+ homeostasis. J Neurochem. 1996;66:403–411. doi: 10.1046/j.1471-4159.1996.66010403.x. [DOI] [PubMed] [Google Scholar]
- 9.Carafoli E. The calcium cycle of mitochondria. FEBS Lett. 1979;104:1–5. doi: 10.1016/0014-5793(79)81073-x. [DOI] [PubMed] [Google Scholar]
- 10.Carafoli E, Chiesi M, Gazzotti P. Membrane carriers related to intracellular calcium regulation. In: Laragh JH, Brenner BM, editors. Hypertension: pathophysiology, diagnosis and management, Ed 2. Raven; New York: 1995. pp. 1245–1259. [Google Scholar]
- 11.David G, Barrett JN, Barrett EF. Evidence that mitochondria buffer physiological Ca2+ loads in lizard motor nerve terminals. J Physiol (Lond) 1998;509:59–65. doi: 10.1111/j.1469-7793.1998.059bo.x. [DOI] [PMC free article] [PubMed] [Google Scholar]
- 12.Drummond RM, Fay FS. Mitochondria contribute to Ca2+ removal in smooth muscle cells. Pflügers Arch. 1996;431:473–482. doi: 10.1007/BF02191893. [DOI] [PubMed] [Google Scholar]
- 13.Evtodienko YV, Azarashvili TS, Kudin AP. Calcium binding to polypeptides of rat liver and Zajdela hepatoma mitochondrial inner membranes. FEBS Lett. 1998;423:45–48. doi: 10.1016/s0014-5793(98)00059-3. [DOI] [PubMed] [Google Scholar]
- 14.Friel DD, Tsien RW. A caffeine- and ryanodine-sensitive Ca2+ store in bullfrog sympathetic neurones modulates effects of Ca2+ entry on [Ca2+]i. J Physiol (Lond) 1992;450:217–246. doi: 10.1113/jphysiol.1992.sp019125. [DOI] [PMC free article] [PubMed] [Google Scholar]
- 15.Friel DD, Tsien RW. An FCCP-sensitive Ca2+ store in bullfrog sympathetic neurons and its participation in stimulus-evoked changes in [Ca2+]i. J Neurosci. 1994;14:4007–4024. doi: 10.1523/JNEUROSCI.14-07-04007.1994. [DOI] [PMC free article] [PubMed] [Google Scholar]
- 16.Fujimoto S, Yamamoto K, Kuba K, Morita K, Kato E. Calcium localization in the sympathetic ganglion of the bullfrog and effects of caffeine. Brain Res. 1980;202:21–32. [PubMed] [Google Scholar]
- 17.Grynkiewicz G, Poenie M, Tsien RY. A new generation of Ca2+ indicators with greatly improved fluorescence properties. J Biol Chem. 1985;260:3440–3450. [PubMed] [Google Scholar]
- 18.Gunter KK, Gunter TE. Transport of calcium by mitochondria. J Bioenerg Biomembr. 1994;26:471–485. doi: 10.1007/BF00762732. [DOI] [PubMed] [Google Scholar]
- 19.Gunter TE, Pfeiffer DR. Mechanisms by which mitochondria transport calcium. Am J Physiol. 1990;258:C755–C786. doi: 10.1152/ajpcell.1990.258.5.C755. [DOI] [PubMed] [Google Scholar]
- 20.Gunter TE, Rosier RN, Tucker DA, Gunter KK. Uptake of calcium and manganese by rat liver submitochondrial particles. Ann NY Acad Sci. 1978;307:246–247. doi: 10.1111/j.1749-6632.1978.tb41954.x. [DOI] [PubMed] [Google Scholar]
- 21.Gunter TE, Gunter KK, Sheu SS, Gavin CE. Mitochondrial calcium transport: physiological and pathological relevance. Am J Physiol. 1994;267:C313–C339. doi: 10.1152/ajpcell.1994.267.2.C313. [DOI] [PubMed] [Google Scholar]
- 22.Hajnoczky G, Robb-Gaspers LD, Seitz MB, Thomas AP. Decoding of cytosolic calcium oscillations in the mitochondria. Cell. 1995;82:415–424. doi: 10.1016/0092-8674(95)90430-1. [DOI] [PubMed] [Google Scholar]
- 23.Hall TA, Gupta BL. The localization and assay of chemical elements by microprobe methods. Q Rev Biophys. 1983;16:279–339. doi: 10.1017/s0033583500005114. [DOI] [PubMed] [Google Scholar]
- 24.Hernandez-Cruz A, Sala F, Adams PR. Subcellular calcium transients visualized by confocal microscopy in a voltage-clamped vertebrate neuron. Science. 1990;247:858–862. doi: 10.1126/science.2154851. [DOI] [PubMed] [Google Scholar]
- 25.Herrington J, Park YB, Babcock DF, Hille B. Dominant role of mitochondria in clearance of large Ca2+ loads from rat adrenal chromaffin cells. Neuron. 1996;16:219–228. doi: 10.1016/s0896-6273(00)80038-0. [DOI] [PubMed] [Google Scholar]
- 26.Horikawa Y, Goel A, Somlyo AP, Somlyo AV. Mitochondrial calcium in relaxed and tetanized myocardium. Biophys J. 1998;74:1579–1590. doi: 10.1016/S0006-3495(98)77869-5. [DOI] [PMC free article] [PubMed] [Google Scholar]
- 27.Hoth M, Fanger CM, Lewis RS. Mitochondrial regulation of store-operated calcium signaling in T lymphocytes. J Cell Biol. 1997;137:633–648. doi: 10.1083/jcb.137.3.633. [DOI] [PMC free article] [PubMed] [Google Scholar]
- 28.Hua SY, Nohmi M, Kuba K. Characteristics of Ca2+ release induced by Ca2+ influx in cultured bullfrog sympathetic neurons. J Physiol (Lond) 1993;464:245–272. doi: 10.1113/jphysiol.1993.sp019633. [DOI] [PMC free article] [PubMed] [Google Scholar]
- 29.Kitazawa T, Shuman H, Somlyo AP. Quantitative electron probe analysis: problems and solutions. Ultramicroscopy. 1983;11:251–261. [Google Scholar]
- 30.Lawrie AM, Rizzuto R, Pozzan T, Simpson AWM. A role for calcium influx in the regulation of mitochondrial calcium in endothelial cells. J Biol Chem. 1996;271:10753–10759. doi: 10.1074/jbc.271.18.10753. [DOI] [PubMed] [Google Scholar]
- 31.Leapman RD, Sun SQ, Hunt JA, Andrews SB. Biological electron energy loss spectroscopy in the field-emission STEM. Scanning Microsc [Suppl] 1994;8:245–259. [PubMed] [Google Scholar]
- 32.Lehninger AL. The mitochondrion: molecular basis of structure and function, pp 162–169. W. A. Benjamin; New York: 1964. [Google Scholar]
- 33.Lucas-Heron B, Le Ray B, Schmitt N. Does calmitine, a protein specific for the mitochondrial matrix of skeletal muscle, play a key role in mitochondrial function? FEBS Lett. 1995;374:309–311. doi: 10.1016/0014-5793(95)01122-u. [DOI] [PubMed] [Google Scholar]
- 34.McCormack JG, Browne HM, Dawes NJ. Studies of mitochondrial Ca2+-transport and matrix Ca2+ using fura-2-loaded rat heart mitochondria. Biochim Biophys Acta. 1989;973:163–171. doi: 10.1016/s0005-2728(89)80384-6. [DOI] [PubMed] [Google Scholar]
- 35.Miller RJ. Mitochondria: the Kraken wakes! Trends Neurosci. 1998;21:95–97. doi: 10.1016/s0166-2236(97)01206-x. [DOI] [PubMed] [Google Scholar]
- 36.Miyata H, Silverman HS, Sollott SJ, Lakatta EG, Stern MD, Hansford RG. Measurement of mitochondrial free Ca2+ concentration in living single rat cardiac myocytes. Am J Physiol. 1991;261:H1123–H1134. doi: 10.1152/ajpheart.1991.261.4.H1123. [DOI] [PubMed] [Google Scholar]
- 37.Moravec CS, Desnoyer RW, Milovanovic M, Schluchter MD, Bond M. Mitochondrial calcium content in isolated perfused heart: effects of inotropic stimulation. Am J Physiol. 1997;273:H1432–H1439. doi: 10.1152/ajpheart.1997.273.3.H1432. [DOI] [PubMed] [Google Scholar]
- 38.Nicholls D, Akerman K. Mitochondrial calcium transport. Biochim Biophys Acta. 1982;683:57–88. doi: 10.1016/0304-4173(82)90013-1. [DOI] [PubMed] [Google Scholar]
- 39.Nicholls DG. A role for the mitochondrion in the protection of cells against calcium overload? Prog Brain Res. 1985;63:97–106. doi: 10.1016/S0079-6123(08)61978-0. [DOI] [PubMed] [Google Scholar]
- 40.Peng YY. Effects of mitochondrion on calcium transients in intact presynaptic terminals depend on frequency of nerve firing. J Neurophysiol. 1998;80:186–195. doi: 10.1152/jn.1998.80.1.186. [DOI] [PubMed] [Google Scholar]
- 41.Pick J. The submicroscopic organization of the sympathetic ganglion in the frog (Rana pipiens). J Comp Neurol. 1963;120:409–462. doi: 10.1002/cne.901200304. [DOI] [PubMed] [Google Scholar]
- 42.Pivovarova NB, Hongpaisan J, Andrews SB, Friel DD. Depolarization-induced elevation of total mitochondrial calcium in sympathetic neurons. J Gen Physiol. 1998;112:39a. [Google Scholar]
- 43.Pozzo-Miller LD, Pivovarova NB, Leapman RD, Buchanan RA, Reese TS, Andrews SB. Activity-dependent calcium sequestration in dendrites of hippocampal neurons in brain slices. J Neurosci. 1997;17:8729–8738. doi: 10.1523/JNEUROSCI.17-22-08729.1997. [DOI] [PMC free article] [PubMed] [Google Scholar]
- 44.Rizzuto R, Simpson AWM, Brini M, Pozzan T. Rapid changes of mitochondrial Ca2+ revealed by specifically targeted recombinant aequorin. Nature. 1992;358:325–327. doi: 10.1038/358325a0. [DOI] [PubMed] [Google Scholar]
- 45.Rizzuto R, Bastianutto C, Brini M, Murgia M, Pozzan T. Mitochondrial Ca2+ homeostasis in intact cells. J Cell Biol. 1994;126:1183–1194. doi: 10.1083/jcb.126.5.1183. [DOI] [PMC free article] [PubMed] [Google Scholar]
- 46.Rizzuto R, Pinton P, Carrington W, Fay FS, Fogarty KE, Lifshitz LM, Tuft RA, Pozzan T. Close contacts with the endoplasmic reticulum as determinants of mitochondrial Ca2+ responses. Science. 1998;280:1763–1766. doi: 10.1126/science.280.5370.1763. [DOI] [PubMed] [Google Scholar]
- 47.Robb-Gaspers LD, Burnett P, Rutter GA, Denton RM, Rizzuto R, Thomas AP. Integrating cytosolic calcium signals into mitochondrial metabolic responses. EMBO J. 1998;17:4987–5000. doi: 10.1093/emboj/17.17.4987. [DOI] [PMC free article] [PubMed] [Google Scholar]
- 48.Roomans GM. Quantitative x-ray microanalysis of biological specimens. J Electron Microsc Tech. 1988;9:19–43. doi: 10.1002/jemt.1060090104. [DOI] [PubMed] [Google Scholar]
- 49.Sala F, Hernandez-Cruz A. Calcium diffusion modeling in a spherical neuron. Biophys J. 1990;57:313–324. doi: 10.1016/S0006-3495(90)82533-9. [DOI] [PMC free article] [PubMed] [Google Scholar]
- 50.Shi S, Sun S, Andrews SB, Leapman RD. Thickness measurement of hydrated and dehydrated cryosections by EELS. Microsc Res Tech. 1996;33:241–250. doi: 10.1002/(SICI)1097-0029(19960215)33:3<241::AID-JEMT1>3.0.CO;2-T. [DOI] [PubMed] [Google Scholar]
- 51.Shuman H, Somlyo AV, Somlyo AP. Quantitative electron probe microanalysis of biological thin sections: methods and validity. Ultramicroscopy. 1976;1:317–339. doi: 10.1016/0304-3991(76)90049-8. [DOI] [PubMed] [Google Scholar]
- 52.Somlyo AP. Cellular site of calcium regulation. Nature. 1984;309:516–517. doi: 10.1038/309516b0. [DOI] [PubMed] [Google Scholar]
- 53.Somlyo AP. Cell calcium measurement with electron probe and electron energy loss analysis. Cell Calcium. 1985;6:197–212. doi: 10.1016/0143-4160(85)90044-2. [DOI] [PubMed] [Google Scholar]
- 54.Somlyo AP, Somlyo AV, Shuman H. Electron probe analysis of vascular smooth muscle: composition of mitochondria, nuclei, and cytoplasm. J Cell Biol. 1979;81:316–335. doi: 10.1083/jcb.81.2.316. [DOI] [PMC free article] [PubMed] [Google Scholar]
- 55.Sparagna GC, Gunter KK, Sheu SS, Gunter TE. Mitochondrial calcium uptake from physiological-type pulses of calcium. J Biol Chem. 1995;270:27510–27515. doi: 10.1074/jbc.270.46.27510. [DOI] [PubMed] [Google Scholar]
- 56.Thayer SA, Miller RJ. Regulation of the intracellular free calcium concentration in single rat dorsal root ganglion neurones in vitro. J Physiol (Lond) 1990;425:85–115. doi: 10.1113/jphysiol.1990.sp018094. [DOI] [PMC free article] [PubMed] [Google Scholar]
- 57.Wendt-Gallitelli MF, Isenberg G. Total and free myoplasmic calcium during a contraction cycle: x-ray microanalysis in guinea-pig ventricular myocytes. J Physiol (Lond) 1991;435:349–372. doi: 10.1113/jphysiol.1991.sp018514. [DOI] [PMC free article] [PubMed] [Google Scholar]
- 58.White RJ, Reynolds IJ. Mitochondria and Na+/Ca2+ exchange buffer glutamate-induced calcium loads in cultured cortical neurons. J Neurosci. 1995;15:1318–1328. doi: 10.1523/JNEUROSCI.15-02-01318.1995. [DOI] [PMC free article] [PubMed] [Google Scholar]