

Abstract
The anterior forebrain pathway (AFP) of the oscine song system is essential for song learning but not song production. Most cells recorded in this serially connected pathway show increased firing in response to song playback, suggesting largely excitatory connections among AFP nuclei. However, the neurons forming a key projection in this pathway, from area X to the medial nucleus of the dorsolateral thalamus (DLM), express glutamic acid decarboxylase in their somata and terminals, suggesting an inhibitory connection. To investigate the firing properties of DLM neurons and the functional influence of area X afferents in DLM, we made whole-cell recordings from DLM neurons in brain slices from adult male zebra finches. Most cells had intrinsic properties closely resembling those of mammalian thalamocortical cells, including a low-threshold Ca2+ spike and time-dependent, hyperpolarization-activated inward rectification. Activation of afferents from area X evoked a strong, all-or-none IPSP whose amplitude and latency were unchanged by application of glutamate antagonists, consistent with a monosynaptic contact. The IPSP had a reversal potential near −70 mV and was blocked by the GABAA receptor antagonist bicuculline methiodide. Post-inhibitory rebound firing occurred in DLM neurons with a delay near 50 msec. Strong inhibition can combine with the intrinsic properties of DLM neurons to allow signaling on disinhibition. Our data are consistent with the hypothesis that the AFP corresponds to the mammalian corticobasal ganglia–thalamocortical loop. The similar functional properties of avian and mammalian thalamic neurons suggest conserved forebrain mechanisms of sensorimotor information processing across vertebrate taxa.
Keywords: songbird, area X, DLM, basal ganglia, GABA, Ca2+ spikes, post-inhibitory rebound, oscillation
Vocal learning in oscine songbirds provides a unique, experimentally accessible system for studying the mechanisms of motor learning. The system is especially tractable because of the identification of two major neural pathways with different functions. The primary motor pathway for song production includes nucleus HVc, nucleus robustus archistriatalis (RA), and brainstem motor and premotor nuclei controlling the syrinx and respiratory muscles (Fig.1A) (for review, seeKonishi, 1989; Brenowitz et al., 1997). Lesions in this pathway abolish song production (Nottebohm et al., 1976). The anterior forebrain pathway (AFP) indirectly connects HVc to RA, passing through area X, the medial nucleus of the dorsolateral thalamus (DLM) and the lateral nucleus of the anterior neostriatum (lMAN) (Bottjer et al., 1989). Lesions in the AFP in adults do not alter song production, but lesions in juveniles dramatically disrupt song learning (Bottjer et al., 1984;Sohrabji et al., 1990; Scharff and Nottebohm, 1991; Benton et al., 1998). Neurons in the AFP exhibit highly selective auditory responses (Doupe, 1993) and could provide auditory feedback to guide motor learning. AFP neurons also exhibit singing-associated electrical activity (Hessler and Doupe, 1997, 1999; Margoliash, 1997) and increased gene expression (Jarvis and Nottebohm, 1997).
Fig. 1.

Highly simplified schematic diagram of the song system and the slice preparation for DLM recording. A, Parasagittal view of the male zebra finch brain. The motor pathway includes HVc, RA, the tracheosyringeal portion of the hypoglossal nucleus (nXIIts), and brainstem premotor nuclei. The AFP includes area X,DLM, and lMAN. B, Slice preparation used for recording from DLM. Solid linesrepresent axons of area X neurons projecting to DLM. Large open circles represent somata of DLM neurons, and small filled circles represent terminals of area X projection neurons. Dashed lines represent axons of DLM neurons projecting to lMAN.
The AFP is often assumed to be essentially an excitatory relay loop providing an indirect pathway from HVc to RA. Recently, however, we found that the cell bodies and terminals forming the area X → DLM projection are immunoreactive for glutamic acid decarboxylase (GAD), the synthetic enzyme for the neurotransmitter GABA (Luo and Perkel, 1999). Because the terminals of the area X neurons in DLM tightly surround their target somata, the area X → DLM projection could have a powerful inhibitory effect on DLM neurons. Although usually inhibitory (for review, see Nicoll et al., 1990), GABAergic projections can be excitatory (Wagner et al., 1997), particularly in the developing nervous system (for review, see Ben-Ari et al., 1997). It is thus critical to test whether this connection is physiologically inhibitory and to determine the underlying synaptic mechanisms.
The striking intrinsic properties of thalamic neurons, such as the low-threshold Ca2+ spike and time-dependent inward rectification, are tightly conserved among mammals and are implicated in sensory and motor function, epilepsy, and sleep (Sherman and Guillery, 1996; McCormick and Bal, 1997). The Ca2+spike and other voltage-dependent conductances confer on thalamic neurons the capacity to generate postinhibitory rebound (PIR) as well as intrinsic oscillations (Steriade et al., 1993; Marder and Calabrese, 1996). Whether the properties of avian thalamic neurons resemble those of mammalian thalamic neurons is unknown, but such properties could dramatically alter the responses of DLM neurons to inhibitory inputs.
To investigate DLM neurons and their input from area X, we developed a novel in vitro slice preparation of nucleus DLM in the adult zebra finch. Whole-cell recordings revealed strong similarities between the intrinsic properties of DLM neurons and those of mammalian thalamic neurons. The area X → DLM connection is strongly inhibitory, mediated by GABAA receptors, and all-or-none. This combination of properties suggests that the AFP possesses rich mechanisms for processing temporal information.
MATERIALS AND METHODS
Slice preparation. All animals used were adult male zebra finches (Taeniopygia guttata, >120 d old) obtained from our breeding colony at the University of Pennsylvania or from a local breeder. All procedures used here were in accordance with a protocol approved by the Institutional Animal Care and Use Committee of the University of Pennsylvania. Slice preparation was similar to that described previously (Schmidt and Perkel, 1998). Briefly, birds were deeply anesthetized with halothane or isoflurane and decapitated. The brain was rapidly removed and blocked by cutting nearly parasagittally ∼4 mm from the midline with the blade angled anterolaterally ∼20° from the sagittal plane to enhance the preservation of inputs from area X to DLM. Next, the brain was cut midsagittally to separate the hemispheres. The lateral (cut) surface of each hemisphere was glued to the stage of a vibrating microtome, and 300-μm-thick slices were prepared. The artificial CSF (ACSF) used for slice preparation had NaCl replaced with sucrose (Aghajanian and Rasmussen, 1989) and contained (in mm): 238 sucrose, 1.3 KCl, 1.3 MgCl2, 2.5 CaCl2, 1.0 NaH2PO4, 26.2 NaHCO3, 11 glucose. Slices were incubated for 30 min in 30°C oxygenated solution with half of the NaCl replaced by sucrose and for at least 30 additional min at 22–25°C in normal NaCl recording solution, which was identical to the slicing solution except that it contained 119 mm NaCl and no sucrose.
Electrophysiological recording. For recording, slices were submerged and superfused with ACSF at 1–2 ml/min. Either sharp-electrode intracellular recording or whole-cell recording in current-clamp mode was performed at 22–25°C. All electrodes were pulled with a Sutter Instruments (Novato, CA) P-97 micropipette puller. For intracellular recording, electrodes were filled with 4m potassium acetate and had resistance of 150–250 MΩ. For whole-cell recording, electrodes were filled with a solution containing (in mm): 120 K-gluconate, 10 HEPES, 10 EGTA, 8 NaCl, 2 MgATP, and 0.3 Na3GTP, and typically had resistance of 5–12 MΩ. Recordings were scattered throughout DLM, whose borders could be clearly seen in the slice preparation. Whole-cell recordings were routinely obtained, with resting membrane potential and input resistance usually remaining stable for at least 45 min and sometimes up to 3 hr. A bipolar stainless-steel stimulating electrode (FHC Inc., Brunswick, ME; 2–5 MΩ) was placed within the axonal pathway anterior to DLM, 300–800 μm away from the anterior edge of the nucleus. Afferents were activated with a single pulse (100 μsec, 2–100 V) or tetanically. Because the axons entering DLM from area X and those leaving DLM to lMAN are intermingled, some DLM neurons were likely activated antidromically.
Signals were amplified using an Axoclamp 2B (Axon Instruments, Foster City, CA), low-pass-filtered at 2–5 kHz, and digitized at twice the filter cutoff frequency. Input resistance was monitored throughout the recording by injecting hyperpolarizing current pulses (0.01–0.1 nA) and measuring the voltage deflection. Only the cells with stable membrane potential and input resistance were analyzed. Except for those illustrating firing patterns, intracellular records are presented here as averages of three to five consecutive traces. Power spectral analysis was performed on 1024-point data segments, using the Matlab (Mathworks, Natick MA) built-in functions. Hanning windowing was used.
Histology. A subset of neurons were filled with neurobiotin (0.5%; Vector Laboratories, Burlingame, CA) included in the whole-cell patch recording electrodes. Slices were fixed with 4% formaldehyde, cryoprotected, and sectioned (60 μm) with a freezing microtome. Filled cells were visualized using avidin–HRP (ABC kit, Vector Laboratories) and 3′3′-diaminobenzidine tetra-hydrochloride (Sigma, St. Louis, MO) or the VIP substrate kit (Vector Laboratories), and the stained neural elements were drawn using a camera lucida.
Materials. Chemicals were obtained from Sigma or Fisher Scientific (Pittsburgh, PA) except as noted. The NMDA receptor antagonist dl-2-amino-5-phosphonovaleric acid (dl-APV) and the AMPA receptor antagonist 6-cyano-7-nitroquinoxaline-2,3-dione (CNQX) were obtained from Research Biochemicals (Natick, MA). The GABAB receptor antagonist CGP 35348 was a gift of CIBA Geigy (now Novartis; Basel, Switzerland). Stock solutions of CNQX were made in DMSO or NaOH. All drugs were added to the superfusion medium by dilution of a stock solution.
RESULTS
A total of 72 neurons were recorded in DLM of adult zebra finches, and 54 neurons met our criteria for further analysis: resting membrane potential at least −50 mV and at least some overshooting action potentials. Of these 54 neurons, three were recorded using sharp microelectrodes, and 51 were recorded using whole-cell recording in the current-clamp configuration. Although the intrinsic properties of neurons recorded with these two methods were similar, whole-cell recording produced much more reliable and stable recordings.
Intrinsic properties
We observed two major patterns of intrinsic properties. A majority of these neurons (n = 46/54) had intrinsic properties typical of thalamocortical (TC) neurons in other preparations (Deschênes et al., 1982; Llinás and Jahnsen, 1982;McCormick and Huguenard, 1992), and we refer to them here as type I cells. The other eight neurons had different intrinsic properties and are tentatively called type II cells. Measured values of several intrinsic properties used to classify the neurons are shown in Table1.
Table 1.
Intrinsic properties of DLM neurons
| Parameter measured | Type I (n = 41) | Type II (n = 8) |
|---|---|---|
| Resting membrane potential (mV) | −55.1 ± 4.7 | −56.9 ± 2.9 |
| Input resistance (MΩ)1-a | 419 ± 187 | 1212 ± 391 |
| Membrane time constant (msec)1-b | 23.2 ± 11.6 | 44.6 ± 10.8 |
| Spike duration at half amplitude (msec)1-a | 0.73 ± 0.22 | 1.70 ± 0.50 |
| Current to elicit first action potential (pA)1-a | 91 ± 61 | 20 ± 7 |
| Amplitude of fast AHP (mV)1-c | 18.5 ± 6.7 | 15.8 ± 4.2 |
| Time to reach the peak of fast AHP (msec)b,d | 1.55 ± 0.91 | 8.6 ± 7.4 |
Values given represent mean ± SD. AHP, after hyperpolarization.
Significant difference with p< 0.05.
Significant difference with p< 0.01.
AHP amplitude was measured from the spike take-off point to the peak of the AHP.
Time to peak of the fast AHP was measured from the time when, during the falling phase of the action potential, the membrane potential crossed the spike take-off point.
Compared with type I neurons, type II neurons had much higher input resistance, longer membrane time constant, broader spike, and lower threshold current to elicit an action potential, and they took much longer to reach the peak of the fast afterhyperpolarization (Table 1; Fig. 2A). Figure2A illustrates example action potential waveforms for these two cell types. A scatter plot of spike duration and current threshold shows the categorization of the two cell types (Fig.2B). In addition, type I cells always possessed a stereotyped anode-break response containing both Ca2+ and Na+ action potentials (see below). Type II neurons never exhibited such burst firing, and thus cell identification was unambiguous. We first describe in more detail the intrinsic properties of these two neuronal types, followed by the effects of activating the synaptic input from area X.
Fig. 2.

Two neuronal types observed in DLM.A, Sample action potentials from a type I and a type II neuron showing the greater spike duration in type II neurons.B, Cells could be categorized using three criteria: spike duration, threshold current to elicit firing, and presence of a Ca2+ spike (see Fig. 4). Scatter plotshows spike duration against threshold current to elicit firing for all DLM neurons recorded. Cells exhibiting Ca2+ spikes are represented by filled circles (type I). Cells with no Ca2+ spike are represented by open circles (type II).
Type I neurons
Spontaneous firing was usually not observed. In some cases, however, spontaneous firing (5–20 Hz) was observed extracellularly during seal formation, but this activity ceased on rupture of the membrane patch. The threshold amount of depolarizing current to elicit a single action potential ranged from 30 to 250 pA. When injected with suprathreshold currents, most of the neurons generated one or a few action potentials at the beginning of the current pulse (Fig.3A, top). This initial firing was usually followed by continuing slow depolarization and subthreshold oscillation of the membrane potential (n = 37/41). The subthreshold oscillation closely resembled that described by Pedroarena and Llinás (1997) in mammalian dorsal thalamic neurons. Larger depolarizing current pulses elicited a train of action potentials followed by more obvious subthreshold oscillations (30–80 Hz) (Fig.3A1–3,F,G), and then by fast, repetitive firing. In these cases, four to six trains of action potentials were observed within the 1.1 sec period of current injection. Stronger currents reduced the interval between the initial train and the later repetitive firing. When the currents injected reached a certain value, usually ∼0.2 nA, the neurons generated a continuous train of regular action potentials (100–200 Hz). Eight neurons exhibited an initial small amplitude, short duration depolarization, possibly an aborted action potential, and a delay before subsequent firing, especially when the amount of current was small. The curtailed depolarization suggests the existence of a transient outward current such asIA in at least some of the type I neurons (Fig.3B). Stronger current monotonically increased the overall firing rate during the current injection (Fig. 3C), without a marked increase in firing rate within each train. Rather, this increase was achieved mainly through decreasing the intertrain interval (Fig. 3D), because the interspike interval within each train changed only modestly as a function of current intensity. Figure3E shows a composite interspike interval histogram from one cell over a wide range of current intensities (30–130 pA). Except for a few large intervals between the trains of regular firing, the interspike intervals were mostly between 10 and 25 msec. The subthreshold oscillations (Fig. 3F) were periodic, with a main frequency near 47 Hz, as shown by power spectral analysis (Fig. 3G).
Fig. 3.

Firing properties of type I cells recorded in DLM.A, Response of a DLM neuron at rest to depolarizing current pulses of increasing intensity. Current was injected as follows: A1, 30 pA; A2, 50 pA; A3, 70 pA; A4, 130 pA. Box in A2 indicates the region illustrated at higher magnification in F.B, Response to depolarizing current pulse in a different cell, showing the delayed firing that was observed in eight type I cells. C, Monotonic relationship of average firing rate to current intensity. Pulse duration, 1.1 sec. Same cell as inA. D, Instantaneous firing rate (reciprocal interspike interval) for the tracesA2–4. E, Composite histogram of interspike intervals for action potentials elicited by depolarizing current pulses ranging from 30 to 130 pA (steps of 20 pA; three trials at each intensity). Most of the intervals fell between 10 and 25 msec. Larger gaps between periods of steady firing were usually >100 msec. Same cell as in A. F, Expanded view of subthreshold oscillations from box inA2. G, Power spectrum of segment shown in F. Peak power was at 47 Hz.
When hyperpolarized below −60 to −70 mV, all type I neurons switched to a burst firing mode, as observed in mammalian thalamic neurons (Jahnsen and Llinás, 1984a). The threshold current to elicit action potentials was substantially reduced, and a small depolarizing current injection elicited a broad action potential (Fig.4A), with a superimposed short burst of fast action potentials. Regular repetitive firing was never observed from hyperpolarized holding potentials. In addition, this stereotypical bursting activity was reliably elicited in every type I neuron after the termination of hyperpolarizing current injection (Fig. 4B). Application of the sodium channel blocker tetrodotoxin (TTX; 1 μm) eliminated the fast action potentials but not the broad action potential (n = 7/7). When neurons were hyperpolarized, these TTX-resistant broad action potentials could be activated with small depolarizing current pulses and appeared to have a take-off point near −60 mV (range, 52–64 mV). Their duration at half amplitude was 19.5 ± 4.8 msec (n = 7). After perfusion with Ca2+-free ACSF, the amplitude of these potentials was greatly reduced (Fig. 4C). Their dependence on previous hyperpolarization, resistance to TTX, dependence on Ca2+, long duration, and low threshold for activation strongly suggest that these broad action potentials were mediated by a low-threshold (T-type) Ca2+ current (IT), in accord with results in various thalamic neurons (Jahnsen and Llinás, 1984a,b; McCormick and Huguenard, 1992).
Fig. 4.

Burst firing from hyperpolarized potentials in type I DLM neurons is mediated by a Ca2+conductance. A, Responses of a DLM neuron to a depolarizing pulse of 90 pA delivered while the cell was at resting potential (A1) or hyperpolarized to −66 mV (A2). All type I neurons showed such a transition from tonic-firing to burst-firing mode when hyperpolarized. Calibration: same for A1,A2, and B. B, Burst firing in the same DLM neuron at anode-break. C, TTX resistance and Ca2+ dependence of the broad action potential, indicating that it is mediated by Ca2+.
During hyperpolarizing current pulses, we observed a time-dependent depolarizing sag in the membrane potential (n = 38/41 cells examined) (Fig. 5A). The peak hyperpolarization occurred 50–200 msec from the onset of the current pulse, and the relaxation to an asymptotic level had a time constant that depended on the degree of hyperpolarization (range, 40–750 msec). For hyperpolarizing pulses lasting at least 1.5 sec, the asymptotic membrane potential deflection at the end of the pulse was 70.4 ± 14.2% (range, 40–89%; n = 10) of the peak hyperpolarization. This hyperpolarization-activated depolarizing sag resembles that observed in mammalian TC cells and could reflect the action of a cation current known as Ih(McCormick and Pape, 1990). We asked whether Cs+, which blocks Ih in mammalian thalamic neurons (McCormick and Pape, 1990), also blocks the sag in DLM neurons. As in mammals, the sag was reversibly blocked by bath application of 10 mm Cs+ (asymptotic potential deflection 98 ± 2% of peak; n = 4) (Fig. 5).
Fig. 5.

Time-dependent inward rectification and rapid outward rectification in type I cells. A, Time-dependent inward rectification during hyperpolarization. Hyperpolarizing current pulses (10–110 pA, 20 pA intervals) delivered to a DLM neuron at rest caused a depolarizing sag during maintained current injection (Control). This hyperpolarization-activated depolarization was reversibly blocked by 10 mmCs+ applied in the bath (Cesium,Wash). B, Such depolarization could evoke burst firing when stronger hyperpolarizing current was injected or when the current injection was prolonged. The burst firing could be maintained at ∼1 Hz (range, 0.5–4 Hz) during prolonged injection of hyperpolarizing current. C, Expanded view of low-frequency oscillation evoked during steady hyperpolarization.B and C illustrate data from the same cell. D, Example traces from a different DLM neuron showing rapid outward rectification on depolarization. Action potentials were truncated in this illustration. E, Current–voltage relation showing both the outward and inward rectification for the cell in D. Open circles indicate the asymptotic membrane potential measured at the end of each current pulse. Filled circles for hyperpolarizing pulses indicate the peak potential deflection from rest. Line indicates the linear regression of asymptotic deflections (open circles) for hyperpolarizing current injections constrained to include the origin.
During prolonged hyperpolarization, this depolarizing sag led to spontaneous, low-frequency (0.5–4 Hz) burst firing (n= 8/8) (Fig. 5B,C). The firing consisted of calcium action potentials with fast sodium action potentials superimposed. This low-frequency oscillation was in the frequency range of delta waves and could arise from an interaction of IT with a time-dependent, hyperpolarization-activated inward current, such asIh (McCormick and Pape, 1990; Dossi et al., 1992; McCormick and Huguenard, 1992). In addition to the inward rectification, type I neurons showed rapid outward rectification in response to subthreshold depolarizing current pulses (Fig.5D,E).
Eight type I neurons were well filled with neurobiotin, and their distal dendrites could be observed clearly (Fig.6A). They had round somata ∼15 μm (10–30 μm) in diameter. They usually had three to six primary dendrites, which often branched close to the soma and formed bushy structures. The extremely fine dendrites were 50–250 μm long and were beaded with large varicosities (Fig.6B). In two cells, the axon was visible and provided evidence that the type I cells project to lMAN. In one DLM neuron, the axon exited the anterior border of DLM and could be followed approximately half the distance to lMAN. The axon of another DLM cell coursed anteriorly, traversing a portion of DLM, but left the plane of the slice before crossing the border of DLM. Because this axon did not make profuse local collaterals, it could represent an output axon to lMAN. Additional evidence that type I cells may be projection neurons comes from the fact that they were often antidromically activated by the stimulus anterior to DLM, whereas type II neurons were never antidromically activated (see below).
Fig. 6.

Morphology of type I neurons. A, Camera lucida drawing of a type I neuron filled with neurobiotin. The soma was nearly spherical, with a diameter of ∼25 μm. The dendrites were very fine and were beaded in appearance. B, Higher-power view of the varicose dendrites corresponding to thebox in A. Scale bars: A, 25 μm; B, 10 μm.
Type II neurons
Spontaneous depolarizing postsynaptic potentials were frequently observed in type II neurons, although spontaneous firing was rarely seen. During depolarizing pulses, type II neurons fired action potentials repetitively, the peak amplitude of the action potential gradually decreased, threshold gradually became higher, and the peak of each fast afterhyperpolarization became more depolarized (Fig.7A). With large current injections, the firing sometimes ceased (n = 3/8) (Fig.7A3), revealing membrane potential oscillations usually near 20 Hz (range 15–40 Hz). This oscillation was observed only during strong current injection and only after spike amplitude had decayed dramatically, suggesting a different mechanism from that seen in type I cells. The relationship of firing rate to injected current was relatively linear, except for this cessation of firing, which limited the maximum firing rate of type II neurons to below 50 Hz (Fig.7B). The interspike interval increased gradually during a current pulse, indicating some spike-frequency adaptation. Stronger currents reduced the interspike interval in a gradual manner (Fig.7C), resulting in a broad composite interspike interval histogram generated from current pulses of a range of intensities (Fig.7D). Small hyperpolarizing currents strongly hyperpolarized the cells; however, no anode-break firing was observed at the end of hyperpolarizing current pulses for most of the cells (n= 6/7) (Fig. 7E). One cell displayed an anode-break response consisting of one or two brief action potentials, in a manner distinct from the stereotypical Ca2+ spike observed in all type I neurons. We were unable to identify the morphology of type II cells.
Fig. 7.

Type II neurons exhibited membrane properties distinct from those of type I cells. A, Regular firing in a type II neuron in response to depolarizing current pulses of 10 pA (A1), 50 pA (A2), and 110 pA (A3). B, Firing rate increased linearly with increasing current intensity up to the point at which action potentials became inactivated. C, Instantaneous firing rate (reciprocal interspike interval) for the traces shown inA2 and A3. Firing rate varied smoothly within a sweep and between sweeps with different injected currents. Firing slowed throughout each current pulse.D, Ensemble histogram of interspike intervals for sweeps of 10, 30, 50, 70, 90, and 110 pA (3 sweeps each) illustrating broader variation in interspike intervals than seen in type I neurons (compare with Fig. 3E). E, Membrane potential change in response to hyperpolarizing current injection of 10, 20, and 30 pA. Type II neurons had much higher input resistance than most type I neurons. No Ca2+ spike was observed in any of these neurons after the end of hyperpolarizing current pulses.A–E illustrate data from the same cell.
Synaptic responses
Postsynaptic potentials (PSPs) were elicited in 20 neurons (16 of type I and 4 of type II). In general, it was difficult to elicit PSPs in DLM neurons by stimulating the axonal pathways entering DLM. Obtaining a response usually required changing the location of the stimulating electrode, and a substantial number of recordings were lost during this process.
In type I cells, a single stimulus evoked three classes of response: IPSP only (n = 6) (Fig.8A1), IPSP followed by EPSP (n = 6) (Fig.8A2), and EPSP only (n = 4) (Fig. 8A3). In type II cells, only an EPSP was observed (n = 4) (Fig.8A4). For the neurons in which a pure IPSP was elicited, co-application of the glutamate receptor antagonists CNQX (10 μm) and dl-APV (50 μm) did not significantly affect the IPSP amplitude (−9.6 ± 5.2 mV under control conditions vs −10.7 ± 6.0 mV in the presence of CNQX and APV; paired t test, p = 0.06;n = 6). The trend toward slightly greater IPSP amplitudes in the presence of CNQX and APV could reflect blockade of a small EPSP component hidden by the strong IPSP. For neurons with an IPSP followed by an EPSP, the EPSP was abolished by CNQX and APV, but the IPSP amplitude was not affected (−7.3 ± 3.0 mV vs −8.1 ± 3.5 mV, paired t test, p = 0.19;n = 6). For neurons in which only an EPSP was elicited, application of CNQX and APV totally blocked the EPSP (n= 8/8). Four of these cells were of type I, and in all of these cells, CNQX and APV unmasked an IPSP. The remaining four cells were of type II, and CNQX and APV blocked all responses (n = 4/4) (Fig. 8A4). The postsynaptic response classes are summarized in Figure 8B.
Fig. 8.
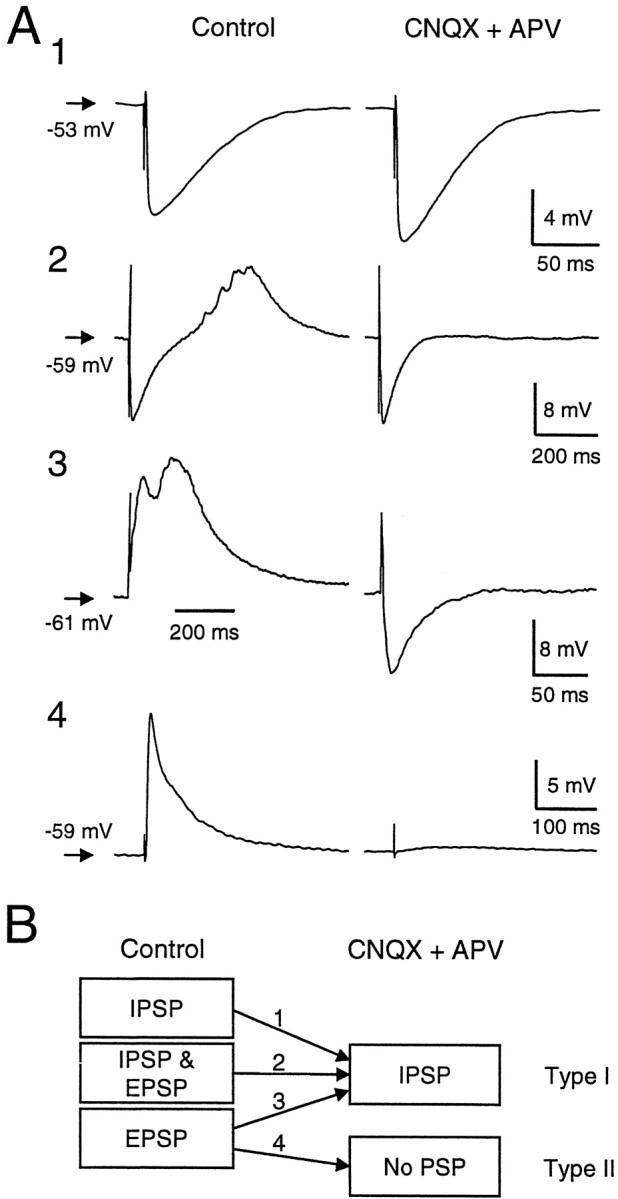
Synaptic responses in DLM neurons after activation of fibers anterior to DLM. A, Four examples illustrating the classes of responses observed. Left columnillustrates the postsynaptic potentials observed under control conditions. Right column shows responses to the same stimuli after addition of the ionotropic glutamate receptor antagonists CNQX (10 μm) and dl-APV (50 μm). A1–3 illustrate the response types observed in type I cells, in which an IPSP was observed after blockade of excitatory glutamatergic transmission.A4 illustrates the response type observed in type II cells, in which all synaptic responses were blocked by CNQX and APV. B, Schematic diagram showing that all cells in which an IPSP was observed in the presence of CNQX and APV were of type I. No IPSP was ever observed in type II cells.
At the resting membrane potential (range, −50–61 mV), the peak amplitude of the IPSP isolated with CNQX and APV was 8.2 ± 4.9 mV (range, −2.7–21.7 mV; n = 16). The latency to the onset of the isolated IPSP was 2.9 ± 1.3 msec. For each cell, we calculated the coefficient of variation of this latency to test for a monosynaptic response. The coefficient of variation was 0.08 ± 0.05 (range, 0–0.18), and the latency did not change before and after application of CNQX and APV (p = 0.43;n = 9), suggesting that the connections were monosynaptic. The decay time constant for the IPSP was 35.8 ± 18.6 msec, substantially longer than the membrane time constant for type I cells (n = 16; paired t test,p < 0.01).
All IPSPs observed were blocked by application of the GABAAreceptor antagonist bicuculline methiodide (BMI, 40 μm) (Fig. 9A). After application of BMI, the IPSP amplitude was 0.1 ± 0.67 mV (n = 14). The blockade by BMI was partially reversible (Fig. 9B). The reversal potential of the IPSP was measured in seven cells by eliciting an IPSP, while the membrane potential was held at different values (Fig. 10A). The relationship of IPSP amplitude to membrane potential was linear, and the reversal potential was −66.4 ± 3.0 mV (n= 7; range, −63.3–72.3 mV) (Fig. 10B), which was close to the calculated chloride equilibrium potential (−69.7 mV).
Fig. 9.
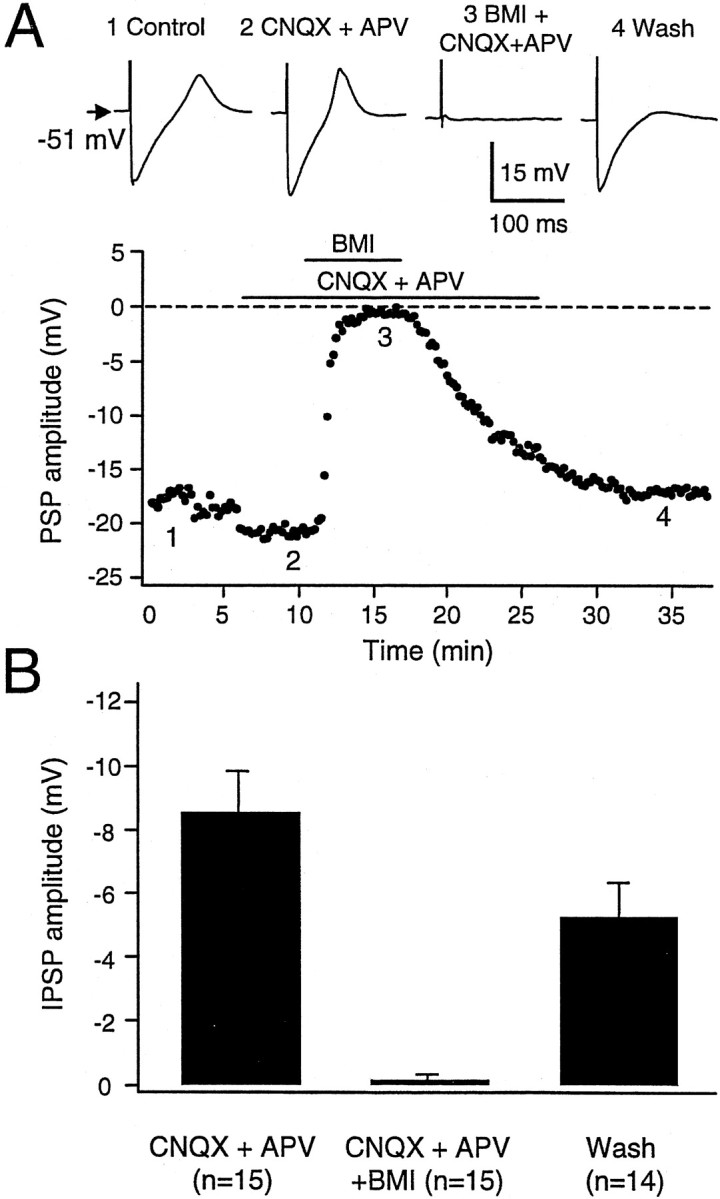
Blockade of the IPSP by the GABAAreceptor antagonist bicuculline methiodide (BMI; 40 μm). A, Synaptic stimulation caused an IPSP followed by a Ca2+ spike in a type I DLM neuron (1). Application of CNQX did not alter the IPSP (2). Addition of BMI abolished the IPSP (3), and this blockade was reversible on washout of BMI (4). Sample traces are taken from the times indicated in the graph of IPSP amplitude versus time in the experiment. B, Summary data indicating that BMI entirely abolished the IPSP in all 15 cells tested. Bars represent SEM.
Fig. 10.

The reversal potential of the IPSP was close to −70 mV. A, IPSP evoked in the presence of CNQX and APV in a type I neuron held at different membrane potentials by steady current injection. B, Plot of PSP amplitude against holding potential indicated an interpolated reversal potential of −68.4 mV.
The reversal potential of the IPSP and its complete blockade by BMI suggest that the IPSP is mediated exclusively by GABAAreceptors. To test for the presence of GABAB receptors, we applied the GABAB receptor agonist baclofen and observed no significant change in membrane potential (−2.2 ± 3.6 mV, pairedt test, p = 0.18; n = 6) or decrease in input resistance (4.8 ± 30.4 MΩ, p= 0.71) (Fig. 11).
Fig. 11.

The GABAB receptor agonist baclofen had little effect on the membrane potential of DLM neurons. Plot of membrane potential and input resistance for a type I cell showing a very small hyperpolarization (∼2 mV) in response to application of 30 μm baclofen.
In six of seven neurons tested, the IPSP amplitude showed an all-or-none pattern with varying stimulus intensity. As illustrated in Figure 12, stimuli below a certain level, 5 V in this case, did not elicit any IPSP. Slightly increasing the intensity (6 or 7 V) generated either a full-amplitude IPSP of approximately −22 mV, or no response. Greater intensities (8–50 V) reliably elicited IPSPs of the same amplitude. One cell showed two levels of IPSP amplitude. In contrast, the EPSPs elicited either in type I or type II neurons changed in a graded manner with varying stimulus intensity (data not shown).
Fig. 12.

The IPSP was all-or-none in amplitude with varying stimulus intensity. A, Sample traces recorded for stimuli of 5 V (1), 10 V (2), and 50 V (3).B, Plot of peak IPSP amplitude against stimulation strength. For this cell, no PSP was observed with stimuli below 6 V. With 6 and 7 V stimuli, the IPSP amplitudes were either close to 0 or −22 mV. Stimuli above 8 V reliably caused IPSPs of approximately −22 mV. Increasing the stimulus intensity did not change the amplitude of the IPSP. Same cell as in Figure 9A. In one cell a single intermediate IPSP amplitude was observed, consistent with activation of zero, one, or two afferent axons.
In four cells a PIR containing a Ca2+ spike was observed after a single evoked IPSP (Fig.13A). Because some area X neurons appear to fire spontaneously at 20–100 Hz (Doupe, 1997; M. A. Farries and D. J. Perkel, unpublished observation), we applied repetitive stimulation to examine the effect of more natural stimuli. Tetanic stimulation (1 sec, 100 Hz) delivered in the presence of CNQX and APV generated a prolonged inhibition in the DLM neurons. The amplitude of the individual IPSPs rapidly became attenuated, but there was a maintained hyperpolarization of 55% of the peak summated IPSP (n = 4). Cells showed PIR more reliably at the end of repetitive stimulation (n = 5/6) (Fig.13B). One cell failed to elicit any PIR, possibly because of the small IPSP amplitude (−4.3 mV).
Fig. 13.

Postinhibitory rebound could be observed after either single stimuli or tetanic stimulation. A, Firing after a single IPSP was evoked at a resting membrane potential of −52 mV. CNQX and APV were present to block excitatory glutamatergic transmission. Arrow indicates the time of stimulation. Four cells showed a Ca2+ spike after a single IPSP, but we did not systematically explore different holding potentials to try to elicit this phenomenon. B, Firing in a different cell at the end of 100 Hz tetanic stimulation. Such rebound firing was observed in five of six cells tested.
DISCUSSION
The main findings of this paper are the following: the connection from area X to DLM is strongly inhibitory and is mediated by GABAA receptors, and DLM neurons exhibit intrinsic properties similar to those reported for mammalian thalamic neurons. These results suggest that the functional properties of thalamic neurons are conserved across vertebrates, and they constrain the role of the AFP in song learning.
Inhibitory nature of the X → DLM connection
In nearly half of the DLM cells recorded, stimulation outside the nucleus caused an IPSP, which persisted in the presence of the glutamate receptor antagonists CNQX and APV. This resistance to blockers of glutamate receptors and the consistent IPSP latency strongly suggest that the IPSP is monosynaptic. The most likely source of the inputs is area X, because the somata and terminals of area X neurons projecting to DLM contain GAD and because area X lesions deplete GAD immunoreactivity in DLM (Luo and Perkel, 1999). Stimulation of putative GABAergic interneurons in DLM seems unlikely because we stimulated 300–800 μm from DLM and because we observed no GAD-immunoreactive somata in DLM (Luo and Perkel, 1999). Moreover, the all-or-none nature of the IPSP observed here is consistent with the claw-like morphology of the area X terminals in DLM. The DLM output axons were probably also stimulated in our experiments, because they are intermingled with the axons arriving from area X. Antidromic activation of the DLM projection neurons, which are glutamatergic (Livingston and Mooney, 1997; Boettiger and Doupe, 1998; Bottjer et al., 1998), could have contributed to the EPSPs via collateral axonal output within DLM. If so, the DLM neurons differ from mammalian TC cells in making local excitatory collaterals on other projection neurons (Jones, 1985). In the majority of our type I recordings (n = 14/16), the internal chloride concentration was determined by the pipette solution, and the chloride reversal potential was thus artificially determined. In two cells, however, which were recorded with sharp microelectrodes filled with potassium acetate, the synaptic response was still hyperpolarizing. Our data thus point to a strongly inhibitory, GABAA receptor-mediated connection from area X to DLM. This finding confirms and extends our previous anatomical evidence that this projection is GABAergic (Luo and Perkel, 1999). It will be important to test whether the same functional connection exists during song learning in juvenile animals.
Our data also indicate that single axons arriving in DLM from area X can evoke a large IPSP, effectively silencing the target DLM neuron. Usually only one level of response was activated by our stimulating electrode, suggesting a very low degree of convergence of these afferents onto DLM neurons. Area X is large, but because <1% of its neurons project to DLM (Sohrabji et al., 1993), only a few thousand area X neurons may make this projection. This is consistent with the apparently similar numbers of DLM neurons (Bottjer et al., 1989;Johnson and Bottjer, 1992; Sohrabji et al., 1993), and the fact that individual area X axons branch only a few times within DLM and that each branch effectively surrounds a DLM soma (Okuhata and Saito, 1987;Luo and Perkel, 1999).
The GABAergic, inhibitory nature of the projection from area X to DLM is consistent with the hypothesis that area X is part of the avian basal ganglia (Lewis et al., 1981; Bottjer, 1993; Soha et al., 1995;Luo and Perkel, 1999). The pallidothalamic projection in mammals is GABAergic and inhibitory (Gazzara et al., 1986; Difiglia and Rafols, 1988; Lavin and Grace, 1994), although the detailed cellular mechanism remains to be elucidated.
Conserved intrinsic properties in vertebrate thalamus
To our knowledge, our recordings provide the first description of the intrinsic properties of avian thalamic neurons. Intracellular recordings from TC neurons in various mammalian thalamic nuclei have revealed several common features, including low-threshold Ca2+ spikes and slow oscillatory behavior (Jahnsen and Llinás, 1984a; McCormick and Huguenard, 1992). This similarity in physiological properties suggests that thalamic neurons subserving different modalities may play similar computational roles, such as participation in generating thalamocortical oscillations (Steriade, 1997). Thalamic interneurons have intrinsic properties distinct from those of TC neurons (Pape and McCormick, 1995; Williams et al., 1996; Turner et al., 1997). The type I cells we recorded share many of the key features seen in mammalian TC cells, including low-threshold Ca2+ spikes, delta oscillations, burst firing patterns, and rapid outward rectification. Our data thus support a wide similarity in the functional properties of thalamic neurons across vertebrates. The fast (30–80 Hz) subthreshold oscillation and intermittent firing properties of DLM neurons are not always observed in TC cells and could reflect, in part, details of our preparation, such as room-temperature recording. However, fast subthreshold oscillation has been observed in mammalian reticular thalamic neurons (Contreras et al., 1992; Pinault and Deschênes, 1992), ventral anterior/ventrolateral complex (Steriade et al., 1991), and dorsal thalamus (Pedroarena and Llinás, 1997). Intermittent firing has also been observed in mammalian thalamic neurons (Pinault and Deschênes, 1992; Pedroarena and Llinás, 1997; Turner et al., 1997).
The type II neurons recorded here did not exhibit Ca2+ spikes and had additional features resembling those of thalamic interneurons recorded in lateral geniculate nucleus (Pape and McCormick, 1995; Williams et al., 1996) and ventrobasal thalamus (Turner et al., 1997). Our data suggest that cell-type heterogeneity in DLM may parallel that seen in mammals. However, the lack of GAD-immunoreactive somata in DLM suggests that type II cells are not GABAergic. Additional cell types might exist, because we observed some heterogeneity in the delayed firing among cells we classified as type I.
Implications for the song system
Superficially, our finding of an inhibitory connection from area X to DLM is difficult to reconcile with two observations: (1) most neurons in area X and lMAN show increased firing in response to effective auditory stimuli (Doupe and Konishi, 1991; Doupe, 1997; Solis and Doupe, 1997), and (2) during singing, neurons in HVc, area X, and lMAN show increased activity (Yu and Margoliash, 1996; Hessler and Doupe, 1997, 1999; Margoliash, 1997). Because the AFP nuclei are serially connected (Fig. 1A), concordant firing in these nuclei is apparently inconsistent with a single inhibitory projection within this pathway. However, both local circuitry within area X and the intrinsic properties of DLM neurons can resolve this apparent inconsistency (Luo and Perkel, 1999). For example, because of their specialized intrinsic properties, DLM neurons can fire a burst of action potentials at the end of an inhibitory barrage or possibly on substantial reduction of input firing rate.
The baseline state of area X projection neurons in vivo is not known. Similar to projection neurons in the mammalian internal segment of the globus pallidus (Kimura et al., 1996), many area X neurons, possibly including the projection neurons, are spontaneously active (Doupe, 1997; Margoliash, 1997; M. A. Farries and D. J. Perkel, unpublished observation). If the area X neurons projecting to DLM are tonically active, the type I DLM neurons must be tonically inhibited, as is suggested for mammalian motor thalamus (Chevalier and Deniau, 1990). If activity in HVc neurons excites the area X projection neurons, DLM neurons will be further inhibited and may fire through PIR at the end of the activity in HVc. Alternatively, if the AFP circuitry parallels that of the mammalian corticobasal ganglia–thalamocortical loop, HVc inputs might excite GABAergic interneurons in area X and thus inhibit the area X projection neurons. DLM neurons would thus be disinhibited, and their firing could commence after the PIR delay. In this case, the onset of firing in DLM would be caused by the beginning rather than the end of firing in HVc. Both of these simplified schemes depend critically on PIR firing, which is a major mode of activity in mammalian thalamic neurons (Deniau and Chevalier, 1985; Chevalier and Deniau, 1990; McCormick and Bal, 1997). Nevertheless, the 40–60 msec delay between the end of inhibition and PIR firing would substantially slow information transfer through the AFP. Regardless of the exact nature of the signal carried by the AFP, any models of AFP function will have to take this delay into account.
If the area X → DLM connection represents an output of avian basal ganglia, it may use similar processing mechanisms and accomplish similar functions as in mammals. The mammalian basal ganglia may play a role in learning motor sequences (Beiser and Houk, 1998; Berns and Sejnowski, 1998). Several aspects of song are learned, including syllable morphology, syllable order, and possibly syllable timing (Marler and Peters, 1981; Marler and Sherman, 1983; Scharff and Nottebohm, 1991). A GABAergic projection to DLM, coupled with the recursive connection from lMAN to area X, could enable the AFP to integrate neural signals over long time scales. Conserved functional properties of thalamic neurons and their inputs from basal ganglia suggest that these structures in birds and mammals use similar neural algorithms for motor learning. Because song provides a discrete, relatively simple behavior, studying the interactions of area X with DLM may reveal general principles of basal ganglia and thalamic function.
Footnotes
This work was supported by National Institutes of Health Grant MH56646 and National Science Foundation Grant IBN98-17889 to D.J.P. We thank Huan Vu for his assistance with sharp electrode recording. We also thank Dr. Diego Contreras, Dr. Laura Stark, Michael Farries, and Long Ding for helpful comments on this manuscript.
Correspondence should be addressed to Dr. David J. Perkel, Department of Neuroscience, 215 Stemmler Hall, University of Pennsylvania, Philadelphia, PA 19104-6074.
REFERENCES
- 1.Aghajanian GK, Rasmussen K. Intracellular studies in the facial nucleus illustrating a simple new method for obtaining viable motoneurons in adult rat brain slices. Synapse. 1989;3:331–338. doi: 10.1002/syn.890030406. [DOI] [PubMed] [Google Scholar]
- 2.Beiser DG, Houk JC. Model of cortical-basal ganglionic processing: encoding the serial order of sensory events. J Neurophysiol. 1998;79:3168–3188. doi: 10.1152/jn.1998.79.6.3168. [DOI] [PubMed] [Google Scholar]
- 3.Ben-Ari Y, Khazipov R, Leinekugel X, Caillard O, Gaiarsa J-L. GABAA, NMDA and AMPA receptors: a developmentally regulated “ménage à trois”. Trends Neurosci. 1997;20:523–529. doi: 10.1016/s0166-2236(97)01147-8. [DOI] [PubMed] [Google Scholar]
- 4.Benton S, Nelson DA, Marler P, DeVoogd TJ. Anterior forebrain pathway is needed for stable song expression in adult male white-crowned sparrows (Zonotrichia leucophrys). Behav Brain Res. 1998;96:135–150. doi: 10.1016/s0166-4328(98)00011-4. [DOI] [PubMed] [Google Scholar]
- 5.Berns GS, Sejnowski TJ. A computational model of how the basal ganglia produce sequences. J Cognit Neurosci. 1998;10:108–121. doi: 10.1162/089892998563815. [DOI] [PubMed] [Google Scholar]
- 6.Boettiger CA, Doupe AJ. Intrinsic and thalamic excitatory inputs onto songbird LMAN neurons differ in their pharmacological and temporal properties. J Neurophysiol. 1998;79:2615–2628. doi: 10.1152/jn.1998.79.5.2615. [DOI] [PubMed] [Google Scholar]
- 7.Bottjer SW. The distribution of tyrosine hydroxylase immunoreactivity in the brains of male and female zebra finches. J Neurobiol. 1993;24:51–69. doi: 10.1002/neu.480240105. [DOI] [PubMed] [Google Scholar]
- 8.Bottjer SW, Miesner EA, Arnold AP. Forebrain lesions disrupt development but not maintenance of song in passerine birds. Science. 1984;224:901–903. doi: 10.1126/science.6719123. [DOI] [PubMed] [Google Scholar]
- 9.Bottjer SW, Halsema KA, Brown SA, Miesner EA. Axonal connections of a forebrain nucleus involved with vocal learning in zebra finches. J Comp Neurol. 1989;279:312–326. doi: 10.1002/cne.902790211. [DOI] [PubMed] [Google Scholar]
- 10.Bottjer SW, Brady JD, Walsh JP. Intrinsic and synaptic properties of neurons in the vocal-control nucleus lMAN from in vitro slice preparations of juvenile and adult zebra finches. J Neurobiol. 1998;37:642–658. [PubMed] [Google Scholar]
- 11.Brenowitz EA, Margoliash D, Nordeen KW. An introduction to birdsong and the avian song system. J Neurobiol. 1997;33:495–500. [PubMed] [Google Scholar]
- 12.Chevalier G, Deniau JM. Disinhibition as a basic process in the expression of striatal functions. Trends Neurosci. 1990;13:277–280. doi: 10.1016/0166-2236(90)90109-n. [DOI] [PubMed] [Google Scholar]
- 13.Contreras D, Curró Dossi R, Steriade M. Bursting and tonic discharges in two classes of reticular thalamic neurons. J Neurophysiol. 1992;68:973–977. doi: 10.1152/jn.1992.68.3.973. [DOI] [PubMed] [Google Scholar]
- 14.Deniau JM, Chevalier G. Disinhibition as a basic process in the expression of striatal functions. II. The striatonigral influence on thalamocortical cells of the ventromedial thalamic nucleus. Brain Res. 1985;334:227–233. doi: 10.1016/0006-8993(85)90214-8. [DOI] [PubMed] [Google Scholar]
- 15.Deschênes M, Roy JP, Steriade M. Thalamic bursting mechanism: an inward slow current revealed by membrane hyperpolarization. Brain Res. 1982;239:289–293. doi: 10.1016/0006-8993(82)90854-x. [DOI] [PubMed] [Google Scholar]
- 16.Difiglia M, Rafols JA. Synaptic organization of the globus pallidus. J Electron Micr Tech. 1988;10:247–263. doi: 10.1002/jemt.1060100304. [DOI] [PubMed] [Google Scholar]
- 17.Dossi RC, Nunez A, Steriade M. Electrophysiology of a slow (0.5–4 Hz) intrinsic oscillation of cat thalamocortical neurones in vivo. J Physiol (Lond) 1992;447:215–234. doi: 10.1113/jphysiol.1992.sp018999. [DOI] [PMC free article] [PubMed] [Google Scholar]
- 18.Doupe AJ. A neural circuit specialized for vocal learning. Curr Opin Neurobiol. 1993;3:104–111. doi: 10.1016/0959-4388(93)90043-x. [DOI] [PubMed] [Google Scholar]
- 19.Doupe AJ. Song- and order-selective neurons in the songbird anterior forebrain and their emergence during vocal development. J Neurosci. 1997;17:1147–1167. doi: 10.1523/JNEUROSCI.17-03-01147.1997. [DOI] [PMC free article] [PubMed] [Google Scholar]
- 20.Doupe AJ, Konishi M. Song-selective auditory circuits in the vocal control system of the zebra finch. Proc Natl Acad Sci USA. 1991;88:11339–11343. doi: 10.1073/pnas.88.24.11339. [DOI] [PMC free article] [PubMed] [Google Scholar]
- 21.Gazzara RA, Fisher RS, Levine MS, Hull CD, Buchwald NA. Physiological and morphological analyses of ventral anterior and ventral lateral thalamic neurons in the cat. Brain Res. 1986;397:225–237. doi: 10.1016/0006-8993(86)90623-2. [DOI] [PubMed] [Google Scholar]
- 22.Hessler NA, Doupe AJ. Singing-related neural activity in anterior forebrain nuclei of adult zebra finch. Soc Neurosci Abstr. 1997;23:245. doi: 10.1523/JNEUROSCI.19-23-10461.1999. [DOI] [PMC free article] [PubMed] [Google Scholar]
- 23.Hessler NA, Doupe AJ. Social context modulates singing-related neural activity in the songbird forebrain. Nature Neurosci. 1999;2:209–211. doi: 10.1038/6306. [DOI] [PubMed] [Google Scholar]
- 24.Jahnsen H, Llinás R. Electrophysiological properties of guinea-pig thalamic neurones: an in vitro study. J Physiol (Lond) 1984a;349:205–226. doi: 10.1113/jphysiol.1984.sp015153. [DOI] [PMC free article] [PubMed] [Google Scholar]
- 25.Jahnsen H, Llinás R. Ionic basis for the electroresponsiveness and oscillatory properties of guinea-pig thalamic neurones in vitro. J Physiol (Lond) 1984b;349:227–247. doi: 10.1113/jphysiol.1984.sp015154. [DOI] [PMC free article] [PubMed] [Google Scholar]
- 26.Jarvis ED, Nottebohm F. Motor-driven gene expression. Proc Natl Acad Sci USA. 1997;94:4097–4102. doi: 10.1073/pnas.94.8.4097. [DOI] [PMC free article] [PubMed] [Google Scholar]
- 27.Johnson F, Bottjer SW. Growth and regression of thalamic efferents in the song-control system of male zebra finches. J Comp Neurol. 1992;326:442–450. doi: 10.1002/cne.903260309. [DOI] [PubMed] [Google Scholar]
- 28.Jones EG. The thalamus. Plenum; New York: 1985. [Google Scholar]
- 29.Kimura M, Kato M, Shimazaki H, Watanabe K, Matsumoto N. Neural information transferred from the putamen to the globus pallidus during learned movement in the monkey. J Neurophysiol. 1996;76:3771–3786. doi: 10.1152/jn.1996.76.6.3771. [DOI] [PubMed] [Google Scholar]
- 30.Konishi M. Birdsong for neurobiologists. Neuron. 1989;3:541–549. doi: 10.1016/0896-6273(89)90264-x. [DOI] [PubMed] [Google Scholar]
- 31.Lavin A, Grace AA. Modulation of dorsal thalamic cell activity by the ventral pallidum: its role in the regulation of thalamocortical activity by the basal ganglia. Synapse. 1994;18:104–127. doi: 10.1002/syn.890180205. [DOI] [PubMed] [Google Scholar]
- 32.Lewis JW, Ryan SM, Butcher LL, Arnold AP. Evidence for a catecholaminergic projection to area X in the zebra finch. J Comp Neurol. 1981;196:347–354. doi: 10.1002/cne.901960212. [DOI] [PubMed] [Google Scholar]
- 33.Livingston FS, Mooney R. Development of intrinsic and synaptic properties in a forebrain nucleus essential to avian song learning. J Neurosci. 1997;17:8997–9009. doi: 10.1523/JNEUROSCI.17-23-08997.1997. [DOI] [PMC free article] [PubMed] [Google Scholar]
- 34.Llinás R, Jahnsen H. Electrophysiology of mammalian thalamic neurones in vitro. Nature. 1982;197:106–108. doi: 10.1038/297406a0. [DOI] [PubMed] [Google Scholar]
- 35.Luo M, Perkel DJ. Long-range GABAergic projection in a circuit essential for vocal learning. J Comp Neurol. 1999;403:68–84. [PubMed] [Google Scholar]
- 36.Marder E, Calabrese R. Principles of rhythmic motor pattern generation. Physiol Rev. 1996;76:687–717. doi: 10.1152/physrev.1996.76.3.687. [DOI] [PubMed] [Google Scholar]
- 37.Margoliash D. Functional organization of forebrain pathways for song production and perception. J Neurobiol. 1997;33:671–693. doi: 10.1002/(sici)1097-4695(19971105)33:5<671::aid-neu12>3.0.co;2-c. [DOI] [PubMed] [Google Scholar]
- 38.Marler P, Peters S. Sparrows learn adult song and more from memory. Science. 1981;213:780–782. doi: 10.1126/science.213.4509.780. [DOI] [PubMed] [Google Scholar]
- 39.Marler P, Sherman V. Song structure without auditory feedback: emendations of the auditory template hypothesis. J Neurosci. 1983;3:517–531. doi: 10.1523/JNEUROSCI.03-03-00517.1983. [DOI] [PMC free article] [PubMed] [Google Scholar]
- 40.McCormick DA, Bal T. Sleep and arousal: thalamocortical mechanisms. Annu Rev Neurosci. 1997;20:185–215. doi: 10.1146/annurev.neuro.20.1.185. [DOI] [PubMed] [Google Scholar]
- 41.McCormick DA, Huguenard JR. A model of the electrophysiological properties of thalamocortical relay neurons. J Neurophysiol. 1992;68:1384–1400. doi: 10.1152/jn.1992.68.4.1384. [DOI] [PubMed] [Google Scholar]
- 42.McCormick DA, Pape H-C. Properties of a hyperpolarization-activated cation current and its role in rhythmic oscillation in thalamic relay neurones. J Physiol (Lond) 1990;431:291–318. doi: 10.1113/jphysiol.1990.sp018331. [DOI] [PMC free article] [PubMed] [Google Scholar]
- 43.Nicoll RA, Malenka RC, Kauer JA. Functional comparison of neurotransmitter receptor subtypes in the mammalian central nervous system. Physiol Rev. 1990;70:513–565. doi: 10.1152/physrev.1990.70.2.513. [DOI] [PubMed] [Google Scholar]
- 44.Nottebohm F, Stokes TM, Leonard CM. Central control of song in the canary, Serinus canarius. J Comp Neurol. 1976;165:457–486. doi: 10.1002/cne.901650405. [DOI] [PubMed] [Google Scholar]
- 45.Okuhata S, Saito N. Synaptic connections of thalamo-cerebral vocal nuclei of the canary. Brain Res Bull. 1987;18:35–44. doi: 10.1016/0361-9230(87)90031-1. [DOI] [PubMed] [Google Scholar]
- 46.Pape H-C, McCormick DA. Electrophysiological and pharmacological properties of interneurons in the cat dorsal lateral geniculate nucleus. Neuroscience. 1995;68:1105–1125. doi: 10.1016/0306-4522(95)00205-w. [DOI] [PubMed] [Google Scholar]
- 47.Pedroarena C, Llinás R. Dendritic calcium conductances generate high-frequency oscillation in thalamocortical neurons. Proc Natl Acad Sci USA. 1997;94:724–728. doi: 10.1073/pnas.94.2.724. [DOI] [PMC free article] [PubMed] [Google Scholar]
- 48.Pinault D, Deschênes M. Voltage-dependent 40-Hz oscillation in rat reticular thalamic neurons in vivo. Neuroscience. 1992;51:245–258. doi: 10.1016/0306-4522(92)90312-p. [DOI] [PubMed] [Google Scholar]
- 49.Scharff C, Nottebohm F. A comparative study of the behavior deficits following lesions of various parts of the zebra finch song system: implications for vocal learning. J Neurosci. 1991;11:2896–2913. doi: 10.1523/JNEUROSCI.11-09-02896.1991. [DOI] [PMC free article] [PubMed] [Google Scholar]
- 50.Schmidt MF, Perkel DJ. Slow synaptic inhibition in nucleus HVc of the adult zebra finch. J Neurosci. 1998;18:895–904. doi: 10.1523/JNEUROSCI.18-03-00895.1998. [DOI] [PMC free article] [PubMed] [Google Scholar]
- 51.Sherman SM, Guillery RW. Functional organization of thalamocortical relays. J Neurophysiol. 1996;76:1367–1395. doi: 10.1152/jn.1996.76.3.1367. [DOI] [PubMed] [Google Scholar]
- 52.Soha J, Shimizu T, Doupe AJ. Development of the catecholaminergic innervation of the song system of the male zebra finch. J Neurobiol. 1995;29:473–489. doi: 10.1002/(SICI)1097-4695(199604)29:4<473::AID-NEU5>3.0.CO;2-5. [DOI] [PubMed] [Google Scholar]
- 53.Sohrabji F, Nordeen EJ, Nordeen KW. Selective impairment of song learning following lesions of a forebrain nucleus in juvenile zebra finches. Behav Neural Biol. 1990;53:51–63. doi: 10.1016/0163-1047(90)90797-a. [DOI] [PubMed] [Google Scholar]
- 54.Sohrabji F, Nordeen EJ, Nordeen KW. Characterization of neurons born and incorporated into a vocal control nucleus during avian song learning. Brain Res. 1993;620:335–338. doi: 10.1016/0006-8993(93)90176-n. [DOI] [PubMed] [Google Scholar]
- 55.Solis MM, Doupe AJ. Anterior forebrain neurons develop selectivity by an intermediate stage of birdsong learning. J Neurosci. 1997;17:6447–6462. doi: 10.1523/JNEUROSCI.17-16-06447.1997. [DOI] [PMC free article] [PubMed] [Google Scholar]
- 56.Steriade M. Synchronized activities of coupled oscillators in the cerebral cortex and thalamus at different levels of vigilance. Cereb Cortex. 1997;7:583–604. doi: 10.1093/cercor/7.6.583. [DOI] [PubMed] [Google Scholar]
- 57.Steriade M, Curró Dossi R, Paré D, Oakson G. Fast oscillations (20–40 Hz) in thalamocortical systems and their potentiation by mesopontine cholinergic nuclei in the cat. Proc Natl Acad Sci USA. 1991;88:4396–4400. doi: 10.1073/pnas.88.10.4396. [DOI] [PMC free article] [PubMed] [Google Scholar]
- 58.Steriade M, McCormick DA, Sejnowski TJ. Thalamocortical oscillations in the sleeping and aroused brain. Science. 1993;262:679–685. doi: 10.1126/science.8235588. [DOI] [PubMed] [Google Scholar]
- 59.Turner JP, Anderson CM, Williams SR, Crunelli V. Morphology and membrane properties of neurones in the cat ventrobasal thalamus in vitro. J Physiol (Lond) 1997;505:707–726. doi: 10.1111/j.1469-7793.1997.707ba.x. [DOI] [PMC free article] [PubMed] [Google Scholar]
- 60.Wagner S, Castel M, Gainer H, Yarom Y. GABA in the mammalian suprachiasmatic nucleus and its role in diurnal rhythmicity. Nature. 1997;387:598–603. doi: 10.1038/42468. [DOI] [PubMed] [Google Scholar]
- 61.Williams SR, Turner JP, Anderson CM, Crunelli V. Electrophysiological and morphological properties of interneurones in the rat dorsal lateral geniculate nucleus in vitro. J Physiol (Lond) 1996;490:129–147. doi: 10.1113/jphysiol.1996.sp021131. [DOI] [PMC free article] [PubMed] [Google Scholar]
- 62.Yu AC, Margoliash D. Temporal hierarchical control of singing in birds. Science. 1996;273:1871–1875. doi: 10.1126/science.273.5283.1871. [DOI] [PubMed] [Google Scholar]