

Abstract
Fast neurotransmitter release is driven by high calcium (10–100 μm) near open channels (Calocal), followed by a much smaller (<1 μm), longer-lasting residual calcium (Cares). The most prominent component of release, phasic release, lasts several milliseconds and is thought to be triggered by Calocal. A transient tail of release then continues over the next 20 msec at 1–10% of peak rates. This transient component of release, which we refer to as TR, is poorly understood, and there is conflicting evidence regarding the role of Calocal and Cares in its generation. We used optical methods to monitor Cares and whole-cell voltage-clamp recordings to study TR at synapses between granule cells and stellate cells in rat cerebellar slices. After stimulation the probability of release is elevated greatly, peaking at 500 μsec and then slowly declining to prestimulus levels after tens of milliseconds. After speeding the decay of Cares levels with EGTA, release is confined to a 3 msec interval, and TR is eliminated. Thus, we find that Cares accounts for a transient tail of release on the millisecond time scale that helps to shape the average synaptic current and accounts for at least 20% of the synaptic charge in the 20 msec interval after stimulation. Cares-dependent TR is likely to contribute significantly to fast synaptic transmission under physiological conditions, particularly during high-frequency bursts that elevate Cares.
Keywords: phasic release, delayed release, synaptic transmission, residual calcium, EPSC time course, cerebellum, granule cell, stellate cell
After action potential invasion, peak rates of neurotransmitter release are often >105 times the basal rates of spontaneous release (Magleby, 1987) and last only several milliseconds; this component of release often is referred to as phasic release. By tens to hundreds of milliseconds after action potential invasion, release still continues but at a much lower rate, typically 0.01–1% of peak rates. Such prolonged release is known as delayed release (DR) (Miledi and Thies, 1971; Barrett and Stevens, 1972; Rahamimoff and Yaari, 1973; Zucker and Lara-Estrella, 1983; Cohen and Van der Kloot, 1986; Van der Kloot and Molgo, 1994). At intermediate times the release rates are 1–10% of peak rates; for convenience we will refer to this phase of release (from 3 to 20 msec after the onset of release) as transient release (TR). TR helps to shape the EPSC (Van der Kloot, 1988) and contributes to a significant fraction of the total synaptic charge delivered to a postsynaptic cell, thereby prolonging the influence of a presynaptic cell on the firing of its targets. Although TR has been observed at many types of synapses (Katz and Miledi, 1964, 1965; Diamond and Jahr, 1995; Isaacson and Walmsley, 1995), the factors governing this component of release remain poorly understood.
To determine the mechanism underlying TR, we focused on the possible role of presynaptic calcium. When an action potential invades a presynaptic bouton, it opens calcium channels, giving rise to a locally high calcium signal (10–100 μm) near open channels (Calocal) (Chad and Eckert, 1984; Fogelson and Zucker, 1985; Simon and Llinás, 1985; Roberts et al., 1990;Matthews, 1996). As the calcium equilibrates throughout the bouton, a much smaller (<1 μm), longer-lasting residual calcium signal persists (Cares) (Delaney et al., 1989;Regehr and Atluri, 1995; Feller et al., 1996; Helmchen et al., 1997;Ravin et al., 1997). It has been shown that phasic release is triggered by Calocal (Adler et al., 1991; Schweizer et al., 1995;Matthews, 1996), whereas delayed release is driven by Cares(Delaney et al., 1989; Van der Kloot and Molgo, 1993; Cummings et al., 1996; Ravin et al., 1997; Atluri and Regehr, 1998). However, the relationship between presynaptic calcium and TR is unclear. Two mechanisms involving presynaptic calcium could account for TR. The first possibility is that TR is primarily a reflection of a calcium-dependent process with slow kinetics driven by Calocal, with no Cares contribution. The alternative possibility is that Cares contributes to TR in the same manner that it drives DR.
There is conflicting evidence regarding the role of Caresin TR. Arguments against Cares involvement emphasize the difficulty in reconciling the known calcium dependence of release with a role for Cares. In granule cells several milliseconds after action potential invasion, Cares levels are only a few hundred nanomolars (Regehr and Atluri, 1995), which is well below the 10–100 μm threshold thought to be required to obtain significant rates of release (Fogelson and Zucker, 1985; Simon and Llinás, 1985; Roberts et al., 1990; Heidelberger et al., 1994). Furthermore, the rates of DR after single stimuli are typically thousands of times smaller than peak release rates. These results suggest that Cares-driven release may not contribute significantly to the EPSC. On the other hand, recent observations support a possible role for Cares in TR. Introduction of relatively low concentrations of the slow calcium chelator EGTA, which affects Cares much more than Calocal, reduces phasic neurotransmitter release at the calyx of Held (Borst and Sakmann, 1996). Moreover, our previous studies suggest that accelerating Cares decay may speed the decay of synaptic currents (Atluri and Regehr, 1998). These observations suggest Cares may play a role in TR.
Although it has been proposed previously that Cares could contribute to release on rapid time scales, there is little direct information on the contribution of Cares to TR (Magleby, 1987). Most previous studies have focused on the hundreds of milliseconds to seconds after brief trains of presynaptic activity (Hubbard, 1963; Miledi and Thies, 1971; Erulkar and Rahamimoff, 1978;Zengel and Magleby, 1981; Zucker and Lara-Estrella, 1983; Ravin et al., 1997). DR also has been examined after single stimuli, but typically these studies focused on longer time scales and were not designed to provide information on the tens of milliseconds time scale (Barrett and Stevens, 1972; Van der Kloot and Molgo, 1993; Goda and Stevens, 1994;Atluri and Regehr, 1998).
We tested the involvement of Cares in TR at synapses between granule cells and stellate cells in rat cerebellar slices. By using low stimulus intensities, we were able to detect quantal events and determine the release probability as a function of time after stimulation. In response to low-frequency stimulation the probability of release is elevated transiently, peaks 500 μsec later, and then slowly declines to prestimulus levels. After speeding the decay of Cares, release was confined to a 3 msec interval, and later release events were eliminated. These results indicate that Cares-sensitive release helps to shape the EPSC and contributes a significant fraction of the total synaptic charge.
MATERIALS AND METHODS
Electrophysiology. Transverse slices (300 μm) from the cerebellar vermis of postnatal day (P) P14–P19 rats (Harlan, Indianapolis, IN) were cut as described previously (Konnerth et al., 1990; Atluri and Regehr, 1998). Slices were maintained in an oxygenated (95% O2/5% CO2) external solution containing (in mm): 125 NaCl, 2.5 KCl, 2.6 NaHCO3, 1.25 NaH2PO4, 25 glucose, 2 CaCl2, and 1 MgCl2. The external recording solution also contained 20 μmbicuculline (Sigma, St. Louis, MO) and 100 μm AP5 (2-amino-5-phosphonopentanoic acid; Research Biochemicals, Natick, MA). In experiments involving low calcium, the external solution contained 1 mm Ca and 2 mm Mg. EGTA-acetoxymethyl ester (AM; Molecular Probes, Eugene, OR) was dissolved in dimethyl sulfoxide (DMSO) and used as previously described (Atluri and Regehr, 1996). The 0.1% DMSO does not affect evoked or spontaneous miniature EPSCs (mEPSCs) (Atluri and Regehr, 1996). Furthermore, cleavage of the acetoxymethyl ester, alone, does not affect synaptic transmission, because visibly labeling a slice with BCECF-AM (100 μmfor 20 min), a dye that does not bind calcium, does not alter the time course of release (n = 3; data not shown). Whole-cell patch-clamp recordings of stellate cells (2–2.5 MΩ electrodes) were obtained under visual guidance (Atluri and Regehr, 1998). The internal solution contained (in mm): 35 CsF, 100 CsCl, 10 EGTA, 10 HEPES, and 0.1 D600, pH 7.4. Parallel fibers were stimulated with two glass electrodes placed in the molecular layer several hundred micrometers from the recording electrode. The intervals between evoked trials (6 and 2 sec for experiments at 24 and 34°C, respectively) did not facilitate synaptic currents. In the experiments of Figure 1 the stimulus intensity was maintained at the same amplitude. In all other experiments our goal was to detect individual quantal events; therefore, the stimulus intensity was adjusted such that 30–50% of the trials were failures and, on average, 0.5–1.5 quanta were evoked per trial. EPSCs were measured at −70 mV.
Fig. 1.

EGTA-AM accelerates the decay of Cares and affects the EPSC. A, Peak amplitudes (filled circles) and half-decay times (open circles) of magnesium green fluorescence (ΔF/F) transients were monitored during the addition of 100 μm EGTA-AM into the bath solution (left). Time 0 indicates the onset of EGTA application (black bar). Average calcium transients before (thin trace) and after (bold trace) loading with EGTA are superimposed in theright. Each trace is the average of 20 trials.B, Left, The time course of the peak EPSC during bath exposure to 100 μm EGTA-AM. Eachpoint represents the average value of 10 consecutive peak measurements. B, Right, Superimposed average current traces are shown before (thin trace) and after (bold trace) EGTA application. The synaptic currents are normalized to their respective peak amplitude in the far right to demonstrate the acceleration of the time course of the EPSC waveform after exposure to EGTA. Calcium measurements (A) and synaptic currents (B) were obtained from two different experiments.
Data analysis. Stimulus-evoked currents were filtered at 5 kHz with a four-pole Bessel filter and digitized at 20–50 kHz. Quantal events were detected and analyzed off-line with IGOR PRO software (WaveMetrics, Lake Oswego, OR) and custom macros. Then the first and second derivatives were computed, and quanta were detected on the basis of threshold crossings of first and/or second derivatives. The second derivative provides a more reliable means of detecting two closely spaced events but is also more sensitive to noise and to changes in the quality of the recording. Thus, experiments in which the access changed appreciably during the course of the experiment were found to be unreliable with regard to mEPSC detection and were not included for analysis. We estimate that >90% of all evoked quanta are detected in our experiments at 24°C on the basis of (1) our small number of events per trial, (2) manual inspection, and (3) comparisons of average EPSCs and probability histograms convolved with the average waveform of the quantal events.
Average quantal events were determined from the trials in which only a single event was detected. These events were aligned on the basis of the peak of their second or their first derivative and then used to compute the average quantal event, as in Figure 2B. The average failure (events in which there was no quantal event) was used to correct evoked synaptic currents to eliminate the stimulus artifact and prespike. Bin size in all probability histograms is 100 μsec.
Fig. 2.

The quantal events underlying the evoked EPSC. A, Ten consecutive trials showing representative responses to low-intensity stimulation at 0.17 Hz. Traces have been displaced by 200 pA. B, Superimposed quantal events (153) that were used to determine the average quantal event.Inset, Amplitude histogram of the quantal events. Detection of the quantal events is described in Materials and Methods.C, The average EPSC produced by low-intensity parallel fiber stimulation (bold trace; 873 trials, 0.17 Hz). The average response (computed as described in Materials and Methods) is aligned to the peak of the average evoked quantal event (thin trace). The time scale in A and Cis the same. The scale bar corresponds to 10 pA for the average synaptic current and to 29 pA for the average quantal event.D, Normalized traces of the evoked EPSC (bold) and average quantal response (thin) are inverted and plotted on a semilogarithmic scale to compare their time courses of decay. The average quantal event is larger than the average EPSC because of failures and asynchrony.
Measurement of Cares. Presynaptic boutons of the cerebellar granule cells were labeled with magnesium green-AM (Molecular Probes), as previously described (Regehr and Tank, 1991;Regehr and Atluri, 1995). Briefly, a local application of a magnesium green-AM solution was delivered to a small region of the molecular layer. The dye was taken up by cells in the load site and diffused down the parallel fibers into the presynaptic boutons of the cerebellar granule cells over 1–2 hr. Fluorescence was measured from a 50–70 μm spot size-positioned 400–700 μm away from the load site to avoid contaminating signals from the dendritic processes of other cells at the load site. Because, by volume, the parallel fibers consist almost entirely of presynaptic boutons (Palay and Chan-Palay, 1974), this fluorescence measurement provides an aggregate measure of the response of many synchronously activated boutons.
The photodiode used in these measurements responded to step changes in intensity with a time constant of 50 μsec. Signals were filtered at 10 kHz with an eight-pole Bessel filter and digitized at 50 kHz. The fluorescence filter set used for magnesium green was 450–490 nm excitation, FT510 dichroic, and LP520 emission. The stimulus intensity was not changed during optical experiments.
RESULTS
The timing of fast neurotransmitter release was examined at synapses between granule cells and stellate cells in rat cerebellar slices. This preparation offers several advantages: (1) in the presence of bicuculline there is no recurrent excitation or inhibition of local circuits (Palay and Chan-Palay, 1974); (2) stellate cells are small, electrically compact, and readily voltage-clamped (Barbour et al., 1994); (3) mEPSCs are large, rapid, and easily detected; (4) evoked EPSCs can be studied with minimal interference from spontaneous mEPSCs, which occur at very low frequency; and (5) it is possible to detect presynaptic calcium transients from granule cell parallel fibers.
To determine whether the quantal events that underlie the fast EPSC depend on residual presynaptic calcium levels (Cares), we used EGTA to manipulate Cares. Introducing EGTA into presynaptic terminals is an ideal way of perturbing Cares (Adler et al., 1991;Swandulla et al., 1991; Winslow et al., 1994; Atluri and Regehr, 1996,1998; Naraghi and Neher, 1997). EGTA has little effect on Calocal because it binds calcium slowly (Smith et al., 1984). However, because of its high affinity, it binds calcium effectively on longer time scales, thereby speeding the decay of Cares. These properties of calcium binding have established EGTA as an important tool in the study of calcium in synaptic transmission and have allowed us virtually to eliminate Cares while minimally perturbing Calocal. Previously, we have used EGTA to examine DR and facilitation at this synapse (Atluri and Regehr, 1998).
An example of the effect of EGTA on Cares is shown in Figure 1A. To monitor Cares, we loaded granule cell terminals with the low-affinity calcium-sensitive fluorophore, magnesium green (Atluri and Regehr, 1996; Zhao et al., 1996). Because granule cell presynaptic boutons are small (<1 μm in diameter), calcium gradients dissipate rapidly (Palay and Chan-Palay, 1974; Sabatini and Regehr, 1998). Therefore, several milliseconds after stimulation the normalized changes in magnesium green fluorescence (ΔF/F) provide a good estimate of Cares dynamics (Atluri and Regehr, 1996, 1998). In control conditions a single stimulus increases Cares within milliseconds, and then Cares returns to resting levels in several hundred milliseconds (Fig. 1A, right). After the cerebellar slice is exposed to a membrane-permeant form of EGTA (EGTA-AM; 100 μm), presynaptic magnesium green ΔF/F signals decay rapidly (a half-decay time of 1.8 msec as compared with 24 msec for control), whereas peak ΔF/F signals are reduced only slightly (16% reduction). Although these fluorescence measurements do not allow us to measure Calocal, the reduction in peak ΔF/F (reduced by 16 ± 2%;n = 5) provides an upper bound of the effect of EGTA on Calocal (Winslow et al., 1994).
Manipulation of presynaptic calcium transients with EGTA-AM also affects evoked synaptic currents. The application of 100 μm EGTA-AM decreased the amplitude of the evoked synaptic current by 26% (Fig. 1B). The average reduction in synaptic currents in such experiments was 39 ± 7% (n = 5). This is consistent with a previous report at the calyx of Held that indicated that release was sensitive to EGTA introduced in the presynaptic terminal (Borst and Sakmann, 1996). We also found that EGTA accelerated the decay of the synaptic current, as is apparent by comparing the normalized synaptic currents in control conditions and after EGTA introduction (Fig. 1B, right). This effect on the time course of the EPSC was interesting because EGTA appeared to be altering the EPSC in a way that was consistent with a reduction in TR. However, the effect was often subtle, and thus it was difficult to exclude contributions from postsynaptic effects such as series resistance errors.
We therefore refined our approach by stimulating the granule cell parallel fibers at an intensity that elicited, on average, <1.5 quanta per trial. This enabled us to explore the slow decay phase of the evoked EPSC by resolving the unitary events that constitute the evoked EPSC. We refer to this stimulus as “low-intensity stimulation,” because multiple presynaptic inputs are activated, in contrast to “minimal stimulation,” in which a single presynaptic input is activated. Ten consecutive trials are shown in Figure2A to illustrate the response to low-intensity stimulation. As shown in these representative traces, many trials were failures; that is, there were no synaptic events in response to parallel fiber stimulation. In other trials a small number of quanta were evoked with variable latency.
Superimposed quantal events from a single experiment, obtained from trials in which only a single event was detected, are shown in Figure2B. A plot of the amplitude histogram of the quantal events clearly demonstrates that the amplitudes of the quantal events are variable in size and well above the noise threshold for event detection (Fig. 2B, inset). Thus we are confident that we can detect the majority of quantal events elicited by low-intensity stimulation.
The average synaptic current produced by such stimulation is shown in Figure 2C. The EPSC (bold trace) begins 1.9 msec after stimulation and reaches its peak 1.5 msec later. The average quantal event (thin trace) has been scaled to show that the rise and decay times of the quantal events are faster than those of the average evoked EPSC; this is seen more clearly in the semilogarithmic plot of Figure 2D. Notably, the decay phase of the EPSC is poorly fit by a single exponential, but it is well approximated by a double exponential decay (Fig. 2D; τfast = 1.15 msec and τslow = 4.5 msec). τslow does not reflect a slow decay phase of the quantal event, which returns to 2% of peak values with a single exponential decay (τ = 680 μsec). This is consistent with studies showing that asynchrony of release helps to shape the time course of the synaptic current (Katz and Miledi, 1964; Diamond and Jahr, 1995; Isaacson and Walmsley, 1995).
Superimposed traces from hundreds of trials are displayed on the same time scale as the average synaptic current in Figure3, A and B. We concentrate on the first 20 msec of release, which includes both the phasic and transient release and commonly is taken to correspond to fast synaptic transmission (Goda and Stevens, 1994). A raster plot of the latency of quantal events for each trial shows that the timing of neurotransmitter release is stochastic and reveals that many events occur well after the peak of the ensemble EPSC (Fig. 3C). The latency histogram obtained from the raster plot is a measure of the probability of release (Fig. 3D). For ∼3 msec the release rates are high; then they decline but persist above background rates for tens of milliseconds. The cumulative latency histogram (Fig.3E), which is the integral of the latency histogram in Figure 3D normalized to the total release in the 20 msec after the onset of the EPSC, provides a convenient way of presenting the fraction of release that has occurred by a given time. As shown in this plot, ∼50% of the total release has occurred before the peak of the EPSC. By 5 msec after the stimulus the synaptic charge has reached ∼80% of the total charge, indicating that the transient tail of release accounts for ∼20% of the total synaptic charge.
Fig. 3.
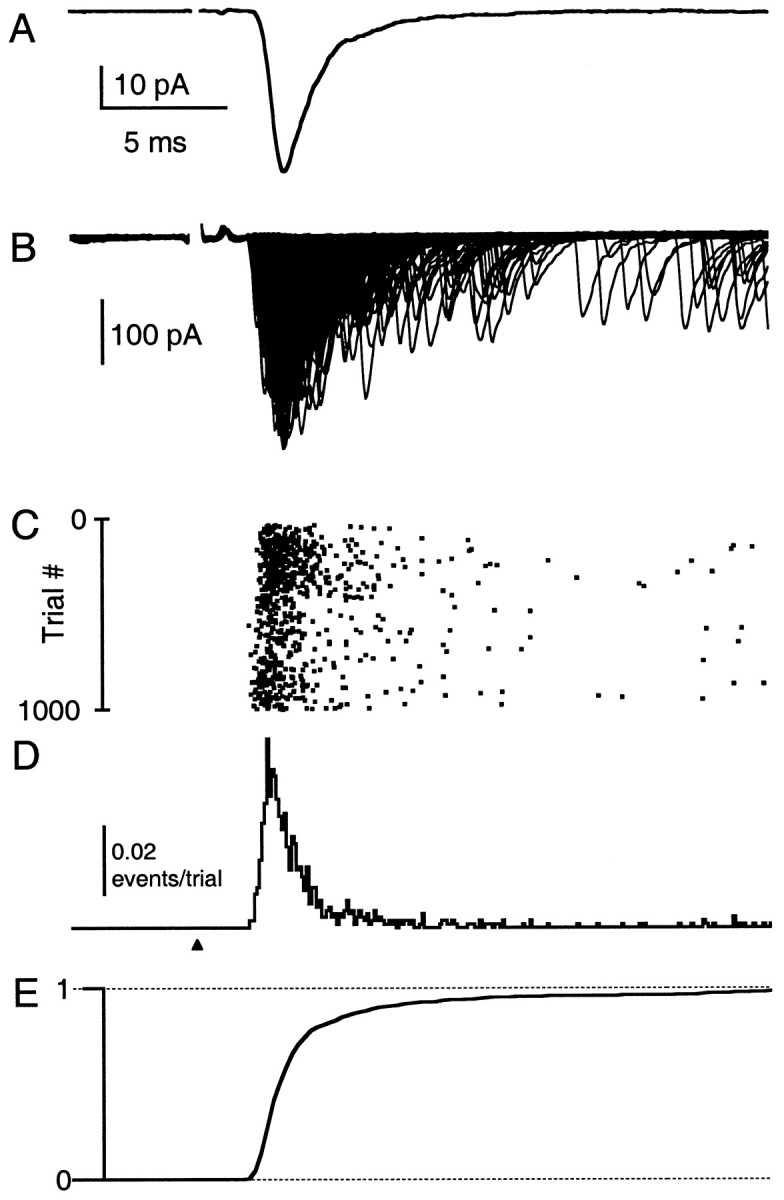
Determination of the time course of release probability. Shown are superimposed traces of the 873 consecutive trials (B) that contribute to the average EPSC (A). Same experiment as in Figure 2. Raster plot of the latency of detected quantal events for each trial (C), corresponding latency histogram (D), and the cumulative latency histogram (E). All traces are plotted on the same time scale and aligned to the time of stimulation (arrowhead). Stimulus artifacts are blanked for clarity.
Therefore, neurotransmitter release at the granule cell to stellate cell synapse shares many features with release at other synapses (Katz and Miledi, 1964; Diamond and Jahr, 1995; Isaacson and Walmsley, 1995). The asynchrony of release on the milliseconds time scale results in an average evoked EPSC that has a substantially slower rise time and decay time than the average quantal event. More relevant to this study, however, is the presence of a transient tail of release that persists long after the peak of the EPSC. To determine the role of presynaptic calcium in the transient tail of release, we examined the effects of different manipulations of presynaptic calcium on TR.
The effects of EGTA-AM on fast neurotransmitter release
We first studied the effect of EGTA on the time course of evoked synaptic transmission. Figure4B shows superimposed normalized traces of the average evoked current before (thin trace) and after (bold trace) EGTA introduction. It is clear that EGTA eliminates the transient tail of the EPSC waveform. The decay time course of the EPSC now can be fit with a single exponential (τ = 1 msec). To evaluate the quantal release underlying the EPSC, we superimposed consecutive trials before and after introducing EGTA (Fig. 4C, top and bottom, respectively). EGTA eliminates late quantal events. The raster plot shows that, after loading with EGTA, 99% of release occurs within a 3 msec interval (Fig. 4D). A comparison of the latency histograms in control conditions and after loading with EGTA-AM reveals that TR has been eliminated (Fig. 4E). Superimposed cumulative latency histograms from the two data sets, normalized to the total release in the 20 msec after the onset of release, show that the EGTA-AM-sensitive transient tail of fast neurotransmitter release comprises 18% of the total synaptic charge (Fig.4F). These effects are not attributable to changes in the time course of the quantal events (control τ = 700 μsec; EGTA τ = 670 μsec) or to changes in the width of the presynaptic volley (n = 3). Moreover, high concentrations of EGTA in the recording pipette solution exclude possible postsynaptic effects. Thus, EGTA accelerates Caresdecay, which in turn eliminates late release events, thereby speeding the EPSC decay.
Fig. 4.
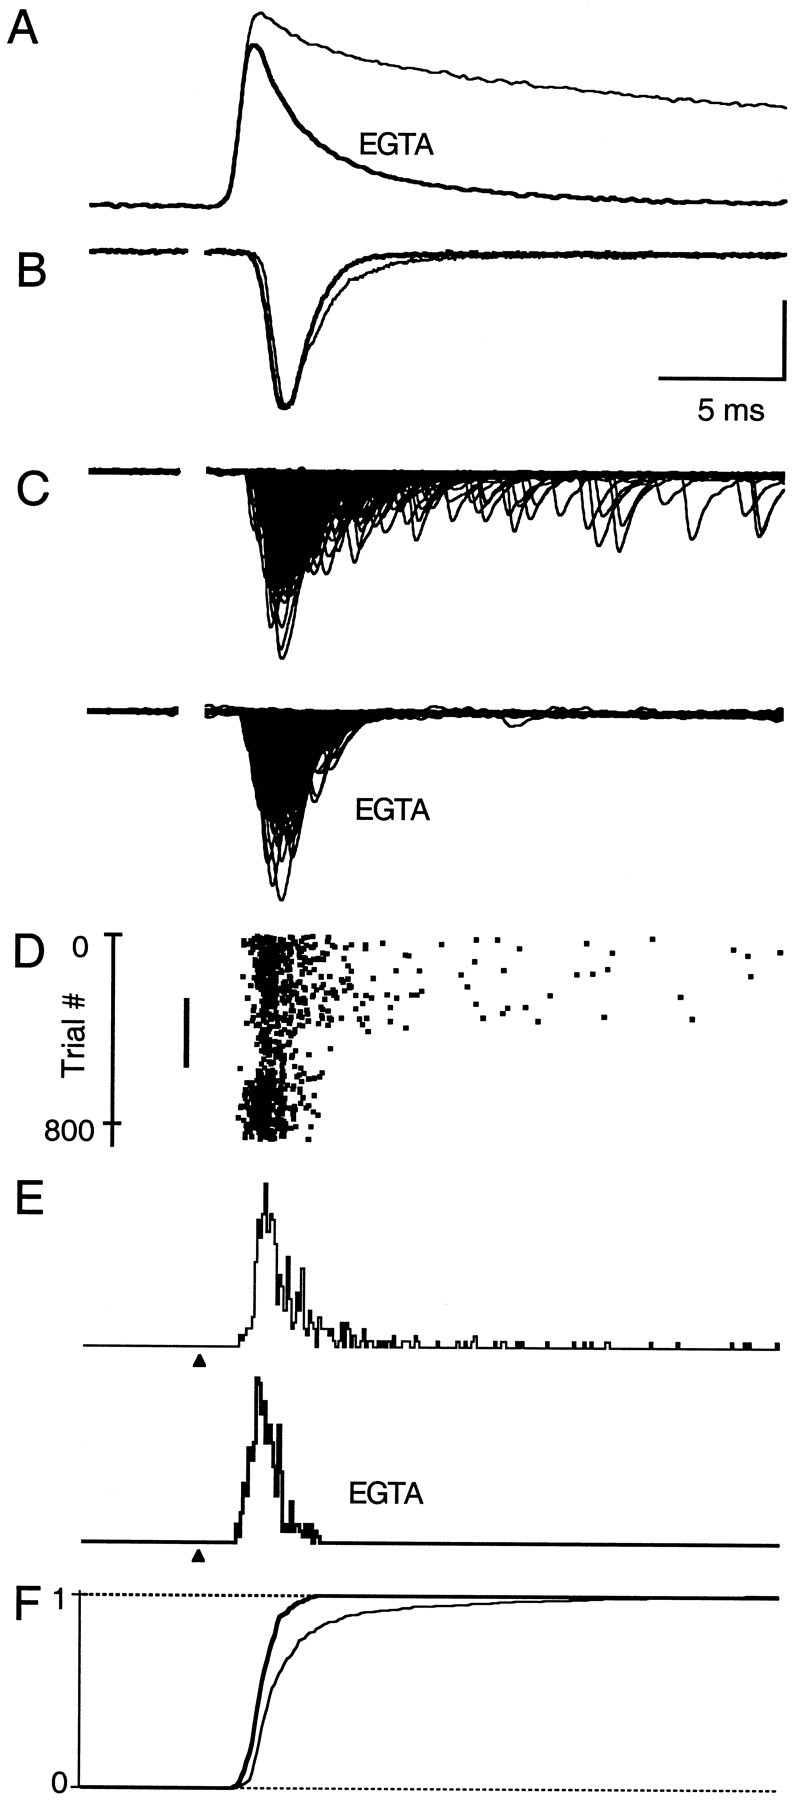
EGTA-AM eliminates late evoked quantal events.A, Comparison of magnesium green ΔF/F signals before (thin trace) and after loading with 100 μm EGTA-AM (bold trace) on a fast time scale. B, Average EPSCs in control conditions (thin trace) and after EGTA-AM (bold trace). EPSCs are normalized to the respective peak currents. C, Superimposed plots of 340 consecutive evoked trials each, recorded in control conditions and after loading with EGTA. D, Raster plot of evoked quanta. Stimulus intensity was increased from 19 to 23 μA after EGTA-AM application wash-in (black bar) to maintain an average of 0.5–1.5 quanta per trial. E, Latency histograms for control conditions and after EGTA-AM application.F, Superimposed cumulative latency histograms for control (thin line) and EGTA (thick line) data. Calcium measurements (A) and synaptic physiology (B–F) were obtained from two different experiments. All traces are on the same time scale. The relative timing of calcium influx (A) and the evoked EPSCs (B–F) was adjusted according to Sabatini and Regehr (1998). B–F are all aligned to the beginning of the stimulus (arrowhead in E). Vertical scale bars: A, 3.4%; B, 20 pA for control and 22.7 pA for EGTA; C, 100 pA;E, 0.04 events per trial.
The effects of lowering calcium on the timing of fast neurotransmitter release
Although the most obvious effect of EGTA is to accelerate the decay of Cares, it also reduces peak ΔF/F signals and also may decrease Calocal. We therefore compared the effects of EGTA with those produced by decreasing external calcium concentration (Cae). Lowering Cae from 2 to 1 mm decreased peak ΔF/F signals without altering the time course of Cares (Fig.5A). Given the much larger effect of low Cae on peak ΔF/Fsignals (61% of control in low Cae as compared with 84% of control in EGTA), we conclude that 1 mm Caehas a much larger effect on Calocal than does EGTA. Lowering Cae did not affect the time course of the average EPSC (Fig. 5B). The superimposed trials (Fig.5C), the raster plot (Fig. 5D), the release histograms (Fig. 5E), and the cumulative latency histograms (Fig. 5F) indicate that the timing of release is not altered in 1 mm Cae. Thus, a large decrease in Calocal does not affect the time course of release.
Fig. 5.
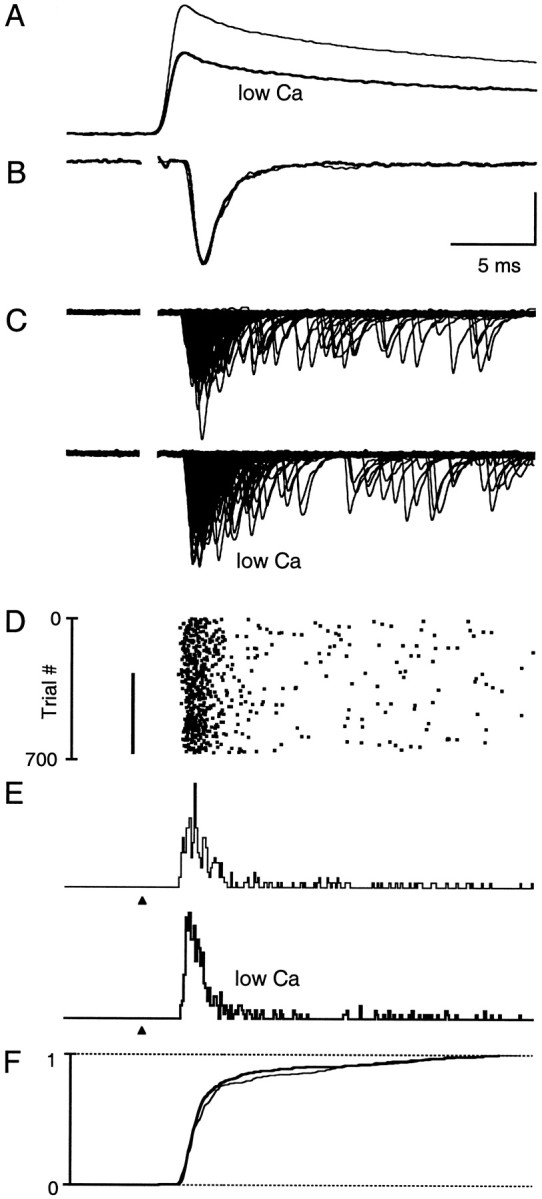
Low external calcium reduces peak calcium levels but does not alter the time course of Cares or neurotransmitter release. A, Comparison of magnesium green ΔF/F signals in 2 mmCae (thin trace) and 1 mmCae (bold trace). Each trace is the average of 20 trials. B, Average EPSCs in 2 mmCae (thin trace) and in 1 mmCae (bold trace). EPSCs are normalized to their respective peak currents. C, Plots of 360 consecutive evoked trials each, recorded in 2 mmCae and in 1 mm Cae.D, Raster plot of evoked quanta. Stimulus intensity was increased from 7 to 9 μA after switching to 1 mmCae (indicated by the black bar) to maintain an average of 0.5–1.5 quanta per trial. E, Latency histograms for 2 mm Cae and 1 mmCae. F, Superimposed cumulative latency histograms in 2 mm Cae (thin line) and 1 mm Cae (thick line) data. Calcium measurements (A) and synaptic physiology (B–F) were obtained from two different experiments. All traces are on the same time scale as described in Figure 4. Vertical scale bars: A, 2.4%;B, 8 pA for control and 14.8 pA for low Cae; C, 90 pA; E, 0.03 events per trial.
Summary comparison of calcium manipulations
A summary of the time course of neurotransmitter release is shown in Figure 6 for control conditions (n = 15), after loading with EGTA (n = 10), and in low Cae (n = 5). In the lower graphs the traces are superimposed for comparison. Comparison of the cumulative probability histograms demonstrates that the fraction of release that occurs within 3 msec after the onset of release is 80 ± 1% for control conditions, 97 ± 1% after loading with EGTA, and 80 ± 3% in low Cae (Fig. 6A). There is a transient tail of release in control conditions and in low Cae, but not after loading with EGTA. This also is seen clearly in the semilogarithmic plots of the time course of release (Fig. 6B). For control conditions and in low Cae the decay phase of release is well approximated by a double exponential (τfast ∼1 msec and τslow ∼10–15 msec). In contrast, after loading with EGTA, a single exponential (τ = 640 μsec) is sufficient to describe the decay phase of release. Thus, Cares plays a significant role in shaping the fast synaptic current by driving a transient tail of release (TR).
Fig. 6.

The effects of calcium manipulations on the time course of release. A, Summary cumulative probability histograms in control conditions (n = 15), after loading with 100 μm EGTA-AM (n = 10), and in 1 mm Cae(n = 5). The dotted horizontal linecorresponds to 100% of the events in the 20 msec after the onset of release. B, Semilogarithmic plot of the normalized probability histograms, which are calculated by differentiating the corresponding cumulative probability histogram and normalizing to peak rates of release. In the bottom panel the averaged traces for the three different conditions are superimposed. Error bars represent ± SEM. Vertical scales are shown on theright of each row.
The effects of residual calcium at high temperatures
The experiments described above illustrate a prominent contribution of residual calcium to fast neurotransmitter release. These studies were performed at 24°C because of the ease of recording from stellate cells for long times at room temperature (up to 3 hr). We also performed experiments at 34°C to determine whether residual calcium is likely to contribute to the EPSC under more physiological conditions (Fig. 7). As expected, all aspects of synaptic transmission were faster at 34 than at 24°C. Discrimination of multiple events is more difficult at 34°C, because release is confined to a very narrow window of time. Consequently, experiments performed at 34°C only provide a qualitative description of release. However, the basic effect of EGTA on Cares, the evoked EPSC, and the duration of release was qualitatively similar at 34°C (n = 5) and 24°C (compare with Fig. 4). Therefore, the Cares-sensitive component of release is likely to be important under physiological conditions.
Fig. 7.
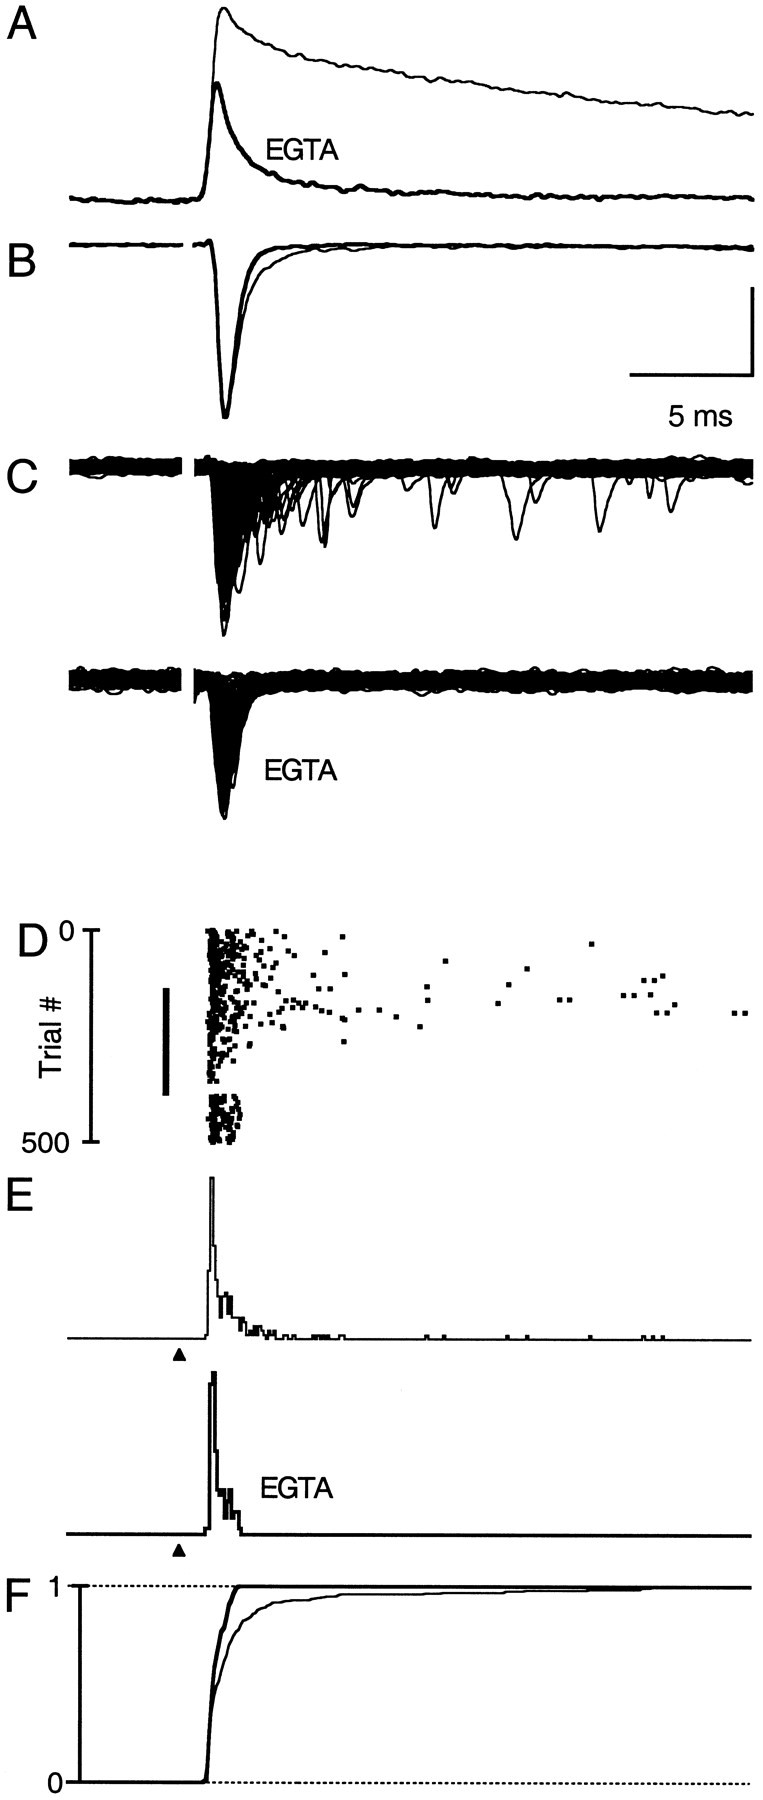
EGTA accelerates the decay of Caresand eliminates late evoked quantal events at 34°C. Shown is the effect of introducing EGTA into presynaptic boutons on Cares and synaptic physiology at 34°C. Same format as Figure 4. In all, 180 and 225 trials contributed to the analysis in control conditions and after the loading with EGTA, respectively. Vertical scale bars: A, 2.4%; B, 30 pA for control and EGTA; C, 105 pA; E, 0.12 events per trial.
DISCUSSION
Our principal finding is that residual calcium plays an important role in synaptic transmission immediately after action potential invasion of presynaptic boutons. Previously, it had been established that Cares was involved in processes on longer time scales, such as facilitation, post-tetanic potentiation, calcium-dependent recovery from depression, and delayed release of neurotransmitter (Stanley, 1986; Magleby, 1987; Delaney et al., 1989; Kandel et al., 1991; Swandulla et al., 1991; Nicholls et al., 1992; Kamiya and Zucker, 1994; Van der Kloot and Molgo, 1994; Zucker, 1994; Atluri and Regehr, 1996; Dittman and Regehr, 1998; Stevens and Wesseling, 1998; Wang and Kaczmarek, 1998). However, it was much more difficult to establish a role for Cares on shorter time scales. Here, by combining low-intensity stimulation to resolve individual quantal events with measurements and manipulations of presynaptic Cares, we experimentally demonstrate that Cares controls release just milliseconds after stimulation. Our studies establish that the release we see 3–20 msec after the onset of the EPSC is eliminated by EGTA and is not attributable to a slow process solely triggered by Calocal.
Implications for the calcium dependence of release
Our findings have important implications for the calcium dependence of synaptic transmission. Previously, it has been difficult to determine whether Cares can drive release at sufficient rates to contribute to the EPSC. Studies of the calcium dependence of release at goldfish bipolar neurons showed that release is steeply calcium-dependent and that significant release rates are not observed until calcium levels are 10 μm (Heidelberger et al., 1994). If we assume that release at granule cell synapses has a similar calcium dependence of release as goldfish bipolar neurons, at first glance there appears to be a fundamental inconsistency. Our results show significant release rates, up to 10% of peak rates, when calcium levels are submicromolar. It is possible, however, to reconcile these results by taking into account our previous studies of delayed release (Atluri and Regehr, 1998). We have shown previously that DR at the granule to stellate cell synapse in the 1 sec after stimulation consists of two components, one steeply dependent on Caresand the other linearly dependent on Cares (Atluri and Regehr, 1998) (see also Fig. 8). The rate of release associated with the linearly dependent component is much too small to account for TR. However, based on similarities in their Cares sensitivities, time courses, and magnitudes, the steeply Cares-dependent components of DR and TR appear to share the same mechanism. Our earlier study demonstrated that the steeply Cares-dependent component of DR has an interesting feature: Cares is more effective in driving release when it is preceded by a high Calocal signal. This feature suggests that, when preceded by Calocal, submicromolar levels of Cares can trigger the significant rates of release observed in TR, whereas the same concentrations of Cares, alone, cannot.
Fig. 8.

Rates of quantal release in the 1 sec after a single stimulus. Semilogarithmic plot of the normalized probability of release in the 1 sec after stimulation. The continuous plot for this time interval was determined by splicing together the release rates shown in the inset. Inset, The normalized probability of release in the 50 msec after stimulation from the present study (dots; average of 15 experiments) and in the 10–1000 msec after stimulation [line; average of 28 experiments, adapted from Atluri and Regehr (1998)]. The 10–1000 msec data were scaled to align as shown.
Implications for EGTA sensitivity of transmission at mammalian and squid synapses
Our findings also help to clarify the differences between the squid giant synapse and synapses in the mammalian CNS in their response to EGTA. The introduction of high concentrations of EGTA presynaptically does not affect synaptic transmission at the squid giant synapse (Adler et al., 1991), whereas a similar concentration of BAPTA profoundly reduces synaptic transmission. The differential effects on transmission of these two calcium chelators are attributed to differences in their kinetics, with BAPTA binding calcium over 100 times faster than EGTA. These observations indicate that, at the squid giant synapse, release is driven by a very large calcium signal (>100 μm) that is highly localized. In contrast, EGTA depresses transmission at the rat calyx of Held (Borst and Sakmann, 1996) and at the granule to stellate cell synapse, indicating that release at these synapses is fundamentally different from in squid. An explanation that accounts for these observations is that, at mammalian synapses, release at single sites is driven by calcium influx through multiple calcium channels; this is referred to as the overlapping domain model (Augustine et al., 1991; Takahashi and Momiyama, 1993; Wu and Saggau, 1994; Mintz et al., 1995; Randall and Tsien, 1995; Borst and Sakmann, 1996). According to this view, some of the calcium channels are sufficiently far from the release site that EGTA can bind calcium before it reaches the release site.
The overlapping domain model can account for the effect of EGTA on peak release, but it does not account for the effect of EGTA on the time course of release. Whether release is driven by single calcium channels or by multiple calcium channels, the Calocal that triggers release does not persist long after the calcium channels close (Chad and Eckert, 1984; Fogelson and Zucker, 1985; Simon and Llinás, 1985; Roberts, 1994). Our results demonstrate, however, that a component of release persists well after calcium channels close and Calocal has dissipated; this component is driven by Cares. Therefore, it is also necessary to consider this Cares-driven component to account for the effects of EGTA. Our results suggest that differences in Cares at these synapses, combined with the sensitivity of release to Cares, also contribute to the differential effects of EGTA in squid and mammalian synapses. After single stimuli the changes in Cares are small at the squid giant synapse because calcium diffuses into the vast presynaptic terminal (Smith et al., 1993). In contrast, at the smaller presynaptic boutons of the mammalian CNS, Cares increases by several hundred nanomolars (Helmchen et al., 1997), a range that we have shown can influence release. Thus we conclude that EGTA sensitivity of release at mammalian synapses arises, in part, from release being driven by overlapping calcium domains and in part by a Cares-sensitive component of release that is prominent in mammalian synapses in which Cares is large.
It is likely that Cares also contributes to release on rapid time scales at other synapses in the mammalian CNS. Such synapses generally have a high calcium channel density and small volume (Regehr and Atluri, 1995; Borst and Sakmann, 1996; Helmchen et al., 1997). As a result, stimulus-evoked changes in Cares are several hundred nanomolars, similar to what we estimate for parallel fiber presynaptic boutons.
Physiological significance of residual calcium
Although the effect on the average synaptic current is subtle, Cares-sensitive release is likely to be important under physiological conditions. Although we have focused on the first 20 msec after the onset of release, a time domain relevant to the EPSC, elevated levels of transmitter release continue for hundreds of milliseconds (Atluri and Regehr, 1998). When combined with previous results (Atluri and Regehr, 1998), our findings provide a more complete description of the time course of neurotransmitter release after single stimuli at a mammalian synapse. In the earlier study the focus was on tens to hundreds of milliseconds after stimulation, and very large stimulus intensities were needed to evoke sufficient events for analysis. In contrast, here we use low intensities suited to examine release on short time scales. By combining these results, it is possible to quantify the release rates as a function of time in the 1 sec after stimulation, as shown in Figure 8. Of the quantal events evoked by single stimuli, 66% occur within the initial 3 msec interval, and the remaining 34% of the events occur at later times and require elevated Cares. Therefore, we show that Cares drives a significant fraction of synaptic charge transfer. Furthermore, although we have concentrated on low-frequency stimulation, the contribution of Caresprobably is enhanced during high-frequency trains (10–100 Hz) that elevate Cares.
Footnotes
This work was supported by National Institutes of Health Grant R01-NS32405-01 and by the Howard Hughes Physician Postdoctoral Fellowship and National Institutes of Health Grant K08 NS02056-01 to C.C. We thank B. Bean, A. Carter, K. Delaney, J. Dittman, D. Finley, A. Kreitzer, J.-W. Lin, G. Yellen, M. Xu-Friedman, and R. Zucker for comments on this manuscript.
Correspondence should be addressed to Dr. Wade G. Regehr, Department of Neurobiology, Harvard Medical School, 220 Longwood Avenue, Boston, MA 02115.
REFERENCES
- 1.Adler EM, Augustine JG, Duffy SN, Charlton MP. Alien intracellular calcium chelators attenuate neurotransmitter release at the squid giant synapse. J Neurosci. 1991;11:1496–1507. doi: 10.1523/JNEUROSCI.11-06-01496.1991. [DOI] [PMC free article] [PubMed] [Google Scholar]
- 2.Atluri PP, Regehr WG. Determinants of the time course of facilitation at the granule cell to Purkinje cell synapse. J Neurosci. 1996;16:5661–5671. doi: 10.1523/JNEUROSCI.16-18-05661.1996. [DOI] [PMC free article] [PubMed] [Google Scholar]
- 3.Atluri PP, Regehr WG. Delayed release of neurotransmission from cerebellar granule cells. J Neurosci. 1998;18:8214–8227. doi: 10.1523/JNEUROSCI.18-20-08214.1998. [DOI] [PMC free article] [PubMed] [Google Scholar]
- 4.Augustine GJ, Adler EM, Charlton MP. The calcium signal for transmitter secretion from presynaptic nerve terminals. In: Stanley EF, Nowycky MC, Triggle DJ, editors. Calcium entry and action at the presynaptic nerve terminal. New York Academy of Sciences; New York: 1991. pp. 365–381. [DOI] [PubMed] [Google Scholar]
- 5.Barbour B, Keller BU, Llano I, Marty A. Prolonged presence of glutamate during excitatory synaptic transmission to cerebellar Purkinje cells. Neuron. 1994;12:1331–1343. doi: 10.1016/0896-6273(94)90448-0. [DOI] [PubMed] [Google Scholar]
- 6.Barrett EF, Stevens CF. The kinetics of transmitter release at the frog neuromuscular junction. J Physiol (Lond) 1972;227:691–708. doi: 10.1113/jphysiol.1972.sp010054. [DOI] [PMC free article] [PubMed] [Google Scholar]
- 7.Borst JG, Sakmann B. Calcium influx and transmitter release in a fast CNS synapse. Nature. 1996;383:431–434. doi: 10.1038/383431a0. [DOI] [PubMed] [Google Scholar]
- 8.Chad JE, Eckert R. Calcium domains associated with individual channels can account for anomalous voltage relations of Ca-dependent responses. Biophys J. 1984;45:993–999. doi: 10.1016/S0006-3495(84)84244-7. [DOI] [PMC free article] [PubMed] [Google Scholar]
- 9.Cohen IS, Van der Kloot W. Facilitation and delayed release at single frog neuromuscular junctions. J Neurosci. 1986;6:2366–2370. doi: 10.1523/JNEUROSCI.06-08-02366.1986. [DOI] [PMC free article] [PubMed] [Google Scholar]
- 10.Cummings DD, Wilcox KS, Dichter MA. Calcium-dependent paired-pulse facilitation of miniature EPSC frequency accompanies depression of EPSCs at hippocampal synapses in culture. J Neurosci. 1996;16:5312–5323. doi: 10.1523/JNEUROSCI.16-17-05312.1996. [DOI] [PMC free article] [PubMed] [Google Scholar]
- 11.Delaney KR, Zucker RS, Tank DW. Calcium in motor nerve terminals associated with post-tetanic potentiation. J Neurosci. 1989;9:3558–3567. doi: 10.1523/JNEUROSCI.09-10-03558.1989. [DOI] [PMC free article] [PubMed] [Google Scholar]
- 12.Diamond JS, Jahr CE. Asynchronous release of synaptic vesicles determines the time course of the AMPA receptor-mediated EPSC. Neuron. 1995;15:1097–1107. doi: 10.1016/0896-6273(95)90098-5. [DOI] [PubMed] [Google Scholar]
- 13.Dittman JS, Regehr WG. Calcium dependence and recovery kinetics of presynaptic depression at the climbing fiber to Purkinje cell synapse. J Neurosci. 1998;18:6147–6162. doi: 10.1523/JNEUROSCI.18-16-06147.1998. [DOI] [PMC free article] [PubMed] [Google Scholar]
- 14.Erulkar SD, Rahamimoff R. The role of calcium ions in tetanic and post-tetanic increase of miniature end-plate potential frequency. J Physiol (Lond) 1978;278:501–511. doi: 10.1113/jphysiol.1978.sp012320. [DOI] [PMC free article] [PubMed] [Google Scholar]
- 15.Feller MB, Delaney KR, Tank DW. Presynaptic calcium dynamics at the frog retinotectal synapse. J Neurophysiol. 1996;76:381–400. doi: 10.1152/jn.1996.76.1.381. [DOI] [PubMed] [Google Scholar]
- 16.Fogelson AL, Zucker RS. Presynaptic calcium diffusion from various arrays of single channels. Implications for transmitter release and synaptic facilitation. Biophys J. 1985;48:1003–1017. doi: 10.1016/S0006-3495(85)83863-7. [DOI] [PMC free article] [PubMed] [Google Scholar]
- 17.Goda Y, Stevens CF. Two components of transmitter release at a central synapse. Proc Natl Acad Sci USA. 1994;91:12942–12946. doi: 10.1073/pnas.91.26.12942. [DOI] [PMC free article] [PubMed] [Google Scholar]
- 18.Heidelberger R, Heinemann C, Neher E, Matthews G. Calcium dependence of the rate of exocytosis in a synaptic terminal. Nature. 1994;371:513–515. doi: 10.1038/371513a0. [DOI] [PubMed] [Google Scholar]
- 19.Helmchen F, Borst JGG, Sakmann B. Calcium dynamics associated with a single action potential in a CNS presynaptic terminal. Biophys J. 1997;72:1458–1471. doi: 10.1016/S0006-3495(97)78792-7. [DOI] [PMC free article] [PubMed] [Google Scholar]
- 20.Hubbard JI. Repetitive stimulation at the mammalian neuromuscular junction, and the mobilization of transmitter. J Physiol (Lond) 1963;169:641–662. doi: 10.1113/jphysiol.1963.sp007286. [DOI] [PMC free article] [PubMed] [Google Scholar]
- 21.Isaacson JS, Walmsley B. Counting quanta: direct measurements of transmitter release at a central synapse. Neuron. 1995;15:875–884. doi: 10.1016/0896-6273(95)90178-7. [DOI] [PubMed] [Google Scholar]
- 22.Kamiya H, Zucker RS. Residual Ca2+ and short-term synaptic plasticity. Nature. 1994;371:603–606. doi: 10.1038/371603a0. [DOI] [PubMed] [Google Scholar]
- 23.Kandel ER, Schwartz JH, Jessell TM. Principles of neural science. Elsevier; New York: 1991. [Google Scholar]
- 24.Katz B, Miledi R. The measurement of synaptic delay, and the time course of acetylcholine release at the neuromuscular junction. Proc R Soc Lond [Biol] 1964;161:483–495. doi: 10.1098/rspb.1965.0016. [DOI] [PubMed] [Google Scholar]
- 25.Katz B, Miledi R. The effect of temperature on the synaptic delay at the neuromuscular junction. J Physiol (Lond) 1965;181:656–670. doi: 10.1113/jphysiol.1965.sp007790. [DOI] [PMC free article] [PubMed] [Google Scholar]
- 26.Konnerth A, Llano I, Armstrong CM. Synaptic currents in cerebellar Purkinje cells. Proc Natl Acad Sci USA. 1990;87:2662–2665. doi: 10.1073/pnas.87.7.2662. [DOI] [PMC free article] [PubMed] [Google Scholar]
- 27.Magleby KL. Short-term changes in synaptic efficacy. In: Edelman GM, Gall WE, Cowan WM, editors. Synaptic function. Wiley; New York: 1987. pp. 21–56. [Google Scholar]
- 28.Matthews G. Neurotransmitter release. Annu Rev Neurosci. 1996;19:219–233. doi: 10.1146/annurev.ne.19.030196.001251. [DOI] [PubMed] [Google Scholar]
- 29.Miledi R, Thies R. Tetanic and post-tetanic rise in frequency of miniature end-plate potentials in low-calcium solutions. J Physiol (Lond) 1971;212:245–257. doi: 10.1113/jphysiol.1971.sp009320. [DOI] [PMC free article] [PubMed] [Google Scholar]
- 30.Mintz IM, Sabatini BL, Regehr WG. Calcium control of transmitter release at a cerebellar synapse. Neuron. 1995;15:675–688. doi: 10.1016/0896-6273(95)90155-8. [DOI] [PubMed] [Google Scholar]
- 31.Naraghi M, Neher E. Linearized buffered Ca2+ diffusion in microdomains and its implications for calculation of [Ca2+] at the mouth of a calcium channel. J Neurosci. 1997;17:6961–6973. doi: 10.1523/JNEUROSCI.17-18-06961.1997. [DOI] [PMC free article] [PubMed] [Google Scholar]
- 32.Nicholls JG, Martin AR, Wallace BG. From neuron to brain: a cellular and molecular approach to the function of the nervous system. Sinauer; Sunderland, MA: 1992. [Google Scholar]
- 33.Palay SL, Chan-Palay V. Cerebellar cortex. Springer; New York: 1974. [Google Scholar]
- 34.Rahamimoff R, Yaari Y. Delayed release of transmitter at the frog neuromuscular junction. J Physiol (Lond) 1973;228:241–257. doi: 10.1113/jphysiol.1973.sp010084. [DOI] [PMC free article] [PubMed] [Google Scholar]
- 35.Randall A, Tsien RW. Pharmacological dissection of multiple types of Ca2+ channel currents in rat cerebellar granule cells. J Neurosci. 1995;15:2995–3012. doi: 10.1523/JNEUROSCI.15-04-02995.1995. [DOI] [PMC free article] [PubMed] [Google Scholar]
- 36.Ravin R, Spira ME, Parnas H, Parnas I. Simultaneous measurement of intracellular Ca2+ and asynchronous transmitter release from the same crayfish bouton. J Physiol (Lond) 1997;501:251–262. doi: 10.1111/j.1469-7793.1997.tb00001.x. [DOI] [PMC free article] [PubMed] [Google Scholar]
- 37.Regehr WG, Atluri PP. Calcium transients in cerebellar granule cell presynaptic terminals. Biophys J. 1995;68:2156–2170. doi: 10.1016/S0006-3495(95)80398-X. [DOI] [PMC free article] [PubMed] [Google Scholar]
- 38.Regehr WG, Tank DW. Selective fura-2 loading of presynaptic terminals and nerve cell processes by local perfusion in mammalian brain slice. J Neurosci Methods. 1991;37:111–119. doi: 10.1016/0165-0270(91)90121-f. [DOI] [PubMed] [Google Scholar]
- 39.Roberts WM. Localization of calcium signals by a mobile calcium buffer in frog saccular hair cells. J Neurosci. 1994;14:3246–3262. doi: 10.1523/JNEUROSCI.14-05-03246.1994. [DOI] [PMC free article] [PubMed] [Google Scholar]
- 40.Roberts WM, Jacobs RA, Hudspeth AJ. Colocalization of ion channels involved in frequency selectivity and synaptic transmission at presynaptic active zones of hair cells. J Neurosci. 1990;10:3664–3684. doi: 10.1523/JNEUROSCI.10-11-03664.1990. [DOI] [PMC free article] [PubMed] [Google Scholar]
- 41.Sabatini BL, Regehr WG. Optical detection of presynaptic calcium currents. Biophys J. 1998;74:1549–1563. doi: 10.1016/S0006-3495(98)77867-1. [DOI] [PMC free article] [PubMed] [Google Scholar]
- 42.Schweizer FE, Betz H, Augustine GJ. From vesicle docking to endocytosis: intermediate reactions of exocytosis. Neuron. 1995;14:689–696. doi: 10.1016/0896-6273(95)90213-9. [DOI] [PubMed] [Google Scholar]
- 43.Simon SM, Llinás RR. Compartmentalization of the submembrane calcium activity during calcium influx and its significance in transmitter release. Biophys J. 1985;48:485–498. doi: 10.1016/S0006-3495(85)83804-2. [DOI] [PMC free article] [PubMed] [Google Scholar]
- 44.Smith PD, Liesegang GW, Berger RL, Czerlinski G, Podolsky RJ. A stopped-flow investigation of calcium ion binding by ethylene glycol bis(β-aminoethyl ether)-N,N′-tetraacetic acid. Anal Biochem. 1984;143:188–195. doi: 10.1016/0003-2697(84)90575-x. [DOI] [PubMed] [Google Scholar]
- 45.Smith SJ, Buchanan J, Osses LR, Charlton MP, Augustine GJ. The spatial distribution of calcium signals in squid presynaptic terminals. J Physiol (Lond) 1993;472:573–593. doi: 10.1113/jphysiol.1993.sp019963. [DOI] [PMC free article] [PubMed] [Google Scholar]
- 46.Stanley EF. Decline in calcium cooperativity as the basis of facilitation at the squid giant synapse. J Neurosci. 1986;6:782–789. doi: 10.1523/JNEUROSCI.06-03-00782.1986. [DOI] [PMC free article] [PubMed] [Google Scholar]
- 47.Stevens CF, Wesseling JF. Activity-dependent modulation of the rate at which synaptic vesicles become available to undergo exocytosis. Neuron. 1998;21:415–424. doi: 10.1016/s0896-6273(00)80550-4. [DOI] [PubMed] [Google Scholar]
- 48.Swandulla D, Hans M, Zipser K, Augustine GJ. Role of residual calcium in synaptic depression and post-tetanic potentiation: fast and slow calcium signaling in nerve terminals. Neuron. 1991;7:915–926. doi: 10.1016/0896-6273(91)90337-y. [DOI] [PubMed] [Google Scholar]
- 49.Takahashi T, Momiyama A. Different types of calcium channels mediate central synaptic transmission. Nature. 1993;366:156–158. doi: 10.1038/366156a0. [DOI] [PubMed] [Google Scholar]
- 50.Van der Kloot W. Estimating the timing of quantal release during end-plate currents at the frog neuromuscular junction. J Physiol (Lond) 1988;402:595–603. doi: 10.1113/jphysiol.1988.sp017224. [DOI] [PMC free article] [PubMed] [Google Scholar]
- 51.Van der Kloot W, Molgo J. Facilitation and delayed release at about 0°C at the frog neuromuscular junction: effects of calcium chelators, calcium transport inhibitors, and okadaic acid. J Neurophysiol. 1993;69:717–729. doi: 10.1152/jn.1993.69.3.717. [DOI] [PubMed] [Google Scholar]
- 52.Van der Kloot W, Molgo J. Quantal acetylcholine release at the vertebrate neuromuscular junction. Physiol Rev. 1994;74:899–991. doi: 10.1152/physrev.1994.74.4.899. [DOI] [PubMed] [Google Scholar]
- 53.Wang L-Y, Kaczmarek LK. High-frequency firing helps replenish the readily releasable pool of synaptic vesicles. Nature. 1998;394:384–388. doi: 10.1038/28645. [DOI] [PubMed] [Google Scholar]
- 54.Winslow JL, Duffy SN, Charlton MP. Homosynaptic facilitation of transmitter release in crayfish is not affected by mobile calcium chelators: implications for the residual ionized calcium hypothesis from electrophysiological and computational analyses. J Neurophysiol. 1994;72:1769–1793. doi: 10.1152/jn.1994.72.4.1769. [DOI] [PubMed] [Google Scholar]
- 55.Wu L-G, Saggau P. Pharmacological identification of two types of presynaptic voltage-dependent calcium channels at CA3–CA1 synapses of the hippocampus. J Neurosci. 1994;14:5613–5622. doi: 10.1523/JNEUROSCI.14-09-05613.1994. [DOI] [PMC free article] [PubMed] [Google Scholar]
- 56.Zengel JE, Magleby KL. Changes in miniature endplate potential frequency during repetitive nerve stimulation in the presence of Ca2+, Ba2+, and Sr2+ at the frog neuromuscular junction. J Gen Physiol. 1981;77:503–529. doi: 10.1085/jgp.77.5.503. [DOI] [PMC free article] [PubMed] [Google Scholar]
- 57.Zhao M, Hollingworth S, Baylor SM. Properties of tri- and tetracarboxylate Ca2+ indicators in frog skeletal muscle fibers. Biophys J. 1996;70:896–916. doi: 10.1016/S0006-3495(96)79633-9. [DOI] [PMC free article] [PubMed] [Google Scholar]
- 58.Zucker RS. Calcium, short-term synaptic plasticity. Biomed Res. 1994;15[Suppl 1]:1–5. [Google Scholar]
- 59.Zucker RS, Lara-Estrella LO. Post-tetanic decay of evoked and spontaneous transmitter release and a residual-calcium model of synaptic facilitation at crayfish neuromuscular junctions. J Gen Physiol. 1983;81:355–372. doi: 10.1085/jgp.81.3.355. [DOI] [PMC free article] [PubMed] [Google Scholar]