

Abstract
DBA/2J (D2) and C57BL/6J (B6) mice exhibit differential sensitivity to seizures induced by various chemical and physical methods, with D2 mice being relatively sensitive and B6 mice relatively resistant. We conducted studies in mature D2, B6, F1, and F2 intercross mice to investigate behavioral seizure responses to pentylenetetrazol (PTZ) and to map the location of genes that influence this trait. Mice were injected with PTZ and observed for 45 min. Seizure parameters included latencies to focal clonus, generalized clonus, and maximal seizure. Latencies were used to calculate a seizure score that was used for quantitative mapping. F2 mice (n = 511) exhibited a wide range of latencies with two-thirds of the group expressing maximal seizure. Complementary statistical analyses identified loci on proximal (near D1Mit11) and distal chromosome 1 (near D1Mit17) as having the strongest and most significant effects in this model. Another locus of significant effect was detected on chromosome 5 (near D5Mit398). Suggestive evidence for additional PTZ seizure-related loci was detected on chromosomes 3, 4, and 6. Of the seizure-related loci identified in this study, those on chromosomes 1 (distal), 4, and 5 map close to loci previously identified in a similar F2 population tested with kainic acid. Results document that the complex genetic influences controlling seizure response in B6 and D2 mice are partially independent of the nature of the chemoconvulsant stimulus with a locus on distal chromosome 1 being of fundamental importance.
Keywords: seizure, quantitative trait loci, epilepsy, mice, pentylenetetrazol, genetics
Human epilepsies are complex neurobehavioral disorders resulting from abnormal excitability of neurons in various brain regions. The origin of abnormal excitability in a specific subset of neurons, an epileptic “focus”, and its subsequent propagation to secondary brain regions determines a specific clinical seizure phenotype. Although family (Beck-Mannagetta et al., 1989; Ottman et al., 1989) and twin studies (Berkovic et al., 1996) provide compelling evidence for genetic influences in epilepsy, the clinical and genetic heterogeneity characteristic of the epilepsies as a group have hindered the search for causative genes. Nonetheless, a number of significant genetic linkages have been reported (Leppert et al., 1989; Lehejoski et al., 1991; Lewis et al., 1993; Liu et al., 1995; Phillips et al., 1995), and several of these have led to the identification of mutated genes (Steinlein et al., 1995; Pennacchio et al., 1996; Biervert et al., 1998; Charlier et al., 1998). However, whereas human epilepsy genes isolated to date are involved in clinical syndromes inherited largely in Mendelian fashion, the majority of seizure disorders in humans are genetically complex. This provides a rationale for developing strategies to conduct a search for seizure-related genes of partial effect.
Identification and characterization of strain differences in complex phenotypic traits using experimental models provides a starting point for dissecting genetic influences involved in complex traits in humans. The well documented difference in seizure sensitivity between DBA and C57 mice is largely independent of the mode of seizure induction (Hall, 1947; Schlesinger et al., 1968; Taylor, 1976; Marley et al., 1986;Freund et al., 1987; Engstrom and Woodbury, 1988; Kosobud and Crabbe, 1990; Ferraro et al., 1995, 1997, 1998a) and offers a unique opportunity to study how differences between common allelic variants influence behavioral seizure responses. Use of seizure models involving administration of pentylenetetrazol (PTZ) are integral components in the process used to identify clinically useful anticonvulsant drugs (Porter et al., 1984) and, as such, the identification of murine genes involved in determining sensitivity to PTZ may provide important insight into the pathogenesis of certain forms of epilepsy in humans. Moreover, if genetic loci that influence seizure response to PTZ overlap loci that influence response to other convulsants, then it may be possible to localize genes of fundamental importance in controlling seizures in these strains of mice and, in doing so, provide candidate genes for examination in human epilepsy.
We have undertaken a systematic evaluation of PTZ-induced seizure responses in D2 and B6 mice and their F1 and F2 progeny. Previous work in our laboratory has identified genetic loci that influence the differential seizure response of these strains of mice to kainic acid, the locus of greatest effect mapping to the distal region of chromosome 1 (Ferraro et al., 1997). Results presented here confirm previous work on the relative seizure sensitivity of D2 mice compared to B6 mice and document that the differential response of these strains to PTZ is highly heritable with a multilocus determinism. Furthermore, several PTZ seizure-related loci detected in this study are in the same genomic vicinity as those mapped using a kainic acid seizure screening model, including the locus of largest effect on distal chromosome 1 (Ferraro et al., 1997).
MATERIALS AND METHODS
Animals
DBA/2J (D2) and C57BL/6J (B6) mice of both genders were purchased from the Jackson Laboratory (Bar Harbor, ME) at ages 5–6 weeks and bred in-house to propagate mice for these studies. Male D2 mice were crossed with female B6 mice to produce an F1 generation. F2 progeny were produced via F1 intercross. Mice were generally weaned at 4 weeks of age and then group housed (three or four mice per cage) by gender. Mice were maintained on a 12 hr light/dark schedule with food and water available ad libitum. All experiments were approved by Animal Care and Use Committees governing the participating laboratories.
Seizure testing
Testing was conducted when mice were 8–10 weeks of age using a single subcutaneous injection of PTZ (Sigma, St. Louis, MO). Mice were taken from their home cages and placed individually into Plexiglas cubicles (width, 15 cm; length, 20 cm; height, 30 cm) with a wire mesh floor for 30 min before PTZ injection. After injection, they were returned immediately to the cubicle and observed for 45 min. Latencies to focal (partial clonic), generalized (generalized clonic), and maximal (tonic-clonic) behavioral seizures were recorded. Three mice were observed simultaneously with seizure latencies derived using individual digital timing devices. A dose–response survey was conducted with male mice from each of the two parental strains (n = 7–20 per dose per strain) in order to determine a dose of PTZ that best distinguished their seizure sensitivity. Based on the results of these experiments (Table1), testing of F1 (n = 20) and F2 (n = 511) generation mice was conducted with a dose of 80 mg/kg, s.c. At the end of the 45 min observation period, mice were killed by cervical dislocation. Brain and liver were harvested and frozen at − 70°C. Nuclear DNA was extracted (Lahiri and Nurnberger, 1991) from liver, quantified using the 280/260 UV absorbance ratio, and diluted with deionized water to a final concentration of 15 ng/μl.
Table 1.
Tonic hindlimb extension in D2 and B6 micea treated with various doses of PTZ
| Strain | Dose (mg/kg, s.c.) | |||
|---|---|---|---|---|
| 60 | 70 | 80 | 90 | |
| D2 | 0 ± 0 (7) | 14 ± 7 (14) | 90 ± 7 (20) | 95 ± 5 (19) |
| B6 | 0 ± 0 (8) | 0 ± 0 (10) | 0 ± 0 (18)** | 14 ± 13 (15)* |
| F1 | 80 ± 10 (15) | |||
| F2 | 65 ± 2 (511) | |||
Values represent the percentage (±SE) of animals exhibiting tonic hindlimb extension. The number in parentheses indicates the number of mice treated.
**p = 0.0014; *p = 0.0046 versus respective D2 value (Fisher’s Exact Test, two-tailed).
PTZ seizure phenotype
We defined four phases in the continuum of behavioral response to subcutaneous PTZ injection.
Phase 1. Hypoactivity. This phase was characterized by a progressive decrease in motor activity until the animal came to rest in a crouched or prone position with abdomen in full contact with cage bottom.
Phase 2. Partial clonus: clonic seizure activity affecting face, head, and/or forelimb or forelimbs. Partial or focal seizures were brief, typically lasting 1 or 2 sec, and often accompanied by vocalizations. Partial seizures occurred either individually or in multiple discrete episodes before generalization.
Phase 3. Generalized clonus: sudden loss of upright posture, whole body clonus involving all four limbs and tail, rearing, and autonomic signs. At times phase 3 also included wild running and jumping, although typically these latter signs signaled the onset of a maximal seizure. The duration of generalized seizures was variable but typically involved behavioral changes lasting for 30–60 sec followed by a quiescent period. Most mice exhibited multiple generalized seizures irrespective of their subsequent status for tonic hindlimb extension.
Phase 4. Tonic-clonic (maximal) seizure: generalized seizure characterized by tonic hindlimb extension. Tonic-clonic maximal seizures were associated with death, although this could be avoided through the use of artificial respiratory techniques. Some mice recovered spontaneously. It was not unusual for mice to exhibit multiple episodes of tonic hindlimb extension within the 45 min observation period.
Seizure score
Latencies (inverse) to partial clonus (PC), generalized clonus (GC), and tonic-clonic (TC) seizures were summed to assign each mouse a seizure score that was used as a quantitative trait measure for mapping according to the following equation:
Seizure score = (0.2) (1/PC latency) + (0.3) (1/GC latency) + (0.5) (1/TC latency).
At the dose of PTZ used, all F2 mice exhibited partial and generalized clonic seizures. Only the most severely affected mice developed tonic-clonic seizures. The weighting factors (0.2, 0.3, and 0.5) were included as a means of incorporating a measure of the progressive nature of the PTZ-induced seizure phenotype into the severity rating because generalized clonus is regarded as a more significant event than partial clonus, and tonic hindlimb extension is regarded as the most severe component of the phenotype. In this way, the seizure score reflects the degree of progression of the seizure syndrome in each mouse. This strategy is similar to that used for mapping loci influencing kainic acid-induced seizures (Ferraro et al., 1997).
Genotyping
DNA markers used for genotyping were chosen from recently published maps based on a set of DNA microsatellite polymorphisms (Dietrich et al., 1996) with a spacing of 10–20 cM. An effort was made to use markers with alleles that differed in size between strains by >8 bp. For such markers, PCR-amplified sequences were analyzed by agarose gel electrophoresis with ethidium bromide staining (Ferraro et al., 1998b). After electrophoresis, genotypes were recorded from Polaroid 667 (3000 ISO) black and white prints by two independent readers and entered into a database for subsequent error checking through comparison of the two readings. Discrepancies were resolved by reference to a third reader. Irreconcilable discrepancies were discarded from analysis with the genotype listed as unknown. Alternatively, gels were analyzed with a digital gel documentation system (Gel Doc 1000; Bio-Rad, Hercules, CA) that provides thermal prints of digitized images from ethidium bromide-stained gels. For marker loci having alleles with <8 bp strain difference, genotyping involved the use of P32 end-labeled primers, PAGE, and autoradiography as described previously (Ferraro et al., 1997).
Data analysis
Latencies to the first partial and generalized seizure and to tonic hindlimb extension were recorded by a trained observer. All data were entered into a Microsoft Excel (Office 97) workbook, and statistical evaluation of seizure phenotypes was carried out with the Excel Analysis Toolpak or with Truepistat (Richardson, TX) statistics software. Results from dose–response experiments were analyzed with two-way ANOVA for strain, dose, and strain-by-dose interaction effects. Strain differences in expression of tonic hindlimb extension (maximal seizure) were investigated using Fisher’s Exact test. Gender differences were examined in F2 generation mice by comparison of percentages of males and females exhibiting a maximal seizure using contingency analysis and also by comparison of gender-specific means for each of the latency measures and the total seizure score using Student’s t test. Additionally, F2 mice were divided into two groups based on the presence or absence of tonic hindlimb extension (maximal seizure), and focal and generalized seizure latencies and seizure scores were compared in these groups using Student’st test.
The approach used for mapping PTZ seizure-related loci involved multiple analytic strategies used previously in studies of polygenic seizure models (Ferraro et al., 1997) as well as other polygenic models (Risch et al., 1993; McAleer et al., 1995; Schork et al., 1995). The first strategy involved evaluation of associations between genotypes determined at 92 marker loci and tonic-clonic seizure response through use of ANOVA and χ2 contingency procedures with marker locus genotypes taken as the grouping variables. χ2 analysis determines the probability that the distribution of genotypes within “seizure” and “no seizure” subgroups of mice differs significantly from what would be expected to occur, assuming independent segregation of alleles. Markers found to be significant in univariate χ2analyses (threshold, p < 0.02) were evaluated to determine which mode of inheritance gave best fit to the data. Construction of simple genetic models for the effects of putative seizure-related loci linked to each marker locus was carried out through use of linear logistic regression analysis as described previously (McAleer et al., 1995; Schork et al., 1995). The second strategy employed stepwise multiple regression analysis to simultaneously evaluate the influence of multiple locus (marker) effects that surpassed a liberal statistical threshold (p < 0.02) applied in the first strategy. Multivariate regression allows the examination of effects of multiple independent variables (genetic and phenotypic) on a quantitative or qualitative outcome variable and also facilitates evaluation of locus interactions. In the present study, the dependent variable for F2 mice was a tonic-clonic (maximal) seizure, and thus, for both contingency table and logistic regression analyses, F2 mice were grouped based on expression (n = 335) or no expression (n = 176) of tonic hindlimb extension. One outcome parameter of logistic regression analysis is an odds ratio that reflects the chance that a specific mouse will express a PTZ-induced maximal seizure if it harbors a specific genotype. The third analytic mapping strategy involved refining the position and effect of seizure-related loci through interval mapping using the standard (Lander et al., 1987; Lander and Botstein, 1989) and nonparametric (Kruglyak and Lander, 1995) Mapmaker programs with the overall seizure score taken as the quantitative mapping trait. Because seizure latencies served as quantitative parameters, and the presence of tonic-clonic activity added a heavily weighted component to the overall seizure score, mice expressing tonic-clonic seizures earned higher scores that were graded by seizure latency. The final analytic strategy involved investigating epistatic interactions between seizure-related loci using a logistic regression model (Schork et al., 1995) but made use of marker-based genetic models for loci evaluated in the second strategy. We view these analyses as complementary approaches for the dissection of a multilocus trait.
RESULTS
Dose–response studies and subsequent seizure testing documented the relative seizure susceptibility of D2 mice to PTZ compared to B6 mice. Tonic-clonic seizure responses were observed for D2 mice over the range of PTZ doses tested, whereas B6 mice were responsive only at the highest dose (Table 1). Based on these results, screening of F1 and F2 intercross progeny was conducted using a dose of 80 mg/kg, s.c. Table2 presents a summary of strain data for the seizure latency traits and the overall seizure score. Heritability estimates based on values for F1 and F2 variance indicated a substantial genetic component for each measure (Table3); however, these estimates are rough because they are based on relatively small numbers of observations. The distribution of F2 seizure scores is shown in Figure1. F2 mice distinguished by the expression of a tonic-clonic seizure were characterized by significantly shorter latencies to partial and generalized clonus and correspondingly greater seizure scores compared to F2 mice without tonic-clonic seizures (Table 4). There was no significant effect of weight (T = 0.495;p = 0.31) or gender (F = 2.029;p = 0.15, ANOVA) on latency measures or on expression of tonic-clonic seizure activity.
Table 2.
Summary of seizure trait parameters for B6, D2, F1, and F2 generation mice treated with PTZa
| Strain | n | Partial clonus latency | Generalized clonus latency | Tonic-clonic latency | Seizure score | ||||
|---|---|---|---|---|---|---|---|---|---|
| Mean | Variance | Mean | Variance | Mean | Variance | Mean | Variance | ||
| B6 | 18 | 8.67* | 2.80 | 15.7** | 4.36 | 2.5*** | 0.85 | ||
| D2 | 20 | 3.95 | 1.66 | 4.42 | 2.49 | 16.7 | 7.56 | 12.3 | 3.0 |
| F1 | 15 | 5.73 | 4.71 | 6.74 | 4.78 | 34.9 | 134 | 8.44 | 17.2 |
| F2 | 511 | 5.73 | 8.98 | 7.26 | 15.3 | 23.5 | 192 | 9.64 | 60.5 |
Mice were given a single injection of PTZ (80 mg/kg, s.c.) and observed for 45 min to record latencies and determine seizure phenotype. Values for mean and variance are expressed in minutes.
*p < 0.005; **p < 0.001; ***p < 0.0005 versus respective D2 value (ANOVA, Neuman–Keuls).
Table 3.
Heritability (h2) estimatesa for PTZ seizure traits
| Trait | h2 |
|---|---|
| Latency to partial clonus | 0.48 |
| Latency to generalized clonus | 0.69 |
| Latency to tonic hindlimb extension | 0.30 |
| Seizure score | 0.71 |
Heritability was estimated as the difference between F2 and F1 generation variances (see Table 2) following log transformation of latency data.
Fig. 1.

Distribution of seizure scores among F2 mice. Scores were calculated as described in Materials and Methods. Other population summary data are given in Tables 2 and 3.
Table 4.
Comparison of clonic seizure latencies and seizure scores in F2 generation mice as a function of maximal seizure statusa
| F2 Mice with maximal seizure (n = 335) | F2 Mice with no maximal seizure (n = 176) | |
|---|---|---|
| Latency4-b to partial clonus | 5.11 ± 2.53* | 6.69 ± 3.15 |
| Latency to generalized clonus | 6.48 ± 3.32** | 8.44 ± 4.28 |
| Seizure score | 11.8 ± 8.1*** | 5.44 ± 4.85 |
F2 mice (n = 511) were given a single injection of PTZ (80 mg/kg, s.c.) and observed for behavioral seizure activity.
Seizure latencies are given in minutes; seizure scores are arbitrary units.
*p < 10−7; **p < 10−6; ***p < 10−10.
Genome scanning used a total of 92 DNA markers with the mean (± SD) interval for adjacent markers estimated to be 14.5 ± 6.5 cM. The largest interval was 29 cM between markers D18Mit29 and D18Mit123. Other intervals greater than 20 cM included D4Mit303—D4Mit189 (27.5 cM), D6Mit159—D6Mit243 (23.5 cM), D8Mit287—D8Mit69 (23 cM), D12Mit182—D12Mit114 (27 cM), and D16Mit9—D16Mit13 (23.6 cM). Contingency analysis conducted to examine the association between genotype and tonic-clonic seizure phenotype detected groups of linked markers on chromosomes 1, 5, and 6 with additional individual markers detected on chromosomes 3 and 18 (Table5). Logistic regression analysis revealed significant or suggestive evidence for linkage on chromosomes 1, 3, 5, and 6 (Table 6). As expected for a polygenic trait, PTZ seizure susceptibility loci are derived from both “sensitive” (D2) and “resistant” (B6) strains with D2-derived susceptibility alleles on chromosomes 1 and 6 and B6-derived susceptibility alleles on chromosomes 3 and 5.
Table 5.
PTZ-induced seizure-related loci: univariate contingency table analysis of allele frequencies and seizure response in F2 generation mice
| Marker | χ25-a | pValue5-b | Susceptibility allele | Mode5-c |
|---|---|---|---|---|
| D1Mit235 | 12.6 | 0.002 | D2 | A |
| D1Mit7 | 42.9 | 10−9 | D2 | D |
| D1Mit11 | 48.1 | 10−9 | D2 | A |
| D1Mit54 | 36.8 | 10−7 | D2 | A |
| D1Mit30 | 41.7 | 10−9 | D2 | A |
| D1Mit16 | 22.3 | 10−4 | D2 | A |
| D1Mit150 | 36.2 | 10−7 | D2 | A |
| D1Mit17 | 18.8 | 10−4 | D2 | A |
| D3Mit268 | 11.6 | 0.003 | B6 | D |
| D5Mit11 | 13.2 | 10−3 | B6 | R |
| D5Mit15 | 10.2 | 0.006 | B6 | R |
| D5Mit398 | 14.1 | 10−3 | B6 | R |
| D5Mit95 | 11.6 | 0.003 | B6 | R |
| D6Mit102 | 9.9 | 0.007 | D2 | D |
| D6Mit55 | 7.6 | 0.02 | D2 | D |
| D6Mit59 | 9.0 | 0.01 | D2 | D |
| D18Mit49 | 8.4 | 0.015 | D2 | D |
Represents the association between genotype and seizure status based on the presence (n = 335) or absence (n = 176) of a PTZ-induced tonic-clonic seizure.
Only markers attaining a p < 0.02 threshold are shown.
Mode of inheritance was determined by best-fit regression analysis following marker recoding with seizure status as the dependent variable (D, dominant; R, recessive; A, additive).
Table 6.
PTZ-induced seizure-related loci: multivariate stepwise logistic regression analysisa
| Marker6-b | Coeff ± SE6-c | Wald χ2 | pvalue6-d | Odds ratio6-e |
|---|---|---|---|---|
| D1Mit11 | 1.87 ± 0.45 | 17.0 | <0.0001 | 6.50 |
| D1Mit17 | 1.42 ± 0.45 | 10.0 | 0.0015 | 4.16 |
| D3Mit268 | 0.88 ± 0.34 | 6.85 | 0.0089 | 2.41 |
| D5Mit398 | 1.18 ± 0.42 | 8.19 | 0.0042 | 3.25 |
| D6Mit102 | 1.13 ± 0.33 | 12.0 | 0.0005 | 3.09 |
Regression was conducted with the dependent variable defined as the presence (n = 335) or absence (n = 176) of tonic-clonic seizure activity.
Markers with significant phenotype-predictive value (see Table 5 for markers entered into analysis). Marker data were recoded to reflect the best-fitting mode of inheritance. Results are expressed in terms of the seizure-susceptibility allele.
Mean regression coefficient (±SEM) for the marker.
Probability that the regression coefficient equals 0.00.
Odds of expressing a PTZ-induced tonic-clonic seizure when possessing the susceptibility genotype at the indicated marker locus.
Multipoint interval mapping conducted on the full dataset demonstrated significant or suggestive evidence for linkage on three chromosomes, supporting results from logistic regression analysis for loci on chromosomes 1 and 5. In addition to corroborating locus effects that were detected by multivariate regression, interval mapping also yielded suggestive evidence for a B6-derived susceptibility locus on chromosome 4. Logarithm of odds (LOD) plots for chromosomes 1, 4, and 5 are shown in Figure 2A–C. The peak LOD score on chromosome 1 (Fig. 2A) was associated with more distal markers D1Mit30 and D1Mit16 (LOD = 12.7, with 14.7% of total variance explained), whereas a second LOD peak was detected more proximally, near markers D1Mit7 and D1Mit11 (LOD = 10.3 with 11.6% of total variance explained). This result is consistent with retention of both proximal and distal chromosome 1 markers in the logistic regression analysis and suggests the presence of at least two distinct seizure-susceptibility loci on chromosome 1. Analyses conducted using the nonparametric version of Mapmaker/QTL yielded similar evidence for linkage on chromosome 1 (data not shown). Interestingly, the location of the distal chromosome 1 LOD peak coincides closely with the peak LOD score obtained in a previously reported study of kainic acid (KA)-induced seizure susceptibility in these two strains of mice (Ferraro et al., 1997). The KA LOD plot for chromosome 1 markers is redrawn in Figure 2A for purposes of comparison with the PTZ plot. Genome-wide interval mapping also revealed the presence of a significant PTZ seizure-related locus on chromosome 5 (LOD = 4.18 with 5.8% of the total variance explained) and a suggestive locus on chromosome 4 (LOD = 3.14 with 4.6% of the variance explained).
Fig. 2.
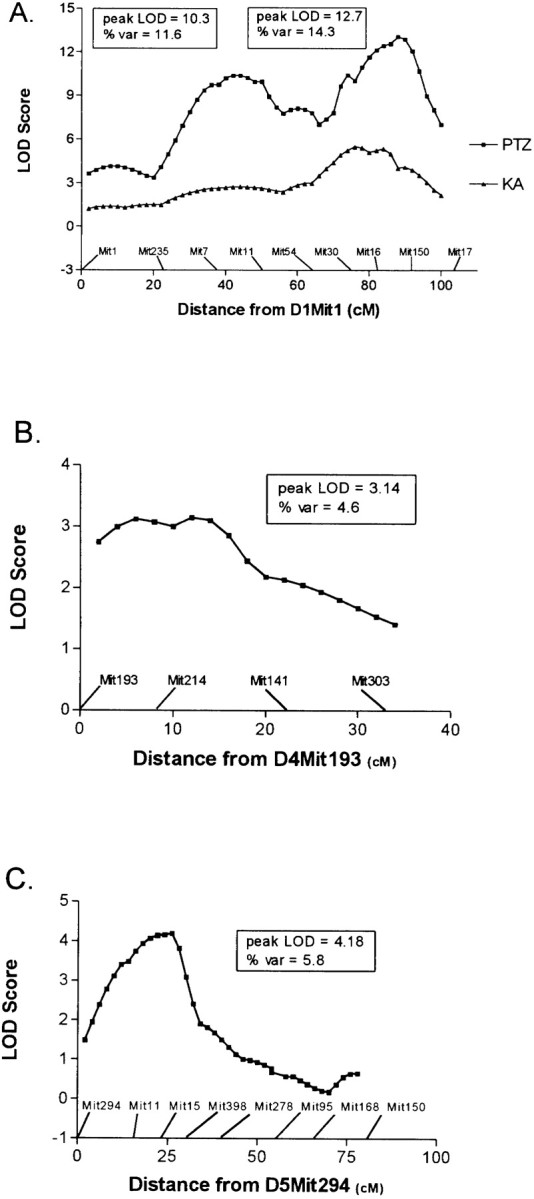
Genetic maps indicating interval LOD scores for linkage to loci controlling PTZ-induced seizure susceptibility in F2 mice. LOD scores were determined with Mapmaker/QTL using seizure score as the trait measure. Scores represent the results of model-independent analyses. A, Chromosome 1 [for comparison, this plot also contains data on kainic acid seizure susceptibility redrawn fromFerraro et al., (1997)]; B, chromosome 4;C, chromosome 5.
Epistatic interactions between mapped loci were evaluated in a stepwise logistic regression model (Table 7). The main effects fixed in this analysis were the five markers from Table 5. Overall the results indicate two significant interactions involving D3Mit268, one with D1Mit17 and another with D5Mit398. As is evident, the main effects from these three loci are diminished in this model because their effects are explained by epistasis. Thus, with regard to the D2-derived major susceptibility allele on distal chromosome 1, its effect to increase PTZ-induced seizure risk is only observed in the presence of a B6-derived allele at D3Mit268.
Table 7.
Epistatic interactions between PTZ-induced seizure-related loci: multivariate stepwise logistic regression analysisa
| Marker7-b | Coeff ± SE7-c | Wald χ2 | pvalue7-d | Odds ratio7-e |
|---|---|---|---|---|
| D1Mit11 | 1.75 ± 0.37 | 22.1 | <0.0001 | 5.78 |
| D1Mit17 | −0.16 ± 0.65 | 0.06 | 0.81 | 0.85 |
| D3Mit268 | −0.30 ± 0.50 | 0.37 | 0.54 | 0.73 |
| D5Mit398 | −0.20 ± 0.63 | 0.11 | 0.74 | 0.81 |
| D6Mit102 | 0.91 ± 0.27 | 11.1 | 0.0009 | 2.48 |
| D1Mit17*D3Mit268 | 1.85 ± 0.79 | 5.56 | 0.018 | 6.39 |
| D3Mit268*D5Mit398 | 1.72 ± 0.76 | 5.10 | 0.024 | 5.56 |
Regression was conducted with the dependent variable defined as the presence (n = 335) or absence (n = 176) of tonic-clonic seizure activity.
Main effects (Table 5 markers) were fixed in this analysis. Marker data were recoded to reflect the best-fitting mode of inheritance. Results are expressed in terms of the seizure-susceptibility allele.
Mean regression coefficient (±SEM) for the marker.
Probability that the regression coefficient equals 0.00.
Odds of expressing a PTZ-induced tonic-clonic seizure when possessing the susceptibility genotype at the indicated marker locus or loci.
DISCUSSION
We have conducted a full genome scan to detect influences mediating sensitivity to maximal seizures induced by PTZ and show that a locus on distal chromosome 1 near markers D1Mit16 and D1Mit17 exerts the most prominent genetic effect in this model. Based on recent convention (Lander and Kruglyak, 1995), this locus surpasses criteria for declaring significant linkage. In addition, the position of the chromosome 1 locus reported in the present PTZ-induced seizure model corresponds closely with the location of a chromosome 1 influence (near D1Mit16) detected in a KA-induced seizure model (Ferraro et al., 1997) consistent with the possibility that the underlying genes are identical. The fundamental importance of the D2-derived seizure susceptibility gene or genes represented by this distal chromosome 1 locus is underscored and given added biological significance by virtue of the fact that the KA model of seizure induction is mechanistically different from that using PTZ. Whereas PTZ-induced seizures are initiated by blockade of brain GABA receptors (Olsen, 1981;Ramanjaneyulu and Ticku, 1984), KA-induced seizures are initiated by activation of glutamate receptors (Simon et al., 1976). It is likely that a genetic locus that affects the broad function of the two main neurotransmitter systems in the CNS may represent an important component of a final common pathway for regulating neuronal excitability. We also have preliminary results indicating that the influence of the seizure susceptibility locus on distal chromosome 1 crosses over into a nonpharmacological seizure induction paradigm involving maximal electroshock threshold (Ferraro et al., 1998a,c).
Additional evidence for a seizure-related influence on distal mouse chromosome 1 comes from a recent report involving a model of ethanol withdrawal (Buck et al., 1997) suggesting that the withdrawal severity locus detected in that study may reflect a generally lower seizure threshold in D2 compared to B6 mice rather than being related specifically to physiological dependence on ethanol. Several other polygenic mouse models of epilepsy have been studied, but none have been shown to involve chromosome 1 loci (Frankel et al., 1994, 1995;Martin et al., 1995). It is particularly noteworthy that none of the loci for audiogenic seizure susceptibility map to chromosome 1 (Neumann and Collins, 1991); however, since D2 mice develop resistance to audiogenic seizures as they mature yet are sensitive to electroshock and PTZ seizures, it is likely that different genes are involved, with audiogenic seizure sensitivity mediated by genes whose expression is under developmental control. This phenomenon might be related to a brain region-specific alteration in gene expression because audiogenic seizures involve auditory and vestibular pathways that may not be involved in maximal electroshock seizure threshold or PTZ seizures. Another possibility is that the chromosome 1 locus does have an influence on sensitivity to audiogenic seizures but that the effect is relatively small compared to Asp1, Asp2, andAsp3 and escapes detection by the methods that were used for study. Nonetheless, the possibility that the same distal chromosome 1 locus participates in controlling neuronal hyperexcitability in such diverse models as PTZ, KA, and ethanol-withdrawal seizures provides considerable impetus to identify the responsible gene or genes, and those genes whose protein products are involved in transmembrane ion flux represent logical candidates (Ferraro and Buono, 1999). Based on this idea, candidates on distal chromosome 1 include genes for subunits of Na,K-ATPase (Atp1a2, Atp1b1) and a potassium channel gene (Kcnj10).
In addition to the distal chromosome 1 locus of significant effect, a second chromosome 1 locus that also exceeds criteria for declaring significant linkage (Lander and Kruglyak, 1995) was detected more proximally. Although the interval mapping procedure inherent in the Mapmaker/QTL program does not reliably distinguish two linked trait-influencing loci from a single locus, the detection of two discrete LOD peaks in the Mapmaker analysis (Fig. 2A) is consistent with retention of two distinct chromosome 1 loci in the multivariate regression analysis (Table 5) and suggests that there is also a proximal seizure-related locus on chromosome 1 that influences the differential response of D2 and B6 mice to PTZ. This locus was not detected in the KA model (Ferraro et al., 1997) and has not been reported to be involved in other multigenic seizure models to our knowledge. A relevant candidate gene near this locus isSlc4a3, the gene for an anoin transport protein. The use of interval-specific congenic strains will help to dissect these two potentially distinct chromosome 1 influences.
Among other loci that meet proposed criteria for significant or suggestive linkage (Lander and Kruglyak, 1995), the locus on chromosome 5 near marker D5Mit398 represents another influence whose location overlaps that of a KA seizure-related locus (Ferraro et al., 1997). In the present study, the chromosome 5 locus was detected both with interval mapping procedures as well as with multivariate analysis. Consistent with results from the KA model, the chromosome 5 seizure-susceptibility allele is derived from the relatively seizure-resistant B6 strain and functions in a recessive mode. Although the location of this locus appears to map slightly more distal than that reported in the KA study, it is nonetheless within a 1-LOD confidence interval and may reflect the same genetic influence. To our knowledge, this locus does not coincide with seizure susceptibility loci reported by other investigators. Relevant candidate genes near this locus include Gabra2 and Gabrb1, which code for subunits of GABA receptors.
Novel QTLs detected in this study include a D2-derived susceptibility factor on chromosome 6 near D6Mit102 and a B6-derived susceptibility factor on chromosome 3 near D3Mit268. Although these regions have not been identified as harboring susceptibility factors in other polygenic seizure models, the chromosome 6 influence maps to the general vicinity of genes studied in several knock-out mice with seizure-related phenotypes, including the neuropeptide Y gene Npy (Erickson et al., 1996), a potassium channel gene, Kcna1 (Smart et al., 1998), a gene for an inositol triphosphate receptor,Itpr1 (Matsumoto et al., 1996), and the tumor necrosis factor receptor genes Tnfrsf1a and Tnfrsf1b(Bruce et al., 1996). The possibility that these genes represent genes of partial effect in controlling seizure responsiveness in multifactorial models deserves investigation with regard to natural variation in sequences between B6 and D2 mice.
Interval mapping also yielded suggestive evidence for a seizure-related locus on the proximal part of chromosome 4. This effect is relatively weak and might be expected to occur by chance frequently enough in a genome scan as to be regarded as a potential false-positive result. Interestingly, a proximal chromosome 4 locus was also detected in the KA study, however in that case, the seizure susceptibility allele originated in the B6 strain (Ferraro et al., 1997), whereas in the present study, higher PTZ seizure scores are associated with the presence of D2 alleles. It is possible that the locus detected here may be related to the audiogenic seizure susceptibility locusAsp-2, a D2-derived susceptibility factor mapped to this approximate chromosome 4 region (Neumann and Collins, 1991) or to a D2 susceptibility locus for ethanol withdrawal-induced seizures also recently mapped to this area (Buck et al., 1997). The possibility that this locus influences such diverse seizure phenotypes suggests that it too may represent a fundamentally important gene involved in neuronal hyperexcitability.
In summary, we continue to characterize the genetic factors that mediate the dramatic difference in seizure response between D2 and B6 mice. Based on results of this and previous studies (Ferraro et al., 1997), we conclude that, like susceptibility to kainic acid-induced seizures, sensitivity to PTZ-induced seizures is a multifactorial trait with the strongest genetic influence originating from the distal region of chromosome 1. Isolation of the gene or genes responsible for this effect may lead to fundamental new insights into the control of neuronal excitability and the understanding of seizure disorders.
Footnotes
This work was supported by National Institutes of Health Grant NS33243. We thank Lisa Tarrantino for assistance with nonparametric Mapmaker analyses.
Correspondence should be addressed to Dr. Thomas N. Ferraro, University of Pennsylvania, Department of Psychiatry, Center for Neurobiology and Behavior, Room 127 CRB, 415 Curie Boulevard, Philadelphia, PA 19104-6140.
REFERENCES
- 1.Beck-Mannagetta G, Janz D, Hoffmeister U. Morbidity for seizures and epilepsy in offspring of patients with epilepsy. In: Beck-Mannagetta G, Anderson VE, Doose H, editors. Genetics of the epilepsies. Springer; Berlin: 1989. pp. 119–126. [Google Scholar]
- 2.Berkovic SF, McIntosh A, Howell RA, Mitchell A, Sheffield LJ, Hopper JL. Familial temporal lobe epilepsy: a common disorder identified in twins. Ann Neurol. 1996;40:227–235. doi: 10.1002/ana.410400214. [DOI] [PubMed] [Google Scholar]
- 3.Biervert C, Schroeder BC, Kubisch C, Berkovic SF, Propping P, Jentsch TJ, Steinlein OK. A potassium channel mutation in neonatal human epilepsy. Science. 1998;279:403–406. doi: 10.1126/science.279.5349.403. [DOI] [PubMed] [Google Scholar]
- 4.Bruce AJ, Boling W, Kindy MS, Peschon J, Kraemer PJ, Carpenter MK, Holtsberg FW, Mattson MP. Altered neuronal and microglial responses to excitotoxic and ischemic brain injury in mice lacking TNF receptors. Nat Med. 1996;2:788–794. doi: 10.1038/nm0796-788. [DOI] [PubMed] [Google Scholar]
- 5.Buck KJ, Metten P, Belknap J, Crabbe JC. Quantitative trait loci involved in genetic predisposition to acute alcohol withdrawal in mice. J Neurosci. 1997;17:3946–3955. doi: 10.1523/JNEUROSCI.17-10-03946.1997. [DOI] [PMC free article] [PubMed] [Google Scholar]
- 6.Charlier C, Singh NA, Ryan SG, Lewis TB, Reus BE, Leach RJ, Leppert M. A pore mutation in a novel KQT-like potassium channel gene in an idiopathic epilepsy family. Nat Genet. 1998;18:53–55. doi: 10.1038/ng0198-53. [DOI] [PubMed] [Google Scholar]
- 7.Dietrich W, Miller J, Steen R, Merchant M, Damron-Boles D, Husain Z, Dredge R, Daly M, Ingalls K, O’Connor T, Evans C, DeAngelis M, Levinson D, Kruglyak L, Goodman N, Copeland N, Jenkins N, Hawkins T, Lincoln S, Page D, Lander E. A comprehensive genetic map of the mouse genome. Nature. 1996;380:149–152. doi: 10.1038/380149a0. [DOI] [PubMed] [Google Scholar]
- 8.Engstrom F, Woodbury DM. Seizure susceptibility in DBA and C57 mice: the effects of various convulsants. Epilepsia. 1988;29:389–395. doi: 10.1111/j.1528-1157.1988.tb03736.x. [DOI] [PubMed] [Google Scholar]
- 9.Erickson JC, Clegg KE, Palmiter RD. Sensitivity to leptin and susceptibility to seizures of mice lacking neuropeptide Y. Nature. 1996;381:415–418. doi: 10.1038/381415a0. [DOI] [PubMed] [Google Scholar]
- 10.Ferraro TN, Buono RJ. The genetics of epilepsy: mouse and human studies. In: Pfaff DW, Maxson SC, Berretini WH, Joh TH, editors. Handbook of genetic influences on the nervous system. CRC; Boca Raton, FL: 1999. pp. 117–145. [Google Scholar]
- 11.Ferraro TN, Golden GT, Smith GG, Berrettini WH. Differential susceptibility to seizures induced by systemic kainic acid treatment in mature DBA/2J and C57BL/6J mice. Epilepsia. 1995;36:301–307. doi: 10.1111/j.1528-1157.1995.tb00999.x. [DOI] [PubMed] [Google Scholar]
- 12.Ferraro TN, Golden GT, Smith GG, Schork NJ, St. Jean P, Ballas C, Choi H, Berrettini WH. Mapping murine loci for seizure response to kainic acid. Mamm Genome. 1997;8:200–208. doi: 10.1007/s003359900389. [DOI] [PubMed] [Google Scholar]
- 13.Ferraro TN, Golden GT, Snyder R, Laibinis M, Smith GG, Buono RJ, Berrettini WH. Genetic influences on electrical seizure threshold. Brain Res. 1998a;813:207–210. doi: 10.1016/s0006-8993(98)01013-0. [DOI] [PubMed] [Google Scholar]
- 14.Ferraro TN, Schill JF, Ballas C, Mulholland N, Golden GT, Smith GG, Buono RJ, Berrettini WB. Genotyping microsatellite polymorphisms by agarose gel electrophoresis with ethidium bromide staining: application to quantitative trait loci analysis of seizure susceptibility in mice. Psychiatr Genet. 1998b;8:227–233. doi: 10.1097/00041444-199808040-00005. [DOI] [PubMed] [Google Scholar]
- 15.Ferraro TN, Golden GT, Laibinis M, Smith GG, Longman RE, Mulholland N, Zamboni D, Buono RJ, Berrettini WH. Quantitative trait locus (QTL) for maximal electroshock seizure threshold (MEST) in C57BL/6J (B6) and DBA/2J (D2) mice maps to distal chromosome 1. Soc Neurosci Abstr. 1998c;24:777. [Google Scholar]
- 16.Frankel WN, Taylor BA, Noebels JL, Lutz CM. Genetics epilepsy model derived from common inbred mouse strains. Genetics. 1994;138:1–9. doi: 10.1093/genetics/138.2.481. [DOI] [PMC free article] [PubMed] [Google Scholar]
- 17.Frankel WN, Valenzuela A, Lutz CM, Johnson EW, Dietrich WF, Coffin JM. New seizure frequency QTL and the complex genetics of epilepsy in EL mice. Mamm Genome. 1995;6:830–838. doi: 10.1007/BF00292431. [DOI] [PubMed] [Google Scholar]
- 18.Freund RK, Marley RJ, Wehner JM. Differential sensitivity to bicuculline in three inbred mouse strains. Brain Res Bull. 1987;18:657–662. doi: 10.1016/0361-9230(87)90135-3. [DOI] [PubMed] [Google Scholar]
- 19.Hall CS. Genetic differences in fatal audiogenic seizures between two inbred strains of house mice. J Hered. 1947;38:2–6. [PubMed] [Google Scholar]
- 20.Kosobud AE, Crabbe JC. Genetic correlations among inbred strain sensitivities to convulsions induced by 9 convulsant drugs. Brain Res. 1990;526:8–16. doi: 10.1016/0006-8993(90)90243-5. [DOI] [PubMed] [Google Scholar]
- 21.Krugylak L, Lander ES. A nonparametric approach for mapping quantitative trait loci. Genetics. 1995;139:1421–1428. doi: 10.1093/genetics/139.3.1421. [DOI] [PMC free article] [PubMed] [Google Scholar]
- 22.Lahiri DK, Nurnberger JI. A rapid non-enzymatic method for the preparation of high molecular weight DNA from blood for RFLP studies. Nucleic Acids Res. 1991;19:5444. doi: 10.1093/nar/19.19.5444. [DOI] [PMC free article] [PubMed] [Google Scholar]
- 23.Lander ES, Botstein D. Mapping Mendelian factors underlying quantitative traits using RFLP linkage maps. Genetics. 1989;121:185–199. doi: 10.1093/genetics/121.1.185. [DOI] [PMC free article] [PubMed] [Google Scholar]
- 24.Lander ES, Kruglyak L. Genetic dissection of complex traits: guidelines for interpreting and reporting linkage results. Nat Genet. 1995;11:241–247. doi: 10.1038/ng1195-241. [DOI] [PubMed] [Google Scholar]
- 25.Lander ES, Green P, Abrahamson J, Barlow A, Daly MJ, Lincoln SE, Newburg L. MAPMAKER: An interactive computer package for constructing primary genetic linkage maps of experimental and natural populations. Genomics. 1987;1:174–181. doi: 10.1016/0888-7543(87)90010-3. [DOI] [PubMed] [Google Scholar]
- 26.Lehejoski AE, Koskiniemi M, Sistonen P, Miao J, Hastbacka J, Norio R, de la Chapelle A. Localization of a gene for progressive myoclonus epilepsy to chromosome 21q22. Proc Natl Acad Sci USA. 1991;88:3696–3699. doi: 10.1073/pnas.88.9.3696. [DOI] [PMC free article] [PubMed] [Google Scholar]
- 27.Leppert M, Anderson VE, Quattlebaum T, Stauffer D, O’Connell P, Nakamura Y, Laloulel JM, White R. Benign neonatal familial convulsions linked to genetic markers on chromosome 20. Nature. 1989;337:647–648. doi: 10.1038/337647a0. [DOI] [PubMed] [Google Scholar]
- 28.Lewis TB, Leach RJ, Ward K, O’Connell P, Ryan SG. Genetic heterogeneity in benign neonatal familial convulsions: identification of a new locus on chromosome 8q. Am J Hum Genet. 1993;53:670–675. [PMC free article] [PubMed] [Google Scholar]
- 29.Liu AW, Delgado-Escueta AV, Serratosa JM, Alonso ME, Medina MT, Gee MN, Cordova S, Zhao HZ, Spellman JM, Ramos Peek JR, Donnadieu FR, Sparkes RS. Juvenile myoclonic epilepsy locus in chromosome 6p21.2-p11: linkage to convulsions and electroencephalograghy trait. Am J Hum Genet. 1995;57:368–381. [PMC free article] [PubMed] [Google Scholar]
- 30.Marley RJ, Gaffney D, Wehner JM. Genetic influences on GABA-related seizures. Pharmacol Biochem Behav. 1986;24:665–672. doi: 10.1016/0091-3057(86)90572-1. [DOI] [PubMed] [Google Scholar]
- 31.Martin B, Clement Y, Venault P, Chapouthier G. Mouse chromosomes 4 and 13 are involved in B-carboline-induced seizures. J Hered. 1995;86:274–279. doi: 10.1093/oxfordjournals.jhered.a111581. [DOI] [PubMed] [Google Scholar]
- 32.Matsumoto M, Nakagawa T, Inoue T, Nagata E, Tanaka K, Takano H, Minowa O, Kuno J, Sakakibara S, Yamada M, Yoneshima H, Miyawaki A, Fukuuchi Y, Furuichi T, Okano H, Mikoshiba K, Noda T. Ataxia and epileptic seizures in mice lacking type 1 inositol 1,4,5-trisphosphate receptor. Nature. 1996;379:168–171. doi: 10.1038/379168a0. [DOI] [PubMed] [Google Scholar]
- 33.McAleer MA, Reifsnyder P, Palmer SM, Prochazka M, Love JM, Copeman JB, Powell EE, Rodrigues NR, Prins JB, Serreze DV, DeLarato NH, Wicker LS, Peterson LB, Schork NJ, Todd JA, Leiter EH. Crosses of NOD mice with the related NON strain. Diabetes. 1995;44:1186–1195. doi: 10.2337/diab.44.10.1186. [DOI] [PubMed] [Google Scholar]
- 34.Neumann PE, Collins RL. Genetic dissection of susceptibility to audiogenic seizures in inbred mice. Proc Natl Acad Sci USA. 1991;88:5408–5412. doi: 10.1073/pnas.88.12.5408. [DOI] [PMC free article] [PubMed] [Google Scholar]
- 35.Neumann PE, Seyfried TN. Mapping of two genes that influence susceptibility to audiogenic seizures in crosses of C57BL/6J and DBA/2J mice. Behav Genet. 1990;20:307–323. doi: 10.1007/BF01067798. [DOI] [PubMed] [Google Scholar]
- 36.Olsen RW. The GABA postsynaptic membrane receptor-ionophore complex. Site of action of convulsant and anticonvulsant drugs. Mol Cell Biochem. 1981;39:261–279. doi: 10.1007/BF00232579. [DOI] [PubMed] [Google Scholar]
- 37.Ottman R, Annegers JF, Hauser WA. Seizure risk in offspring of parents with generalized vs. partial epilepsy. Epilepsia. 1989;30:157–161. doi: 10.1111/j.1528-1157.1989.tb05448.x. [DOI] [PubMed] [Google Scholar]
- 38.Pennachio LA, Lehesjoki AE, Stone NE, Willour VL, Virtaneva K, Miao J, D’Amato E, Ramirez L, Faham M, Koskikiemi M, Warrington JA, Norio R, de la Chapelle A, Cox DR, Myers RM. Mutations in the gene encoding cystatin B in progressive myoclonus epilepsy (EPM1). Science. 1996;271:1731–1734. doi: 10.1126/science.271.5256.1731. [DOI] [PubMed] [Google Scholar]
- 39.Phillips HA, Scheffer IE, Berkovic SF, Hollway GE, Sutherland GR, Mulley JC. Localization of a gene for autosomal dominant nocturnal frontal lobe epilepsy to chromosome 20q13.2. Nat Genet. 1995;10:117–118. doi: 10.1038/ng0595-117. [DOI] [PubMed] [Google Scholar]
- 40.Porter RJ, Cereghino JJ, Gladding GD, Hessie BJ, Kupferberg HJ, Scoville B, White BG. Antiepileptic drug development program. Cleve Clin Q. 1984;51:293–305. doi: 10.3949/ccjm.51.2.293. [DOI] [PubMed] [Google Scholar]
- 41.Ramanjaneyulu R, Ticku MK. Interactions of pentamethylenetetrazole and tetrazole analogues with the picrotoxinin site of the benzodiazepine-GABA receptor-ionophore complex. Eur J Pharmacol. 1984;98:337–345. doi: 10.1016/0014-2999(84)90282-6. [DOI] [PubMed] [Google Scholar]
- 42.Risch N, Ghosh S, Todd JA. Statistical evaluation of multiple-locus linkage data in experimental species and its relevance to human studies: application to nonobese diabetic (NOD) mouse and human insulin-dependent diabetes mellitus (IDDM). Am J Hum Genet. 1993;S3:702–714. [PMC free article] [PubMed] [Google Scholar]
- 43.Schlesinger K, Boggan WO, Griek BJ. Pharmacogenetic correlates of pentylenetetrazole and electroconvulsive seizure thresholds in mice. Psychopharmacology (Berl) 1968;13:181–188. doi: 10.1007/BF00401398. [DOI] [PubMed] [Google Scholar]
- 44.Schork NJ, Krieger JE, Trolliet MR, Franchini KG, Koike G, Krieger EM, Lander ES, Dzau VJ, Jacob HJ. A biometrical genome search in rats reveals the multigenic basis of blood pressure variation. Genome Res. 1995;5:164–172. doi: 10.1101/gr.5.2.164. [DOI] [PubMed] [Google Scholar]
- 45.Simon JR, Contrera JF, Kuhar MJ. Binding of 3H-kainic acid, an analogue of L-glutamate to brain membranes. J Neurochem. 1976;26:141–147. [PubMed] [Google Scholar]
- 46.Smart SL, Lopantsev V, Zhang CL, Robbins CA, Wang H, Chiu SY, Schwartzkroin PA, Messing A, Tempel BL. Deletion of the K(V)1.1 potassium channel causes epilepsy in mice. Neuron. 1998;20:809–819. doi: 10.1016/s0896-6273(00)81018-1. [DOI] [PubMed] [Google Scholar]
- 47.Steinlein OK, Mulley JC, Propping P, Wallace RH, Phillips HA, Sutherland GR, Scheffer IE, Berkovic SE. A missense mutation in the neuronal nicotinic acetylcholine receptor a4 subunit is associated with autosomal dominant nocturnal frontal lobe epilepsy. Nat Genet. 1995;11:201–203. doi: 10.1038/ng1095-201. [DOI] [PubMed] [Google Scholar]
- 48.Taylor BA. Genetic analysis of susceptibility to isoniazid-induced seizures in mice. Genetics. 1976;83:373–377. doi: 10.1093/genetics/83.2.373. [DOI] [PMC free article] [PubMed] [Google Scholar]