

Abstract
Neuronal oscillations in the gamma band (above 30 Hz) have been proposed to be a possible mechanism for the visual representation of objects. The present study examined the topography of gamma band spectral power and event-related potentials in human EEG associated with perceptual switching effected by rotating ambiguous (bistable) figures. Eleven healthy human subjects were presented two rotating bistable figures: first, a face figure that allowed perception of a sad or happy face depending on orientation and therefore caused a perceptual switch at defined points in time when rotated, and, second, a modified version of the Rubin vase, allowing perception as a vase or two faces whereby the switch was orientation-independent. Nonrotating figures served as further control stimuli. EEG was recorded using a high-density array with 128 electrodes. We found a negative event-related potential associated with the switching of the sad–happy figure, which was most pronounced at central prefrontal sites. Gamma band activity (GBA) was enhanced at occipital electrode sites in the rotating bistable figures compared with the standing stimuli, being maximal at vertical stimulus orientations that allowed an easy recognition of the sad and happy face or the vase–faces, respectively. At anterior electrodes, GBA showed a complementary pattern, being maximal when stimuli were oriented horizontally. The findings support the notion that formation of a visual percept may involve oscillations in a distributed neuronal assembly.
Keywords: visual perception, gamma band activity, event-related potentials, high-density electroencephalography, ambiguous figures, human
Vision involves the perception of organized wholes in addition to the perception of individual object attributes. One intriguing question is the mechanism by which individual features are combined to form a percept. Theoretical proposals suggest that the synchronous responses of grouped cells, including their timing, is related to the representation of visual objects (Milner, 1974; von der Malsburg and Schneider, 1986; von der Malsburg, 1995). Empirically, synchronous gamma band (above 30 Hz) oscillations of spatially distributed cells have been reported to occur in the visual cortex of both the anesthetized (Eckhorn et al., 1988;Gray and Singer, 1989; Engel et al., 1991; Freiwald et al., 1995) and alert cat (Gray and Viana Di Prisco, 1997), as well as in the awake monkey (Eckhorn and Obermueller, 1993; Frien et al., 1994; Kreiter and Singer, 1996) in response to visual stimuli.
High-frequency oscillatory brain activity in the range above 30 Hz that is not phase-locked to the onset of a stimulus can also be recorded noninvasively from human subjects using electrocortical or magnetocortical recording techniques such as EEG or magnetoencephalogram (Lutzenberger et al., 1997) and is referred to as induced gamma band activity (GBA). Previous work has shown that GBA increased in specific frequency ranges and time windows after the presentation of coherent, but not incoherent, visual stimuli (Lutzenberger et al., 1995; Tallon et al., 1995; Müller et al., 1996, 1997). Recently, periods of EEG synchronization in the gamma range across electrodes were reported in response to identifiable versus inverted face figures (Rodriguez et al., 1999). Brief GBA enhancements were also observed when individuals accessed the internal representation of an object in a visual search task (Tallon-Baudry et al., 1997) and during the delay phase of a short-term memory task (Tallon-Baudry et al., 1998). In addition, it has been demonstrated that GBA may be modulated by spatial visual selective attention, lending further support to its functional relevance (Gruber et al., 1999). However, GBA has been controversial in terms of both methodology and theoretical implications (Bair et al., 1994; Jürgens et al., 1995). For example, because high-frequency oscillations have been reported to occur in the insect brain in which integrative perceptual mechanisms are not required (Kirschfeld, 1992), the question arises as to whether human GBA is actually a signature of cognitive processes, such as perception or active memory, or constitutes an epiphenomenon of visual processing without functional relevance.
A traditional approach used to study visual perception exploits the properties of ambiguous figures (Attneave, 1971; Kanizsa and Luccio, 1995). In the present study, we used an ambiguous figure that, when rotated, biased the subjects’ perception to that of either a sad or happy face. The advantage of this procedure is that, although the visual input changes continuously, the visual system alternates between two distinct visual experiences, that of either a happy or sad face. Given this stimulus, we hypothesized that GBA would be associated with the perception of the sad and happy faces rather than with simply viewing the continuously moving stimulus.
MATERIALS AND METHODS
Subjects. Eleven right-handed undergraduate university students (five women, six men; age range from 23 to 29, mean age 25) with normal or corrected vision consented to participate. They received class credits or a small financial bonus for participating.
Experimental design and stimuli. The ambiguous stimuli used were a modified version of the Rubin vase, which can be perceived as either two faces or a vase (Fig.1A), and a schematic face drawing that can be perceived as either sad or happy depending on orientation (Fig. 1B). The experimental design comprised three conditions: condition 1, nonambiguous versions of the stimuli were presented in a static form such that perceptual shifts were not possible, i.e., the two faces in the Rubin illusion alone (Fig. 1C), the vase alone (D), the sad face alone (E), or the happy face alone (F); condition 2, perceptual shifts could occur independently of stimulus orientation as would be the case when the Rubin vase is rotated; and condition 3, perceptual shifts were elicited by the rotating happy–sad face.
Fig. 1.

Experimental stimuli. A,B, Ambiguous figures presented in clockwise rotation: modified version of the Rubin vase (left). The sad–happy figure, which induces perceptual transitions according to degree of rotation (right). Both figures are shown at 0° of rotation. C–F, Low-ambiguous control figures that were presented in a static (nonrotating) mode.
The order of these conditions was counterbalanced across individuals. All figures were drawn in black ink on square paper cards of 17.4 cm length, shown at 200 cm distance from the viewer. The figures formed a visual angle of 5° both horizontally and vertically. Illumination was held constant at 20 cd/m2. To reduce exploratory eye movements, a fixation point was marked in the middle of each figure. The stimuli were mounted on a rotation device that was hidden from the subject by a black background. Thus, there was nothing in the subject’s field of view but a black–white stimulus in front of a black background. In the rotation trials, stimuli were rotated in a clockwise direction with a rotation speed of 12 revolutions/min, with one revolution lasting 5 sec. A signal was sent to the EEG trigger channel after each full rotation of the stimuli at the vertical orientation of the happy face and the Rubin vase. The starting orientation of the rotating figures was randomized across participants.
Procedure. Subjects completed a short form of the Edinburgh Handedness Questionnaire (Oldfield, 1971) and signed an informed consent form. At the beginning of the experimental session, the figure reversal phenomenon was demonstrated using the ambiguous figures. After application of the electrode array, subjects were seated in a comfortable chair and instructed to look steadily at the fixation point. During EEG recordings, each nonambiguous figure (Fig. 1) was presented twice without rotation for 60 sec each (condition 1). Then, both the Rubin vase (condition 2) and the sad–happy figure (condition 3) were presented twice for 2.5 min in continuous rotation. In a separate block, the rotating stimuli were shown again for 2.5 min each, and the participants were asked to press a response key each time they experienced a change of percepts. No EEG recordings were made during this task to avoid contamination with movement artifacts or movement-related potentials. The order of conditions and stimuli was pseudorandomized. After each stimulus presentation, i.e., after a 1 or 2.5 min viewing period, respectively, subjects looked at a white board in the recording chamber and reported whether movement aftereffects (i.e., the waterfall effect in which objects in the field of view seem to move in the opposite direction of the observed moving stimuli) or afterimages were present. To ensure that these effects did not interfere with processing of subsequent stimuli, presentation of consecutive figures was delayed until the participants reported absence of any aftereffects.
Electrophysiological recordings. EEG was recorded from 128 electrodes using an electrical geodesics system. This electrode montage includes sensors for the recording of vertical and horizontal electro-oculograms (EOGs). Data were digitized at 250 Hz using recording site Cz from the international 10-20 system as reference. Impedances were kept below 50 kΩ. All channels were preprocessed on-line using 0.1 Hz high-pass and 100 Hz low-pass filtering. Epochs of 5000 msec length were obtained, thus containing one complete revolution of the rotating stimuli. Further data processing was performed off-line by the procedure proposed by Junghöfer and coworkers (Junghöfer et al., 1999). This procedure (1) detects individual recording channel artifacts using the recording reference (i.e., Cz), (2) converts data to average reference and detects global artifacts, (3) replaces sensors contaminated with artifacts throughout with statistically-weighted spherical interpolation from the full channel set, and (4) computes the variance of the signal across trials to document the stability of the averaged waveform. Using this procedure, 32% of epochs were rejected, resulting in an average of 41 epochs in conditions 2 and 3, respectively. Average reference data were used for further analyses.
Data analysis of event-related potentials. A 30 Hz low-pass filter was applied to the data before all event-related potentials (ERP) analyses. ERPs associated with switching between the sad and happy face orientation of the rotating face stimulus were examined in time segments time-locked to horizontal orientation of the sad–happy stimulus. The averaged event-related potential in the 350 msec time window after attainment of a horizontal orientation was analyzed. The 150 msec segment after the trigger signal indicating vertical stimulus orientation after completion of a full rotation was selected as the baseline for the ERP analyses. No qualitative changes of the percept were expected to occur in this time range. In addition, the signal in this time window appeared to be stable across subjects on visual inspection. However, the observation of continuously rotating stimuli may be associated with a steady-state response at the frequency of the rotating figures. Therefore, an additional ERP analysis was computed using as baseline the mean voltage of the averaged ERP across the entire time range. In each case, the selected baseline mean was subtracted from the ERP data. For the purpose of statistical analysis, the values from 128 electrodes were summed into 12 regional means based on recording sites of the international 10–20 system (Fp1, Fp2, F3, F4, T3, T4, C3, C4, P3, P4, O1, O2; Fig.2). These were organized into two within-subject factors in the ANOVA: HEMISPHERE (left vs right) and SITE (anteroinferior, anterosuperior, medioinferior, mediosuperior, posteroinferior, and posterosuperior). Accordingly, ERP differences between the two rotating figures, the two time windows (350 msec after 90 and 270° orientations), and the 12 spatial means were evaluated by means of a univariate ANOVA with the within-subject factors being FIGURE (Rubin vase vs sad–happy figure), HEMISPHERE (left vs right), SITE, and ORIENTATION (90 vs 270° orientations).
Fig. 2.

Layout of the electrode array. Electrodes in theshaded clusters, corresponding with sites of the international 10–20 system, were grouped for statistical analysis. Frontal electrodes are shown at the top of the figure.
For the evaluation of interactions, including the SITE factor, the ERP was normalized as proposed by McCarthy and Wood (1985). For each condition and time window, the minimum and maximum voltages across electrodes were determined, and the normalized value n at each electrode j was computed according to
where xj(t) is potential at sensor j and time t.
The rotating Rubin vase data were included in these analyses as a control measure. As expected, there was no visible event-related potential in the Rubin vase condition. Therefore, the potential obtained in this condition was assumed to reflect baseline noise and brain activity during the continuous observation of a rotating object. As a measure of global electrocortical activity, the global powerg(t) of the ERP across all electrodes was computed according to:
where xj(t) is potential at sensor j and time t, and sj(t) is SD of voltage at sensor j and time t.
Data analysis gamma band power.Spectral analysis of the EEG data were performed using a fast Fourier transform (FFT) approach similar to that described by Makeig (1993). This used the means of the FFT algorithm included in the avg q analysis software developed by Feige (1996). After subtracting time-locked activity (i.e., the ERP) from the signal, the epochs were demeaned and detrended. Subsequently, a Welch-tapered analysis window of 384 msec (96 sample points) was shifted in steps of 42 sample points across the recording epoch, thus providing a time resolution of 168 msec. The power spectrum for each analysis window was determined using two FFT windows containing 64 sample points, with an overlap of 32 data points. The resulting power spectra with a frequency resolution of 3.9 Hz were averaged across epochs. For the rotation conditions, time information on spectral power was further collapsed into four time windows centered around orthogonal orientations of the rotating stimuli at 0 (happy face up), 90 (switch happy–sad), 180 (sad face up), and 270 degrees of rotation (switch sad–happy). These orthogonal time windows contained information from four overlapping 384 msec FFT windows, i.e., a total of 720 msec. For nonrotating figures, spectra were averaged across recording epochs and all FFT windows before further analysis. Gamma band power (GBP) was examined in two frequency ranges, 29–45 and 55–71 Hz, to avoid the possibility of 50 Hz electrical interference.
Following the suggestion of Pulvermüller and coworkers (1997), we also analyzed an additional frequency range (72–97 Hz) in which electromyographic (EMG) power usually peaks for facial and head muscles (Cacioppo et al., 1990). Although effects in this frequency range might possibly be because of neuronal activity (Eckhorn et al., 1993;Kreiter and Singer, 1996), an absence of effects in this high band would indicate that effects in lower bands are unlikely to be EMG artifacts in the scalp-recorded EEG.
Effects of figure type, presentation mode, figure orientation, and recording site for the two selected frequency ranges (29–45 and 55–71 Hz) were evaluated by means of ANOVAs with the within-subject factors FIGURE (Rubin vase vs sad–happy figure), VIEW (0, 90, 180, and 270° in rotation, two stable versions of each stimulus), HEMISPHERE (left vs right), and RECORDING SITE (Fp1/2, F3/4, T3/4, C3/4, P3/4, O1/2). To examine the interactions, including RECORDING SITE, spectral power was normalized in the same way as described for ERPs, and the mean normalized potential in the respective time window was used in the ANOVA. Degrees of freedom were adjusted by means of the Greenhouse–Geisser method where appropriate. Corrected pvalues are reported. Post hoc comparisons were evaluated by means of the Scheffe test (Klockars and Sax, 1986).
Behavioral data. Effects of orientations of the rotating ambiguous figures on the latency of key presses indicating switching between percepts were evaluated by means of the Rayleigh test (Zar, 1984). Where the Rayleigh test was significant, the occurrence of perceptual transitions at certain time windows around the four cardinal orientations was tested post hoc using χ2 tests. Subsequently, mean latencies were computed across 30 rotations for each subject in the time windows in which switching was significantly enhanced according to results of the χ2 tests. Pearson correlation coefficients across subjects were computed between the mean latencies of motor responses and latencies of ERP global power maxima in the rotating sad–happy figure trials.
RESULTS
Behavioral data
All subjects reported figure switching in both ambiguous figures. However, as expected, only the sad–happy figure produced a reliable pattern of two perceptual transitions in each rotation (χ2(3) = 26.5;p < 0.01), which was associated with a significant Rayleigh test (χ2(2) = 48.2; p < 0.01), whereas the key presses indicating switching between faces and vase were not systematically related to stimulus orientation. Thus, no mean latency was computed for the Rubin vase condition. Pearson correlations on the mean latencies of sad–happy switch ERP peaks and motor responses across subjects were significant for the happy–sad figure (switch from happy to sad face,r = 0.67; p < 0.05; switch from sad to happy face, r = 0.78; p < 0.01), providing evidence that the ERPs were associated with perceptual switching.
Gamma band power
Lower band
Across recording sites and figure orientations, EEG power in the lower gamma (29–45 Hz) range was larger during presentation of the sad–happy faces compared with the Rubin vase (F(1,10) = 49.1; p < 0.01). As depicted in the interaction plots in Figure3A, GBP across recording sites was significantly enhanced when both the sad or happy faces and the Rubin vase were in a vertical, as opposed to horizontal, orientation (F(5,50) = 9.4; p < 0.01).
Fig. 3.
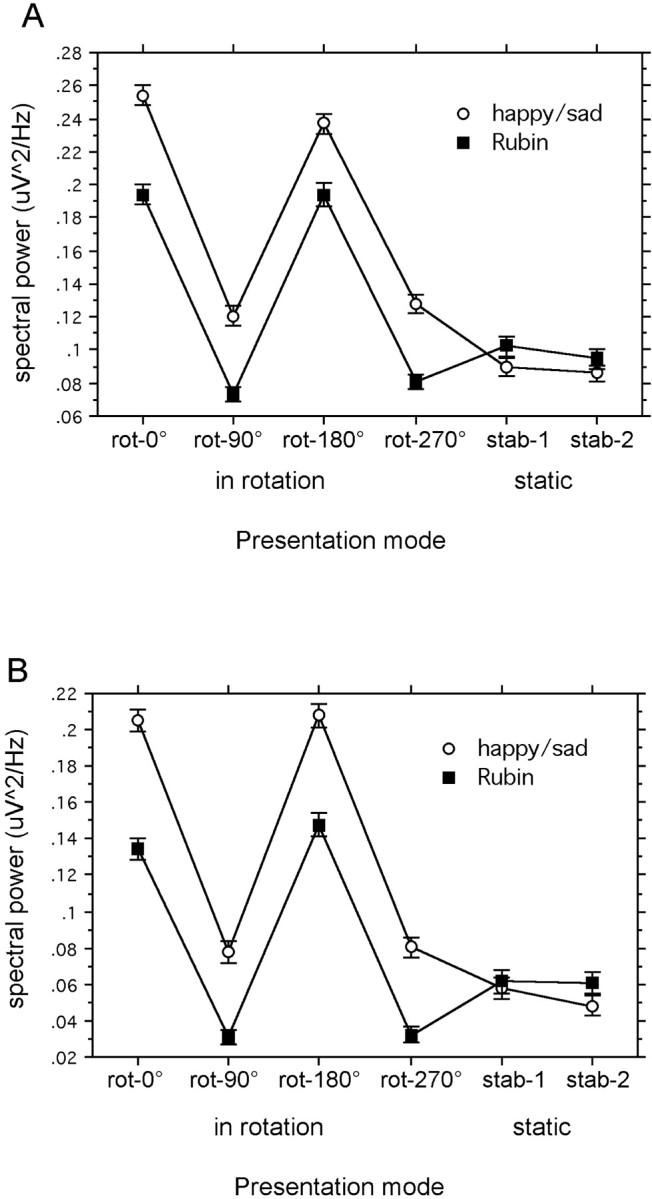
Interaction plots of the effects FIGURE × VIEW in both frequency bands. Spectral power for the two ambiguous figures in four orientations while rotating and two different stable presentation modes for each figure type. Values represent a mean of 11 subjects. A shows the frequency band 29–45 Hz;B shows the frequency band 55–71 Hz. Error bars indicate SE.
In addition, lower gamma band activity did not differ significantly between any of the figures when presented in the stable condition. A main effect of SITE indicated that posteroinferior and anteroinferior electrode sites contributed most to the GBP across conditions (F(5,50) = 4.9; p < 0.01). ANOVAs showed no significant main effect or interaction, including the hemisphere factor.
Figure 4 shows the time–frequency contour plots for the mean spectral power measured at the 12 most posterior recording sites (electrodes 69, 70, 71, 74, 75, 76, 82, 83, 84, 89, 90, and 95; Fig. 2) during the revolution of the figures, averaged across all subjects. A periodic power modulation in the range ∼30 Hz is visible (Fig. 4, left), which displays the enhancement for the happy and the sad face. In contrast, the GBP in the rotating Rubin vase (bottom) shows no comparable temporal modulation at occipital electrodes.
Fig. 4.
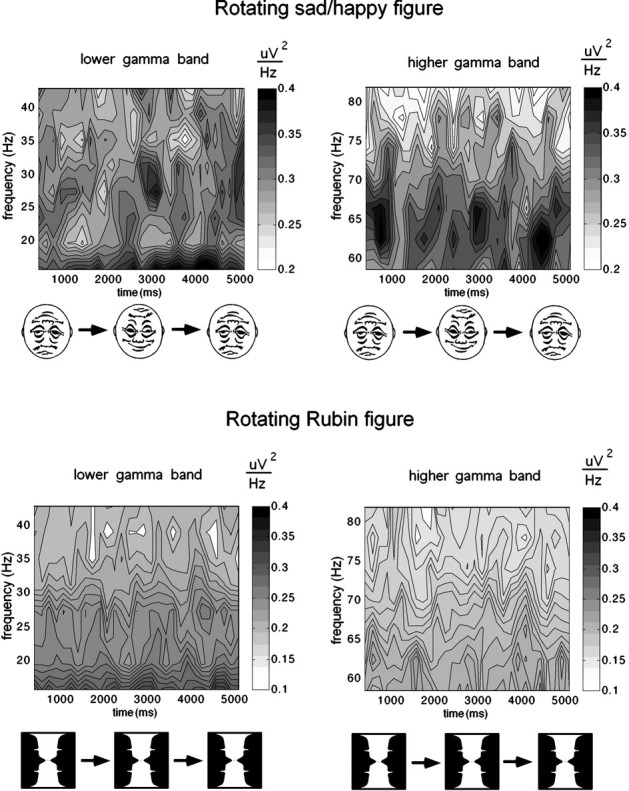
Time–frequency contour plots for the time course of spectral power measured at posterior recording sites (electrodes 69, 70, 71, 74, 75, 76, 82, 83, 84, 89, 90, and 95) averaged across all revolutions of the rotating figures. Values represent a mean of 11 subjects. Left panels show the frequency range from 15 to 45 Hz; right panels show the range from 55 to 71 Hz. Note that scaling is different for the Rubin stimulus (bottom) and the sad–happy figure (above).
The grand mean topography of the GBP in the 29–45 Hz band for the time windows reflecting the four cardinal orientations of the sad–happy figure is depicted in Figure 5, showing that power changes depending on figure orientation appear prominently over occipital regions. Power differences at frontal sites are more complex, with different patterns for all vertical and horizontal figure orientations. Thus, GBA appears to show a different pattern at frontal than at posterior sites.
Fig. 5.

Topography of the grand mean gamma band power (29–45 Hz) during four different orientations of the sad–happy figure. Values represent a mean of 11 subjects. The depicted time course reflects one complete revolution of the stimulus, i.e., 5 sec.
For static figures (condition 1), we did not find significant main effects of figure type on GBP. Also, interactions between topographical factors (SITE or HEMISPHERE) and FIGURE were not significant. Thus, continuous viewing of nonmoving stimuli differing in emotional valence and/or content was not related to differences in GBP. Across figures and recording sites, GBP was significantly smaller during static viewing than during viewing of rotating figures (conditions 2 and 3). However, as shown in Figure 6, the topographical pattern of activity was comparable with viewing rotating figures, with posteroinferior and anteroinferior sites contributing most to measured gamma band activity.
Fig. 6.

Topographical distribution of gamma band response (29–45 Hz) to four types of low-ambiguous figures presented in a static (nonrotating) manner. Values represent a mean of 11 subjects.
Higher band
Effects in the higher gamma band were comparable with those in the lower range. Here, the main effect of figure type also reflected higher GBP in the sad–happy figure (F(1,10)= 51.8; p < 0.01), and this difference was not seen when the static stimuli were used. As demonstrated in Figure3B, vertical orientations were related to increased GBP compared with both horizontal orientations and stable views (F(5,50) = 34.0; p < 0.01). Posteroinferior sites displayed greatest GBP (F(5,50) = 5.9; p < 0.01). As with the lower gamma, a sinusoidal modulation phase-locked to the sad–happy figure is evident in the time–frequency contour plot (Fig. 4, right). No such posterior higher band GBP modulation was found for the rotating Rubin vase. Post hoctesting of the significant interaction VIEW × SITE (F(25,250) = 4.14; p< 0.1) showed that the topographical GBP distribution was more focal when subjects viewed stable pictures, being restricted to posteroinferior sites, whereas rotating conditions showed more globally distributed and frontally enhanced activity (p< 0.01).
The ANOVA testing spectral power in the highest frequency band (72–97 Hz), examined as a control measure, showed no significant main effect or interaction comparable with the effects in the lower bands.
Event-related potentials
The ERP data collected during the rotating sad–happy figure showed a pronounced negative potential at latencies in which switching between the sad and the happy view, respectively, was considered to have occurred (i.e., at stimulus orientations of 90 and 270°) (Fig.7). The ERP latencies exhibited a high degree of variability across subjects, reflecting interindividual differences in terms of hysteresis, perceptual stability, or picture preference.
Fig. 7.

Event-related potential obtained at central frontal electrode 11 for two subjects during observation of rotating stimuli. The depicted time course reflects the averaged potential across all revolutions of the stimuli, starting with the sad orientation of the sad–happy figure (black lines) and the respective vertical orientation of the Rubin figure (gray lines). Thus, two transitions between percepts are observed in the sad–happy figure. The sad–happy condition shows pronounced negativity at horizontal orientations of the figure. No ERP peaks are visible in the Rubin vase condition. Histograms above ERP plots show the frequency of key presses, indicating figure switching for the different orientations of the sad–happy figure. The high degree of variability in the timing of subjective perceptual switching between alternatives is reflected in the ERP peak latency differences. Right panels show vertical and horizontal EOG.
Clearly, different latencies of ERP peaks can be seen in the rotating sad–happy figure. In contrast, no visible event-related potential was found in the rotating Rubin vase condition. In addition, subjective reports on perceptual switches of the Rubin vase displayed no systematic covariation with the orientation of the stimulus. Thus, the assumption that there is no orientation-dependent switching in this version of the Rubin vase was confirmed.
The ANOVA for the transformed mean visual ERP for the sad–happy condition revealed a significant FIGURE × SITE interaction (F(5, 50) = 4.5; p < 0.05). As demonstrated by post hoc testing, this effect was caused by enhanced negativity in the anteroinferior sites when viewing the sad–happy stimulus compared with the Rubin condition. No significant differences were found between ERPs denoting the switch from the happy to sad and from the sad to happy faces, respectively. The same effects were found when the mean of the entire recording epoch served as ERP baseline, FIGURE × SITE (F(5, 50) = 4.0; p < 0.05).
DISCUSSION
GBP modulation
Because we are able to perceive organized wholes, rather than just individual aspects, one intriguing puzzle is to understand the mechanism by which individual perceptual features are combined or bound together to form an integrated percept. In this study, we report modulation of gamma band power in response to discrete, qualitative changes in continuously rotating complex stimuli. The experimental strategy used in this study to isolate perceptual shifts revealed changes in both lower and higher frequency gamma band power during vertical orientations of the rotating bistable figures. This effect, strongest in the phase-locked switching condition involving the rotating sad–happy stimulus (condition 3), was also found across recording sites in the rotating Rubin vase (condition 2). However, modulation at posterior electrode sites was observed only during rotation of the sad–happy stimulus. A static presentation of the stimuli (condition 1) resulted in overall reduced GBP. Thus, the perception of coherently moving stimuli alone as present in the rotation conditions was shown not to be the main determinant of the GBP modulation. Rather, the repeated changes between percepts and the associated underlying reorganization appeared to be associated with phasic increases in GBP, as is illustrated by Figure8. Therefore, it may be assumed that the neuronal assemblies involved in the initial perceptual process continued to be activated by repeated ambiguous object identification (Singer et al., 1997).
Fig. 8.
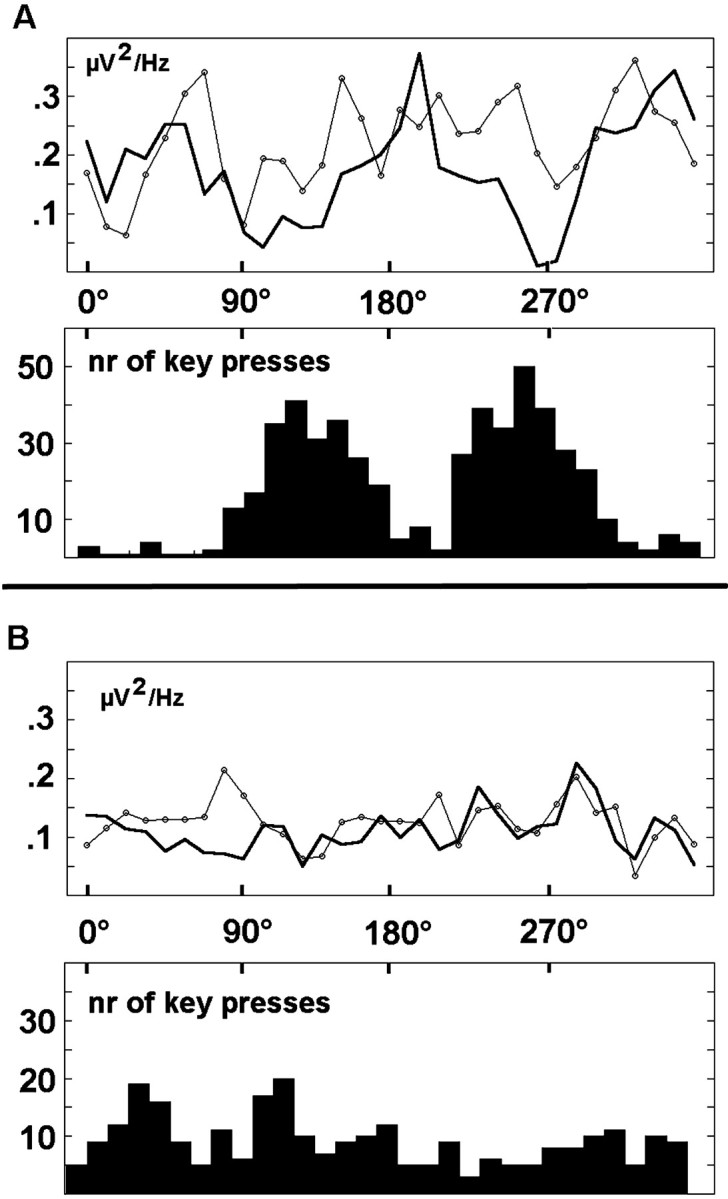
Behavioral responses and time course of averaged GBP in the two examined bands. Bold line, GBP 29–45 Hz;line with circles, GBP 55–71 Hz. Histograms show the frequency of key presses, indicating figure switching with respect to orientations of the rotating sad–happy figure (A) and the rotating Rubin vase (B). Values represent a mean ofn = 11 subjects.
The fact that the increase in both gamma bands was also observed during vertical orientations of the Rubin vase in which no regular switching was perceived is in line with findings that suggest GBP enhancement when object aspects are integrated (Tallon-Baudry and Bertrand, 1999). Vertical orientations of the Rubin stimulus may allow for an easier percept formation than horizontal orientations because both faces and vase-like objects commonly appear in vertical orientations (Valentine, 1988). In addition, a GBP increase has been reported in response to ambiguous stimulation per se (Basar-Eroglu et al., 1996). The two broad low- and high-gamma bands, examined separately, exhibited similar effects in terms of intensity modulation, as well as topography. This is in accordance with the finding that cortical assemblies display a broad band oscillatory activity at multiple frequencies, when visual input is processed (Castelo-Branco et al., 1998).
GBP topography
In terms of methodology, three issues concerning topography of EEG–ERP measures should be addressed: (1) the use of high-density electrode arrays; (2) the average reference; and (3) the possibility of muscle artifacts. Clearly, it may be asked whether the observed focal GBP modulation was an artifact generated by using an average reference, thus introducing foci of activity where actually none was present. For instance, Desmedt et al. (1990) proposed that such ghost fields occurred at the top of the scalp in response to vertically oriented dipolar sources. However, in the present data set, referencing the data to linked mastoids did not affect the statistical significance of topographical effects regarding ERP and GBP. In addition, the use of high-density montages has been shown to reduce the distortions of the scalp potential field introduced by average references in sparse arrays (Dien, 1998). Therefore, given the high spatial sampling used in the present study, it seems unlikely that a significant overestimate of brain electrical activity has been introduced by our use of the average reference.
Because the most pronounced GBP effects were found at electrode sites near scalp muscles, the question remains whether EMG changes contributed to the measured GBP modulations. We addressed this question by examining a high-frequency band in which the peak of the EMG power spectral density function can be found (Cacioppo et al., 1990). Because there were no comparable effects nor trends in this band, we conclude that the reported effects are unlikely to have been EMG artifacts (Pulvermüller et al., 1997).
Gamma band modulation in response to the ambiguous stimuli was most clearly seen in anteroinferior and posteroinferior sites. In addition, these sites contributed most to the GBP measured when stable objects were viewed. Increased frontal gamma band activity has also been reported by Basar-Eroglu et al. (1996) when their human subjects observed a pattern consisting of alternating flashing light spots, resulting in the perception of apparent motion. Anterior and posterior electrodes did not display temporally parallel GBP modulation (Fig. 6). This suggests that different aspects of visual processing related to the recognition of the bistable patterns involve oscillatory activity, not only in visual cortex but also in frontal areas. GBP in the anterior sensors showed a more complex pattern, associated with vertical and horizontal figure orientations and thus with the fading of the old and/or preparation for the new perceptual alternative. Thus, these results are consistent with speculation suggesting an involvement of the prefrontal cortex in conscious perception (Crick and Koch, 1998), as well as recent work describing a role for the frontoparietal cortex in relation to the internal representation of visual material (Lumer et al., 1998).
Recent work emphasized the relevance of long-distance synchronization across EEG electrodes for face figure perception as opposed to gamma abundance at a given electrode (Rodriguez et al., 1999). Analyses of phase synchronicity between electrode sites may therefore constitute a further useful approach to studying oscillatory coupling of distant brain regions (Miltner et al., 1999). In this respect, these analyses may be complementary to studies examining power–amplitude modulations at single sensors. Consequently, it is mandatory to distinguish between the local synchronicity of neuronal events that is necessary for obtaining EEG signals at the scalp surface and the cross-recording site synchronicity indexed by measures of coherence or phase-synchrony.
Event-related potentials
Event-related potentials increased the validity of our procedure by indicating a brain event that was most pronounced within the time segments that were related to perceptual switching. With respect to topography, the event-related potential associated with perceptual switching was most pronounced at prefrontal sites. These results are consistent with previous work reporting an N400-like negativity when updating of information on faces or other visual objects is required (Bobes et al., 1994; Olivares et al., 1994; Debruille et al., 1996). However, we found no vertex positive peak such as is commonly associated with face recognition (Jeffreys and Tukmachi, 1992;Jeffreys, 1993). This might be attributable to the absence of a known sudden physical stimulus onset in the present design. It can be expected that an internally generated “onset,” which is not exactly time-locked across trials, will cause elimination of early visual event-related potentials when epochs are averaged time-locked to an external trigger (Yabe, 1998). Therefore, the lack of typical visual ERPs in the present study is not unexpected.
As discussed for the role of frontal GBP modulation, the ERP may reflect activation. The present procedure is not capable of shedding further light on this question. The relationship between evoked and induced responses in the human EEG should be addressed in future studies using a design that designates more pronounced stimulus onsets.
Theoretical implications
Our data help to clarify a number of theoretical issues in relation to oscillatory processes of the brain. Although only correlative in nature, the present results are not consistent with the view that oscillatory activity is simply a by-product of the functional architecture of a neural network and as such is simply noise in the system rather than being involved in coding of cognitive processes. As suggested previously, our data highlight the role of oscillatory processes during the process of perceptual integration. Of course, oscillatory activity may be involved in multifaceted processes. For example, previous work has supported the concept that EEG α activity reflects an “idling” activity that might prevent neural networks from spontaneous activation without input and/or allow for faster activation when input is applied (Pfurtscheller, 1992). Early work (Sheer, 1970; Spydell et al., 1979; Spydell and Sheer, 1982) has shown faster EEG oscillatory activity to be associated with human learning, cognitive performance, and memory processes, which has been interpreted as an index of “focused arousal” in the task-relevant neuronal assemblies. The role of gamma oscillations in plasticity, learning, and memory has also been emphasized by more recent studies in human and animal subjects (Lisman and Idiart, 1995; Murthy and Fetz, 1996;Roelfsema et al., 1997). Makeig and Jung (1996) reported that during drowsiness, gamma band power modulations in the human EEG is related to periods of alert performance in an auditory target detection task. GBP might thus be a correlate of auditory awareness. Further suggestions as to the role of oscillatory processes include encoding the stimulus itself (Freeman, 1995). If low-level sensory processes can be bound together through oscillations, it may also be the case that multimodal processes involving numerous brain regions use this mechanism (Miltner et al., 1999; Rodriguez et al., 1999). Given our present data, at this point, we can clearly move beyond the position that oscillatory processes are simply noise to a position, which suggests that they may play a role in cognitive processes, such as active memory, percept formation, and/or object representation.
Footnotes
This research was supported by grants from the Deutsche Forschungsgemeinschaft and by a grant from the Deutsche Akademische Auslandsdienst to W.J.R. We thank Ursula Lommen for help in data acquisition.
Correspondence should be addressed to Andreas Keil, Department of Psychology, University of Konstanz, P.O. Box D25, D-78457 Konstanz, Germany.
REFERENCES
- 1.Attneave F. Multistability in perception. Sci Am. 1971;225:63–71. [PubMed] [Google Scholar]
- 2.Bair W, Koch C, Newsome W, Britten K. Power spectrum analysis of bursting cells in area MT in the behaving monkey. J Neurosci. 1994;14:2870–2892. doi: 10.1523/JNEUROSCI.14-05-02870.1994. [DOI] [PMC free article] [PubMed] [Google Scholar]
- 3.Basar-Eroglu C, Struber D, Kruse P, Basar E, Stadler M. Frontal gamma-band enhancement during multistable visual perception. Int J Psychophysiol. 1996;24:113–125. doi: 10.1016/s0167-8760(96)00055-4. [DOI] [PubMed] [Google Scholar]
- 4.Bobes MA, Valdes-Sosa M, Olivares E. An ERP study of expectancy violation in face perception. Brain Cogn. 1994;26:1–22. doi: 10.1006/brcg.1994.1039. [DOI] [PubMed] [Google Scholar]
- 5.Cacioppo JT, Tassinary LG, Fridlund AJ. The skeletomotor system. In: Cacioppo JT, Tassinary JT, editors. Principles of psychophysiology: physical, social, and inferential elements. Cambridge UP; Cambridge, MA: 1990. pp. 325–384. [Google Scholar]
- 6.Castelo-Branco M, Neuenschwander S, Singer W. Synchronization of visual responses between the cortex, lateral geniculate nucleus, and retina in the anesthetized cat. J Neurosci. 1998;18:6395–6410. doi: 10.1523/JNEUROSCI.18-16-06395.1998. [DOI] [PMC free article] [PubMed] [Google Scholar]
- 7.Crick F, Koch C. Consciousness and neuroscience. Cereb Cortex. 1998;8:97–107. doi: 10.1093/cercor/8.2.97. [DOI] [PubMed] [Google Scholar]
- 8.Debruille JB, Pineda J, Renault B. N400-like potentials elicited by faces and knowledge inhibition. Brain Res Cogn Brain Res. 1996;4:133–144. [PubMed] [Google Scholar]
- 9.Desmedt JE, Chalklin V, Tomberg C. Emulation of somatosensory evoked potential (SEP) components with the 3-shell head model and the problem of “ghost potential fields” when using an average reference in brain mapping. Electroencephalogr Clin Neurophysiol. 1990;77:243–258. doi: 10.1016/0168-5597(90)90063-j. [DOI] [PubMed] [Google Scholar]
- 10.Dien J. Issues in the application of the average reference: review, critiques, and recommendations. Behav Res Methods Instr Comp. 1998;30:34–43. [Google Scholar]
- 11.Eckhorn R, Obermueller A. Single neurons are differently involved in stimulus-specific oscillations in cat visual cortex. Exp Brain Res. 1993;95:177–182. doi: 10.1007/BF00229667. [DOI] [PubMed] [Google Scholar]
- 12.Eckhorn R, Bauer R, Jordan W, Brosch M, Kruse W, Munk M, Reitboeck HJ. Coherent oscillations: a mechanism of feature linking in the visual cortex? Multiple electrode and correlation analyses in the cat. Biol Cybern. 1988;60:121–130. doi: 10.1007/BF00202899. [DOI] [PubMed] [Google Scholar]
- 13.Eckhorn R, Frien A, Bauer R, Woelbern T, Kehr H. High frequency (60–90 Hz) oscillations in primary visual cortex of awake monkey. NeuroReport. 1993;4:243–246. doi: 10.1097/00001756-199303000-00004. [DOI] [PubMed] [Google Scholar]
- 14.Engel AK, Konig P, Kreiter AK, Singer W. Interhemispheric synchronization of oscillatory neuronal responses in cat visual cortex. Science. 1991;252:1177–1179. doi: 10.1126/science.252.5009.1177. [DOI] [PubMed] [Google Scholar]
- 15.Feige B. Oscillatory brain activity and its analysis on the basis of MEG and EEG. Westfälische Wilhelmsuniversität Münster; Medizinische Fakultät Münster: 1996. [Google Scholar]
- 16.Freeman WJ. The creation of perceptual meanings in cortex through chaotic itinerancy and sequential state transitions induced by sensory stimuli. In: Kruse P, Stadler M, editors. Ambiguity in mind and nature. Springer; Berlin: 1995. pp. 421–440. [Google Scholar]
- 17.Freiwald WA, Kreiter AK, Singer W. Stimulus dependent intercolumnar synchronization of single unit responses in cat area 17. NeuroReport. 1995;6:2348–2352. doi: 10.1097/00001756-199511270-00018. [DOI] [PubMed] [Google Scholar]
- 18.Frien A, Eckhorn R, Bauer R, Woelbern T, Kehr H. Stimulus-specific fast oscillations at zero phase between visual areas V1 and V2 of awake monkey. NeuroReport. 1994;5:2273–2277. doi: 10.1097/00001756-199411000-00017. [DOI] [PubMed] [Google Scholar]
- 19.Gray CM, Singer W. Stimulus-specific neuronal oscillations in orientation columns of cat visual cortex. Proc Natl Acad Sci USA. 1989;86:1698–1702. doi: 10.1073/pnas.86.5.1698. [DOI] [PMC free article] [PubMed] [Google Scholar]
- 20.Gray CM, Viana Di Prisco G. Stimulus-dependent neuronal oscillations and local synchronization in striate cortex of the alert cat. J Neurosci. 1997;17:3239–3253. doi: 10.1523/JNEUROSCI.17-09-03239.1997. [DOI] [PMC free article] [PubMed] [Google Scholar]
- 21.Gruber T, Mueller MM, Keil A Elbert T (1999) Selective visual-spatial attention alters induced gamma band responses in the human EEG. Electroencephalogr Clin Neurophysiol, in press. [DOI] [PubMed]
- 22.Jeffreys DA. The influence of stimulus orientation on the vertex positive scalp potential evoked by faces. Exp Brain Res. 1993;96:163–172. doi: 10.1007/BF00230449. [DOI] [PubMed] [Google Scholar]
- 23.Jeffreys DA, Tukmachi ES. The vertex-positive scalp potential evoked by faces and by objects. Exp Brain Res. 1992;91:340–350. doi: 10.1007/BF00231668. [DOI] [PubMed] [Google Scholar]
- 24.Junghöfer M, Elbert T, Tucker DM, Rockstroh BS (1999) Statistical control of artifacts in dense array EEG/MEG Studies. Psychophysiology, in press. [PubMed]
- 25.Jürgens E, Rosler F, Henninghausen E, Heil M. Stimulus-induced gamma oscillations: harmonics of alpha activity? NeuroReport. 1995;6:813–816. doi: 10.1097/00001756-199503270-00027. [DOI] [PubMed] [Google Scholar]
- 26.Kanizsa G, Luccio R. Multistability as a research tool in experimental phenomenology. In: Kruse P, Stadler M, editors. Ambiguity in mind and nature. Springer; Berlin: 1995. pp. 47–68. [Google Scholar]
- 27.Kirschfeld K. Oscillations in the insect brain: do they correspond to the cortical gamma-waves of vertebrates? Proc Natl Acad Sci USA. 1992;89:4764–4768. doi: 10.1073/pnas.89.10.4764. [DOI] [PMC free article] [PubMed] [Google Scholar]
- 28.Klockars AJ, Sax G. Multiple comparisons. Sage; Newbury Park, CA: 1986. [Google Scholar]
- 29.Kreiter AK, Singer W. Stimulus-dependent synchronization of neuronal responses in the visual cortex of the awake macaque monkey. J Neurosci. 1996;16:2381–2396. doi: 10.1523/JNEUROSCI.16-07-02381.1996. [DOI] [PMC free article] [PubMed] [Google Scholar]
- 30.Lisman JE, Idiart MA. Storage of 7 ± 2 short-term memories in oscillatory subcycles. Science. 1995;267:1512–1515. doi: 10.1126/science.7878473. [DOI] [PubMed] [Google Scholar]
- 31.Lumer ED, Friston KJ, Rees G. Neural correlates of perceptual rivalry in the human brain. Science. 1998;280:1930–1934. doi: 10.1126/science.280.5371.1930. [DOI] [PubMed] [Google Scholar]
- 32.Lutzenberger W, Pulvermüller F, Elbert T, Birbaumer N. Visual stimulation alters local 40-Hz responses in humans. An EEG-study. Neurosci Lett. 1995;183:39–42. doi: 10.1016/0304-3940(94)11109-v. [DOI] [PubMed] [Google Scholar]
- 33.Lutzenberger W, Preissl H, Birbaumer N, Pulvermüller F. High-frequency cortical responses: do they not exist if they are small? [letter]. Electroencephalogr Clin Neurophysiol. 1997;102:64–66. doi: 10.1016/s0013-4694(96)96561-x. [DOI] [PubMed] [Google Scholar]
- 34.Makeig S. Auditory event-related dynamics of the EEG spectrum and effects of exposure to tones. Electroencephalogr Clin Neurophysiol. 1993;86:283–293. doi: 10.1016/0013-4694(93)90110-h. [DOI] [PubMed] [Google Scholar]
- 35.Makeig S, Jung TP. Tonic, phasic, and transient EEG correlates of auditory awareness in drowsiness. Brain Res Cogn Brain Res. 1996;4:15–25. doi: 10.1016/0926-6410(95)00042-9. [DOI] [PubMed] [Google Scholar]
- 36.McCarthy G, Wood CC. Scalp distributions of event-related potentials: an ambiguity associated with analysis of variance models. Electroencephalogr Clin Neurophysiol. 1985;62:203–208. doi: 10.1016/0168-5597(85)90015-2. [DOI] [PubMed] [Google Scholar]
- 37.Milner PM. A model for visual shape recognition. Psychol Rev. 1974;81:521–535. doi: 10.1037/h0037149. [DOI] [PubMed] [Google Scholar]
- 38.Miltner WH, Braun C, Arnold M, Witte H, Taub E. Coherence of gamma-band EEG activity as a basis for associative learning. Nature. 1999;397:434–436. doi: 10.1038/17126. [DOI] [PubMed] [Google Scholar]
- 39.Müller MM, Bosch J, Elbert T, Kreiter A, Sosa MV, Sosa PV, Rockstroh B. Visually induced gamma-band responses in human electroencephalographic activity–a link to animal studies. Exp Brain Res. 1996;112:96–102. doi: 10.1007/BF00227182. [DOI] [PubMed] [Google Scholar]
- 40.Müller MM, Junghöfer M, Elbert T, Rockstroh B. Visually induced gamma-band responses to coherent and incoherent motion: a replication study. NeuroReport. 1997;8:2575–2579. doi: 10.1097/00001756-199707280-00031. [DOI] [PubMed] [Google Scholar]
- 41.Murthy VN, Fetz EE. Synchronization of neurons during local field potential oscillations in sensorimotor cortex of awake monkeys. J Neurophysiol. 1996;76:3968–3982. doi: 10.1152/jn.1996.76.6.3968. [DOI] [PubMed] [Google Scholar]
- 42.Oldfield RC. The assessment and analysis of handedness: the Edinburgh inventory. Neuropsychologia. 1971;9:97–113. doi: 10.1016/0028-3932(71)90067-4. [DOI] [PubMed] [Google Scholar]
- 43.Olivares E, Bobes MA, Aubert E, Valdes-Sosa M. Associative ERP effects with memories of artificial faces. Brain Res Cogn Brain Res. 1994;2:39–48. doi: 10.1016/0926-6410(94)90019-1. [DOI] [PubMed] [Google Scholar]
- 44.Pfurtscheller G. Event-related synchronization (ERS): an electrophysiological correlate of cortical areas at rest. Electroencephalogr Clin Neurophysiol. 1992;83:62–69. doi: 10.1016/0013-4694(92)90133-3. [DOI] [PubMed] [Google Scholar]
- 45.Pulvermüller F, Birbaumer N, Lutzenberger W, Mohr B. High-frequency brain activity: its possible role in attention, perception and language processing. Prog Neurobiol. 1997;52:427–445. doi: 10.1016/s0301-0082(97)00023-3. [DOI] [PubMed] [Google Scholar]
- 46.Rodriguez E, George N, Lachaux JP, Martinerie J, Renault B, Varela FJ. Perception’s shadow: long-distance synchronization of human brain activity. Nature. 1999;397:430–433. doi: 10.1038/17120. [DOI] [PubMed] [Google Scholar]
- 47.Roelfsema PR, Engel AK, Konig P, Singer W. Visuomotor integration is associated with zero time-lag synchronization among cortical areas. Nature. 1997;385:157–161. doi: 10.1038/385157a0. [DOI] [PubMed] [Google Scholar]
- 48.Sheer DE. Electrophysiological correlates in memory consolidation. In: Ungar G, editor. Molecular mechanisms in memory and learning. Plenum; New York: 1970. pp. 177–211. [Google Scholar]
- 49.Singer W, Engel AK, Kreiter AK, Munk MHJ, Neuenschwander S, Roelfsema PR. Neuronal assemblies: necessity, signature and detectability. Trends Cognit Sci. 1997;1:252–261. doi: 10.1016/S1364-6613(97)01079-6. [DOI] [PubMed] [Google Scholar]
- 50.Spydell JD, Sheer DE. Effect of problem solving on right and left hemisphere 40 hertz EEG activity. Psychophysiology. 1982;19:420–425. doi: 10.1111/j.1469-8986.1982.tb02497.x. [DOI] [PubMed] [Google Scholar]
- 51.Spydell JD, Ford MR, Sheer DE. Task dependent cerebral lateralization of the 40 Hertz EEG rhythm. Psychophysiology. 1979;16:347–350. doi: 10.1111/j.1469-8986.1979.tb01474.x. [DOI] [PubMed] [Google Scholar]
- 52.Tallon C, Bertrand O, Bouchet P, Pernier J. Gamma-range activity evoked by coherent visual stimuli in humans. Eur J Neurosci. 1995;7:1285–1291. doi: 10.1111/j.1460-9568.1995.tb01118.x. [DOI] [PubMed] [Google Scholar]
- 53.Tallon-Baudry C, Bertrand O. Oscillatory gamma activity in humans and its role in object representation. Trends Cognit Sci. 1999;3:151–162. doi: 10.1016/s1364-6613(99)01299-1. [DOI] [PubMed] [Google Scholar]
- 54.Tallon-Baudry C, Bertrand O, Delpuech C, Pernier J. Oscillatory gamma-band (30–70 Hz) activity induced by a visual search task in humans. J Neurosci. 1997;17:722–734. doi: 10.1523/JNEUROSCI.17-02-00722.1997. [DOI] [PMC free article] [PubMed] [Google Scholar]
- 55.Tallon-Baudry C, Bertrand O, Peronnet F, Pernier J. Induced gamma-band activity during the delay of a visual short-term memory task in humans. J Neurosci. 1998;18:4244–4254. doi: 10.1523/JNEUROSCI.18-11-04244.1998. [DOI] [PMC free article] [PubMed] [Google Scholar]
- 56.Valentine T. Upside-down faces: a review of the effect of inversion upon face recognition. Br J Psychol. 1988;79:471–491. doi: 10.1111/j.2044-8295.1988.tb02747.x. [DOI] [PubMed] [Google Scholar]
- 57.von der Malsburg C. Binding in models of perception and brain function. Curr Opin Neurobiol. 1995;5:520–526. doi: 10.1016/0959-4388(95)80014-x. [DOI] [PubMed] [Google Scholar]
- 58.von der Malsburg C, Schneider W. A neural cocktail-party processor. Biol Cybern. 1986;54:29–40. doi: 10.1007/BF00337113. [DOI] [PubMed] [Google Scholar]
- 59.Yabe H. Median method for eliminating infrequent artifacts and identifying the signals blurred by latency jitter and uncertain occurrence. Behav Res Methods Instr Comp. 1998;30:68–77. [Google Scholar]
- 60.Zar JH. Biostatistical analysis. Prentice Hall; Englewood Cliffs, NJ: 1984. [Google Scholar]