Abstract
Rate–intensity functions, i.e., the relation between discharge rate and sound pressure level, were recorded from single auditory nerve fibers in the barn owl. Differences in sound pressure level between the owl's two ears are known to be an important cue in sound localization. One objective was therefore to quantify the discharge rates of auditory nerve fibers, as a basis for higher-order processing of sound pressure level. The second aim was to investigate the rate–intensity functions for cues to the underlying cochlear mechanisms, using a model developed in mammals.
Rate–intensity functions at the most sensitive frequency mostly showed a well-defined breakpoint between an initial steep segment and a progressively flattening segment. This shape has, in mammals, been convincingly traced to a compressive nonlinearity in the cochlear mechanics, which in turn is a reflection of the cochlear amplifier enhancing low-level stimuli. The similarity of the rate–intensity functions of the barn owl is thus further evidence for a similar mechanism in birds. An interesting difference from mammalian data was that this compressive nonlinearity was not shared among fibers of similar characteristic frequency, suggesting a different mechanism with a more locally differentiated operation than in mammals.
In all fibers, the steepest change in discharge rate with rising sound pressure level occurred within 10–20 dB of their respective thresholds. Because the range of neural thresholds at any one characteristic frequency is small in the owl, auditory nerve fibers were collectively most sensitive for changes in sound pressure level within ∼30 dB of the best thresholds. Fibers most sensitive to high frequencies (>6–7 kHz) showed a smaller increase of rate above spontaneous discharge rate than did lower-frequency fibers.
Keywords: hearing, cochlea, basilar papilla, interaural intensity difference, rate–intensity function, bird
Stimulus transduction and neural encoding are critical steps in any sensory system. The result of these initial events will have been shaped in evolution by the physical constraints imposed by the stimulus modality and associated transduction mechanisms, as well as by the demands for certain qualities advantageous to higher-order neural processing. Conversely, the neural output of a sensory organ may provide important cues both to the mechanisms underlying stimulus transduction, as well as to behaviorally important features of the sensory world of an animal. We present here a study of the coding of sound pressure level (SPL) in the auditory nerve of the barn owl, which addresses both of those aspects.
The barn owl is an auditory specialist, relying on acoustic localization of prey noises for hunting (Payne, 1971). To do this, the barn owl, like any other animal, including humans, basically uses two physical cues to determine the origin of a sound: the difference in the time of arrival at each ear, the interaural time difference caused by different path lengths, and the difference in amplitude at each ear, the interaural intensity difference caused by shadowing effects. These differences are computed from the inputs of the sensory organs, the paired cochleae or basilar papillae. Although many elegant studies have revealed profound insights about the brain circuits underlying those neural computations (for review, see Knudsen, 1981; Konishi, 1993a,b), the cochlear inputs have only recently received comparable attention. It is now well established that the stimulus timing is coded by the extraordinary ability of barn owl auditory nerve fibers to phase-lock to very high frequencies up to 9 kHz (Sullivan and Konishi, 1984; Köppl, 1997b). However, nothing at all is known about their ability in encoding amplitude, i.e., sound pressure level. We therefore aimed to quantify the discharge rates of a typical population of auditory nerve fibers in relation to sound pressure level.
The second aspect of the relationship between the neural code and the underlying sensory mechanisms is also highly interesting in the barn owl. Birds have become important models for mechanisms of cochlear repair and regeneration of sensory cells after even extensive damage (for review, see Cotanche et al., 1994; Corwin and Oberholtzer, 1997). Their basilar papilla and the mammalian cochlea show important parallels, in that both appear to have implemented a specialization of the sensory hair cells into two populations with different functions (for review, see Manley et al., 1989; Manley and Köppl, 1998). However, whereas in mammals it is generally agreed that the inner hair cells serve the classical sensory function and the outer hair cells are modified for mechanically amplifying faint stimuli in a positive feedback loop (Dallos, 1996; Patuzzi, 1996; Nobili et al., 1998), the case in birds is still much more speculative (Manley, 1995). We show here that a signature characteristic of mammalian auditory nerve fibers, thought to have its basis in the cochlear feedback loop, is also present in the barn owl, strengthening the argument for a similar amplifying mechanism in birds.
MATERIALS AND METHODS
Experiments were performed on eight adult barn owls (Tyto alba guttata; five females and three males) from our own breeding colony, aged 6 months to 3 years and weighing between 290 and 360 gm. The care and use of these animals was approved by the government of upper Bavaria (license no. 211-2531-64/92). The data reported here were obtained in the same experimental series as Köppl (1997a). Therefore, the general methods used for anesthesia, surgery, sound stimulation, and single-unit recording will only be summarized, and details will be given mainly for the methods specific to the present study.
Anesthesia and surgery. General anesthesia was induced and maintained by intramuscular injections of 3 mg/kg xylazine (Rompun) and 4 mg/kg ketamine hydrochloride (Ketavet), with occasional doses of diazepam (Valium; 0.8 mg/kg). A combined EKG and muscle-potential recording was used to monitor the depth of anesthesia. Rectal temperature was kept at 39–40°C with the aid of a heating pad wrapped around the owl's body. A metal pin was glued to the skull to hold the head securely. The bone and meninges overlying the right cerebellum were removed, and the posterior part of the right cerebellum was aspirated to expose the surface of the auditory brainstem on that side.
Acoustic stimulation. During recordings, the animals were situated in a sound-attenuating chamber. Miniature commercial earphones were coupled to both ears via plastic exponential horns inserted into the ear canals and sealed by soft rubber rings. SPLs within the ear canals were calibrated for each individual with a miniature microphone, placed at ∼10 mm from the eardrum. The frequency response of the sound system showed sound pressure variations up to ±6 dB between 100 and 10 kHz in any one individual, and peak SPLs for pure tones varied from 80 to 95 dB SPL over all frequencies and animals. Sound stimuli were generated either by a frequency synthesizer, a white-noise source, or a 0.1 msec square-wave signal (for click stimuli). The signals passed an equalizer, a gating cosine switch (except for click stimuli, which bypassed the gate) and an attenuator, before being fed to the earphones.
Recordings of cell activity. Glass microelectrodes, filled with 3 m KCl or 2 m NaCl and with impedances typically between 50 and 100 MΩ, were positioned under visual control above the surface of the brainstem and then advanced under remote control. Recorded signals from a WPI 767 electrometer were usually high-pass filtered (300 Hz cutoff frequency) to eliminate slow baseline fluctuations, and action potentials were fed via a threshold discriminator to a custom-built computer interface. The single-unit nature of all recordings was verified by checking for the presence of a refractory period between adjacent spikes. After isolating a unit, the response to ipsilateral condensation clicks was recorded first. This was followed by the presentation of a frequency–intensity raster of tone bursts (5 msec rise–fall times, 40 msec plateau, 5 stimuli/sec) at at least 10 frequencies around the characteristic frequency (CF) of the cell and typically 18 SPLs, in steps of 5 dB, from below threshold to maximal pressure. These raster data were later used to derive the frequency–threshold curve.
For rate–intensity (RI) functions, a separate data set with slower repetition rate and smaller sound pressure level steps was collected. In earlier experiments, RI data were mostly recorded only at the CF, but in some cases at 1 or 2 additional frequencies. Stimuli with 5 msec rise–fall times and 40 msec plateau were presented at a rate of two per sec, in 3 dB steps, in sequential order from the lowest to the highest SPL. In the last two experiments, which provided the bulk of the data (50 of a total of 95 single units), RI data were collected at 10 frequencies for each unit, surrounding and including the CF. Stimuli (5 msec rise–fall times and 40 msec plateau) were presented in a randomized order of SPLs at each frequency, with a duty cycle of 300 msec, in 3 dB steps.
Data analysis. Frequency threshold curves were derived by counting the spikes in a 50 msec window shifted for the average neural latency. The resulting response matrix was then smoothed by replacing each data point with an average of itself and the four surrounding data points, and an iso-rate curve was calculated at a criterion of 20 spikes/sec above spontaneous rate (as estimated from spike counts in a window covering the last 50 msec before the next stimulus). Click latencies, which were used for unit classification (see Results) were defined as the earliest response bin in poststimulus time histograms, using a bin width of 0.05 msec.
RI data were derived by counting the spikes in a time window equal to the stimulus duration but shifted for the average neural latency. Counts were averaged over the 10 repetitions at each frequency level combination and converted to discharge rates (in spikes/sec), however, no smoothing was applied. To obtain a quantitative description, RI data were fit with the following functions (modified from Yates, 1990a):
| Equation 1 |
| Equation 2 |
where R = mean discharge rate (spikes/sec);p = sound pressure (Pascals); d = presumed mechanical input (basilar membrane displacement in mammals);A0 = spontaneous discharge rate (spikes/sec);A1 = maximal discharge rate (spikes/sec);A2 = value of d, which produces 50% of the maximal increase in discharge rate over the spontaneous rate (in the case of a purely linear behavior of d (as in saturating responses), A2 will also correspond to the sound pressure producing this half-maximal rate); A3 = breakpoint, i.e., sound pressure (Pascals), which marks the transition from the linear response to the compressive growth in the presumed mechanical input; A4 = the exponent of the power-law slope in the region of compressive growth.
These or very similar equations successfully model mammalian auditory nerve RI functions (Sachs and Abbas, 1974; Sachs et al., 1989; Yates, 1990a). Some examples of mammalian RI functions at a particular CF are schematically illustrated in Figure 1: RI functions are thought to result as the combination of a compressive nonlinear mechanical response (Fig. 1A; Equation 1) representing the basilar membrane (BM), and a hyperbolic saturation of a variable in intensity squared (Fig. 1B; Equation 2) representing the hair cell and synapse. Depending on their individually variable thresholds to BM motion (Fig. 1B), different fibers are driven over their sensitive range by different parts of the common BM response curve. The most sensitive fibers already reach saturation within the initially linear response region of the BM, resulting in a flat–saturating RI function (Fig. 1C). Fibers with higher thresholds reflect the break in the BM response between linearity and compression, resulting in a sloping–saturating RI function. Finally, the fibers with the highest thresholds only start responding near or beyond the breakpoint in the BM response, resulting in a nearly straight RI function. At frequencies far below the CF, the BM response in mammals is always linear and insensitive, therefore RI functions at those frequencies are flat-saturating (data not shown).
Fig. 1.
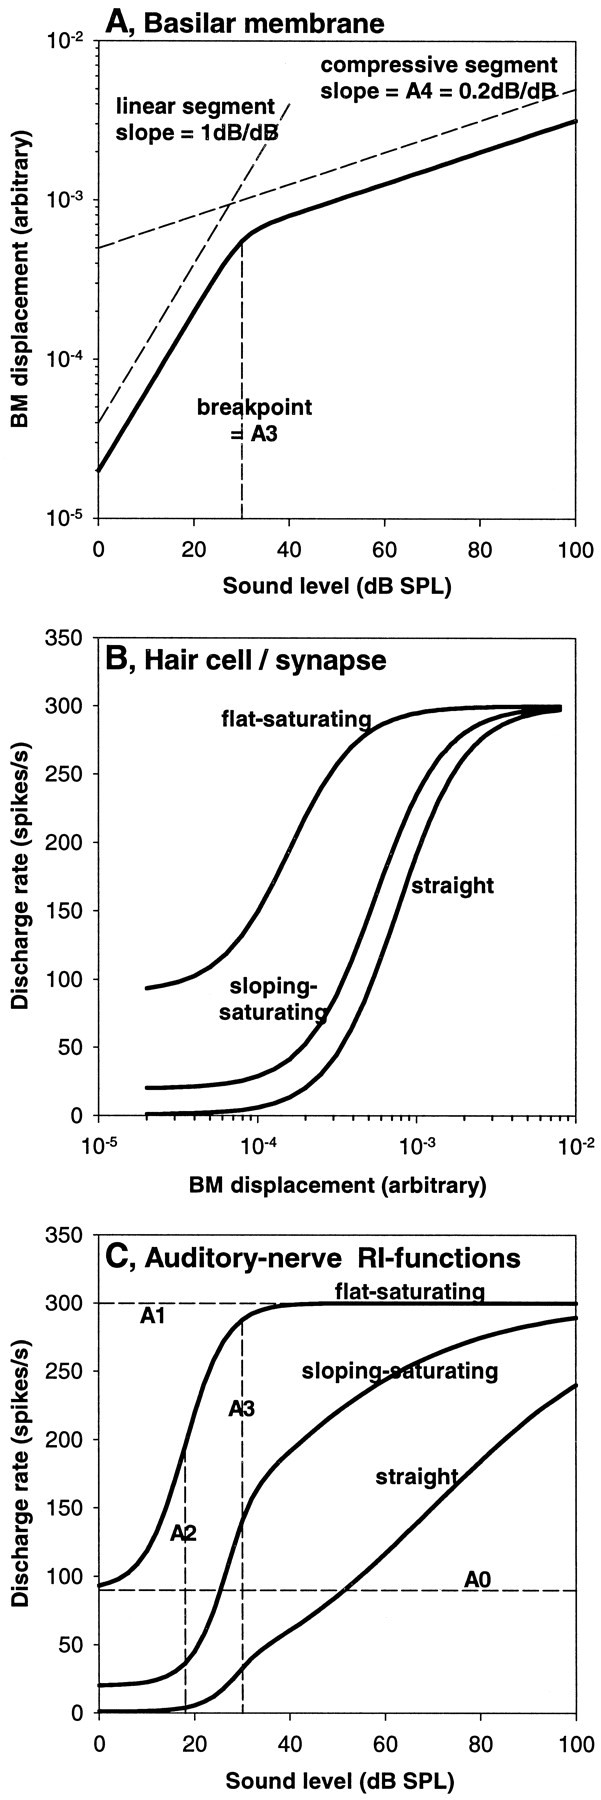
Graphical illustration of the model developed to explain the characteristics of mammalian auditory nerve rate–intensity functions (Sachs et al., 1989; Yates, 1990a). Three examples of auditory nerve responses at the same characteristic frequency are illustrated. A, Relationship between sound pressure level and basilar-membrane motion, pointing out the two characteristic response segments: a linear growth at low levels, followed, above a certain breakpoint, by a compressive growth. This mechanical input is common to all three model fibers. A value of 0.2, commonly encountered in the guinea pig (Yates et al., 1990), has been chosen for the exponent of the slope of the compressive segment (equal to parameter A4 in Equation 1) in this example. B, Relationship between basilar-membrane motion and neural discharge rate. The three curves represent examples that differ in their sensitivity and spontaneous discharge rate in a way typically found in mammals, i.e., the most sensitive fiber has the highest spontaneous rate. They are labeled according to the shape of rate–intensity function that will result. C, Neural rate–intensity functions (solid curves), i.e., the relationship between sound pressure level and discharge rate. The three curves result from the combination of the inputs shown inA and B. The dashed linesillustrate different parameters used in the model, according to Equations 1 and 2. The parameters A1 (maximal rate) and A3 (breakpoint) are common to all three model fibers in this example; A0 (spontaneous rate) and A2 (half-maximum point) are only indicated for the flat–saturating curve to avoid confusion.
The fitting of our barn owl data was performed by the iterative “Solver” module of the commercial spreadsheet software Microsoft Excel 97, allowing the parameters A0 to A4 to vary and minimizing the sum of the squared residuals. The fits were arrived at in several steps, optimizing each parameter separately before allowing simultaneous variation of all parameters for the final adjustment. In cases where data for more than one frequency had been obtained, all frequencies were fitted collectively in a further, final step, constrained to share the same values for A0 (spontaneous rate) and A4 (the exponent of the slope in the compressive region), respectively. The quality of the resulting fits was judged by scrutinizing the data for systematic deviations from the fit, and by inspection of the distribution of residuals. Our judgments are outlined and illustrated by a range of examples in Results.
RESULTS
Recordings were obtained in an area where the auditory nerve enters the brainstem and forms a thick sheet on its dorsal surface. Although the majority of units encountered were auditory nerve fibers, output fibers from the cochlear nucleus magnocellularis also cross this region and were encountered regularly. A classification scheme was therefore developed, as described in detail in Köppl (1997a), that allowed a distinction based on both click response latency and spontaneous discharge rate. Only data from auditory nerve fibers are reported here. They were characterized by a combination of short click latency, mostly <1.5 msec, and relatively low spontaneous rate, generally <50 spikes/sec.
The distribution of CFs in our sample is heavily skewed toward the higher CFs, with 74% having a CF >4 kHz. This is typical for the barn owl (Köppl, 1997a). Figure 2 shows the thresholds at CF and the tuning sharpness of our sample, which are also representative for the barn owl.
Fig. 2.
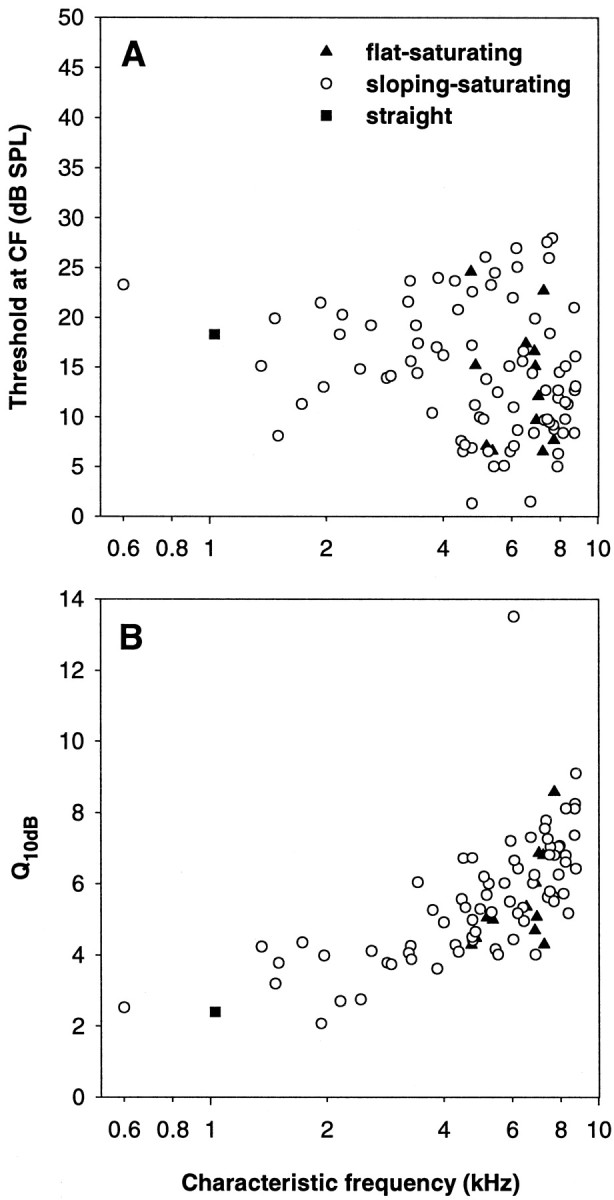
Sensitivity (A) and tuning sharpness (B) as a function of characteristic frequency, of the sample of auditory nerve fibers in this study. The different symbols refer to the classification of the fibers into different types of rate–intensity function, as indicated inA.
Shape of the rate–intensity functions at the characteristic frequency
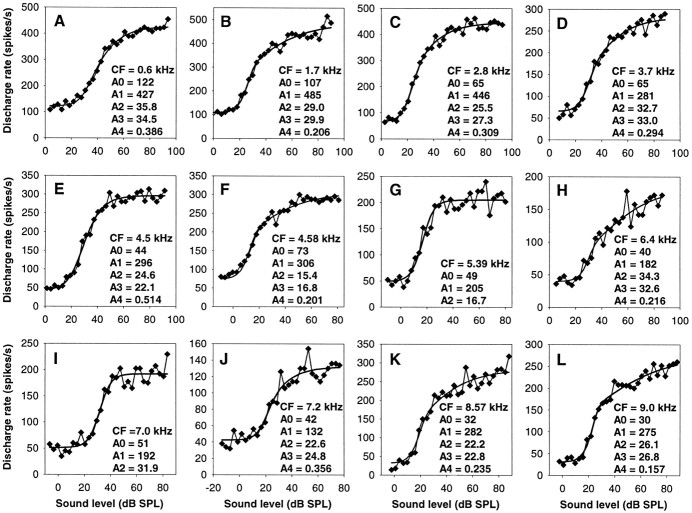
RI functions at the CF were obtained for 95 auditory nerve fibers, with CFs ranging from 600 Hz to 9 kHz. The functions chosen to fit the data and originally developed for mammalian auditory nerve fibers (see Materials and Methods) provided an excellent description of the barn owl data. Figure 3shows 12 representative examples from fibers of different CFs and illustrates the range of behavior observed. To compare our results with previous studies, we have classified the shape of RI functions at CF into the three different categories defined in mammals: flat–saturating, sloping—saturating, and straight (Fig. 1). Because those types are not distinct, but grade into each other (Sachs and Abbas, 1974), we used fixed values of the ratio of the point of half-maximal firing rate (parameter A2) to the breakpoint (parameter A3) for classification, rather than visual inspection as previously used. According to our criterion, sloping–saturating responses have a breakpoint within −6 to +9.5 dB of A2 (equal to A3:A2 ratios between 0.5 and 3), where the initially steep slope of the RI function flattens. A flat–saturating response is characterized by showing no breakpoint up to 9.5 dB above the half-maximal point (equal to an A3:A2 ratio above 3). It is important to point out that the presence of an ultimate saturation in the discharge rate is not the defining characteristic of a flat–saturating response. It is rather a steep slope right up to near saturation, without a prolonged segment of shallower growth in discharge rate before that. Many sloping–saturating responses, as indeed their name implies, also reach saturation within the range of SPL used, but only after a clear breakpoint from an initially steep slope to a shallower segment. Finally, straight RI functions are characterized by a breakpoint >6 dB below the half-maximal point (equal to A3:A2 ratio below 0.5). These curves break into a shallow slope very close to threshold and continue to grow at a slow rate up to high sound levels, typically without any indication of saturation. In extreme cases, they may even be concave-upwards.
Fig. 3.
Examples of auditory nerve rate–intensity functions at the CF. Each panel shows, as filled diamonds joined by a thin line, the raw discharge rates of a single fiber as a function of sound pressure level averaged over 10 presentations. The thick line in each case represents the best fit. The CF and the fit parameters are also given. G and I show two examples of flat–saturating responses, all other panels are examples for sloping–saturating responses.
Of the 95 auditory nerve fibers, 12 were thus classified as showing a flat–saturating response at CF (Fig. 3G,I), the great majority of 82 showed sloping–saturating behavior (all other examples in Fig. 3), and the response of only one fiber was classified as straight. For most units, the objective classification according to the A3:A2 ratio matched the subjective descriptions given above. Only in approximately nine cases (including the only one classified as straight) did the RI functions subjectively appear to conform closer to a flat–saturating kind, whereas their fitted breakpoints fell close to or even well below their half-maximal points and thus indicated a pronounced sloping segment. Two examples are shown in Figure 3,A and E. Such functions occurred over nearly the whole range of CFs (0.6–8 kHz) and were characterized by relatively high values for the parameter A4, which indicates an only mild compression in the nonlinear region of the assumed mechanical input to the hair cells. The derivation of this compressive component will be discussed in more detail below. For the following, the unit classification based on the A3:A2 ratio will be adhered to.
All flat–saturating fibers had high CFs, >4.7 kHz, whereas sloping–saturating behavior occurred across the whole range of CFs. The only straight response was at a CF of 1 kHz, however, as just discussed, this was one of a minority of atypical RI functions. Thus, the classical straight RI type, as defined in mammals, did not occur in the barn owl at CF. Within the range of CFs where flat–saturating responses were found, there was no difference in the thresholds at CF, the Q10 dB of the tuning curve or the spontaneous discharge rates between flat–saturating and sloping–saturating fibers (Mann–Whitney U tests; 1.0 > p > 0.22; Fig. 2).
Maximal discharge rates, dynamic range, and slopes at the characteristic frequency
The fit parameter A1 was used as the measure for the maximal discharge rate. Although for many fibers with a sloping–saturating response this actually reflects an extrapolation beyond measured rates, nearly all fibers (89 of 95) had reached at least 90% of A1 within the range of SPLs measured. Maximal discharge rates at CF differed drastically across the range of CFs. Whereas the fibers with low CFs typically discharged 400–600 spikes/sec, the discharge rates of high-CF fibers never reached >200–300 spikes/sec. This trend was nearly linear from the lowest CF to a CF of ∼7 kHz, with a subsequent plateau. The change in maximal discharge rate closely resembled a similar decreasing trend in the spontaneous discharge rate with increasing CF (parameter A0, shown previously by Köppl, 1997a). Consequently, the maximal increase in discharge rate over the spontaneous rate was also a decreasing function of the CF (Fig.4A). There was no difference in maximal discharge rates between fibers with flat–saturating and sloping–saturating responses, respectively, within the range of CFs where the two types overlapped (Mann–WhitneyU test; p = 0.19; n = 52).
Fig. 4.
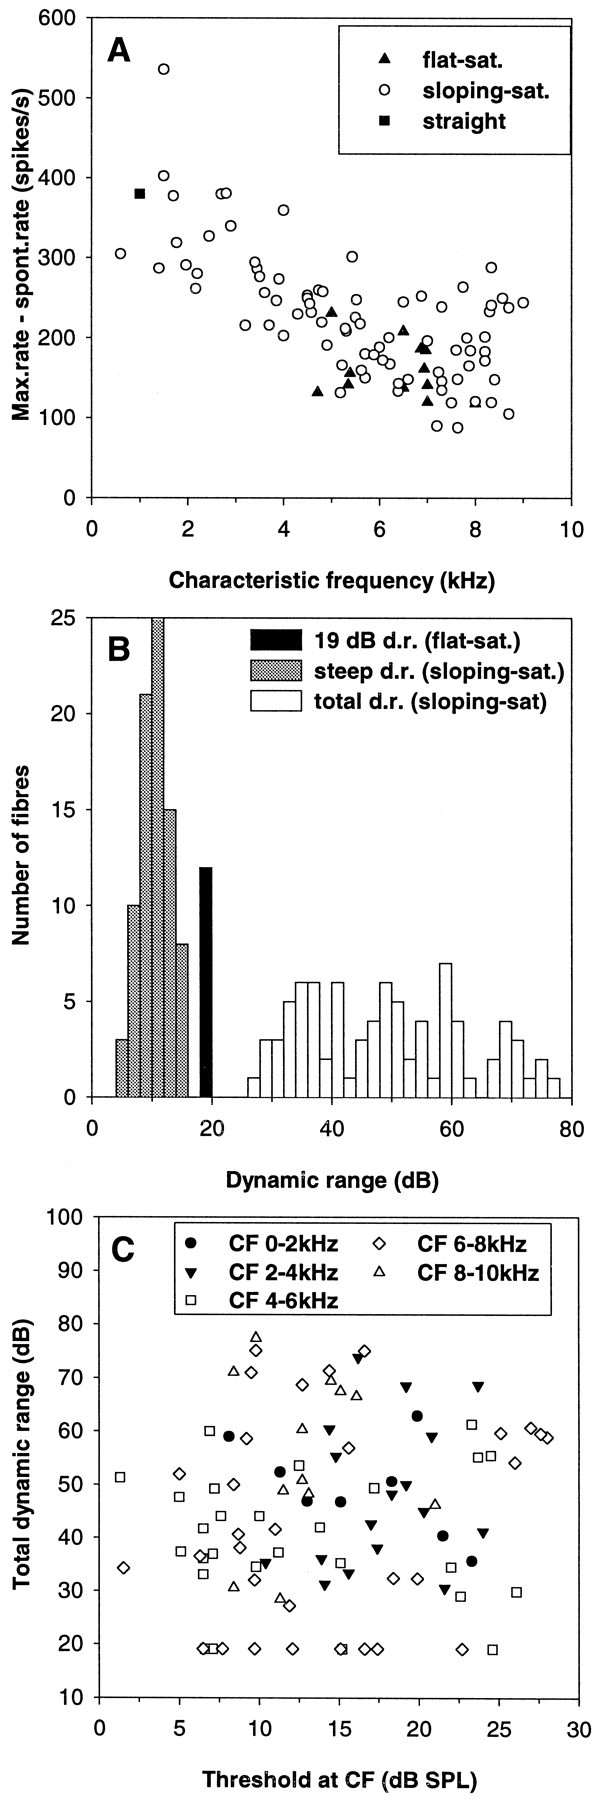
Dynamic ranges of auditory nerve fibers at their characteristic frequency. A, The difference between maximal rate and spontaneous rate as a function of characteristic frequency. Note the prominent decline from low to high frequencies. The different symbols refer to the classification of the fibers into different types of rate–intensity function, as indicated. B, Frequency histogram for two different measures of the dynamic range in decibels.Gray columns indicate the initial steep dynamic range of sloping–saturating rate–intensity functions, and white columns indicate their total dynamic range. Flat–saturating responses had a simple and invariant dynamic range of 19.1 dB and are represented by the black bar. C, Total dynamic range as a function of the threshold at CF. Note that there is no relation between those parameters. Different symbols distinguish data from fibers of different CF ranges, as indicated.
Another important characteristic that defines the ability of a neuron to code SPL is the dynamic range. We defined total dynamic range as that range (in decibels) over which the fitted RI function reached between 10 and 90% of its maximal increase over the spontaneous rate. In the model we chose to fit to the data, the total dynamic range of flat–saturating RI functions is always equal to 19.1 dB. Units with a sloping–saturating response showed total dynamic ranges from 27 to 77 dB (Fig. 4B). The average value was 48.9 ± 13.6 dB SD. In cases in which the upper criterion could not be met within the actually measured range of SPLs (11 fibers), the dynamic range was limited to the maximal SPL of the data to avoid extrapolation. Total dynamic range appeared to vary randomly, with no relation to CF, threshold at CF (Fig. 4C), the spontaneous or the maximal discharge rate. Only for the lowest CFs, up to 2 kHz, was there a tendency toward larger total dynamic ranges in fibers with higher maximal rates (Spearman rank correlation; ρ = 0.76; p = 0.028; n = 8).
For RI functions of the sloping–saturating type, an additional, more restricted, measure of dynamic range covering only the initial steep segment of the RI function was also derived. This was termed steep dynamic range and was measured between the point where the discharge rate had reached 10% of its maximal increase above spontaneous rate, and the breakpoint A3. The steep dynamic ranges varied between 4.3 and 15.5 dB (Fig. 4B), the mean value was 10.4 ± 2.5 dB SD. This parameter, too, was unrelated to CF, sensitivity, or spontaneous discharge rate.
We also wished to determine the slopes of the RI functions, another measure of the ability of a fiber to code a range of SPLs. This is fairly straightforward for flat–saturating responses, in which an estimate of the maximal slope was obtained by linear interpolation between 1 dB below and above the half-maximal point (A2). In the case of sloping–saturating RI functions, a measure for the slope in the initial steep segment was defined as the greater of the two values obtained at A2 and 5 dB below the breakpoint (A3), respectively. Depending on where the breakpoint was located relative to the half-maximal point, the one or the other of the two values will be greater. As a measure for the slope in the shallow segment of sloping–saturating functions, points at 10, 20, 30, and 40 dB above the breakpoint were also evaluated. The maximal slopes of all RI functions followed a pattern very much like the maximal discharge rates, i.e., a monotonic decrease with increasing CF up to ∼7 kHz. Indeed, after controlling for the effect of maximal rate, no correlation remained between the CF and the maximal slope (partial correlation, p = 0.34), indicating that the slope can be entirely predicted by the maximal rate. Maximal slopes in fibers with low CF typically were ∼10–15 spikes · sec−1 · dB−1. For fibers with CF >7 kHz, values of 4–10 spikes · sec−1 · dB−1were most common. The slopes of units with flat–saturating and sloping–saturating responses were not significantly different within the range of CFs where the two types overlapped (Mann-WhitneyU test; p = 0.11; n = 52). For sloping–saturating responses, the slope of the RI function, of course, progressively flattened above the breakpoint. Typical slopes at a point 10 dB above the breakpoint were ∼5 spikes · sec−1 · dB−1for units of low CF, and ∼2 spikes · sec−1 · dB−1 for high-CF fibers. At 40 dB above the breakpoint, slopes had generally flattened to ∼1 spikes · sec−1 · dB−1.
The variation in dynamic ranges at any one CF can partly be explained by variation in the slopes of the RI functions. Within the population of fibers with sloping–saturating responses, there was a weak positive correlation between the steep dynamic range and the maximal slope (Spearman rank correlation; ρ = 0.27; p = 0.016;n = 83).
Change of the rate–intensity functions off the characteristic frequency
From a subset of 69 auditory nerve fibers, RI data at frequencies other than the CF were also obtained. The most extensive data came from 50 units with CFs between 1.8 and 8.6 kHz, for which responses at typically 10 frequencies, including as large a range as possible both below and above the CF, were collected. In the remaining cases, only one or two additional RI functions well below and above CF were obtained. The range over which RI data were obtained was typically up to 0.4 octaves below the CF (see Fig. 9B). Above the CF, this range was increasingly restricted with increasing CF, from typically 0.5 octaves in low-CF units down to 0.2 octaves at the highest CFs, reflecting the steep high-frequency flanks of barn owl auditory nerve tuning curves (Köppl, 1997a).
Fig. 9.
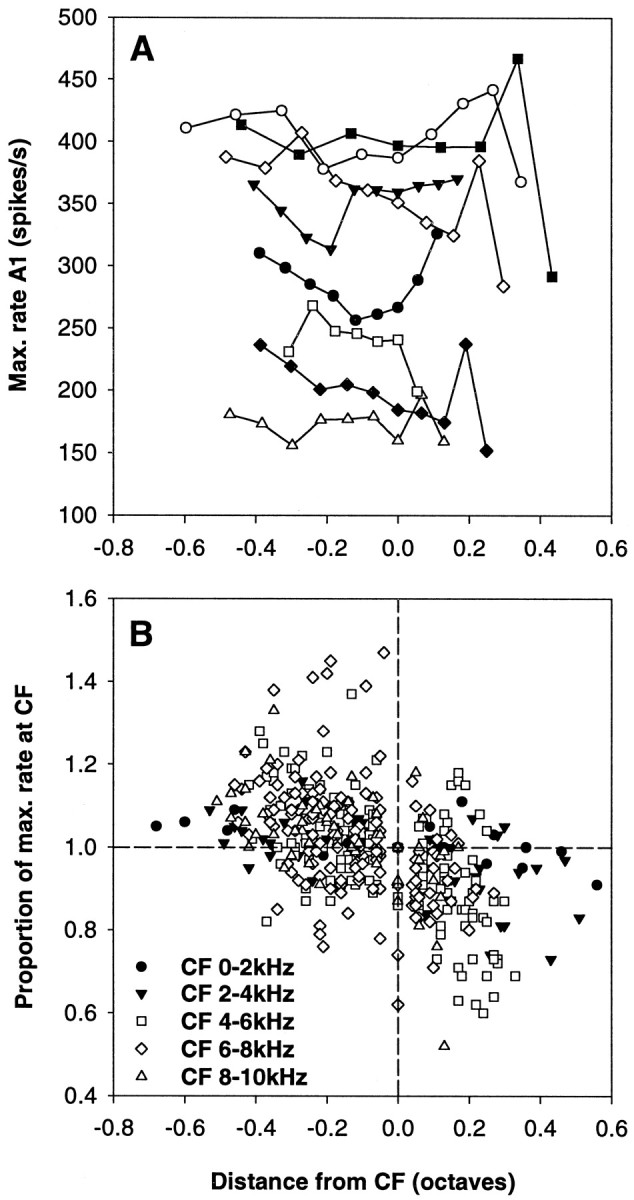
Variation in the maximal discharge rates across the frequency response range of individual auditory nerve fibers.A, Maximal discharge rate predicted by the best fits (parameter A1) as a function of the distance from the CF in octaves. The different symbols indicate data from different individual fibers. Note that there was often a mild decline in maximal rate with increasing frequency or a dip around CF. B, Maximal discharge rates actually observed up to the maximal sound pressure levels used. Discharge rates are plotted normalized to the rate at CF, as a function of the distance from the CF in octaves. All data are shown, and different symbols are used to distinguish data from fibers of different CF, as indicated. The dashed lines provide references, indicating the values at CF. Note that maximal rates at frequencies below CF tended to be higher than at CF, whereas, conversely, rates at frequencies above CF tended to be lower than at CF. The decline of maximal rates at frequencies above CF is largely caused by the many responses of the straight type, showing a very slow increase in discharge rate with increasing sound pressure level.
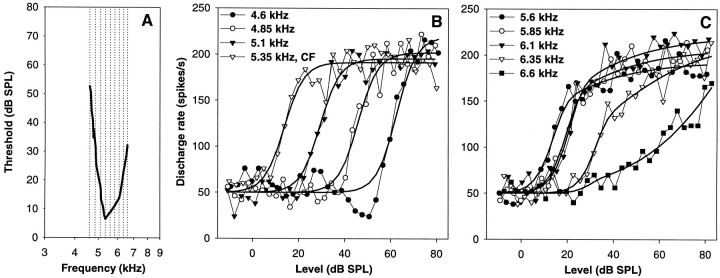
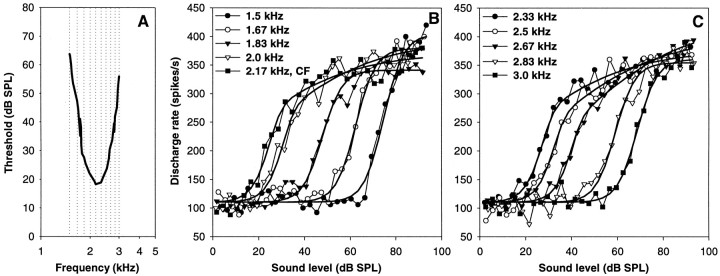
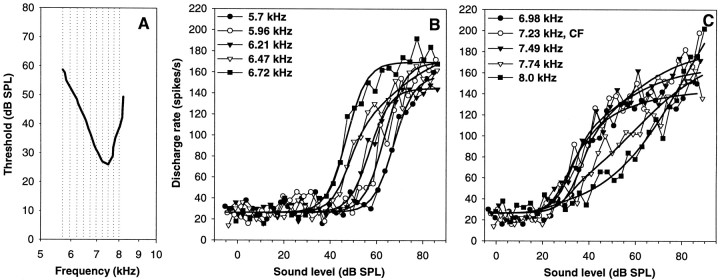
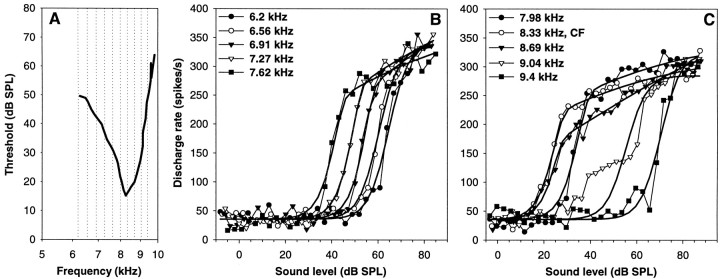
In general, the fitted functions also provided excellent descriptions at frequencies off the CF (exceptions will be pointed out below). At frequencies well below CF, all fibers showed flat–saturating responses. With increasing frequency, the response then changed to the sloping–saturating type at some frequency which, for most units, lay below the CF. We did not encounter any auditory nerve fibers that showed flat–saturating behavior throughout their responsive frequency range. Even those that responded in a flat–saturating pattern up to and including their CF, changed to a sloping–saturating response above CF (Fig. 5). At frequencies far above CF, fibers of low CF (up to 3–4 kHz) reverted again to a flat–saturating response (Fig. 6). Fibers of medium CF (4–8 kHz) typically showed an increasingly pronounced sloping–saturating response to frequencies above CF, often grading into straight RI functions at the highest frequencies evaluated (Figs.5, 7). Finally, units of the highest CFs (more than ∼8 kHz), after a similar trend toward straight RI functions above CF, reverted again to a flat–saturating type at the high-frequency limits of their response (Fig.8). It was unclear whether this represented a true difference in the behavior of the highest CF fibers or whether an ultimate return to a flat–saturating response would have also been seen in fibers of medium CF if responses to higher frequencies had been sampled.
Fig. 5.
Rate–intensity functions of a single auditory nerve fiber with a CF of 5.35 kHz, at different stimulation frequencies. A, Frequency–threshold curve of the fiber (thick line), with the stimulation frequencies used inB and C indicated by thin dotted lines. B and C, Raw data (symbols joined by thin lines) and best fits (thick lines). Different symbols are used for different frequencies, as indicated. B shows stimulation frequencies up to and including the CF, and C shows frequencies above the CF. This fiber showed a flat–saturating response up to and including CF. At frequencies above CF, the response became increasingly pronounced sloping–saturating, at 6.6 kHz it classified as straight. Also note the pronounced suppression below the level of spontaneous discharge at 4.6 kHz, which was not well fit.
Fig. 6.
Rate–intensity functions of a single auditory nerve fiber of low CF at different stimulation frequencies. The general layout is the same as in Figure 5. Note the change from a flat–saturating response (up to 1.83 kHz) to a sloping–saturating one at frequencies around CF, and back to a flat–saturating one at ≥2.83 kHz.
Fig. 7.
Rate–intensity functions of a single auditory nerve fiber with a CF of 7.23 kHz, at different stimulation frequencies. The general layout is the same as in Figure 5. The response of this fiber was flat–saturating up to 6.21 kHz, and (with one exception at 6.72 kHz) sloping–saturating at frequencies around the CF. Well above CF, the RI functions were straight or even concave-upwards. Also note the low discharge rates of this fiber.
Fig. 8.
Rate–intensity functions of a single auditory nerve fiber of high CF at different stimulation frequencies. The general layout is the same as in Figure 5. This fiber showed a sloping–saturating response over nearly the whole range of frequencies tested. Only at the lowest two and the highest frequencies was the best fit a flat–saturating curve. Note the unusual step-like response at 9.04 kHz, which was not well fit.
Some exceptions to the otherwise very good fits of the chosen model to the data were noted. These were not related to minor differences in experimental protocol (e.g., sequential vs random presentation of stimuli, see Materials and Methods) and were also consistently observed in the second data set available for most units and collected for derivation of the tuning curve (see Materials and Methods). In ∼25% of auditory nerve fibers, a slight suppression of the discharge rate below the spontaneous level was observed at some frequencies below the CF, at SPLs below those exciting the fibers (extreme example in Fig. 5, RI function at 4.6 kHz). This phenomenon has been observed in other birds before and is referred to as single-tone or primary suppression (Gross and Anderson, 1976; Manley et al., 1985; Temchin, 1988; Hill et al., 1989). Because suppression is not a feature of the model, the fitted RI functions systematically cut above those depressions in the data. In many of these cases, the rising slope of the subsequent excitatory response also appeared slightly steeper than the fitted function. Another kind of deviation of the fitted functions from the data were encountered in ∼15% of the fibers. These would show an unusual step-like increase of their discharge rate, which could never be fit adequately, at one particular frequency several hundred Hertz above the CF (Fig. 8; RI function at 9.04 kHz).
Besides the changing shape of the RI functions with frequency, many fibers also showed a small variation of the maximal discharge rates (parameter A1) with stimulation frequency. Our fitting procedure originally included the constraint that all RI functions from one particular auditory nerve fiber share the same value for maximal discharge rate. However, after finding that the real discharge rates at frequencies well below the CF routinely exceeded the fitted functions, this constraint was released. Figure9A shows some examples of the change in maximal discharge rate (A1) with frequency for individual fibers. It is important to point out that, especially at frequencies well above the CF, where RI functions were often of shallow and nearly straight growth, the parameter A1 may represent an extrapolation far beyond the actually measured range. To obtain a measure of the discharge rates that are realistically achieved at the different stimulation frequencies we therefore introduced a limitation, defining the maximal rate as that predicted by the fit at the highest SPL used, if this rate was still <90% of the predicted maximal increase over the spontaneous rate. Figure 9B shows this limited measure of maximal discharge rate, normalized to the maximal rate at CF. There is a clear overall decrease of the discharge rates with increasing frequency, especially pronounced above the CF, and in fibers with a CF >4 kHz. It should be emphasized again that these are not saturation discharge rates, but that the data shown in Figure 9B are largely reflecting the changing shape of the RI functions across the response range of the fibers. The variation of the extrapolated maximal discharge rate (parameter A1) was much more modest (Fig. 9A) and in no way comparable to the pronounced decline with increasing frequency shown e.g., for chinchilla auditory nerve fibers (Jackson and Relkin, 1998).
Derivation of a compressive nonlinear component in the response
The model we chose to fit to our data, originally developed for mammalian auditory nerve fibers, assumes two cascading response components that together shape the neural RI function (Fig. 1): one component that, after an initial linear response, becomes compressive above a certain SPL (the basilar membrane vibration in mammals), and a component which shows a square-law saturating response (the transduction and synaptic transmission stages). A hallmark of the mammalian cochlea is that the mechanical input from the basilar membrane is shared between fibers of closely similar CF in the same individual, regardless of the thresholds of the fibers, and that therefore the compressive component derived by the model for such neural responses is ideally the same (as for the examples in Fig. 1) or at least extremely similar. Because the model described our data very well, we were interested to investigate whether this prediction holds for the barn owl as well.
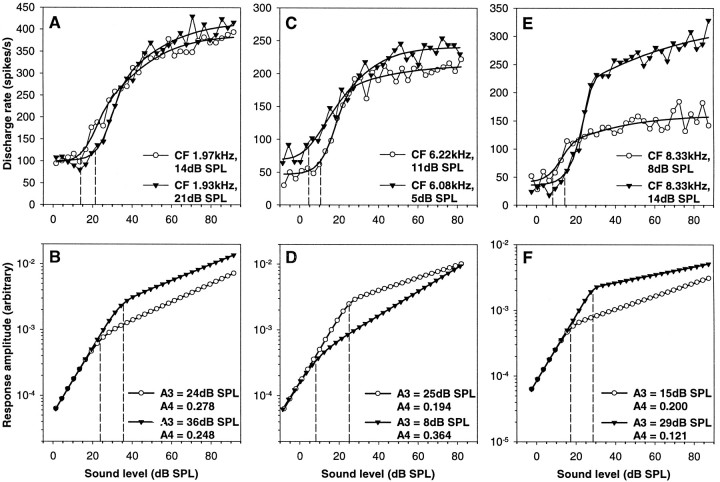
Comparing auditory nerve fibers of closely similar CF in individual owls, it was quickly apparent that the compressive nonlinear response component predicted by the best fits was not shared but was, in fact, systematically different between fibers. Figure10 shows three typical comparisons between pairs of fibers, selected for very similar CF, but different sensitivities at CF. For each pair, the predicted compressive response components differed widely in their breakpoints (parameter A3). In two of the examples shown, the exponent of the slope in the compressive region (parameter A4) also differed considerably. The breakpoint of sloping–saturating responses turned out to be closely correlated to the sensitivity of the fibers, lying on average 10 dB above the threshold. This was true whether only subsets of data restricted to a narrow range of CFs from one individual were considered (Fig.11A) or whether all CF data were pooled (Fig. 11B).
Fig. 10.
Three comparisons of the rate–intensity functions of pairs of auditory nerve fibers of similar CF from the same individual owl. In each case, the top panel (A, C, E) shows the raw data (symbols joined bythin lines) for the rate–intensity function at CF and the best fits (thick lines). Different symbols are used for the two fibers to be compared in each case. Their CFs and thresholds at CF (equivalent to a 20 spikes/sec increase over spontaneous rate) are given; the thresholds are, in addition, indicated by dashed lines. The bottom panels(B, D, F) show the compressive nonlinear response components predicted by the fits for the same fibers, using the same symbols. The parameters A3 (breakpoint) and A4 (exponent of the slope in the compressive segment) are given; A3 is, in addition, indicated bydashed lines. Note that for each of the three pairs of fibers compared, the predicted compressive nonlinearities are considerably different, and their breakpoints vary with the thresholds of the neural rate–intensity functions.
Fig. 11.
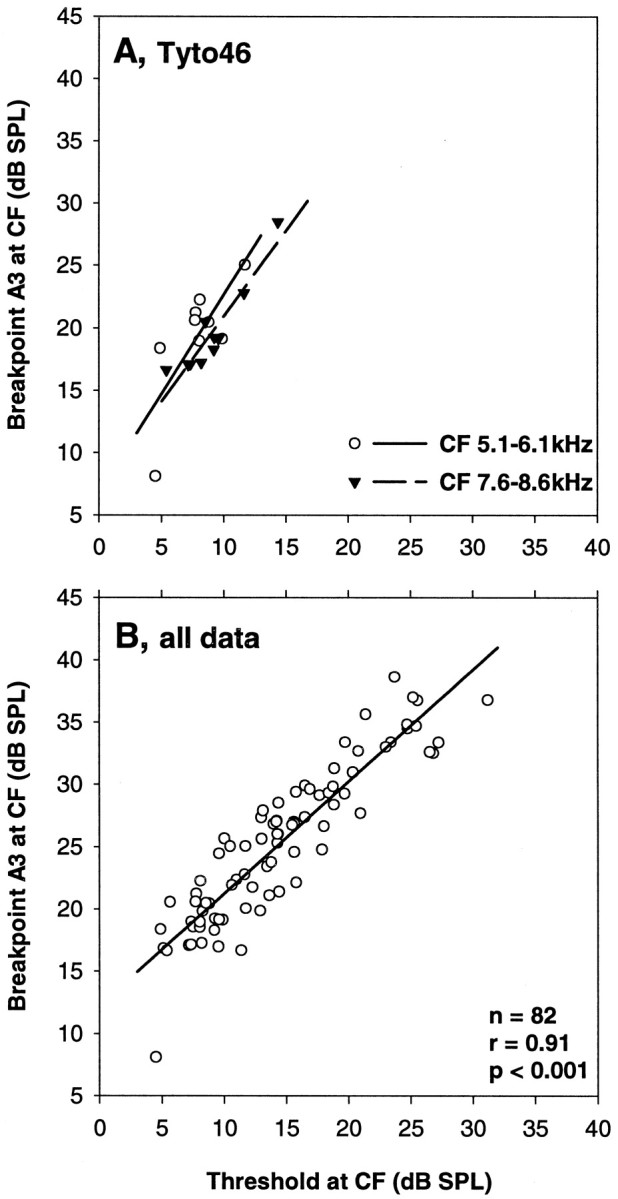
The correlation between the thresholds at CF of auditory nerve fibers and the breakpoints in their rate–intensity functions. A, Data for two different, narrow ranges of CF, plotted with different symbols, in an individual owl (Tyto46). Regression lines are drawn for both sets of data (n= 9, r = 0.76, p = 0.018;n = 10, r = 0.93,p < 0.001). B, All data pooled across animals and CFs. The regression line is drawn, and the corresponding statistics are given.
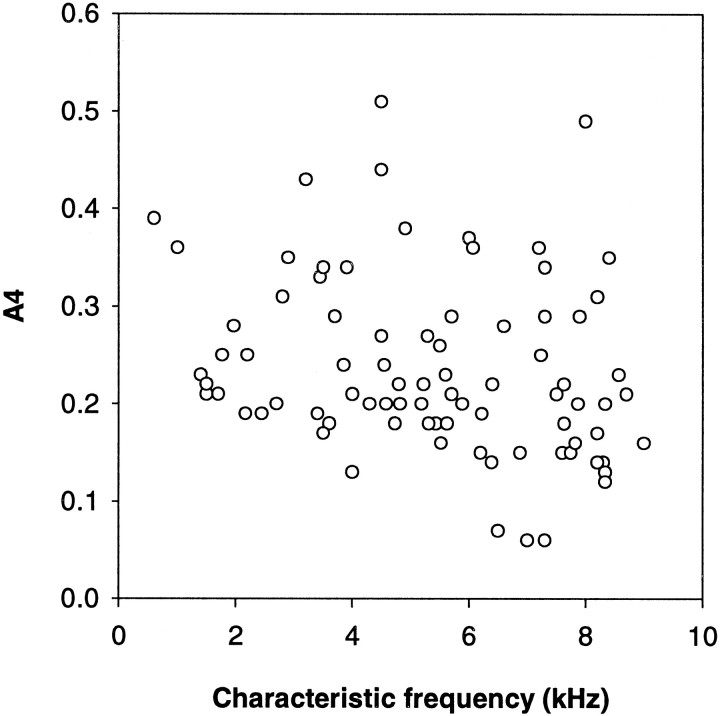
The parameter A4 of the model (the exponent of the slope in the compressive region) is a measure of the degree of compression at SPLs above the breakpoint. The lower its value, the shallower is the growth of the response. This parameter varied widely at any one CF in any individual, without any relation to the sensitivity of the fibers (Spearman rank correlation; ρ = 0.053; p = 0.64). There was a slight overall decline in A4 with increasing CF (Fig. 12).
Fig. 12.
The parameter A4, a measure for the degree of nonlinear compression predicted by the fits, as a function of the characteristic frequency. Only data for rate–intensity functions at CF are shown. A4 varied widely and nearly randomly, with only a slight tendency toward lower values at higher frequencies.
DISCUSSION
The data presented here describe and quantify the basis for the neural processing of sound level in the barn owl, an important animal model in sound localization. The first part of the discussion will point out the main conclusions and predictions for intensity processing in the owl. The data also provide evidence for the operation of an amplification mechanism for low-level stimuli in the bird inner ear. The concept of active amplification and the mechanisms underlying it are currently intensely debated, and the second part of the discussion will summarize the controversial issues and argue the points strengthened by our data.
Sound level coding in the auditory nerve as the basis for higher-order processing
It is well known that interaural intensity difference (IID) is a critical parameter for the barn owl in determining the location of a sound source. Its fleshy ear flaps and the characteristic facial disk of feathers serve to produce directional characteristics of the ears. At low frequencies, less than ∼4 kHz, IID increases, as expected, predominantly and monotonically when moving a sound source from mid-azimuth to either side of the animal. At higher frequencies, however, IID is transformed into a sensitive although complex cue to the elevational position of a sound source, as the two ears become increasingly differentially sensitive to sounds from below and above the midline, respectively (Moiseff, 1989; Knudsen et al., 1991; Keller et al., 1998). It has been shown behaviorally that the barn owl indeed needs the presence of high frequencies and relies on IID to determine the elevational coordinate of a sound source (Knudsen and Konishi, 1979). A brainstem pathway synthesizing a map-like neural representation of IID is also known (Takahashi et al., 1984; Manley et al., 1988a).
The range of IID available to the owl in the elevational axis is, depending on the frequency, of the order of ±10–20 dB over a range of approximately ±40° (Moiseff, 1989; Knudsen et al., 1991; Keller et al., 1998). Its behavioral accuracy in localizing over this elevational range is 2–5° with noise signals and 6–10° with pure tones (Knudsen and Konishi, 1979; Knudsen et al., 1979). Accurate sound localization therefore requires the detection of IID of the order of a few decibels at frequencies >5 kHz. In addition, most of the naturally occurring stimuli that a barn owl must be able to localize can be assumed to be faint signals not far above its hearing threshold. How well suited is the auditory nerve input to these tasks?
Most auditory nerve fibers showed their steepest increase in discharge rate in response to SPLs within ∼15 dB of their respective thresholds. This was a consequence of the strong correlation between the breakpoint of the (mostly sloping–saturating) RI functions and the threshold (Fig. 11). Fibers with a flat–saturating response at CF also had narrow dynamic ranges of 19 dB. Because the range of neural thresholds at any one CF in individual owls is quite narrow (10–15 dB;Köppl, 1997a), auditory nerve fibers thus collectively display the steepest increases in discharge rates to changes in SPL within ∼30 dB of the best thresholds. At higher SPLs, the progressive flattening of most RI functions appears to render the fibers increasingly less sensitive to differences in level. However, information from off-CF responses could in principle be used to improve discrimination of narrow-band signals at high sound levels (Buus et al., 1995). Also, the variance of spike rates could, if it changed with level and/or frequency, differentially affect signal detection.
A prominent feature of barn owl auditory nerve fibers was the decline in maximal discharge rates with increasing CF, such that fibers in the frequency range >5 kHz, which is the behaviorally most relevant for intensity processing, had the lowest rates. Although very little data are available for comparison, this appears odd in the light of an opposite trend being found in the cat (Liberman, 1978). One may speculate that the low discharge rates of high-CF fibers in the owl are a compromise related to the extraordinary ability of phase-locking to very high frequencies (Sullivan and Konishi, 1984; Köppl, 1997b), the mechanism of which remains unknown.
One indication that improvement over the performance of the auditory nerve is needed for intensity processing is that neurons in the cochlear nucleus angularis (NA) show a much improved sensitivity to changes in SPL compared with the auditory nerve. The NA is generally regarded as the starting point of an avian brainstem pathway, largely devoted to intensity processing (Takahashi et al., 1984; Warchol and Dallos, 1990; Carr, 1992). In the barn owl, NA neurons both increase their discharge rate more rapidly with rising SPL and reach considerably higher discharge rates than do auditory nerve fibers. Average values are 16.4 spikes · sec−1 · dB−1and 487 spikes/sec for the NA (Sullivan and Konishi, 1984; calculated from their values given in spike counts), compared to 9.1 spikes · sec−1 · dB−1(maximal slope) and 278 spikes/sec for auditory nerve fibers. NA neurons appear to have smaller total dynamic ranges than auditory nerve fibers, however, different methods for measuring the dynamic range were used, which makes them hard to compare. If only the steep dynamic ranges of auditory nerve fibers are compared, NA neurons would have the larger dynamic ranges. Overall, NA neurons show more precise coding of SPL than do their auditory nerve inputs, which suggests a certain degree of convergence and integration. This is supported by the morphology of auditory nerve terminal arbors in NA, which appear to contact many neurons, typically in two terminal fields (Carr and Boudreau, 1991). Putative inhibitory inputs are also present (Carr et al., 1989).
Implications from rate–intensity data about cochlear mechanisms in birds
It is widely accepted that the mammalian cochlea employs a positive feedback mechanism to enhance low-level stimuli. This is often colloquially called the “cochlear amplifier” and is thought to involve (following the classical mechanoelectrical transduction) a reverse or electromechanical transduction of the outer hair cells, feeding energy back into and thus amplifying the cochlear motion (e.g.,Dallos, 1996; Patuzzi, 1996; Nobili et al., 1998). If cochlear motion is measured directly, commonly at the level of the basilar membrane in mammals, the signature of this amplification is a compressive nonlinear input–output relationship. At low sound levels, the relation between pressure input and mechanical response is linear. At moderate levels, at which hair-cell transduction begins to saturate, the amplifying feedback accordingly begins to saturate, evident in a compressive growth of the mechanical response (e.g., Nobili et al., 1998). If the feedback loop is rendered ineffective, e.g., by physiological insults to the cochlea or at frequencies far below the CF of a given cochlear location, thresholds rise dramatically, and the response is linearized over the remaining range (e.g., Patuzzi, 1996; Nobili et al., 1998). It is important to point out that the organ of Corti of mammals moves as a unit, such that the motion of the basilar membrane appears to faithfully reflect the mechanical response at the transduction sites, i.e., the hair-cell stereovillar bundles (e.g., Patuzzi, 1996). This may be a unique situation for mammals and is unlikely to be true for nonmammals with their different details of cochlear anatomy. Here, the relevant mechanical response is probably more localized to the hair-cell bundles and tectorial-membrane complex, and the motion at the level of the basilar membrane cannot be assumed to reflect all its details (e.g., Manley et al., 1988b). In birds specifically, it is well known that the most sensitive responses derive from hair cells that do not sit over the basilar membrane but off its edge, on the cartilaginous limbus (Gleich, 1989; Smolders et al., 1995). Direct measurements of the basilar-membrane motion in the pigeon have shown it to be rather insensitive and linear (Gummer et al., 1987), which are the characteristics of a passive system without positive feedback. However, this does not inevitably mean that all the mechanical response in the bird basilar papilla is linear, because the motion at the level of stimulus transduction is not known and may well be different.
We have shown that RI functions of barn owl auditory nerve fibers are well described by equations derived for the mammalian cochlea. The same conclusion was reached for similar data in the pigeon and the emu (Richter et al., 1995; Köppl et al., 1997). The mammalian model is based on two principal components. That part that represents the transduction and synaptic transmission stages, i.e., the hyperbolic saturation (Fig. 1B), is very likely a universal feature that applies to all vertebrate hearing organs (e.g.,Fettiplace, 1990; Kros, 1996). The compressive, nonlinear component, although specifically based on the known input–output behavior of basilar-membrane motion in mammals, will fit any other compressive nonlinearity with similar characteristics equally well. Generic models of a saturating positive feedback loop predict exactly this sort of behavior, with a linear response at low levels, switching, at some particular input level, abruptly to a highly compressive response (Yates, 1990b). The great similarity in the shapes of neural RI functions between birds and mammals is thus not in conflict with the known differences in basilar-membrane behavior between those two groups, which was discussed above. It may simply point to different physical realizations of the same basic principle of cochlear nonlinearity and amplification. We thus interpret our results as support for a positive feedback loop in the bird cochlea, similar in its function but perhaps different in its realization to the mammalian cochlear amplifier.
It is instructive to point out a crucial difference seen between avian and mammalian RI functions. In mammals, spontaneous discharge rate, sensitivity, and the type of RI function vary between fibers in a correlated fashion (Sachs and Abbas, 1974; Winter et al., 1990; Winter and Palmer, 1991), whereas the underlying compressive nonlinearity is very similar between fibers of closely related CF (Müller and Robertson, 1991; Cooper and Yates, 1994). This is a consequence of the uniform basilar-membrane and inner hair-cell response at any cochlear location on the one hand and the neural sensitivity and spontaneous discharge rate being determined by the synapse on the other hand (Liberman and Oliver, 1984; Merchan-Perez and Liberman, 1996; Tsuji and Liberman, 1997). Thus, different synapses on the same hair cells reflect different ranges of a common nonlinear input, as illustrated in Figure 1A–C. In birds, in contrast, spontaneous rate, sensitivity, and the type of RI function do not consistently correlate, and there are no populations of fibers comparable to the mammalian low-, medium- and high-spontaneous rate groups (Manley et al., 1985; Köppl, 1997a; Köppl et al., 1997; Richter et al., 1995; Smolders et al., 1995). Furthermore, the presumed compressive nonlinear input derived from the neural responses was not shared between fibers of closely related CF but could differ considerably. Instead, there was a strong correlation between the individual neural threshold and the breakpoint between linearity and compression in the presumed input. This suggests a more individual, localized nonlinearity instead of a mammal-like global amplifying feedback loop uniformly driving all hair cells within a narrow range of CFs. It does not, however, say anything about the nature of the presumed amplification mechanism. A recent theoretical study is exciting in this context, which has shown that the mechanoelectrical transduction channels common to all hair cells could exert forces through the binding of Ca2+ and thus actively amplify motions of the stereovillar bundles (Choe et al., 1998). Interestingly, the model also produced highly tuned, compressively nonlinear behavior of the bundles and was predicted to work at least within the sensitive frequency range of birds, including owls.
The interpretation that the neural RI functions of the barn owl are indicative of a cochlear amplification mechanism is strengthened by the fact that a pronounced compressive nonlinearity was only observed in responses around CF. Well below CF the responses were always of the flat–saturating type with a high threshold, i.e., without any indication for an underlying compressive nonlinearity. Above CF, many auditory nerve fibers in the owl behaved very similar to those in the cat (Sachs and Abbas, 1974), with the RI functions flattening strongly. Far above CF, many reverted to a flat–saturating response. These prominent variations with frequency exclude any frequency-independent effects that could possibly produce sloping–saturating RI functions, such as sloping–saturating behavior of the receptor potential and/or synapse themselves. They also distinguish our data from recordings of low-CF (<1–2 kHz) auditory nerve fibers in both the guinea pig (Cooper and Yates, 1994) and another bird, the pigeon (Richter et al., 1995), in which the shape of the RI function was found to hardly vary across a the response range of a fiber. Consequently, Cooper and Yates (1994) concluded that there was no firm evidence for a frequency-selective compressive nonlinearity in the cochlear apex. More recently, direct measurements of motion in the cochlear apex of the chinchilla have shown that there is no qualitative difference between the low-frequency apex and the higher-frequency regions of the mammalian cochlea, but that the compressive nonlinearity is merely broader in its frequency selectivity, is effective over a smaller range of SPLs, and effects less compression (Rhode and Cooper, 1996). The reduced compression was also evident in neural data as a uniformly steeper slope (equivalent to our parameter A4) in the nonlinearity derived from RI functions of low-CF fibers (Cooper and Yates, 1994). We emphasize again that barn owl auditory nerve fibers did not behave like low-frequency mammalian fibers. Although our data did include similarly high values of A4, a broad range of values was found at any one CF (Fig. 12).
There is also independent evidence for the presence of a positive feedback loop in birds. In the barn owl, spontaneous otoacoustic emissions are found in many ears (van Dijk et al., 1996; Taschenberger and Manley, 1997). These weak near-sinusoidal signals, which can be measured in the ear canal when quiet, are believed to be the by-product of a positive cochlear feedback loop with high gain and to be generated by active motility of the hair cells (e.g., Köppl, 1995). However, the mechanisms for such motility are still controversial (e.g., Hudspeth, 1997).
Footnotes
This work was supported by the Deutsche Forschungsgemeinschaft (Grant SFB 204 and fellowships to C.K.). We thank Georg Klump and Geoff Manley for critically reading earlier versions of this manuscript.
Correspondence should be addressed to Dr. Christine Köppl, Institut für Zoologie, Technische Universität München, Lichtenbergstrasse 4, 85747 Garching, Germany.
REFERENCES
- 1.Buus S, Klump GM, Gleich O, Langemann U. An excitation-pattern model for the starling (Sturnus vulgaris). J Acoust Soc Am. 1995;98:112–124. doi: 10.1121/1.414466. [DOI] [PubMed] [Google Scholar]
- 2.Carr CE. Evolution of the central auditory system in reptiles and birds. In: Webster DB, Fay RR, Popper AN, editors. The evolutionary biology of hearing, Ed 1. Springer; New York: 1992. pp. 511–543. [Google Scholar]
- 3.Carr CE, Boudreau RE. Central projections of auditory nerve fibers in the barn owl. J Comp Neurol. 1991;314:306–318. doi: 10.1002/cne.903140208. [DOI] [PubMed] [Google Scholar]
- 4.Carr CE, Fujita I, Konishi M. Distribution of GABAergic neurons and terminals in the auditory system of the barn owl. J Comp Neurol. 1989;286:190–207. doi: 10.1002/cne.902860205. [DOI] [PubMed] [Google Scholar]
- 5.Choe Y, Magnasco MO, Hudspeth AJ. A model for amplification of hair-bundle motion by cyclical binding of Ca2+ to mechanoelectrical-transduction channels. Proc Natl Acad Sci USA. 1998;95:15321–15326. doi: 10.1073/pnas.95.26.15321. [DOI] [PMC free article] [PubMed] [Google Scholar]
- 6.Cooper NP, Yates GK. Nonlinear input-output functions derived from the responses of guinea-pig cochlear nerve fibres: variations with characteristic frequency. Hear Res. 1994;78:221–234. doi: 10.1016/0378-5955(94)90028-0. [DOI] [PubMed] [Google Scholar]
- 7.Corwin JT, Oberholtzer JC. Fish n' chicks: model recipes for hair-cell regeneration? Neuron. 1997;19:951–954. doi: 10.1016/s0896-6273(00)80386-4. [DOI] [PubMed] [Google Scholar]
- 8.Cotanche DA, Lee KH, Stone JS, Picard DA. Hair cell regeneration in the bird cochlea following noise damage or ototoxic drug damage. Anat Embryol (Berl) 1994;189:1–18. doi: 10.1007/BF00193125. [DOI] [PubMed] [Google Scholar]
- 9.Dallos P. Overview: cochlear neurobiology. In: Dallos P, Popper AN, Fay RR, editors. The cochlea. Springer; New York: 1996. pp. 1–43. [Google Scholar]
- 10.van Dijk P, Manley GA, Gallo L, Pavusa A, Taschenberger G. Statistical properties of spontaneous otoacoustic emissions in one bird and three lizard species. J Acoust Soc Am. 1996;100:2220–2227. [Google Scholar]
- 11.Fettiplace R. Transduction and tuning in auditory hair cells. Semin Neurosci. 1990;2:33–40. [Google Scholar]
- 12.Gleich O. Auditory primary afferents in the starling: correlation of function and morphology. Hear Res. 1989;37:255–267. doi: 10.1016/0378-5955(89)90026-9. [DOI] [PubMed] [Google Scholar]
- 13.Gross NB, Anderson DJ. Single unit responses recorded from the first order neuron of the pigeon auditory system. Brain Res. 1976;101:209–222. doi: 10.1016/0006-8993(76)90264-x. [DOI] [PubMed] [Google Scholar]
- 14.Gummer AW, Smolders JWT, Klinke R. Basilar membrane motion in the pigeon measured with the Mössbauer technique. Hear Res. 1987;29:63–92. doi: 10.1016/0378-5955(87)90206-1. [DOI] [PubMed] [Google Scholar]
- 15.Hill KG, Mo J, Stange G. Excitation and suppression of primary auditory fibres in the pigeon. Hear Res. 1989;39:37–48. doi: 10.1016/0378-5955(89)90080-4. [DOI] [PubMed] [Google Scholar]
- 16.Hudspeth AJ. Mechanical amplification of stimuli by hair cells. Curr Opin Neurobiol. 1997;7:480–486. doi: 10.1016/s0959-4388(97)80026-8. [DOI] [PubMed] [Google Scholar]
- 17.Jackson BS, Relkin EM. A frequency-dependent saturation evident in rate-intensity functions of the chinchilla auditory nerve. Hear Res. 1998;126:75–83. doi: 10.1016/s0378-5955(98)00151-8. [DOI] [PubMed] [Google Scholar]
- 18.Keller CH, Hartung K, Takahashi TT. Head-related transfer functions of the barn owl: measurement and neural responses. Hear Res. 1998;118:13–34. doi: 10.1016/s0378-5955(98)00014-8. [DOI] [PubMed] [Google Scholar]
- 19.Knudsen EI (1981) The hearing of the barn owl. Sci Am 83–93.
- 20.Knudsen EI, Konishi M. Mechanisms of sound localization in the barn owl (Tyto alba). J Comp Physiol [A] 1979;133:13–21. [Google Scholar]
- 21.Knudsen EI, Blasdel GG, Konishi M. Sound localization by the barn owl (Tyto alba) measured with the search coil technique. J Comp Physiol [A] 1979;133:1–11. [Google Scholar]
- 22.Knudsen EI, Esterly SD, du Lac S. Stretched and upside-down maps of auditory space in the optic tectum of blind-reared owls: acoustic basis and behavioral correlates. J Neurosci. 1991;11:1727–1747. doi: 10.1523/JNEUROSCI.11-06-01727.1991. [DOI] [PMC free article] [PubMed] [Google Scholar]
- 23.Köppl C. Otoacoustic emissions as an indicator for active cochlear mechanics: a primitive property of vertebrate auditory organs. In: Manley GA, Klump GM, Köppl C, Fastl H, Oeckinghaus H, editors. Advances in hearing research. World Scientific; Singapore: 1995. pp. 207–218. [Google Scholar]
- 24.Köppl C. Frequency tuning and spontaneous activity in the auditory nerve and cochlear nucleus magnocellularis of the barn owl Tyto alba. J Neurophysiol. 1997a;77:364–377. doi: 10.1152/jn.1997.77.1.364. [DOI] [PubMed] [Google Scholar]
- 25.Köppl C. Phase locking to high frequencies in the auditory nerve and cochlear nucleus magnocellularis of the barn owl, Tyto alba. J Neurosci. 1997b;17:3312–3321. doi: 10.1523/JNEUROSCI.17-09-03312.1997. [DOI] [PMC free article] [PubMed] [Google Scholar]
- 26.Köppl C, Yates GK, Manley GA. The mechanics of the avian cochlea: rate-intensity functions of auditory-nerve fibres in the emu. In: Lewis ER, Long G, Lyon RF, Narins PM, Steele CR, Hecht-Poinar E, editors. Diversity in auditory mechanics. World Scientific; Singapore: 1997. pp. 76–82. [Google Scholar]
- 27.Konishi M. Listening with two ears. Sci Am. 1993a;268:66–73. doi: 10.1038/scientificamerican0493-66. [DOI] [PubMed] [Google Scholar]
- 28.Konishi M. Neuroethology of sound localization in the owl. J Comp Physiol [A] 1993b;173:3–7. [Google Scholar]
- 29.Kros CJ. Physiology of mammalian cochlear hair cells. In: Dallos P, Popper AN, Fay RR, editors. The cochlea. Springer; New York: 1996. pp. 318–385. [Google Scholar]
- 30.Liberman MC. Auditory-nerve response from cats raised in a low-noise chamber. J Acoust Soc Am. 1978;63:442–455. doi: 10.1121/1.381736. [DOI] [PubMed] [Google Scholar]
- 31.Liberman MC, Oliver ME. Morphometry of intracellularly labeled neurons of the auditory nerve: correlations with functional properties. J Comp Neurol. 1984;223:163–176. doi: 10.1002/cne.902230203. [DOI] [PubMed] [Google Scholar]
- 32.Manley GA. The avian hearing organ: a status report. In: Manley GA, Klump GM, Köppl C, Fastl H, Oeckinghaus H, editors. Advances in hearing research. World Scientific; Singapore: 1995. pp. 219–229. [Google Scholar]
- 33.Manley GA, Köppl C. Phylogenetic development of the cochlea and its innervation. Curr Opin Neurobiol. 1998;8:468–474. doi: 10.1016/s0959-4388(98)80033-0. [DOI] [PubMed] [Google Scholar]
- 34.Manley GA, Gleich O, Leppelsack H-J, Oeckinghaus H. Activity patterns of cochlear ganglion neurones in the starling. J Comp Physiol [A] 1985;157:161–181. doi: 10.1007/BF01350025. [DOI] [PubMed] [Google Scholar]
- 35.Manley GA, Köppl C, Konishi M. A neural map of interaural intensity differences in the brain stem of the barn owl. J Neurosci. 1988a;8:2665–2676. doi: 10.1523/JNEUROSCI.08-08-02665.1988. [DOI] [PMC free article] [PubMed] [Google Scholar]
- 36.Manley GA, Yates GK, Köppl C. Auditory peripheral tuning: evidence for a simple resonance phenomenon in the lizard Tiliqua. Hear Res. 1988b;33:181–190. doi: 10.1016/0378-5955(88)90031-7. [DOI] [PubMed] [Google Scholar]
- 37.Manley GA, Gleich O, Kaiser A, Brix J. Functional differentiation of sensory cells in the avian auditory periphery. J Comp Physiol [A] 1989;164:289–296. [Google Scholar]
- 38.Merchan-Perez A, Liberman MC. Ultrastructural differences among afferent synapses on cochlear hair cells: correlations with spontaneous discharge rate. J Comp Neurol. 1996;371:208–221. doi: 10.1002/(SICI)1096-9861(19960722)371:2<208::AID-CNE2>3.0.CO;2-6. [DOI] [PubMed] [Google Scholar]
- 39.Moiseff A. Binaural disparity cues available to the barn owl for sound localization. J Comp Physiol [A] 1989;164:629–636. doi: 10.1007/BF00614505. [DOI] [PubMed] [Google Scholar]
- 40.Müller M, Robertson D. Shapes of rate-versus-level functions of primary auditory nerve fibres: test of the basilar membrane mechanical hypothesis. Hear Res. 1991;57:71–78. doi: 10.1016/0378-5955(91)90076-l. [DOI] [PubMed] [Google Scholar]
- 41.Nobili R, Mammano F, Ashmore J. How well do we understand the cochlea? Trends Neurosci. 1998;21:159–167. doi: 10.1016/s0166-2236(97)01192-2. [DOI] [PubMed] [Google Scholar]
- 42.Patuzzi R. Cochlear micromechanics and macromechanics. In: Dallos P, Popper AN, Fay RR, editors. The cochlea. Springer; New York: 1996. pp. 186–257. [Google Scholar]
- 43.Payne RS. Acoustic location of prey by barn owls (Tyto alba). J Exp Biol. 1971;54:535–573. doi: 10.1242/jeb.54.3.535. [DOI] [PubMed] [Google Scholar]
- 44.Rhode WS, Cooper NP. Nonlinear mechanics in the apical turn of the chinchilla cochlea in vivo. Aud Neurosci. 1996;3:101–121. [Google Scholar]
- 45.Richter C-P, Heynert S, Klinke R. Rate-intensity-functions of pigeon auditory primary afferents. Hear Res. 1995;83:19–25. doi: 10.1016/0378-5955(94)00186-t. [DOI] [PubMed] [Google Scholar]
- 46.Sachs MB, Abbas PJ. Rate versus level functions for auditory-nerve fibres in cats: tone-burst stimuli. J Acoust Soc Am. 1974;56:1835–1847. doi: 10.1121/1.1903521. [DOI] [PubMed] [Google Scholar]
- 47.Sachs MB, Winslow RL, Sokolowski BHA. A computational model for rate-level functions from cat auditory-nerve fibers. Hear Res. 1989;41:61–70. doi: 10.1016/0378-5955(89)90179-2. [DOI] [PubMed] [Google Scholar]
- 48.Smolders JWT, Ding-Pfennigdorff D, Klinke R. A functional map of the pigeon basilar papilla: correlation of the properties of single auditory nerve fibres and their peripheral origin. Hear Res. 1995;92:151–169. doi: 10.1016/0378-5955(95)00214-6. [DOI] [PubMed] [Google Scholar]
- 49.Sullivan WE, Konishi M. Segregation of stimulus phase and intensity coding in the cochlear nucleus of the barn owl. J Neurosci. 1984;4:1787–1799. doi: 10.1523/JNEUROSCI.04-07-01787.1984. [DOI] [PMC free article] [PubMed] [Google Scholar]
- 50.Takahashi T, Moiseff A, Konishi M. Time and intensity cues are processed independently in the auditory system of the owl. J Neurosci. 1984;4:1781–1786. doi: 10.1523/JNEUROSCI.04-07-01781.1984. [DOI] [PMC free article] [PubMed] [Google Scholar]
- 51.Taschenberger G, Manley GA. Spontaneous otoacoustic emissions in the barn owl. Hear Res. 1997;110:61–76. doi: 10.1016/s0378-5955(97)00070-1. [DOI] [PubMed] [Google Scholar]
- 52.Temchin AN. Unusual discharge patterns of single fibers in the pigeon's auditory nerve. J Comp Physiol [A] 1988;163:99–115. doi: 10.1007/BF00612001. [DOI] [PubMed] [Google Scholar]
- 53.Tsuji J, Liberman MC. Intracellular labeling of auditory nerve fibers in guinea pig: central and peripheral projections. J Comp Neurol. 1997;381:188–202. [PubMed] [Google Scholar]
- 54.Warchol ME, Dallos P. Neural coding in the chick cochlear nucleus. J Comp Physiol [A] 1990;166:721–734. doi: 10.1007/BF00240021. [DOI] [PubMed] [Google Scholar]
- 55.Winter IM, Palmer AR. Intensity coding in low-frequency auditory-nerve fibers of the guinea pig. J Acoust Soc Am. 1991;90:1958–1967. doi: 10.1121/1.401675. [DOI] [PubMed] [Google Scholar]
- 56.Winter IM, Robertson D, Yates GK. Diversity of characteristic frequency rate-intensity functions in guinea pig auditory nerve fibres. Hear Res. 1990;45:191–202. doi: 10.1016/0378-5955(90)90120-e. [DOI] [PubMed] [Google Scholar]
- 57.Yates GK. Basilar membrane nonlinearity and its influence on auditory nerve rate-intensity functions. Hear Res. 1990a;50:145–162. doi: 10.1016/0378-5955(90)90041-m. [DOI] [PubMed] [Google Scholar]
- 58.Yates GK. The basilar membrane nonlinear input-output function. In: Dallos P, Geisler CD, Matthews JW, Ruggero MA, Steele CR, editors. The mechanics and biophysics of hearing. Springer; Berlin: 1990b. pp. 106–113. [Google Scholar]
- 59.Yates GK, Winter IM, Robertson D. Basilar membrane nonlinearity determines auditory nerve rate-intensity functions and cochlear dynamic range. Hear Res. 1990;45:203–220. doi: 10.1016/0378-5955(90)90121-5. [DOI] [PubMed] [Google Scholar]


