

Abstract
The Na,K-ATPase is a dominant factor in retinal energy metabolism, and unique combinations of isoforms of its α and β subunits are expressed in different cell types and determine its functional properties. We used isoform-specific antibodies and fluorescence confocal microscopy to determine the expression of Na,K-ATPase α and β subunits in the mouse and rat retina. In the adult retina, α1 was found in Müller and horizontal cells, α2 in some Müller glia, and α3 in photoreceptors and all retinal neurons. β1 was largely restricted to horizontal, amacrine, and ganglion cells; β2 was largely restricted to photoreceptors, bipolar cells, and Müller glia; and β3 was largely restricted to photoreceptors. Photoreceptor inner segments have the highest concentration of Na,K-ATPase in adult retinas. Isoform distribution exhibited marked changes during postnatal development. α3 and β2 were in undifferentiated photoreceptor somas at birth but only later were targeted to inner segments and synaptic terminals. β3, in contrast, was expressed late in photoreceptor differentiation and was immediately targeted to inner segments. A high level of β1 expression in horizontal cells preceded migration, whereas increases in β2 expression in bipolar cells occurred very late, coinciding with synaptogenesis in the inner plexiform layer. Most of the spatial specification of Na,K-ATPase isoform expression was completed before eye opening and the onset of electroretinographic responses on postnatal day 13 (P13), but quantitative increase continued until P22 in parallel with synaptogenesis.
Keywords: Na,K-ATPase; retina; photoreceptor; development; isoforms; immunofluorescence
In the retina the Na,K-ATPase restores Na+ and K+ gradients used by the photoreceptor dark current, synaptic activity, action potentials, and transmitter uptake. It consumes 50% of the metabolic energy (41% of oxygen uptake and 58% of glycolysis) (Ames et al., 1992). The Na,K-ATPase is a heterodimer of two subunits, α (112 kDa) and β (32 kDa) (for review, see Blanco and Mercer, 1998). α is the catalytic unit, but both subunits affect cation affinity. There are three well characterized isoforms of α (α1, α2, and α3) and another found so far only in testis (α4), and three isoforms of β (β1, β2, and β3). In kidney there is also a γ subunit (7.3 kDa), but we have not detected it in Western blots of retinal membranes (our unpublished observations). Immunocytochemistry detects abundant Na,K-ATPase in the photoreceptor inner segments and the outer and inner plexiform (synaptic) layers (Stahl and Baskin, 1984).
The α1, α2, and α3 isoforms have been localized in adult rat retina (McGrail and Sweadner, 1989) and β1 and β2 in adult mouse retina (Weber et al., 1998), but here the distributions of all the subunits were examined with double- and triple-label immunofluorescence to assess the extent of colocalization. In artificial expression systems, α and β isoforms can be interchanged; in the retina the three α and three β isoforms produced six of nine possible αβ combinations in different cell types.
Ascertaining the changes in the Na,K-ATPase isoforms during development and differentiation is important as a basis for understanding how the expression of genetically different subunit isoforms contributes to the fine control of ion transport. Four classes of developmental changes occurred that presumably require very different control mechanisms: cell-specific commitment to particular isoform combinations, downregulation of precursor cell isoforms, subcellular targeting, and upregulation to accommodate the increased demand for ion transport in the active retina. These events occurred on different time schedules in different cell types.
Photoreceptors were examined closely because of their propensity for apoptosis in mice with genetically modified Na,K-ATPase β subunits (Magyar et al., 1994; Molthagen et al., 1996; Weber et al., 1998). Oddly, photoreceptors survive and differentiate for many days in the absence of their principal β subunit (β2), and we expected to find robust early expression of another β subunit that could support cell survival. This was not the case, however. Expression of β1 was not detected, and β3 expression occurred after a delay and rose slowly in postnatal development. The special role of the Na,K-ATPase in photoreceptor activity and survival is discussed.
MATERIALS AND METHODS
Antibodies. Both monoclonal and polyclonal antibodies specific for Na,K-ATPase α and β subunit isoforms were used (Table1). Most of the antibodies are either directed against known sites or have mapped epitopes. Monoclonal antibodies 6F (for α1), McB2 (for α2), and XVI-F9G10 (for α3) all bind within the first 60 residues of the respective α subunits, on the cytoplasmic surface (Arystarkhova and Sweadner, 1996). Monoclonal antibodies BSP-3 (for β1) and 426 (for β2) both bind somewhere in the extracellular domain of β (Gloor et al., 1992), as does IEC 1/48, used for β1 in the rat (Marxer et al., 1989). The epitope for GP-50 antibody against rat β2 is not known. Rabbit polyclonal antibody RNTβ3 is directed against the cytoplasmic N terminus of β3 (Arystarkhova and Sweadner, 1997). For some experiments a polyclonal antibody directed against a large intracellular portion of α3 and preadsorbed to increase its isoform specificity was also used (Shyjan and Levenson, 1989).
Table 1.
Antibodies used for Na,K-ATPase isoform detection in the mouse and rat
| Antibody | Isoform | Host | Monoclonal | Mouse | Rat | Source |
|---|---|---|---|---|---|---|
| 6F | α1 | Mouse | Yes | + | + | DSHB |
| McB2 | α2 | Mouse | Yes | + | + | K. J. Sweadner |
| XVI-F9G10 | α3 | Mouse | Yes | + | + | Affinity BioReagents |
| Poly-α3 | α3 | Rabbit | No | + | R. Levenson | |
| BSP-3 | β1 | Rat | Yes | + | C. Goridis | |
| IEC 1/48 | β1 | Mouse | Yes | + | A. Quaroni | |
| 426 | β2 | Rat | Yes | + | M. Schachner | |
| GP50 | β2 | Mouse | Yes | + | P. W. Beesley | |
| RNTβ3 | β3 | Rabbit | No | + | + | K. J. Sweadner |
References for descriptions of antibody specificity are 6F and XVI-F9G10 (Arystarkhova and Sweadner, 1996), McB2 (Pacholczyk and Sweadner, 1997), poly-α3 (Shyjan and Levenson, 1989), BSP-3 (Liabeuf et al., 1984; Müller-Husmann et al., 1993), IEC 1/48 (Marxer et al., 1989), 426 (Gloor et al., 1990), GP-50 (Beesley et al., 1987), and RNTβ3 (Arystarkhova and Sweadner, 1997). DSHB, Developmental Studies Hybridoma Bank.
Immunocytochemistry. Mice (BALB/c) or rats (CD) were anesthetized to the point of cessation of respiration with ether and then decapitated. The eyes were immediately removed, bisected, and fixed by immersion in 2% paraformaldehyde in a periodate-lysine buffer (McLean and Nakane, 1974) for 2 hr at room temperature with constant gentle agitation. The eyecups were rinsed for 10 min in PBS (0.1m sodium phosphate, 0.15 m NaCl, pH 7.2), and the lenses and any remaining vitreous were removed. The eye cups were placed in 30% sucrose in PBS for 3 hr at 4°C, embedded in TBS Tissue Freezing Medium (Triangle Biomedical Sciences, Durham, NC) in aluminum boats, frozen on liquid nitrogen, and stored at −20°C. Cryostat sections (15 μm) were cut at −20°C and stored at −20°C until use.
Slides were brought to room temperature and a PAP pen (Kiyota International, Elk Grove, IL) was used to draw a hydrophobic ring around the sections. The slides were rinsed in PBS for 10 min and then laid flat in a dark moist box for all subsequent incubations. The sections were covered with 5% normal goat serum (to block nonspecific binding) in PBS with 0.3% Triton X-100 (PBS-Triton) and incubated for 1 hr at room temperature. The blocking solution was removed with an aspirator, primary antisera diluted in PBS–Triton (mouse: 6F, 1:4; McB2, 1:4; XVI-F9G10, 1:500; BSP-3, 1:4; 426, 1:4; polyclonal α3, 1:250; and RNTβ3, 1:2500) (rat: IEC 1/48, 1:3; GP-50, 1:3; and RNTβ3, 1:2500) were applied to the sections, and the slides were incubated overnight at 4°C. They were rinsed (three times for 10 min each time) in PBS and then incubated in the appropriate fluorescent secondary antibody diluted in PBS–Triton, rhodamine-conjugated goat anti-mouse IgG (1:500; Accurate, Westbury, NY) or Cy5-conjugated goat anti-mouse (1:200; Jackson Laboratories, Bar Harbor, ME), FITC-conjugated goat anti-rabbit IgG (1:1000; Accurate), or TRITC-conjugated goat anti-rat IgG + IgM (1:500; Sigma, St. Louis, MO). The slides were rinsed in PBS as before and coverslipped with Vectashield fluorescence mounting medium (Vector Laboratories, Burlingame, CA). The sections were observed, and electronic images were collected using a Leica DMRB fluorescence microscope equipped with a Bio-Rad MRC 1024 Laser Sharp scanning laser confocal system (version 2.1A).
RESULTS
Immunocytochemistry with isoform-specific antibodies
Figure 1 summarizes the staining patterns for all six Na,K-ATPase subunit isoforms in the adult mouse retina. The use of mouse-, rat-, and rabbit-derived antibodies made it possible to perform triple-antibody staining on the same sections. The pigment epithelium (seen at the top of each section; asterisks) stained for α1 and β1 and no other subunit isoform. Photoreceptor rod inner segments (IS), the brightest structures in the retina, stained for α3, β2, and β3. In contrast, outer segments (OS) were completely unstained with all antibodies. A band near the base of the photoreceptor inner segments stained for α1, but by double-labeling it was clear that this was distinct from the inner segments and represented the outer limiting membrane (OLM) formed by Müller cells linked by tight junctions, plus Müller cell processes extending partway up between the inner segments (Olney, 1968). Stain for β3 also showed a concentration of stain near the base of the inner segment, in addition to staining the full length of the inner segment. In double-labeled sections, however, β3 stain was clearly different from α1 stain (Fig.2A,B). Figure 2A–D shows the different distributions of inner segment stain at higher magnification; where β3 appeared to be concentrated at the base of the inner segments, β2 appeared to be slightly concentrated at their tips, whereas α3 distribution was uniform. Photoreceptor cell somas in the outer nuclear layer (ONL) and their presumptive terminals in the outer plexiform layer (OPL) stained with the α3, β2, and β3 antibodies, although not as intensely as in the inner segments (Fig. 1). The OPL stained most brightly for α1 and β1 contributed by horizontal cells located at the extreme outer edge of the inner nuclear layer (INL), although all subunit isoforms were present. The INL showed clear division into zones: the outer zone contained bipolar cells and stained for α3 and β2, whereas the inner zone contained amacrine cells and stained for α3 and β1. The inner plexiform layer (IPL) stained for α1, α3, β1, and β2, with visible banding of α1, β1, and β2 reflecting the stratification of processes of the stained cells. Ganglion cell somas stained most brightly for β1, whereas bundles of axons stained for α3 and β1.
Fig. 1.
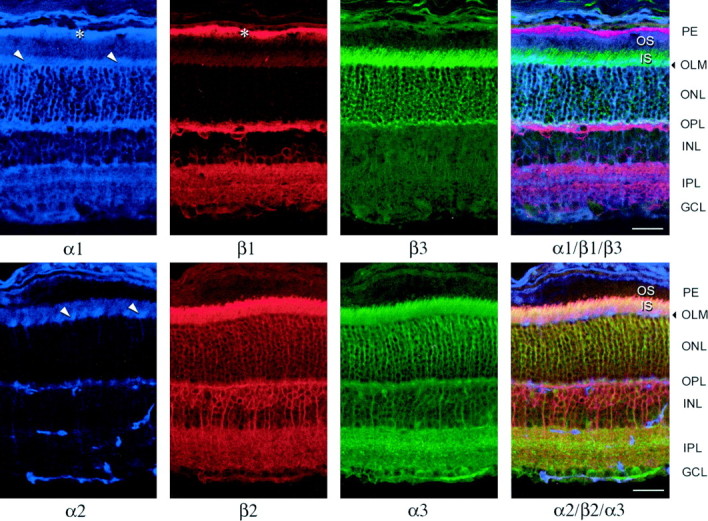
Confocal fluorescent micrographs of adult mouse retina sections triple-labeled with α1, β1, and β3 (top row) or α2, β2, and α3(bottom row) isoform-specific primary antibodies and Cy5-conjugated (blue, anti-mouse), TRITC-conjugated (red, anti-rat), or FITC-conjugated (green, anti-rabbit) secondary antibodies. The images on the right side include all three color channels. Arrowheads and asterisksindicate Müller cell endfeet in the region of theOLM and label in the retinal pigment epithelium, respectively. Scale bar, 50 μm.
Fig. 2.

High-magnification images of adult mouse retinas showing detail of label in the photoreceptor inner segments (A–D) and in the region of the OPL (E–G) for various subunit isoforms.A + B, C +D, and E + F are double-labeled. Arrowheads in F indicate β3 label in photoreceptor terminals. Scale bar, 10 μm.
Stain for α2 was extremely light in the retina, and background staining of blood vessels by the anti-mouse secondary antibody was very apparent (Fig. 1). This nonspecific staining of blood vessels was equally evident in sections stained with the anti-mouse secondary antibody alone (data not shown) and was probably caused by interaction with circulating mouse immunoglobins in blood vessels. It is likely that blood vessels were similarly labeled in the α1- and α3-stained retinas, where mouse immunoglobins were used, but the α1- and α3-specific stain was much more intense than the nonspecific stain and thus masked the staining of blood vessels. Retinal α2 stain was irregular and characterized by a largely vertical pattern with some lateral processes typical of Müller glia. The amount of α2 label increased from central to peripheral regions of the adult retina (Fig. 3A–C). In the central retina (Fig. 3A), there were occasional labeled Müller cell processes in the region of the OLM (arrow). In the more lateral regions (Fig. 3B), the number of stained Müller cells increased, whereas distance between labeled cells decreased. In the extreme periphery (Fig. 3C), the labeled cells formed a completely labeled OLM without any breaks (arrow). Interestingly, the nonpigmented ciliary epithelium was intensely labeled for α2 as reported for other species (Ghosh et al., 1990), much more so than the retina. None of the other Na,K-ATPase subunit isoforms showed an obvious central-to-peripheral gradient of expression in adult retinas.
Fig. 3.

Collage of confocal micrographs of α2 label in an adult mouse retina section. Labeled Müller cell endfeet in the region of the OLM (arrows) increase in number and stain intensity from central (A) to more lateral (B) retinal regions, to a maximum in peripheral retina (C). The ciliary epithelium (far right in C) was intensely labeled. Scale bar, 50 μm.
Many of these observations confirm previous studies of the distribution of the α isoforms in adult rat retina (McGrail and Sweadner, 1986,1989) or the distribution of β1 and β2 in adult mouse retina (Weber et al., 1998). The colocalization of pairs of α and β isoforms is shown here for the first time, except for the presence of α3 and β2 in photoreceptors (Schneider and Kraig, 1990; Schneider et al., 1991). The distribution of β3 in the retina has not been reported before. β3 expression elsewhere in the CNS is relatively low (Arystarkhova and Sweadner, 1997; Peng et al., 1997), but there was good reason to expect it to be present because it was cloned from mouse retina (Besirli et al., 1997); however, its presence in photoreceptors was both unexpected and interesting, for reasons to be discussed below. What was most notable about the staining patterns for β1 and β3 was that they had complementary distributions: β1 in the inner retina and β3 in the outer retina. When stained simultaneously, the distributions of β3 and β1 stain even in the OPL had very little overlap. Figure 2E–G shows the spatial separation of stain for β1 and β3 at higher magnification. The appearance is consistent with the presence of β3 in photoreceptor terminals and β1 in horizontal cell processes.
The survey of isoform expression in the adult retina indicates that there was no simple correlation of α subunit isoform with β subunit isoform. At least six isoform combinations can be inferred to be present as a major heterodimer in at least one kind of cell: α1β1, α1β2, α2β2, α3β1, α3β2, and α3β3 (Table2). We also observed that adult rat retina had the same distribution of α and β subunits as the mouse retina, using different monoclonal antibodies for β1 and β2 (Fig.4). The only notable differences were a relatively greater intensity of β2 stain in photoreceptor inner segments in the rat and a more prominent α2 stain of a subpopulation of amacrine cells.
Table 2.
Summary of Na,K-ATPase subunit isoform expression in mouse retinal cell types
| α1 | α2 | α3 | β1 | β2 | β3 | |
|---|---|---|---|---|---|---|
| Photoreceptors | ● | ● | ● | |||
| Horizontal cells | ● | ● | ● | |||
| Bipolar cells | ● | ● | ||||
| Amacrine cells | ● | ● | ||||
| Ganglion cells | ● | ● | ● | ● | ||
| Müller cells | ● | ● | ? | |||
| Pigment epithelium | ● | ● |
Expression of β2 in Müller cells is uncertain because of the high level of stain in other cells.
Fig. 4.
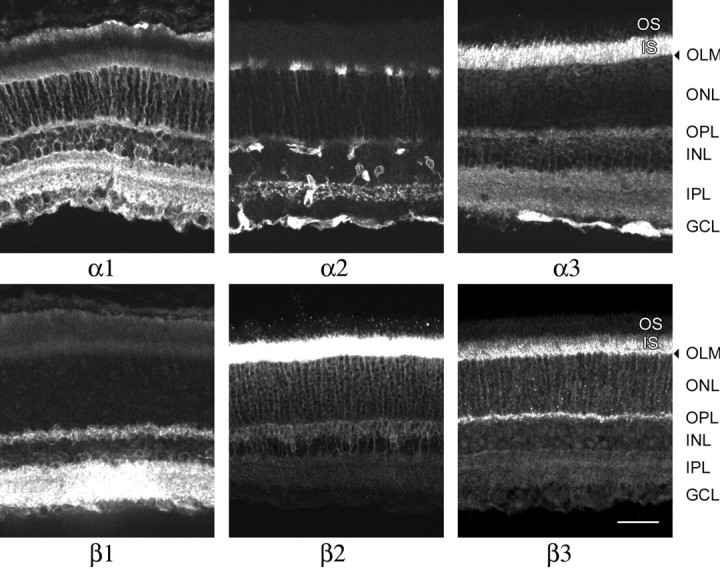
Adult rat retina sections labeled with isoform-specific antibodies. All of the antibodies were mouse monoclonals with the exception of the rabbit antibody against β3 (Table 1). Scale bar, 50 μm.
Developmental changes in Na,K-ATPase isoform expression
Although cell birth (the cessation of division) and commitment (the irreversible choice of cell fate) occur prenatally for many cells in the rodent retina, most of the phenotypic differentiation occurs postnatally during the 2 week delay before eye opening. Embryonic retinas begin as a pseudostratified columnar epithelium of ventricular cells, and as cells become postmitotic, they migrate inward to their final position (for review, see Olney, 1968; Weidman and Kuwabara, 1968; Raedler and Sievers, 1975). Well before birth, ganglion cells migrate to the inner margin of the retina and send axons to the brain. At about the same time, amacrine cells migrate inward, and processes of ganglion and amacrine cells arborize horizontally, forming the inner plexiform (synaptic) layer. At the time of birth, the mouse retina consists of ganglion cell layer (GCL), IPL, amacrine cells in what will become the inner half of the INL, and a thick neuroblastic layer (NBL), the outer third of which contains opsin-containing but poorly differentiated rods and cones. Horizontal cells migrate into the central neuroblastic layer and extend processes that form the OPL by the end of the first postnatal week. Photoreceptor outer segments appear on postnatal day 5 (P5) and become noticeable as a layer by P10. At the time the eyes open on P13 or P14, cell multiplication, developmentally scheduled apoptosis, and differentiation are complete, and the retina has all of the cellular and synaptic layers of the adult. Synaptogenesis then continues for 1–2 weeks.
Retinas were taken from mice ranging in age from 2 to 22 d and examined for the distribution of each Na,K-ATPase subunit isoform. Figures5-10 present the data one isoform at a time so that progressive changes either in isoform level or in cell position or morphology can be followed. In all of the Figures, photoreceptors are at the top and ganglion cells at the bottom. In many pictures the pigment epithelium is visible at the top, but frequently it separated from the retina. α1 stain was found everywhere at the earliest age but greatly intensified with development, and the pattern became dominated by Müller and horizontal cells. The stain of blood vessels was artifactual. The developing retina had little or no α2 stain, but eventually a subpopulation of Müller glia expressed it. α3 stain was present throughout development, but the pattern became dominated by subcellular targeting to inner segments and to neuronal processes. The β1 isoform had a more distinctive distribution at the earliest age than any of the other isoforms, with well defined stain in horizontal cells, amacrine cells, and ganglion cells and no detectable stain in the neuroblast cells. In contrast, β2 stain was unusually prominent at birth in the cells that will become photoreceptors, but its expression in the inner retina increased late in development. β3 stain was expressed relatively late and was confined to photoreceptors.
Fig. 6.
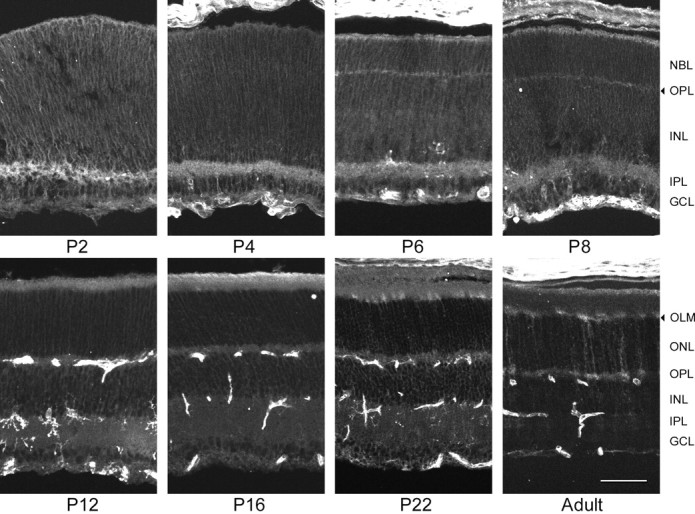
α2 expression during mouse postnatal retinal development. No α2-specific stain was seen until P22, when lightly stained Müller cell processes were seen in theONL, terminating at the OLM. Because the labeled processes in the OLM did not appear to be in contact with each other, α2 stain was confined to a subpopulation of Müller cells, as reported earlier for the rat (McGrail and Sweadner, 1986). The number of labeled Müller cells was higher in the peripheral retina than in more central regions, as shown above for the adult. The staining pattern was unchanged in the adult retina, although the intensity of α2 stain was greater. Scale bar, 50 μm.
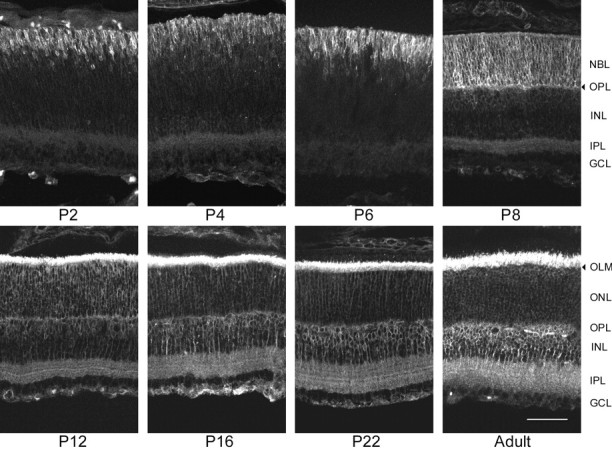
Fig. 5.
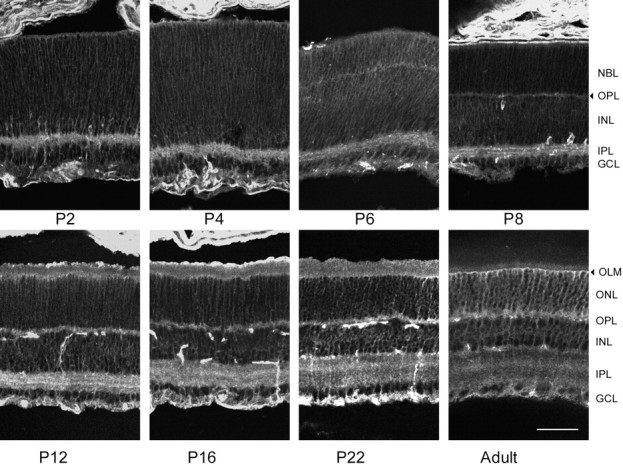
α1 expression during mouse postnatal retinal development. In the P2 retina, the IPLand the outer and inner margins of the retina were labeled with moderate strength, and the entire retina was lightly labeled. In the outer retina, the label appeared to be on radially oriented fibers of the neuroblasts, but lightly ring-stained cells were seen near theIPL and in the GCL. The pattern of stain did not change noticeably until P8, when the lightly stained OPL became evident. On P10–P12, numerous labeled fibers were seen to span the retina, from theOLM to the ILM, and ring-stained cells were seen in the central and outer portions of the INL(presumably Müller cells and horizontal cells, respectively) and in the GCL. Artifactually stained blood vessels also appeared in this period. Although the IPL was lightly labeled, a pair of brighter-staining bands was seen in its center atP8–P12, resembling the ramifications of the starburst amacrine cells, but at P16 and beyond only a single, more diffuse band was seen. From P12 toP22 there was an increase in the intensity stain at each locus: labeled fibers crossing the retina, bands in theIPL, and the OLM. In the adult retina, α1 stain was seen in nearly all retinal layers. At theOLM, delicate Müller cell processes extended from the outer surface of the brightly labeled OLM, and Müller cell fibers passing through the GCL formed bands of stain at the ILM. Ring-stained horizontal cells were seen in the outer portion of the INL, and their labeled processes extended horizontally in the OPL. Ring-stained ganglion cells and labeled axons were seen in theGCL. The OPL was brightly labeled, whereas the IPL had a more punctate appearance, with a layer of bright stain in the central portion of the IPL. Scale bar, 50 μm.
More detail on the changes in isoform-specific expression patterns can be found in the Figure legends. Here we describe Na,K-ATPase isoform expression one cell type at a time to integrate the contributions of multiple isoforms in each cell.
Photoreceptors
At birth in the rat eye, expression of opsin can already be detected in committed photoreceptor cell bodies in the outer third of the neuroblastic layer (Hicks and Barnstable, 1987). Like opsin, we found that the Na,K-ATPase β2 subunit was present in these cells in the mouse, and in fact photoreceptors were the only cells in the retina to express β2 at a level detectable by immunofluorescence from P2 to P6 (see Fig. 9). The cells appeared ring-stained, similar to the distribution of opsin. No β1 or β3 was detected (see Figs. 8, 10). Both α1 and α3 were expressed uniformly in the neuroblastic layer with a pattern that suggested stain of processes that extend across the layer and thus including the neuroblasts and future bipolar cells (Fig.5, 7). We infer that the nascent photoreceptors expressed α1, α3, and β2 at birth, whereas the undifferentiated neuroblasts expressed α1, α3, and no β subunit that we could detect above background. It remains possible that there is an undiscovered β subunit isoform.
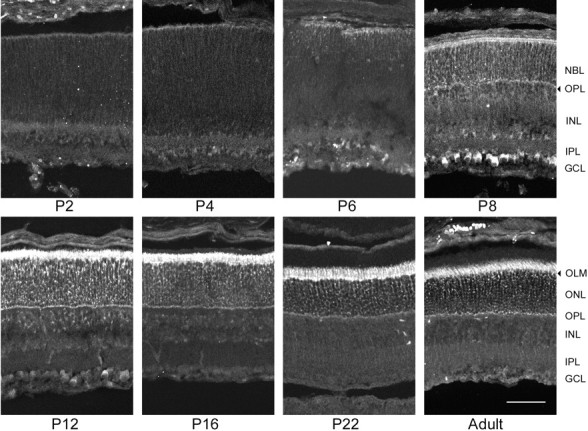
Fig. 9.
β2 expression during mouse postnatal retinal development. On P2, the brightest β2 stain was seen in ring-stained future photoreceptor cells with inward-oriented processes in the outer third of the retina. The IPL andGCL were also lightly labeled. Although the general pattern of staining did not change over the following week, the amount of stain and number of labeled cells increased. On P8, the OPL became evident along the inner margin of the bright ring-stained cells in the outer retina. Lightly ring-stained cells were also seen for the first time on P8 throughout the INL. On P12, several layers of bright staining were seen in the widening IPL. OnP16–P22, the intensity of β2 stain in theONL decreased, although the intensity of stain in the photoreceptor inner segments increased. In addition, there was an increase in the intensity of β2 label in the IPL, in ring-stained bipolar cells in the outer zone of the INL, and in ganglion cell axons in the NFL. In the adult retina, the brightest stain was seen in the photoreceptor inner segments. Photoreceptor cell bodies in the ONL were lightly ring-stained. β2 stain was also seen in ring-stained bipolar cells in the central INL and in their labeled processes extending inward and outward to the brightly labeled plexiform layers. The bright bands of β2 stain seen in the IPL onP12–P22 were not evident in the adult retina. Ganglion cell axon bundles in the NFL were brightly stained (not visible in the picture shown), although their somas in theGCL were not labeled. This is consistent with the presence of β2 mRNA in astrocytes in the optic nerve (Magyar et al., 1994). Scale bar, 50 μm.
Fig. 8.
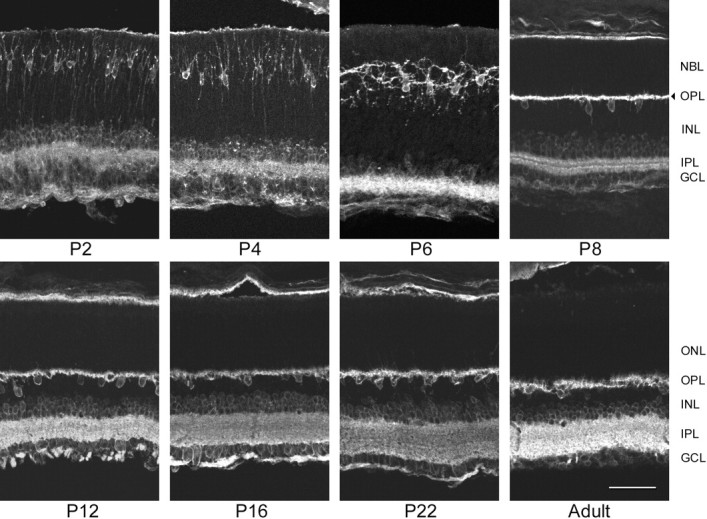
β1 expression during mouse postnatal retinal development. On P2, β1 stain was located in theGCL, in the IPL, and in migrating horizontal cells in the outer portion of the NBL. Delicate brightly labeled horizontal cell processes extended from ring-stained somas inward to the central portion of theNBL, outward to the outer margin of the retina, and horizontally. Additionally, labeled processes extended inward from ring-stained amacrine cells in the inner NBL and outward from ring-stained ganglion cells in the GCL into theIPL. On days P4–P6, the number of brightly labeled horizontal cells in the outer third of theNBL increased, as well as the intensity of stain. These cells migrated inward, and their vertically oriented processes became shorter until, on P8, they formed a brightly labeledOPL in the central portion of the formerNBL. Their cell bodies were located in the outer portion of the INL adjacent to the newly formedOPL. The intensity of β1 stain in amacrine and ganglion cells, as well as in the INL, increased during the third postnatal week. In the adult retina, the most intense β1 stain was in the plexiform layers. Horizontal and amacrine cells in the outer and inner margins of the INL, respectively, and ganglion cells in the GCL were also clearly ring-stained. However, the OLM, photoreceptor inner and outer segments, ONL, and the inner portion of theINL were all devoid of stain. β1 stain was not seen in photoreceptors at any age; it was unambiguously absent from theONL from P8 on when the horizontal cells had moved out. Scale bar, 50 μm.
Fig. 10.
β3 expression during mouse postnatal retinal development. Although the P2 retina was unstained by the β3 antiserum, very lightly stained cells were seen on the outer margin of P4 retinas. The intensity of stain and number of labeled cells increased on the outer margin and onP6, and very light label was seen in the outer third of the NBL. On P8, although it was only very lightly labeled, the IPL was evident as a boundary between the unlabeled INL and the light label in theONL. The brightest label on the outer margin of the retina, corresponding to photoreceptor inner segments, increased atP10–P15, whereas the label in the ONLremained light and somewhat punctate. β3 stain in the adult retina was limited to the outer retina, from the outer margin of theOPL to the tips of the photoreceptor inner segments. In contrast to the β1 stain described above, the inner portion of the retina, from the OPL to the ILM, was completely devoid of β3 stain. With the β3 antiserum, cytoplasmically labeled cells were seen transiently in the inner retina in the GCL. This stain peaked on P10, and then decreased by P16. Because it did not resemble the plasma membrane-associated stain expected of the Na,K-ATPase, it may represent incidental cross-reactivity with another protein. Scale bar, 50 μm.
Fig. 7.
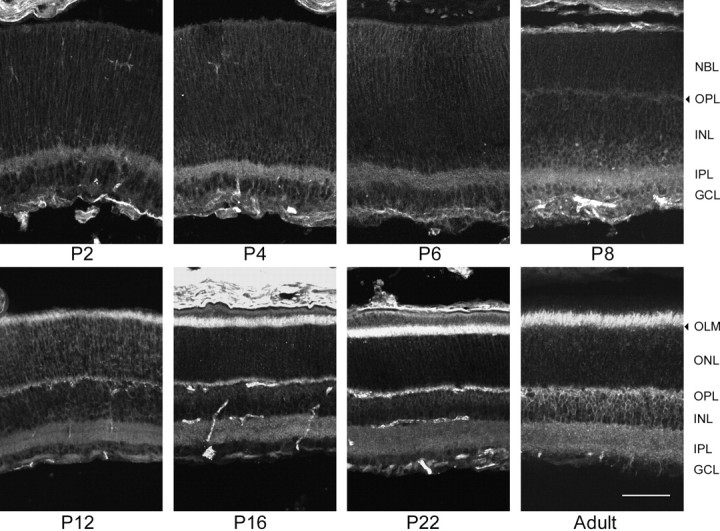
α3 expression during mouse postnatal retinal development. In the P2 retina, the brightest α3 stain was seen in the IPL and on the outer margin of the retina, although the entire retina was lightly labeled. As seen in α1-stained retinas, the α3 label appeared to be on radially oriented fibers in the outer retina, but there were numerous ring-stained amacrine cells and ganglion cells in the inner retina. The general appearance of the stain did not change until P8, when the OPL could just be detected, in contrast to its clear stain by other antibodies. At this time, the brightest stain was in the IPL and at photoreceptor cell bodies. During the second and third postnatal weeks, the α3 stain became less intense in the plexiform layers and more intense in photoreceptor inner segments. Additionally, lightly ring-stained amacrine and bipolar cells became apparent in the third postnatal week in the inner and outer zones of the INL, respectively. In the adult retina, α3 stain was seen in the photoreceptor cell inner segments. Labeled fibers from ring-stained presumptive bipolar cells in the outer zone of theINL extended to the OPL andIPL. Occasionally, ring-stained amacrine cells were seen in the inner INL with labeled processes in theIPL. The plexiform layers were also lightly labeled. Lightly ring-stained ganglion cells and their labeled axons were seen in the GCL. Scale bar, 50 μm.
Even before birth, there is an apical enlargement of neuroblastic cells at the outer margin of the retina that extends beyond the outer limiting membrane and contains accumulations of mitochondria, seen with electron microscopy (Weidman and Kuwabara, 1968; Raedler and Sievers, 1975). This resembles the future inner segment enough so that it has occasionally been described as a primitive inner segment (Olney, 1968), but in fact ventricular epithelial cells elsewhere in the developing nervous system display the same structure, and its relationship to inner segment is probably evolutionary rather than functional. The same surface expansions are rich in lectin-binding components at P2–P4 (Blanks and Johnson, 1983). When stained for Na,K-ATPase subunits, only α1 and β1 showed any concentration at the outer surface (Figs. 5,8). Because the retinal pigment epithelium expressed α1 and β1 and sometimes left bits of tissue adhering to the surface of the retina when it was pulled away, and because β2 in photoreceptors was pointedly not concentrated in the apical stain (Fig. 9), it is likely that the α1 and β1 stain originated in pigment epithelium rather than the photoreceptors. Thus although there are accumulations of mitochondria in the apical expansions that could provide the ATP for the Na,K-ATPase, it appears that enrichment in the enzyme occurs at a later stage of photoreceptor differentiation.
Photoreceptor outer segments first appear in electron microscope images of mouse and rat retina at P5 (Olney, 1968; Weidman and Kuwabara, 1968), and rhodopsin (opsin with chromophore) is first detected at the same time (Bonting et al., 1961). By P6 a few inner segments look well developed by electron microscopy, and by P10 they demonstrate their mature size and shape (Weidman and Kuwabara, 1968; He et al., 1998). By P4–P6 we observed the first faint stain of inner segments for β3, which was visible because the antibody stained no other structure (Fig.10). Stain for β2 became visible above the background of photoreceptor soma stain only on P8 (Fig. 9). Interestingly, α3 stain was not clearly concentrated in inner segments until after P8 (P12 was the next day examined) (Fig. 7). Whether this indicates that targeting of unassembled Na,K-ATPase β subunits precedes targeting of the α subunit in this structure merits further investigation.
Cone photoreceptors begin making synapses with horizontal cells very early (P3), and rod photoreceptor synapses with horizontal cells and bipolar cells are well established by P10 (Olney, 1968; Rich et al., 1996). The expression of α3 in photoreceptor terminals in the OPL could not be distinguished from expression of α3 in horizontal cells by light microscopy, but expression of β2 and β3 there was clearly temporally distinct. β2 stain of the OPL was obvious at P8, whereas β3 stain was barely detectable at P12 and not really strong until P22 (Figs. 9, 10). This is interesting in view of the mechanisms for subcellular targeting of these closely related proteins. From P8 to P12, β2 shows a distribution balanced between inner segments and photoreceptor terminals, whereas β3 was preponderantly routed to inner segments. This may have a cellular basis, in that photoreceptor soma staining for β2 was uniform across the thickness of the outer nuclear layer, whereas β3-staining somas were concentrated in the outer half until later in development. We cannot be sure that β2 and β3 were expressed in the same cells, but for both isoforms the number of stained cells was too high to represent cones, which are only 3% of total photoreceptors (Rich et al., 1996).
At P2, α1 was present in cells in the outer third of the neuroblastic layer, but it diminished with time. By P12 the remaining α1 stain appeared to be in Müller glia, implying that it is downregulated during photoreceptor differentiation (Fig. 5). For α3, β2, and β3, the proportion of stain that appeared in somas relative to inner segments declined between P12 and P17 (Figs. 7, 9, 10). This could be attributable to reduced targeting to cell bodies or to enhanced stability of the fraction in the inner segment.
Müller glia
Trans-epithelial ventricular cells phenotypically differentiate to Müller cells between P7 and P10. Müller cells can be identified by electron microscopy first at P7 (Raedler and Sievers, 1975), and their lateral processes expand by P10 (Weidman and Kuwabara, 1968). A monoclonal antibody (RT10F7) that appears to stain the entire Müller cell stains all ventricular cells at P1 but shows more selective stain at P4 and a nearly adult-like Müller cell by P8 (Yamaskai et al., 1998). P8 is also the age when Müller cell amino acid metabolic pathways are expressed: a reduction of glutamate immunoreactivity and the appearance of glutamine immunoreactivity and GABA uptake (Fletcher and Kalloniatis, 1997). None of the Na,K-ATPase subunit antibodies were observed to stain P8 Müller cells with the same pattern as the RT10F7 antibody, but stain for α1 was apparent by P12 and for α2 by P22. Because β2 was the only known β subunit isoform that spanned the retina, it was the only candidate for expression in Müller glia, although such stain was not obvious above the background of bright β2 stain of neural cells. Because Na,K-ATPase stain was not prominent when Müller cells first display differentiated characteristics, it was apparently upregulated later when there is increased demand for ion transport secondary to the dark current and synaptic activity.
Horizontal cells
Horizontal cells have a unique behavior in the retina in that they show significant differentiated phenotype before migration. These large-diameter cell bodies have already extended processes vertically and laterally when they begin migration between P1 and P8 (Olney, 1968;Weidman and Kuwabara, 1968; Raedler and Sievers, 1975). They are similarly distinctive in that they display bright stain for the Na,K-ATPase β1 subunit as early as P2 and are the only cell type identifiable with this isoform in the outer retina (Fig. 8). Stain for α3 was also visible in early migrating horizontal cells, brighter than the background stain of neuroblastic cells and photoreceptors (Fig. 7). Stain for α1 was not detectable above the background of other cells during early postnatal development but could be seen in the adult, and dissociated horizontal cells from adult rat retina were seen to stain for both α1 and α3 (McGrail and Sweadner, 1986). The upregulation of α1 may be delayed until quite late in synaptogenesis (P17). Horizontal cells receive synapses from photoreceptor cells early in retinal development but make synapses on bipolar cells considerably later (Olney, 1968), and it is conceivable that the kinetic requirements for ion transport change with this change in cell function.
Bipolar cells
Bipolar cells are the last neuron to differentiate in the retina and the most crucial for creating the through-pathway for visual signals. Although their birthdates peak at P3 (Young, 1985), by electron microscopy their cell bodies still resemble undifferentiated neuroblastic cells at P10 (Raedler and Sievers, 1975). They are the last cells, up to P9, to be stained for MASH-1, a helix-loop-helix DNA-binding transcription factor that marks neural progenitor cells (Jasoni and Reh, 1996). Stain of these cells for Na,K-ATPase α1, α3, and β2 appeared first at P12, and the staining gradually intensified until adulthood (Figs. 5, 7, 9). The specification of Na,K-ATPase subunits at P12 coincides with the appearance of two other bipolar cell markers, a monoclonal antibody epitope Ret-B2 (Barnstable et al., 1983) and neuron-specific enolase (Rich et al., 1996). Bipolar cell terminal differentiation in the IPL occurs from P11 to P18, although they received synapses from rods in the OPL from P6 to P10 (Olney, 1968). It is this later period of synaptogenesis that correlates with the largest increase in Na,K-ATPase expression.
Amacrine cells and ganglion cells
Amacrine and ganglion cells are among the first cells to be specified in the retina, and already at birth they expressed α3 and β1, and to a lesser extent α1 and β2, and showed stain for all of these subunits in the primitive inner plexiform layer (Figs. 5, 7-9). By adulthood, α1 and β2 stain were reduced, but α1 persisted as a minor component, which can be shown to be axonally transported with α3 when retinas are labeled with radioactive tracer (Specht and Sweadner, 1984). A major upregulation occurred in the inner plexiform layer late in retinal development, corresponding with the maturation of synaptic structure. A caveat is that amacrine cells as a class are quite heterogeneous in phenotype, and although no subset of them stood out as different, a closer look could reveal more cellular detail.
Pigment epithelium
Although the pigment epithelium was frequently inadvertently removed from the neural retina during tissue preparation, it was almost always visible somewhere in the section. α1 and β1 were the predominant isoforms expressed at all ages. The literature is not entirely consistent. It has been reported that α1 and β1 mRNAs were detected (Gundersen et al., 1991; Ruiz et al., 1995) and that α2 and α3 mRNAs were not detected in pigment epithelium (Gundersen et al., 1991; Ruiz et al., 1996); this was confirmed here at the protein level with isoform-specific antibodies. We did not detect the β2 subunit, however, which has been reported in human pigment epithelium-derived cell preparations both as cDNA isolated by RT-PCR and in immunoblots of microsomes (Ruiz et al., 1996). Unless β2 is localized in human pigment epithelium in situ, it is possible that its apparent presence in isolated cells was caused by contaminating photoreceptor material, which has abundant β2 mRNA and protein.
DISCUSSION
Predifferentiation and postdifferentiation patterns of Na,K-ATPase isoform expression
It is notable that in some cell types, elevated levels of particular Na,K-ATPase subunit isoforms (α3 with β2 in photoreceptors or α3 with β1 in horizontal cells) preceded significant other phenotypic differentiation. In most other cases, however, detectable expression coincided with the adoption of differentiated characteristics, and upregulation corresponded with increases in retinal function. The electroretinogram, as a measure of evocable light response, is first detected at P13 in the rat (Weidman and Kuwabara, 1968) and increases in magnitude approximately 20-fold over the next 2 weeks (Bonting et al., 1961). Over the same time period the rates of glycolysis and oxygen consumption go up 2.5-fold (Graymore, 1959, 1960). This roughly coincides in time with the largest increase in the total amount of each Na,K-ATPase isoform. It remains to be determined by experiment whether the increase in sodium pump expression is a consequence of the development of the dark current or whether it is determined by a genetic program that orchestrates all of the late events of retinal maturation. When investigating the genetic control of Na,K-ATPase expression, it is to be expected that there will be cell-type specificity in whether any given subunit is among the earliest genes to be turned on during cell specification. Some genes may be controlled instead by factors that relate to the demand for ion transport.
Subcellular targeting
The extent to which different Na,K-ATPase isoforms were targeted subcellularly varied greatly from cell to cell. α3 was obvious in cell somas in photoreceptors and ganglion cells early in development, but distribution in somas later diminished and routing to inner segments and photoreceptor terminals, or to ganglion cell axons, predominated. β2 expression in somas of photoreceptors similarly occurred very early but was diminished with targeting to inner segments. On the other hand, somal expression of β1 in horizontal cells, amacrine cells, and ganglion cells and β2 expression in bipolar cells persisted from its first appearance until adulthood. β3 expression in photoreceptor somas was uniquely minimal from the onset of its appearance. Differences in intracellular routing may fine-tune the shape and speed of ion gradient fluctuations.
The photoreceptor and its sensitivity to Na,K-ATPase loss
β2 was initially thought to be an adhesion protein important for CNS development (Gloor et al., 1990). Magyar et al. (1994) generated β2 knockout mice that initially developed normally, but in the third postnatal week the mice exhibited motor incoordination. They died on P17 or P18 with grossly vacuolated astrocytes (which normally express β2) in the brainstem, suggesting that the primary cause of pathology was a defect in Na,K-ATPase activity. Examination of the retinas revealed that photoreceptors developed normally during the first postnatal week, but the rate of apoptotic photoreceptor cell death increased above levels seen in wild-type mice during the second and third postnatal weeks (Molthagen et al., 1996). Because retinal photoreceptors were thought to express β2 and not β1 (Schneider et al., 1991; Magyar et al., 1994), it was unclear why photoreceptors developed normally in the first postnatal week in β2-deficient mice, apparently without a β subunit and thus without a functional Na,K-ATPase. In a subsequent study, Weber et al. (1998) generated mice with β1 cDNA placed into the β2 gene under the control of the β2 regulatory elements, and these animals survived into adulthood. Their photoreceptors expressed the β1 subunit. However, apoptosis in photoreceptors continued slowly with age in these β1 “knock-in” mice, resulting eventually in a severe visual deficit.
Weber et al. (1998) hypothesized the early expression and subsequent downregulation of β1 in photoreceptors during the first 2 postnatal weeks to explain how the photoreceptors survived as long as they did. We examined isoform-specific antibody stain in the developing retina but found that β1 stain in the outer portion of the NBL was in migrating horizontal cells. It is likely that β1 in situhybridization signal in the outer NBL during the first postnatal week that was thought to be in photoreceptors (Weber et al., 1998) was actually in horizontal cells, obscured because of the low resolution of the method. At the time of the formation of the OPL on P8, all β1 antibody stain was confined to the inner retina. Furthermore, we showed that photoreceptors in normal mice coexpressed β2 and β3 from P4 to adulthood. Although the level is evidently not sufficient to replace β2, it may have a protective effect over what would happen without it. The fact that the β2 null photoreceptor cells manage to survive and form outer and inner segments between the end of the cell commitment phase, when β2 predominates, and the beginning of the third postnatal week, suggests that they retain enough Na,K-ATPase derived from the progenitor cell, and/or express enough β3, to survive and differentiate until the dark current and light-evoked responses begin and put great metabolic demand on the cells (Graymore, 1959; Graymore, 1960).
Because β2 was first cloned as an adhesion protein and there is some evidence for its mediation of cell–cell interactions (for review, seeMagyar et al., 1994), the question arises whether it could play a role in cell adhesion and histogenesis. Its only early expression in the mouse retina, however, was in photoreceptors that have already taken up position scleral to the still-proliferating progenitor cells (Hicks and Barnstable, 1987; Jasoni and Reh, 1996). Notably, it had relatively low expression in the neuroblastic cells that play the role of scaffold for cell migration in early neuronal development. If it was expressed in Müller glia, that expression arose too late to have a role in cell migration. Its expression in bipolar cells occurred long after histogenesis and appeared to reflect the increased need for ion transport consequent to synaptogenesis. It is unlikely that β2 has a role in the self-association of photoreceptor cell bodies in the most scleral part of the neuroblastic layer, because the cellular organization of the retina in the β2 null mouse is normal up until P13 (Molthagen et al., 1996). Investigation of the retina thus supports a role for β2 only in Na,K-ATPase activity.
Ion affinities of the Na,K-ATPase isoforms
Numerous studies have now confirmed that Na,K-ATPase subunit isoform composition has effects on the affinities of the enzyme for Na+, K+, and ouabain (for review, see Sweadner, 1989; Blanco and Mercer, 1998). The interpretation is not simple, however, because it has also been shown that a given combination of α and β subunits can have different properties in different cellular environments (Therien et al., 1996,1997). α3, for example, has shown very low affinity for Na+ in transfected cells (Jewell and Lingrel, 1991; Munzer et al., 1994) but higher affinity in axolemma (mainly α3β1) or pineal (mainly α3β2) (Sweadner, 1985; Shyjan et al., 1990). Substitution of β2 or β3 for β1 (as occurs in photoreceptors) increases affinity for Na+in Sf-9 cells (Yu et al., 1997; Blanco and Mercer, 1998) but may have different effects in other cells and with other isoforms (Schmalzing et al., 1992; Jaisser et al., 1994). A further complication is that the isoforms may be regulated differently, such as by kinases (Beguin et al., 1996). What is most unusual about the retina is the large flux of Na+ in photoreceptors, and the fact that they must be depolarized (by Na+ influx) in the steady state in the dark to be sensitive to photic stimuli. They are hyperpolarized largely by turning off the Na+ leak and allowing the Na,K-ATPase to pump the Na+ back out. It is possible, then, that a given combination of isoforms is found in one cell type where a relatively high cytoplasmic Na+concentration is needed or at least tolerated, and another combination is found in a cell type that requires a steep Na+ gradient for Na+-dependent uptake of transmitter, for example. Still another combination may be needed in glia for their special role in K+ homeostasis. In this way, Na,K-ATPase isoforms could adapt each cell for its role.
Footnotes
This work was supported by National Institutes of Health Grant NS27653. We thank Drs. Del Ames and Richard H. Masland for useful comments on this manuscript, and Dr. Bradley T. Hyman for making available the confocal microscope. We are grateful to other investigators for the gift of useful antibodies: R. Levenson (Pennsylvania State University College of Medicine, Philadelphia, PA), Christo Goridis (Institut National de la Santé et de la Recherche Médicale-Centre National de la Recherche Scientifique, Marseille Luminy, France), Andrea Quaroni (Cornell University, Ithaca, NY), M. Schachner (ETH Zurich, Zurich, Switzerland), and Phillip Beesley (Royal Holloway and Bedford New College, Egham, UK). Antibody 6F, originally a gift of D. M. Fambrough (Johns Hopkins University, Baltimore, MD), is available from the Developmental Studies Hybridoma Bank (Iowa City, IA). Antibody XVIF9G10 (“16-F9-G10”), originally a gift of K. P. Campbell (University of Iowa, Iowa City, IA), is available from Affinity BioReagents (Golden, CO).
Correspondence should be addressed to Kathleen J. Sweadner, 149–6118 Massachusetts General Hospital, 149 13th Street, Charlestown, MA 02129. E-mail:sweadner@helix.mgh.harvard.edu.
REFERENCES
- 1.Ames A, Li YY, Heher EC, Kimble CR. Energy metabolism of rabbit retina as related to function: high cost of Na+ transport. J Neurosci. 1992;12:840–853. doi: 10.1523/JNEUROSCI.12-03-00840.1992. [DOI] [PMC free article] [PubMed] [Google Scholar]
- 2.Arystarkhova E, Sweadner KJ. Isoform-specific monoclonal antibodies to Na-K-ATPase α subunits: evidence for a tissue-specific post-translational modification of the α subunit. J Biol Chem. 1996;271:23407–23417. doi: 10.1074/jbc.271.38.23407. [DOI] [PubMed] [Google Scholar]
- 3.Arystarkhova E, Sweadner KJ. Tissue-specific expression of the Na,K-ATPase β3 subunit: the presence of β3 in lung and liver addresses the problem of the missing subunit. J Biol Chem. 1997;272:22405–22408. doi: 10.1074/jbc.272.36.22405. [DOI] [PubMed] [Google Scholar]
- 4.Barnstable CJ, Akagawa K, Hofstein R, Horn JP. Monoclonal antibodies that label discrete cell types in the mammalian nervous system. Cold Spring Harb Symp Quant Biol. 1983;48:863–876. doi: 10.1101/sqb.1983.048.01.089. [DOI] [PubMed] [Google Scholar]
- 5.Beesley PW, Paladino T, Gravel C, Hawkes RA, Gurd JW. Characterization of gp 50, a major glycoprotein present in rat brain synaptic membranes, with a monoclonal antibody. Brain Res. 1987;408:65–78. doi: 10.1016/0006-8993(87)90359-3. [DOI] [PubMed] [Google Scholar]
- 6.Beguin P, Peitsch MC, Geering K. α1 but not α2 or α3 isoforms of Na,K-ATPase are efficiently phosphorylated in a novel protein kinase C motif. Biochemistry. 1996;35:14098–14108. doi: 10.1021/bi960516o. [DOI] [PubMed] [Google Scholar]
- 7.Besirli CG, Gong TL, Lomax MI. Novel β3 isoform of the Na,K-ATPase β subunit from mouse retina. Biochim Biophys Acta. 1997;1350:21–26. doi: 10.1016/s0167-4781(96)00192-3. [DOI] [PubMed] [Google Scholar]
- 8.Blanco G, Mercer RW. Isozymes of the Na-K-ATPase: heterogeneity in structure, diversity in function. Am J Physiol. 1998;275:F633–F650. doi: 10.1152/ajprenal.1998.275.5.F633. [DOI] [PubMed] [Google Scholar]
- 9.Blanks JC, Johnson LV. Selective lectin binding of the developing mouse retina. J Comp Neurol. 1983;221:31–41. doi: 10.1002/cne.902210103. [DOI] [PubMed] [Google Scholar]
- 10.Bonting SL, Caravaggio LL, Gouras P. The rhodopsin cycle in the developing vertebrate retina. I. Relation of rhodopsin content, electroretinogram, and rod structure in the rat. Exp Eye Res. 1961;1:14–24. doi: 10.1016/s0014-4835(61)80004-3. [DOI] [PubMed] [Google Scholar]
- 11.Fletcher EL, Kalloniatis M. Localisation of amino acid neurotransmitters during postnatal development of the rat retina. J Comp Neurol. 1997;380:449–471. doi: 10.1002/(sici)1096-9861(19970421)380:4<449::aid-cne3>3.0.co;2-1. [DOI] [PubMed] [Google Scholar]
- 12.Ghosh S, Freitag AC, Martin-Vasallo P, Coca-Prados M. Cellular distribution and differential gene expression of the three α subunit isoforms of the Na,K-ATPase in the ocular ciliary epithelium. J Biol Chem. 1990;265:2935–2940. [PubMed] [Google Scholar]
- 13.Gloor S, Antonicek H, Sweadner KJ, Pagliusi S, Frank R, Moos M, Schachner M. The adhesion molecule on glia (AMOG) is a homologue of the β subunit of the Na,K-ATPase. J Cell Biol. 1990;110:165–174. doi: 10.1083/jcb.110.1.165. [DOI] [PMC free article] [PubMed] [Google Scholar]
- 14.Gloor S, Nasse K, Essen LO, Appel F. Production and secretion in CHO cells of the extracellular domain of AMOG/β2, a type-II membrane protein. Gene. 1992;120:307–312. doi: 10.1016/0378-1119(92)90111-2. [DOI] [PubMed] [Google Scholar]
- 15.Graymore C. Metabolism of the developing retina. I. Aerobic and anaerobic glycolysis in the developing rat retina. Br J Ophthalmol. 1959;43:34–39. doi: 10.1136/bjo.43.1.34. [DOI] [PMC free article] [PubMed] [Google Scholar]
- 16.Graymore C. Metabolism of the developing retina. III. Respiration in the developing normal rat retina and the effect of an inherited degeneration of the retinal neuro-epithelium. Br J Ophthalmol. 1960;44:363–369. doi: 10.1136/bjo.44.6.363. [DOI] [PMC free article] [PubMed] [Google Scholar]
- 17.Gundersen D, Orlowski J, Rodriguez-Boulan E. Apical polarity of Na,K-ATPase in retinal pigment epithelium is linked to a reversal of the ankyrin-fodrin submembrane cytoskeleton. J Cell Biol. 1991;112:863–872. doi: 10.1083/jcb.112.5.863. [DOI] [PMC free article] [PubMed] [Google Scholar]
- 18.He L, Campbell ML, Srivastava D, Blocker YS, Harris JR, Swaroop A, Fox DA. Spatial and temporal expression of AP-1 responsive rod photoreceptor genes and bZIP transcription factors during development of the rat retina. Mol Vis. 1998;4:32–40. [PubMed] [Google Scholar]
- 19.Hicks D, Barnstable CJ. Different rhodopsin monoclonal antibodies reveal different binding patterns on developing and adult rat retina. J Histochem Cytochem. 1987;35:1317–1328. doi: 10.1177/35.11.3655327. [DOI] [PubMed] [Google Scholar]
- 20.Jaisser F, Jaunin P, Geering K, Rossier BC, Horisberger JD. Modulation of the Na,K-Pump function by β subunit isoforms. J Gen Physiol. 1994;103:605–623. doi: 10.1085/jgp.103.4.605. [DOI] [PMC free article] [PubMed] [Google Scholar]
- 21.Jasoni CL, Reh TA. Temporal and spatial pattern of MASH-1 expression in the developing rat retina demonstrates progenitor cell heterogeneity. J Comp Neurol. 1996;369:319–327. doi: 10.1002/(SICI)1096-9861(19960527)369:2<319::AID-CNE11>3.0.CO;2-C. [DOI] [PubMed] [Google Scholar]
- 22.Jewell EA, Lingrel JB. Comparison of the substrate dependence properties of the rat Na, K-ATPase α1, α2, and α3 isoforms expressed in HeLa cells. J Biol Chem. 1991;266:16925–16930. [PubMed] [Google Scholar]
- 23.Liabeuf A, Gorvel JP, Goridis C. Recognition of sodium- and potassium-dependent adenosine triphosphatase on mouse lymphoid cells by means of a monoclonal antibody. Cell Tissue Res. 1984;238:253–261. doi: 10.1007/BF00217297. [DOI] [PubMed] [Google Scholar]
- 24.Magyar JP, Bartsch U, Wang ZQ, Howells N, Aguzzi A, Wagner EF, Schachner M. Degeneration of neural cells in the central nervous system of mice deficient in the gene for the adhesion molecule on glia, the β2 subunit of murine Na,K-ATPase. J Cell Biol. 1994;127:835–845. doi: 10.1083/jcb.127.3.835. [DOI] [PMC free article] [PubMed] [Google Scholar]
- 25.Marxer A, Stieger B, Quaroni A, Kashgarian M, Hauri HP. (Na + K)-ATPase and plasma membrane polarity of intestinal epithelial cells: presence of a brush border antigen in the distal large intestine that is immunologically related to β subunit. J Cell Biol. 1989;109:1057–1069. doi: 10.1083/jcb.109.3.1057. [DOI] [PMC free article] [PubMed] [Google Scholar]
- 26.McGrail KM, Sweadner KJ. Immunofluorescent localization of two different Na,K-ATPases in the rat retina and in identified dissociated retinal cells. J Neurosci. 1986;6:1272–1283. doi: 10.1523/JNEUROSCI.06-05-01272.1986. [DOI] [PMC free article] [PubMed] [Google Scholar]
- 27.McGrail KM, Sweadner KJ. Complex expression patterns for Na,K-ATPase isoforms in retina and optic nerve. Eur J Neurosci. 1989;2:170–176. doi: 10.1111/j.1460-9568.1990.tb00409.x. [DOI] [PubMed] [Google Scholar]
- 28.McLean IW, Nakane PK. Periodate-lysine-paraformaldehyde fixative. A new fixative for immunoelectron microscopy. J Histochem Cytochem. 1974;22:1077–1083. doi: 10.1177/22.12.1077. [DOI] [PubMed] [Google Scholar]
- 29.Molthagen M, Schachner M, Bartsch U. Apoptotic cell death of photoreceptor cells in mice deficient for the adhesion molecule on glia (AMOG, the β2-subunit of the Na,K-ATPase). J Neurocytol. 1996;25:243–255. doi: 10.1007/BF02284800. [DOI] [PubMed] [Google Scholar]
- 30.Müller-Husmann G, Gloor S, Schachner M. Functional characterization of β isoforms of murine Na,K-ATPase: the adhesion molecule on glia (AMOG/β2), but not β1, promotes neurite outgrowth. J Biol Chem. 1993;268:26260–26267. [PubMed] [Google Scholar]
- 31.Munzer JS, Daly SE, Jewell-Motz EA, Lingrel JB, Blostein R. Tissue- and isoform-specific kinetic behavior of the Na,K-ATPase. J Biol Chem. 1994;269:16668–16676. [PubMed] [Google Scholar]
- 32.Olney JW. An electron microscopic study of synapse formation, receptor outer segment development, and other aspects of developing mouse retina. Invest Ophthalmol Vis Sci. 1968;7:250–268. [PubMed] [Google Scholar]
- 33.Pacholczyk T, Sweadner KJ. Epitope and mimotope for an antibody to the Na,K-ATPase. Protein Sci. 1997;6:1537–1548. doi: 10.1002/pro.5560060718. [DOI] [PMC free article] [PubMed] [Google Scholar]
- 34.Peng L, Martin-Vasallo P, Sweadner KJ. Isoforms of Na,K-ATPase α and β subunits in the rat cerebellum and in granule cell cultures. J Neurosci. 1997;17:3488–3502. doi: 10.1523/JNEUROSCI.17-10-03488.1997. [DOI] [PMC free article] [PubMed] [Google Scholar]
- 35.Raedler A, Sievers J. The development of the visual system of the albino rat. Adv Anat Embryol Cell Biol. 1975;50:3–88. doi: 10.1007/978-3-642-45461-5. [DOI] [PubMed] [Google Scholar]
- 36.Rich KA, Zhan Y, Blanks JC. Migration and synaptogenesis of cone photoreceptors in the developing mouse retina. J Comp Neurol. 1996;388:47–63. [PubMed] [Google Scholar]
- 37.Ruiz A, Bhat SP, Bok D. Characterization and quantification of full-length and truncated Na,K-ATPase α1 and β1 RNA transcripts expressed in human retinal pigment epithelium. Gene. 1995;155:179–184. doi: 10.1016/0378-1119(94)00812-7. [DOI] [PubMed] [Google Scholar]
- 38.Ruiz A, Bhat SP, Bok D. Expression and synthesis of the Na,K-ATPase β2 subunit in human retinal pigment epithelium. Gene. 1996;176:237–242. doi: 10.1016/0378-1119(96)00258-2. [DOI] [PubMed] [Google Scholar]
- 39.Schmalzing G, Kroner S, Schachner M, Gloor S. The adhesion molecule on glia (AMOG/β2) and α1 subunits assemble to functional sodium pumps in Xenopus oocytes. J Biol Chem. 1992;267:20212–20216. [PubMed] [Google Scholar]
- 40.Schneider BG, Kraig E. Na,K-ATPase of the photoreceptor: selective expression of α3 and β2 isoforms. Exp Eye Res. 1990;51:553–564. doi: 10.1016/0014-4835(90)90086-a. [DOI] [PubMed] [Google Scholar]
- 41.Schneider BG, Shyjan AW, Levenson R. Co-localization and polarized distribution of Na,K-ATPase α3 and β2 subunits in photoreceptor cells. J Histochem Cytochem. 1991;39:507–517. doi: 10.1177/39.4.1848572. [DOI] [PubMed] [Google Scholar]
- 42.Shyjan AW, Levenson R. Antisera specific for the α1, α2, α3, and β subunits of the Na,K-ATPase: differential expression of α and β subunits in rat tissue membranes. Biochemistry. 1989;28:4531–4535. doi: 10.1021/bi00437a002. [DOI] [PubMed] [Google Scholar]
- 43.Shyjan AW, Cena V, Klein DC, Levenson R. Differential expression and enzymatic properties of the Na+,K+-ATPase α3 isoenzyme in rat pineal glands. Proc Natl Acad Sci USA. 1990;87:1178–1182. doi: 10.1073/pnas.87.3.1178. [DOI] [PMC free article] [PubMed] [Google Scholar]
- 44.Specht SC, Sweadner KJ. Two different Na,K-ATPases in the optic nerve: cells of origin and axonal transport. Proc Natl Acad Sci USA. 1984;81:1234–1238. doi: 10.1073/pnas.81.4.1234. [DOI] [PMC free article] [PubMed] [Google Scholar]
- 45.Stahl WL, Baskin DG. Immunocytochemical localization of Na+,K+-adenosine triphosphatase in the rat retina. J Histochem Cytochem. 1984;32:248–250. doi: 10.1177/32.2.6319483. [DOI] [PubMed] [Google Scholar]
- 46.Sweadner KJ. Enzymatic properties of separated isozymes of the Na,K-ATPase. Substrate affinities, kinetic cooperativity, and ion transport stoichiometry. J Biol Chem. 1985;260:11508–11513. [PubMed] [Google Scholar]
- 47.Sweadner KJ. Isozymes of the Na+/K+-ATPase. Biochim Biophys Acta. 1989;988:185–220. doi: 10.1016/0304-4157(89)90019-1. [DOI] [PubMed] [Google Scholar]
- 48.Therien AG, Nestor NB, Ball WJ, Blostein R. Tissue-specific versus isoform-specific differences in cation activation kinetics of the Na,K-ATPase. J Biol Chem. 1996;271:7104–7112. doi: 10.1074/jbc.271.12.7104. [DOI] [PubMed] [Google Scholar]
- 49.Therien AG, Goldshleger R, Karlish SJD, Blostein R. Tissue-specific distribution and modulatory role of the γ subunit of the Na,K-ATPase. J Biol Chem. 1997;272:32628–32634. doi: 10.1074/jbc.272.51.32628. [DOI] [PubMed] [Google Scholar]
- 50.Weber P, Bartsch U, Schachner M, Montag D. Na,K-ATPase subunit β1 knock-in prevents lethality of β2 deficiency in mice. J Neurosci. 1998;18:9192–9203. doi: 10.1523/JNEUROSCI.18-22-09192.1998. [DOI] [PMC free article] [PubMed] [Google Scholar]
- 51.Weidman TA, Kuwabara T. Postnatal development of the rat retina. Arch Ophthalmol. 1968;79:470–484. doi: 10.1001/archopht.1968.03850040472015. [DOI] [PubMed] [Google Scholar]
- 52.Yamaskai EN, Krupnik VE, Chun LLY. Developmental study of Müller cells in the rat retina using a new monoclonal antibody, RT10F7. Neuroscience. 1998;85:627–636. doi: 10.1016/s0306-4522(97)00084-5. [DOI] [PubMed] [Google Scholar]
- 53.Young RW. Cell differentiation in the retina of the mouse. Anat Rec. 1985;212:199–205. doi: 10.1002/ar.1092120215. [DOI] [PubMed] [Google Scholar]
- 54.Yu C, Xie Z, Askari A, Modyanov NN. Enzymatic properties of human Na,K-ATPase α1-β3 isozyme. Arch Biochem Biophys. 1997;345:143–149. doi: 10.1006/abbi.1997.0255. [DOI] [PubMed] [Google Scholar]