

Abstract
Mossy fiber reorganization has been hypothesized to restore inhibition months after kainate-induced status epilepticus. The time course of recovery of inhibition after kainate treatment, however, is not well established. We tested the hypothesis that if inhibition is decreased after kainate treatment, it is restored within the first week when little or no mossy fiber reorganization has occurred. Chronicin vivo recordings of the septal dentate gyrus were performed in rats before and 1, 4, and 7–8 d after kainate (multiple injections of 5 mg/kg, i.p.; n = 17) or saline (n = 11) treatment. Single and paired-pulse stimuli were used to assess synaptic inhibition. The first day after kainate treatment, only a fraction of rats showed multiple population spikes (35%), prolonged field postsynaptic potentials (76%), and loss of paired-pulse inhibition (29%) to perforant path stimulation. Thus, inhibition was reduced in only some of the kainate-treated rats. By 7–8 d after treatment, nearly all kainate-treated rats showed partial or full recovery in these response characteristics. Histological analysis indicated that kainate-treated rats had a significant decrease in the number of hilar neurons compared to controls, but Timm staining showed little to no mossy fiber reorganization. These results suggest that a decrease in synaptic inhibition in the septal dentate gyrus is not a prerequisite for epileptogenesis and that most of the recovery of inhibition occurs before robust Timm staining in the inner molecular layer.
Keywords: freely behaving, in vivo, epilepsy, seizure, kainic acid, hippocampus, mossy fiber reorganization, neuronal loss
Human temporal lobe epilepsy is characterized by a latent period between the initial injury and the onset of recurrent seizures and by a chronic or permanent epileptic state (Engel, 1989; French et al., 1993; Spencer and Spencer, 1994). These characteristics are expressed in kainate-treated rats, an animal model of temporal lobe epilepsy (Nadler, 1981; Ben-Ari, 1985; Hellier et al., 1998). In addition, loss of hilar and pyramidal neurons in the hippocampus occurs, and new axon collaterals from granule cells project into the inner molecular layer of the dentate gyrus in humans with temporal lobe epilepsy (Sutula et al., 1989; Houser et al., 1990; Babb et al., 1991) and in the kainate-treated rat (Nadler et al., 1980;Ben-Ari, 1985; Buckmaster and Dudek, 1997a,b). It has been hypothesized that injury-induced axonal sprouting and synaptic remodeling accounts for the latent period to seizure onset and underlies the establishment of the permanent epileptic state (Tauck and Nadler, 1985; Wuarin and Dudek, 1996; Dudek and Spitz, 1997).
The precise nature of the functional changes in the dentate gyrus and the role of mossy fiber reorganization in epileptogenesis are largely unknown. In vivo experiments in the kainate-treated rat model suggest that an initial reduction of inhibition occurs 2–4 d after treatment (Sloviter, 1992). This loss of inhibition, however, was followed by functional recovery of inhibition months after treatment, when Timm stain is present in the inner molecular layer. Milgram et al. (1991) also found a loss of inhibition after kainate treatment, but inhibition was restored within 24 hr. This study, however, did not confirm that the status epilepticus of the kainate-treated rats was sufficient to induce a chronic epileptic state. More recent electrophysiological experiments on slices from pilocarpine-treated rats suggest a relatively rapid decline in GABAA-receptor-mediated inhibition that is apparently because of alterations in GABAAreceptors (Kapur and MacDonald, 1997; Shumate et al., 1998). Little information, however, is available on the functional recovery of inhibition after status epilepticus and its possible relationship to mossy fiber reorganization.
In vivo kindling experiments have shown that inhibition is increased within 24 hr after the first afterdischarge (De Jonge and Racine, 1987; Maru and Goddard, 1987). Although the kindling model differs substantially from models based on excitotoxic induction of status epilepticus, this result suggests that a prolonged period (e.g., days or weeks) of reduced inhibition is not necessary for epileptogenesis. Our experiments also aimed to determine whether a reduction of inhibition is a critical factor in developing temporal lobe epilepsy.
In this study, we used the rat with kainate-induced epilepsy (i.e., multiple low-dose injections) as an animal model of temporal lobe epilepsy. We implanted recording electrodes in the septal dentate gyrus to record spontaneous activity and evoked responses and to assess epileptiform events and synaptic inhibition during the first week after kainate treatment. We tested these hypotheses: (1) hippocampal inhibition decreases within the first day after kainate treatment; however, it recovers within the first week, and (2) the initial recovery of inhibition is independent of mossy fiber reorganization in the inner molecular layer.
MATERIALS AND METHODS
Animals
Surgery. Male Sprague Dawley rats (175–350 gm; Harlan Sprague Dawley, Indianapolis, IN) were used for all experiments. Rats were initially injected with penicillin (60,000 U/d, s.c.) and atropine (1 mg/kg, s.c.) to prevent infection and cardiorespiratory complications associated with survival surgery and general anesthesia. Subsequently, rats were anesthetized with secobarbital (5 mg/100 gm of body weight, i.p.). The head was placed in a stereotaxic apparatus, a midsagittal incision was made on the scalp, and the skin was reflected with hemostats. Using bregma as a reference, nine holes were burred in the skull for implantation of recording, stimulating, and grounding electrodes as well as three support screws. The wire sizes and placement of electrodes for the surgery are listed in Table1. All electrodes were cemented in place with dental acrylic and then gathered into a miniature connector (McIntyre Miniature Connector, Science Technology Centre, Carleton University, Ottawa, Ontario, Canada). Animals recovered from surgery under a heat lamp and were injected with lactated Ringer's solution (3–5 ml, s.c.). A Tylenol–codeine elixir (3 ml/250 ml H2O) and penicillin (60,000 U/d, s.c.) were provided for 3 d after surgery. All rats were placed in Healthguard cages for 5–7 d before electrophysiological recordings were performed. Kainate or saline injections were administered 1–2 d after baseline recordings.
Table 1.
Type and location of implanted electrodes as referenced by bregma
| Electrode | Hemisphere | Lateral | Caudal | Depth | Wire size |
|---|---|---|---|---|---|
| Depth recording (dentate gyrus) | Right | 2.5 mm | 4.0 mm | 2.7–2.9 mm | 0.003” |
| EEG recording | Left | 1.0 mm | 4.0 mm | On dura | 0.007” |
| Ground | Both | 2.0 mm | 3.5 mm | On dura | 0.013” |
| Stimulating (angular bundle) | Right | 4.1–4.3 mm | 7.8–8.2 mm | 2.5–3.5 mm | 0.0045” |
| Stimulating indifferent | Left | 4.4 mm | 8.0 mm | On dura | 0.007” |
Depth of electrode was measured below dura unless otherwise mentioned. Electrodes were made of stainless steel, Teflon-coated wire.
Kainate treatment. The kainate treatment protocol has been described in detail elsewhere (Wuarin and Dudek, 1996; Hellier et al., 1998; Patrylo and Dudek, 1998). Briefly, rats were given hourly injections of kainate (5 mg/kg, i.p.; Sigma, St. Louis, MO) or saline, and seizure activity was rated according to a modified Racine's scale (i.e., class III, IV, and V seizures; Racine, 1972; Ben-Ari, 1985). To minimize mortality, injections were reduced or eliminated if an animal showed excessive inactivity or activity. After the first injection, rats (n = 17 kainate and n = 11 saline) were placed in the recording chamber to record electrographic epileptiform activity induced by kainate treatment. Electrographic recordings were also made from saline-treated rats. These sessions were performed throughout the injection series, and data were collected for ≥30 min. Kainate treatment was continued until class IV and V seizures were elicited for ≥3 hr. Rats were then injected with lactated Ringer's solution (3–5 ml, s.c.) and given apple slices for the first week after treatment.
Video monitoring and seizure analysis. Directly after kainate treatment, 24 hr continuous videotaping was performed as described earlier (Hellier and Dudek, 1999). Briefly, 26 kainate- (n = 12 implanted and n = 14 nonimplanted) and 12 saline-treated (n = 4 implanted and n = 8 nonimplanted) rats were placed in labeled cages and video-monitored for seven consecutive 24 hr periods (12 hr light/dark cycle). Animal behavior and seizures were recorded on 8 hr videotapes from an MTI 65 Silicon Intensified Target camera with automatic gain control. Night recordings were performed with a Kodak (Eastman Kodak, Rochester, NY) 1A filter over a safelight, and day recordings were accomplished with diffuse fluorescent light.
Two trained observers independently viewed all videotapes and recorded motor seizure activity and behavior. Seizure activity during video monitoring was rated by the same method used during kainate treatment (i.e., class III/IV/V seizures were scored). Motor seizures were assessed from analysis of behavioral postures (e.g., lordosis, straight tail, forelimb clonus, and/or rearing) during the fast-forward speed of the video recorder. Once a behavioral posture was seen, the videotape was rewound to the beginning of the behavior and examined at real-time speed (i.e., 32 frames/sec). Therefore, all motor seizures were scored at real-time speed.
Electrophysiology
Chronic in vivo recordings. Rats were placed in a recording chamber, and the electrodes were connected to a commutator system that allowed the animal to move freely. Rats were monitored both behaviorally and electrographically for 1–3 hr during each recording session. Baseline electrophysiological recordings were performed 5–7 d after surgery. Spontaneous activity and responses to single (0.05 Hz) and paired-pulse (20 msec interstimulus interval at 0.05 Hz) stimulation of the perforant path (intensity, 1–15 V; duration, 0.015 msec; Grass Instruments) were studied in all rats. To standardize the responses from single and paired-pulse stimulation, all stimuli were given during the inactive waking state of the animal (i.e., little to no volitional movement with eyes open). An input–output relationship from single stimulation was performed in all rats at 2, 4, 6, 8, 10, and 15 V. The voltage at which a maximal response occurred was used to analyze the number of population spikes and field PSP lengths. To measure paired-pulse indices, the voltage that produced a half-maximal population spike in the first response before treatment was used throughout the testing period. Therefore, the first population spike before and 1, 4, and 7–8 d after treatment were the same relative amplitude. Chronic in vivo recordings (dentate gyrus field potentials and surface electroencephalograms) were performed before and 1, 4, and 7–8 d after treatment. The electroencephalogram (EEG) and dentate field responses were filtered (0.5 Hz–10 kHz), amplified (100×), displayed on an oscilloscope, digitized (Neuro-Corder; Neuro Data Instruments), and stored on videotape. Off-line analysis was accomplished with pClamp6 software (Axon Instruments, Foster City, CA). At 7–8 d after treatment, animals were either allowed to survive to confirm that they became epileptic or killed for histology.
Data analysis. All data analyses were performed using pClamp6 software. Traces used in the analyses were an average of 10 responses. Population spike amplitudes were calculated by taking the mean of the fast descending and the fast ascending components. Only those population spikes with distinct fast components were used for data analysis. The length of the field PSP was measured from the stimulus artifact to the time when the field PSP crossed the baseline. Paired-pulse index was calculated by taking the ratio of the amplitudes of the population spike from the second response by the first response. A paired-pulse index ≤1 was used to determine that inhibition was intact compared to a paired-pulse index >1, which was used to determine that the response was facilitated. The duration of spontaneous interictal spikes was measured from the onset of the fast phase of the field activity until the return to baseline, which included an intervening negative event.
Histology
Staining. Timm staining was used to visualize mossy fiber reorganization in the inner molecular layer, whereas cresyl violet staining was used to quantify hilar neuronal populations. Animals were transcardially fixed with 0.37% sodium sulfide (Sigma), then with 4% paraformaldehyde (Sigma). The brain was removed, hemisected, and post-fixed overnight at 4°C. Both hippocampi were extracted from the neocortex and placed in 30% sucrose (Sigma) for cryoprotection. Each hippocampus was then sectioned transversely (30 μm) with a sliding microtome (Leica, Nussloch, Germany), and alternate sections (i.e., every 10th and 11th section) were mounted on slides and allowed to air-dry overnight. Alternate sections were processed with cresyl violet stain or a modified Timm staining protocol and then counterstained with cresyl violet (Babb et al., 1991; Buckmaster and Dudek, 1997a,b).
Quantitative analysis. Hilar cell counts and mossy fiber reorganization were separately analyzed without the observer's knowledge of the experimental treatment. Estimation of the hilar cell population was calculated using the optical fractionator method (West et al., 1991) with the computer software Stereo Investigator 3.12 (Microbrightfield, Colchester, VT). Total section thickness was used to determine dissector height (i.e., at least a 2 μm border from the bottom of the section), and only “caps” were counted. Caps were defined as large nuclei with diffuse chromatin containing a nucleolus that came into focus while focusing through the dissector height; only those caps within the counting frame were counted. The counting frame was previously determined by a pilot study (i.e., 65 × 65 μm). Counting frames were randomly distributed throughout the hilus, according to the method described by West et al. (1991). The hilus was determined by the area between the granule cell layer and the CA3 pyramidal cell layer. For sections with severe loss of CA3 pyramidal cells, the proximal end of the CA3 was estimated by observing patterns of gliosis and remaining neurons that were different in CA3 compared to the hilus.
Mossy fiber reorganization was analyzed by determining the amount of dark reaction product in the inner molecular layer of the dentate gyrus. The scoring method described by Tauck and Nadler (1985) was used to rate the amount of Timm stain in the inner molecular layer. Briefly, Timm staining in the inner molecular layer was assessed as follows: score 0, no or only occasional dark reaction product in the inner molecular layer; score 1, scattered reaction product throughout the inner molecular layer; score 2, patches of heavy reaction product interspersed with regions of light staining or a continuous band of intermediate staining between sections scored 1 and 3; and score 3, a dense, continuous band of dark reaction product in the inner molecular layer. A Timm score was applied to the inner blade, apex, and outer blade of each section, and an average Timm score was calculated (saline, n = 203 sections; kainate, n = 274 sections). The mean Timm scores were then used for statistical analysis between hippocampi of control and kainate-treated rats.
Hilar cell populations and the amount of Timm staining in the inner molecular layer were compared between saline- and kainate-treated rats along the septotemporal axis of the hippocampus. Because there is a large variability between hippocampal lengths, the data were normalized by recording each section position as percentage of the distance from the septal pole (e.g., 0–9.9%, 10–19.9%, etc.).
Statistics
All statistical analyses were performed using SAS 6.12 software (SAS Institute, Cary, NC). A power analysis determined that 16 animals were needed for a significant difference between means, with a 90% confidence that a difference could be detected with a pvalue of 0.05. ANOVA with multiple comparisons was performed to determine if significant differences in field responses (i.e., number of population spikes, length of field PSP, and paired-pulse index) existed between pretreatment and 1, 4, and 7–8 d after treatment. Student's t test or ANOVA with multiple comparisons was used to determine significant differences between estimations in the number of hilar cells as well as the amount of Timm stain in the inner molecular layer of the dentate gyrus. A linear regression was used to determine the relationship between the percentage of recovery versus mean Timm score. Significance for all tests was accepted whenp < 0.05, and all interactions were performed a priori.
RESULTS
Epileptiform activity and status epilepticus during kainate treatment
After the first injection, rats (n = 17 kainate and n = 11 saline) were placed in the recording chamber to record electrographic activity. Each rat was recorded for ≥30 min during three or four sessions throughout the injection series. Therefore, electrographic seizure activity was recorded for 1.5–2 hr in each rat. The recording sessions were analyzed in 12 kainate-treated rats to estimate the frequency of nonconvulsive and convulsive seizures. The mean electrographic seizure frequency of kainate-treated rats was 18.9 ± 2.4 (± SEM) seizures/hr during treatment (range, 11.3–41.1). No saline-treated rats were observed to have seizures during treatment.
Kainate-induced electrographic nonconvulsive and convulsive seizures were recorded in the granule cell layer of the septal dentate gyrus (Fig. 1). This electrographic epileptiform activity observed in the granule cell layer was similar during both nonconvulsive and convulsive seizures (classes III, IV, and V). Throughout kainate treatment, the EEG electrode (located on the surface of the dura mater) did not detect nonconvulsive seizures, but recorded repetitive sharp waves during convulsive seizures (Fig.1B). These 1 Hz waveforms with amplitudes of 1–2 mV coincided with the ictal discharge in the dentate electrode, suggesting that seizures were generated and spread from the limbic structures to the neocortex.
Fig. 1.

Granule cell layer (Dentate) and surface (EEG) recordings of nonconvulsive and convulsive seizures during kainate treatment. A, Nonconvulsive seizure during kainate treatment. In the expanded traces (A1–A4) seizure activity is shown in the dentate electrode (A3), but it is absent in the EEG trace (A4). B, Stage IV motor seizure during kainate treatment. Note the epileptiform activity in the expanded dentate and EEG recordings (B3 andB4, respectively). All dentate traces are shown at the same gain (calibration, 5 mV), but the EEG traces are at two gains. Thenumbered boxes in the toptwo traces in each panel are expanded in the bottom traces. Asterisks represent truncated motor artifacts induced by “wet dog shakes.”
During kainate treatment, all rats experienced electrographic status epilepticus 4–5 hr after the first injection (Fig.2). This activity was recorded from both electrodes. In the dentate, the status epilepticus consisted of nonconvulsive ictal activity (2.5–10 Hz) with episodic convulsive ictal events (10–30 Hz). After a motor seizure, nonconvulsive ictal events persisted until the onset of the next motor seizure. Similarly, the EEG electrode recorded repetitive sharp waves that coincided with the nonconvulsive and convulsive ictal discharges in the dentate. Therefore, this activity was classified as electrographic status epilepticus. Months after treatment, all of the kainate-treated rats (n = 8) allowed to survive beyond the first week were observed to have recurrent, spontaneous motor seizures. Thus, by definition, these rats became epileptic.
Fig. 2.

Electrographic status epilepticus during kainate treatment. The top and bottom panels of the dentate and EEG traces are continuous. Stage IV motor seizures that were recorded at both the beginning and end of the traces are marked with a bar. Between the motor seizures, nonconvulsive ictal activity with a frequency of 2.5–10 Hz was observed in both the dentate and EEG recordings. The dentate and EEG traces are different gain (note the 5 vs 2 mV calibrations). The numbered boxes in the top traces are shown below at a faster time scale (2 sec), and the arrows point to traces with the fastest time scale (500 msec).
Spontaneous motor seizures observed during 24 hr video monitoring
To assess the latent period between kainate treatment and the first spontaneous motor seizure, rats were video-monitored (n = 26 kainate and n = 12 saline) for seven consecutive 24 hr periods, beginning immediately after treatment. Twenty-one of 26 (81%) kainate-treated rats had no behavioral seizures (seizure frequency = 0.0 seizures/hr) for the first week after treatment (Fig. 3A). The remaining five rats had at least one behavioral motor seizure during the first post-treatment week (seizure frequency = 0.006–0.095 seizures/hr; i.e., 0.14–2.28 seizures/d). Of these five animals, two rats experienced motor seizures only within the first 27 hr after treatment. The remaining three rats exhibited their first motor seizure at 5–7 d after treatment (Fig. 3B). Therefore, for most kainate-treated rats, the latent period between the status epilepticus and first spontaneous motor seizure is >7 d after treatment, but some rats have repetitive seizures within the first week after kainate treatment. Spontaneous motor seizures were not observed in control animals.
Fig. 3.

During the first week after kainate treatment, few spontaneous motor seizures were observed in kainate-treated rats.A, Continuous video monitoring (24 hr) showed that 81% of kainate-treated rats did not have any spontaneous motor seizures during the first week after treatment. The remaining 19% of rats, however, were observed to have ≥1 behavioral seizures. The seizure frequencies of these rats are shown as a function of time after kainate treatment. B, Two of five rats experienced motor seizures within the first 27 hr after treatment. C, The remaining three rats had their first motor seizure at 5–7 d after treatment.
Spontaneous electrographic activity after treatment
All rats (n = 17 kainate and n = 11 saline) were monitored both behaviorally and electrographically for 1–3 hr during each recording session (i.e., before and 1, 4, and 7–8 d after treatment) so that each rat was monitored for at least 4 hr during the first post-treatment week. During these sessions, neither electrographic nor behavioral seizure activity was observed in either saline- or kainate-treated rats, although interictal spikes were seen in the majority of kainate-treated rats (n = 16). Spontaneous activity was recorded for ≥10 min before the stimulation–response series. Therefore, for each rat, spontaneous electrographic activity was recorded for at least 40 min. To estimate the frequency of spontaneous interictal spikes in the septal dentate gyrus of kainate-treated rats, 2 min samples of the recording sessions at 1 and 7 d after treatment were analyzed in 12 rats. Eight of the 12 kainate-treated rats were observed to have interictal spikes during the 2 min sample recording. Of the four remaining animals, only one rat failed to exhibit spontaneous interictal spikes during any of the recording sessions. Therefore, spontaneous interictal events were observed in the septal dentate gyrus in 94% of rats as early as 1 d after kainate treatment and were recorded throughout the 1 week testing period (Fig. 4). Interictal spikes were often synchronous in both the granule cell electrode and the surface EEG. The mean frequency of interictal spikes in kainate-treated rats was 0.21 ± 0.02 to 0.30 ± 0.04 Hz spikes/min (± SEM; 1 and 7 d after treatment, respectively), and the mean length was 222.5 ± 35.5 to 252.7 ± 61.7 msec (1 and 7 d after treatment, respectively). These results suggest that kainate-treated rats had abnormal electrographic events in the septal dentate gyrus shortly after treatment that persisted throughout the testing period.
Fig. 4.

Spontaneous interictal events. In the granule cell layer of the septal dentate gyrus in kainate-treated rats, spontaneous interictal events were observed from the first day after treatment until killing. These events varied in frequency and duration among kainate-treated rats. The boxed event is expanded below.
Response to perforant path stimuli during the first week after treatment
To assess inhibition and epileptiform activity, rats were given single or paired stimuli to the perforant path during the first week after treatment. Three components of the responses were measured: (1) number of population spikes, (2) length of the field PSP, and (3) paired-pulse index (see Materials and Methods). In all controls, single stimuli to the perforant path evoked one or two population spikes, and the mean field PSP duration ranged from 12.6 ± 0.8 to 13.1 ± 0.9 msec (± SEM; 1 and 7 d after treatment, respectively; Fig.5A). Similarly, responses from paired-pulse stimulation revealed strong inhibition in all control animals. The mean paired-pulse index ranged from 0.37 ± 0.2 to 0.48 ± 0.2 (1 and 7 d after treatment, respectively; Fig.5B).
Fig. 5.

A representative response to perforant path stimuli during the first week after saline treatment in a single rat. For this and all following figures, the traces are an average of 10 evoked events, and arrows point to truncated stimulus artifacts. A, In all control rats, single stimuli produced responses with one or two population spikes and uniform lengths of field PSP throughout the testing paradigm. B,Paired-pulse stimulation produced inhibition in the response to the test stimulus compared to the conditioning stimulus.
After a single stimulus of the perforant path 1 d after treatment, 8 of 17 (47%) kainate-treated rats showed no increase in the number of population spikes (Fig. 6). However in the remaining 53% (9 of 17) of kainate-treated rats, a modest increase in the number of population spikes was observed 1–4 d after treatment (i.e., 3–5 population spikes). At 7–8 d after treatment, 65% (11 of 17) of kainate-treated rats had the same number of population spikes as observed in control rats (i.e., one or two population spikes), and the remaining 35% had only three population spikes. These results suggest that kainate-treated rats have a partial to full recovery in the number of population spikes by 7–8 d after treatment.
Fig. 6.

Number of population spikes produced from perforant path stimulation during the first week after kainate treatment. Each group of traces is a response from a single kainate-treated rat recorded in serial order. A, In 47% of treated rats, the number of population spikes 1–8 d after treatment was not significantly different from controls. B, In the remaining 53% of treated rats, few population spikes were observed 1–4 d after treatment (i.e., ≥3 population spikes). By 7–8 d after treatment, all rats had ≤3 population spikes.
An increase in the number of population spikes was usually associated with a concomitant increase in field PSP duration. A decrease in inhibition could prolong the field PSP. Therefore, we calculated the change of the field PSP duration at maximal stimulation as a possible measure for a loss of inhibition. In 24% (4 of 17) of kainate-treated rats, the duration of the field PSP did not change 1–8 d after treatment (Fig. 7A). Single stimuli evoked prolonged field PSPs (i.e., ≥2 times the initial field PSP length) at 1 d after treatment in 76% (13 of 17) of kainate-treated rats (Fig. 7B,C). In these 13 rats, 54% (7 of 13) had a persistent increase of field PSP length throughout the testing period (Fig. 7B). The remaining 46% (6 of 13) of rats had a partial to full recovery of initial length by 4–8 d after treatment (i.e., ≥50% recovery, Fig. 7C).
Fig. 7.

Representative examples of prolonged field PSPs in the septal dentate gyrus during the first week after kainate treatment in a single rat from each of the groups. A, In 4 of 17 treated rats, single stimuli produced responses with the same length of field PSP throughout the testing period (i.e., 1–8 d after treatment).B, Single stimuli produced prolonged field PSPs with little or no recovery from 1–8 d after treatment in 7 of 17 treated rats. C, Partial to full recovery of the length of the field PSP was observed in the remaining 6 of 17 treated rats.
Paired-pulse stimulation of the perforant path was used to assess local inhibition. To measure this inhibition, the paired-pulse index was calculated by taking the ratio of the amplitude of the population spike from the test pulse by the conditioning pulse. All controls had a paired-pulse index ≤ 1, indicating a normal inhibitory response (mean index = 0.43; Fig. 5B). Similarly, paired-pulse stimulation produced normal inhibition in 65% (11 of 17) of kainate-treated rats 1–8 d after treatment (Fig.8A); the mean paired-pulse indices ranged between 0.00 and 0.56 for these 11 animals, thus indicating that two-thirds of the kainate-treated rats had normal or enhanced inhibition. The remaining 35% (6 of 17) of kainate-treated rats displayed paired-pulse facilitation 1 d after treatment (Fig.8B). This facilitation was large in three rats (range, 2.08–3.17) and modest in the other three rats (range, 1.14–1.68). By 7–8 d, however, four of the six kainate-treated rats with facilitation 1 d after treatment had a paired-pulse index <1, suggesting a normal inhibitory response. In total, 15 of 17 kainate-treated rats showed relatively normal paired-pulse inhibition by 7–8 d after treatment.
Fig. 8.

Paired-pulse responses in kainate-treated rats during the first week after treatment. Each group of traces is a recording from a single rat in chronological order. A,In 65% of treated rats, paired-pulse inhibition was enhanced throughout the testing period after kainate treatment. Compare the paired-pulse responses before treatment to 1 and 4 d after treatment. Although a population spike was present in the second response before kainate treatment, it was no longer present in the second response at 1 and 4 d after treatment. This result suggests that an increase in inhibition occurs in some animals after kainate treatment. B, Paired-pulse stimuli produced facilitated responses 1–4 d after treatment in the remaining 35% of rats. By 7–8 d, however, four of the six kainate-treated rats with a facilitated response 1 d after treatment had a paired-pulse index <1. Thus, partial recovery of paired-pulse inhibition occurred in these animals (i.e., although the paired-pulse index was <1, a population spike was present in the second response at 7 d, but not before treatment).
The mean responses of the three measures we used for inhibition are shown in Figure 9. In controls, the differences in means of number of population spikes, field PSP lengths, and paired-pulse index were not significant between pretreatment and 1, 4, and 7–8 d after treatment (p > 0.7; ANOVA; Fig. 9, left side of histograms). However, the number of population spikes was significantly increased the first day after kainate treatment compared to controls and before and 4–8 d after treatment (p < 0.05; Student–Newman–Keuls; Fig.9A). By 4–8 d after treatment, a significant reduction of the number of population spikes was observed, although there was still a significant increase compared to before treatment (p < 0.05). Kainate-treated rats also had significantly longer field PSPs 1 d after treatment compared to before and 4–8 d after treatment (p < 0.05; Student–Newman–Keuls; Fig. 9B). The length of the field PSP had recovered significantly 4–8 d after treatment; however, the field PSP duration was not necessarily equal to before treatment (p < 0.05). ANOVA between saline- and kainate-treated rats showed that the differences of paired-pulse indices were not significant (p = 0.171; Fig.9C). Although some kainate-treated rats had a facilitated paired-pulse response at 1, 4, and 7–8 d after treatment, the mean differences were not significant from the before-treatment response (p > 0.5). These data suggest that inhibition initially decreased after kainate treatment when comparing the number of population spikes, field PSP duration, and paired-pulse index. This loss of inhibition, however, recovered relatively rapidly (i.e., by 7–8 d after kainate treatment).
Fig. 9.
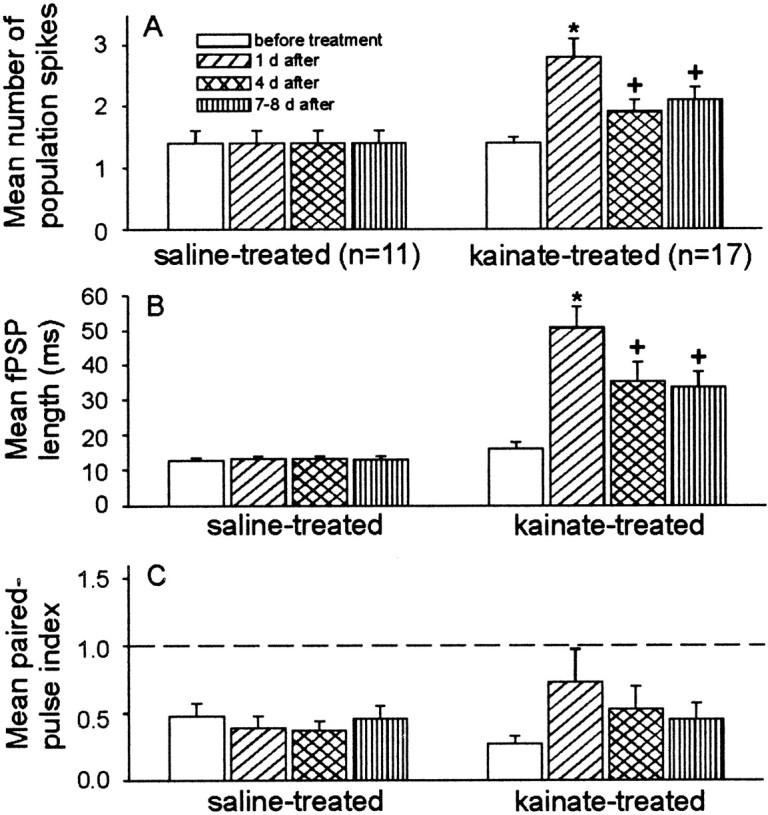
The mean number of population spikes and duration of the field PSP of kainate-treated rats, but not of paired-pulse inhibition, were significantly different from controls.A, Kainate-treated rats had significantly more population spikes 1 d after treatment compared to before, 4, and 7–8 d after treatment. By 4–8 d after treatment, a partial recovery of the number of population spikes was observed. B,Similarly, kainate-treated rats had significantly longer field PSPs at 1 d after treatment compared to before, 4, and 7–8 d after treatment. However, a partial to full recovery of the field PSP duration was observed 7–8 d after treatment. C, Both kainate-treated and control rats showed paired-pulse inhibition before and 1, 4, and 7–8 d after treatment. At 1 d after treatment, kainate-treated rats had an increase in the mean paired-pulse index; however, this difference was not significant. Theasterisks represent significant differences over all data points (p < 0.05; Student–Newman–Keuls). The plus symbols indicate significant differences from controls and 1 d after treatment (i.e., asterisks).
Hilar neuron loss and Timm staining in the inner molecular layer
The number of hilar neurons and the amount of mossy fiber reorganization were quantified throughout the septotemporal axis of the hippocampus of kainate-treated (n = 9) and control rats (n = 6). The observer was unaware of the experimental treatment during the analyses of the hippocampi. The region used to quantify hilar neurons was defined by a line drawn along the inner margin of the granule cell layer from the tips of the inner and outer blades to the proximal end of CA3 (Fig.10). Timm staining in the inner molecular layer was analyzed by using the scale of Tauck and Nadler (1985) (see Materials and Methods). For estimating hilar neuron populations, 275 sections from kainate-treated rats (n= 8) and 206 sections from controls (n = 6) were used. Similarly, 274 sections from kainate-treated rats (n = 9) and 203 sections from saline-treated rats (n = 6) were analyzed for abnormal Timm staining in the inner molecular layer.
Fig. 10.
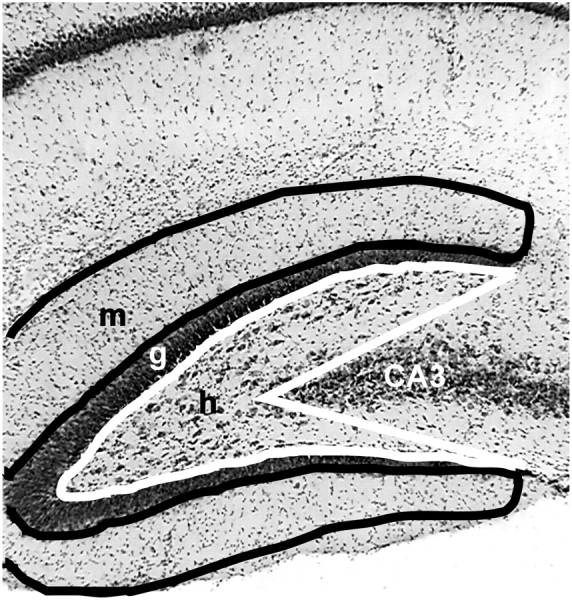
Region used for counting neurons and analyzing Timm stain. The hilus was determined by: (1) drawing a line along the inner margin of the granule cell layer from the tip of the inner blade to the tip of the outer blade and (2) extending these lines to the proximal end of the CA3 pyramidal cell layer (white line). Abnormal Timm staining was scored as the amount of dark reaction product in the inner molecular layer and through the granule cell layer (black line).
Cresyl violet-stained hippocampi from saline- and kainate-treated rats 7 d after treatment are illustrated in Figure11. Hippocampi from control animals revealed a mixed population of neurons in the hilus, and the CA3 pyramidal cell layers were tightly packed (Fig.11A–D). In contrast, hippocampi from kainate-treated rats had fewer neurons in the hilus and showed extensive gliosis. The greatest difference in the number of hilar neurons was observed in sections from the temporal end of the hippocampus (Fig. 11, compareD, H). Cresyl violet staining also revealed neuronal loss in the CA3 pyramidal layers of most kainate-treated rats (Fig. 11E–H); however, these neurons were not quantified.
Fig. 11.
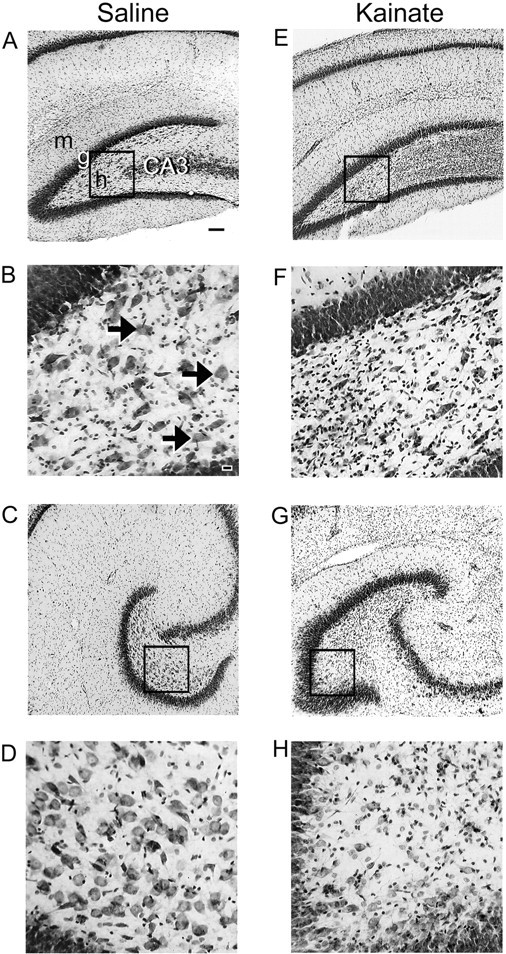
Cresyl violet-stained hippocampal sections of saline- and kainate-injected rats (A–D vsE–H) 7 d after treatment. Sections from the septal one-third of the hippocampus (A, B, E, F) show partial loss of hilar neurons in a kainate-treated rat (E, F) versus severe loss at the temporal one-third (G, H). Compare the larger number of neurons in the hilus and the more tightly packed CA3 pyramidal cell layer in the control rat relative to the prominent gliosis in the hilar region and the loss of CA3 pyramidal cells in the kainate-treated rat. Thearrows point to neurons located in the hilus, and theboxed regions are magnified in the bottom panels. m, Molecular layer; g, granule cell layer; h, hilus; CA3, CA3 pyramidal cell layer. Scale bars: A, C,E, G, 100 μm; B,D, F, H, 20 μm.
Through the septotemporal axis of the hippocampus, saline-treated rats revealed intense Timm staining in the hilus that extended to the proximal dendrites of the CA3 pyramidal cells at 7 d after treatment (Fig. 12A). Little to no dark reaction product was detected in the inner molecular layer of the dentate gyrus. From control rats, 201 of 203 (99%) hippocampal sections had a Timm score of 0 or 1 (Fig.12B). The mean Timm score was 0.06 ± 0.04 (± SEM) in saline-treated rats. Timm staining in kainate-treated rats was primarily concentrated in the hilus; however, an occasional strand of reaction product projected through the granule cell layer and into the molecular layer. The majority (96%; 262 of 274) of hippocampal sections from kainate-treated rats had a Timm score of 0 or 1 in the inner molecular layer, and the overall mean Timm score was 0.4 ± 0.15 (± SEM). Therefore, very little Timm reaction product was observed in the inner molecular layer in both control and kainate-treated rats.
Fig. 12.
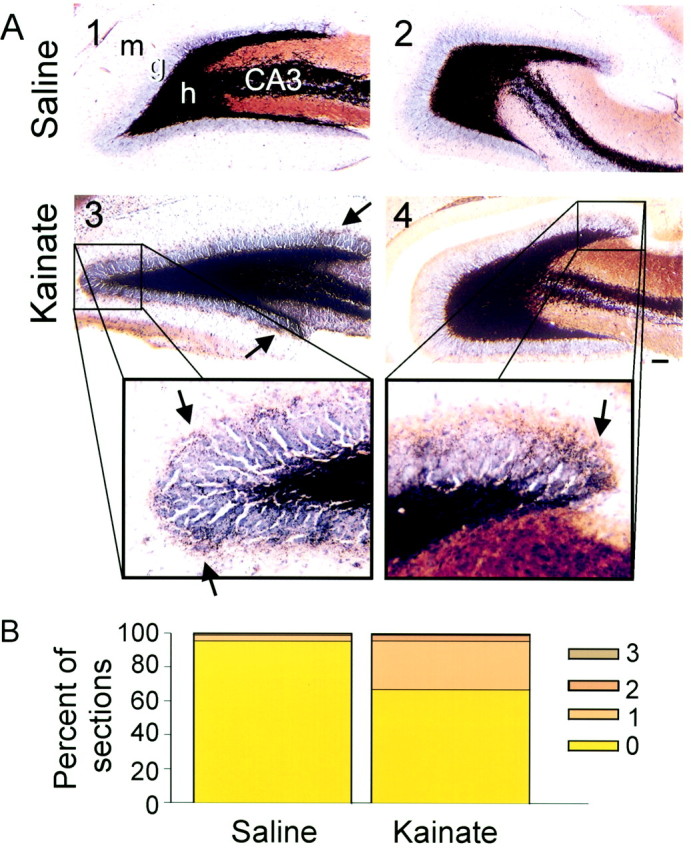
Timm- and cresyl violet-stained hippocampal sections of saline- and kainate-injected rats 7 d after treatment. Sections from a control rat at the septal (A1) and temporal one-thirds (A2) of the hippocampus lack dark reaction product in the inner molecular layer of the dentate gyrus. In a kainate-treated rat, the septal (A3) and temporal sections (A4) have slight but detectable Timm staining in the granule cell layer and molecular layer (arrows indicate dark reaction product in the inner molecular layer). Scale bar, 100 μm. B, In both controls and kainate-treated rats, most hippocampal sections (99 and 96%, respectively) had a Timm score of 0 or 1 (Tauck and Nadler, 1985).
We quantified hilar neuron loss throughout the hippocampus using the optical fractionator method (West et al., 1991). The sections were grouped into thirds (i.e., 0–33%, 34–66%, and 67–100%) by percent distance from the septal end to determine hilar population and mean Timm score (see Materials and Methods). Hippocampal sections from controls had few hilar neurons at the most septal end with progressively more neurons at the temporal pole. Hilar neuron counts in kainate-treated rats were significantly smaller compared to controls throughout the septotemporal distance (p < 0.005; Student's t test; Fig.13A). There was also a significant increase in abnormal Timm staining in sections from kainate-treated rats compared to controls (p < 0.0005; Student's t test; Fig. 13B). Although our kainate-treated rats had neuronal loss at 7 d after treatment, they had relatively little Timm staining in the inner molecular layer compared to rats with kainate-induced epilepsy (Buckmaster and Dudek, 1997a,b).
Fig. 13.

Septotemporal distribution of hilar neurons and Timm staining in control (n = 6, filled circles) and kainate-treated rats (n = 8,open circles). A, Saline-treated rats had more cresyl violet-stained neurons in the temporal pole (100% septotemporal distance) compared to the septal pole (0% septotemporal distance). However, there were significantly fewer neurons in all three regions of the hippocampi in kainate-treated rats (p < 0.005; Student's ttest). B, Similarly, the difference in the mean Timm score between controls and kainate-treated rats was small but significant (p < 0.0005; Student'st test). Error bars represent SEM, and some means are smaller than the data point symbol. The asterisksrepresent significant differences between data point pairs.
Relationship between the percentage of recovery and mean Timm score
From in vivo experiments, Sloviter (1992) observed that kainate-treated rats showed a loss of inhibition that was later restored months after treatment, when robust mossy fiber reorganization was present. This result led to the hypothesis that robust mossy fiber reorganization, months after kainate treatment, leads to restored or increased inhibition in the dentate gyrus. Therefore, we decided to assess if the recovery of inhibition in our study was associated with mossy fiber reorganization in the inner molecular layer at 7 d after kainate treatment. The two measurements that had a significant change after kainate treatment (i.e., number of population spikes and field PSP) were used for this analysis. Pearson's correlation coefficient was used to determine the relationship between the amount of recovery versus mean Timm score. To ascertain the amount of recovery, the before-treatment response was subtracted from the responses at 1 and 7 d after treatment. These differences were then used to produce the percentage of the response at 7 d relative to the response at 1 d after treatment (Fig.14A). The amount of Timm reaction product in the inner molecular layer of the dentate gyrus was determined throughout the septotemporal axes of the hippocampi of each rat (see Materials and Methods). Only those rats used for histology at 7 d after kainate treatment were used for this analysis (n = 9).
Fig. 14.

Recovery of the duration of the field PSP.A, Graphical representation of how the amount of recovery in the duration of the field PSP was measured. The original field PSP duration is shown in the top trace. This length was subtracted from the field PSP duration at 1 and 7 d after treatment. The duration of the field PSP was prolonged 1 d after treatment. The bottom trace shows that at 7 d after treatment, the abnormal length of the field PSP recovered by 82%. B, At 7 d after treatment, the relationship between the percentage of recovery and the mean Timm score showed a significant negative correlation (Pearson's r = −0.88; p = 0.0036).
A linear regression analysis was performed on the recovery of the field PSP duration and the mean Timm score (Fig. 14B). This analysis was dependent on the amount of recovery in the length of the field PSP; therefore, only rats with a change between the first day after treatment and before treatment were used. The percentage of recovery of the field PSP was found to be negatively correlated to the amount of Timm staining in the inner molecular layer of the dentate gyrus (Pearson's r = −0.88; Fig.14B). This association was found to be highly significant (p = 0.0036; linear regression). Six of eight rats had little to no Timm staining 7 d after kainate treatment (range, 0.0–0.55 Timm score). These six rats also had a large recovery in the duration of the field PSP. The two remaining kainate-treated rats that had the greatest amount of mossy fiber reorganization in the inner molecular layer 7 d after treatment (i.e., Timm score >1) also had the least amount of recovery. When a linear regression analysis was performed on the recovery of the number of population spikes and the mean Timm score, no correlation was found (Pearson's r = 0.13; p = 0.75; data not shown). Therefore, these results suggest that mossy fiber reorganization in the inner molecular layer may not be the primary mechanism for the restoration of inhibition in the septal dentate gyrus.
DISCUSSION
These histological, electrophysiological, and behavioral studies during the first week after kainate treatment (i.e., multiple intraperitoneal injections) provide information about: (1) hilar neuron loss and Timm staining in the inner molecular layer throughout the hippocampus, (2) the presence of interictal spikes and the state of synaptic inhibition in the septal dentate gyrus, and (3) the occurrence of motor seizures. Chronic recordings showed profound electrographic status epilepticus in the septal hippocampus during repeated low-dose injections of kainate. Three different field-potential measures revealed little or no depression of inhibition in some kainate-treated rats. When inhibition was reduced, partial-to-full recovery of inhibition occurred within the first week after kainate-induced status epilepticus. In spite of significant loss of hilar neurons, relatively little Timm stain was observed in the inner molecular layer at 7 d after treatment. The recovery of inhibition that did occur during the first week after kainate-induced status epilepticus was not directly correlated with the amount of Timm staining in the inner molecular layer; therefore, recovery of inhibition appeared independent of mossy fiber reorganization. Finally, >80% of the animals had no motor seizures during the first week after treatment, even though this kainate-treatment protocol has been shown to cause epilepsy in nearly all treated rats (Hellier et al., 1998). Overall, these studies suggest that hilar neuron loss (i.e., endfolium sclerosis) alone is not related to motor seizure generation, recovery of synaptic inhibition does not appear to be related to mossy fiber reorganization, and an initial reduction of inhibition does not seem to be required for epileptogenesis.
Pathophysiological events during and after kainate treatment
The rationale of using multiple low-dose injections of kainate was to prolong the status epilepticus while minimizing mortality (i.e., 5–15%; Hellier et al., 1998). This study confirmed that kainate-treated rats experience electrographic status epilepticus in the septal dentate gyrus during this treatment protocol (i.e., electrographic seizures were recorded in the dentate gyrus between motor seizures). These recordings showed that kainate-treated rats have continuous convulsive and nonconvulsive seizures for many hours, even after the injections have ceased. Interictal spikes were also observed in 94% of the kainate-treated rats throughout the 1 week testing period. In the eight rats that were allowed to survive, interictal spikes were observed for many months after kainate treatment, when the animals displayed spontaneous motor seizures (i.e., were epileptic). The interictal spikes generally resembled those observed in humans with temporal lobe epilepsy (Quesney et al., 1993). We sampled spontaneous electrographic activity for 2 min intervals, which was sufficient to assess the presence of interictal spikes and estimate their frequency. Further studies with longer sampling periods are needed to determine if the interictal spikes in kainate-treated rats show the state dependence known to occur in humans with temporal lobe epilepsy (Drury, 1996). Nonetheless, the protocol of repeated low-dose injections of kainate caused profound electrographic status epilepticus, which was immediately followed by the maintained occurrence of interictal spikes in the septal dentate gyrus and surface EEG.
Hilar neuron loss and mossy fiber reorganization
One week after kainate treatment, the number of hilar neurons was significantly reduced, and slight but distinct Timm staining was seen in the inner molecular layer compared to controls. The percentage of reduction in hilar neurons appeared similar but less than in a previous study conducted on rats with kainate-induced epilepsy (i.e., 35 vs 52%; Buckmaster and Dudek, 1997b). Although both studies were conducted with quantitative and unbiased stereological techniques, statistical comparison is probably not valid because the studies were done independently, and the methods were not identical. Although the Timm staining in the inner molecular layer was significant at 1 week after kainate treatment, it was minimal compared to the robust staining seen months later when the rats are epileptic (Buckmaster and Dudek, 1997b). Unlike hilar neuron counts, in which differences from control levels can be difficult to detect by visualization alone, a slight increase in Timm stain in the inner molecular layer above control levels is readily discernible. In this histological analysis performed 1 week after kainate treatment and the previous study conducted months after kainate treatment on rats with documented evidence of spontaneous motor seizures, the differences in hilar neuron numbers and Timm staining occurred preferentially at the temporal end of the hippocampus, but were also present throughout most of the hippocampus (Buckmaster and Dudek, 1997a,b).
Seizures during the first week after kainate treatment
The 24 hr video monitoring showed that 81% of the kainate-treated rats had no spontaneous motor seizures during the first week after kainate-induced status epilepticus. In the remaining animals (n = 5 of 26), two rats experienced one or two motor seizures within the first 27 hr after treatment, but they did not have any seizures during the subsequent 6 d. The presence of seizures 1 d after kainate treatment may be a characteristic of status epilepticus (DeLorenzo et al., 1998) rather than indicative of a short latent period. The other three rats had their first seizure activity 5 or 7 d after treatment, and these seizures were followed by others, thus suggesting that the latent period in this model is likely to be as short as 5–7 d, when slight but significant Timm staining can be detected in the inner molecular layer. Thus, spontaneous motor seizures may begin in some animals long before robust Timm staining is present in the inner molecular layer, and it is unlikely that epileptogenesis depends solely on hilar neuron loss and mossy fiber reorganization.
Changes in inhibition after kainate treatment
The advantages of chronic in vivo recordings are that: (1) the animal is its own control (i.e., baseline activity can be compared before and after treatment), (2) spontaneous activity can be recorded while the animal is freely moving, (3) several repeated measurements can be made over many days in each rat, and (4) control animals have stable responses throughout the testing period. However, the methods used for measuring inhibition during chronic recording are indirect, and so three independent approaches were used.
The number of hippocampal population spikes generally increases when inhibition is reduced. The number of population spikes was significantly increased 1 d after kainate treatment (i.e., from 1–2 d before kainate treatment to 2 or 3 d after treatment), and partially recovered by the end of the week. The duration of the field PSP was also used to assess changes in inhibition, but recovery of this measure during the first week was negatively correlated with Timm stain in the inner molecular layer. Although prolongation of the field PSP may represent a reduction of inhibition, these enhanced field PSPs may also be the result of increased inhibitory currents or enhanced excitatory responses (possibly caused by diminished inhibitory currents). Late components of field potentials often reflect simultaneous and complex synaptic excitation and inhibition, thus making this analysis more difficult to interpret. Although paired-pulse stimulation is the most widely used measure of inhibition in vivo, it requires that the amplitude of the first response be the same throughout the testing period. Multiple population spikes and prolonged field PSPs confound analyses, because they may indirectly alter the response to the second stimulus (e.g., by inactivating voltage-sensitive ion channels). Subtle physiological changes that were not detected with the extracellular recordings, however, may be important.
Most slice electrophysiological studies have been performed in the temporal hippocampus, which is thought to be more epileptogenic. Forin vivo recordings, however, electrophysiological experiments are much more difficult in the more ventral and vertically oriented temporal hippocampus. Hilar neuron loss was less severe in the septal hippocampus, but transient electrographic abnormalities were still recorded. Pathophysiological changes, however, may be greater in the temporal hippocampus.
Recovery of inhibition
Neuronal loss in the hippocampus has been hypothesized to cause basket cells (i.e., inhibitory neurons) to become dormant (Sloviter, 1991), suggesting why feedback inhibition is decreased a few days after kainate treatment (Sloviter, 1992). In the current study we used similar techniques as used by Sloviter (1992), however the changes in the number of population spikes, field PSP duration, and paired-pulse index were primarily observed only during the first day after kainate treatment (Fig. 9). We used three relatively independent measures that revealed little or no change in inhibition, and inhibition recovered within 4–8 d after kainate-induced status epilepticus in most animals. Therefore, the transient hyperexcitability may not be solely caused by the lack of excitatory input to the basket cells in the septal hippocampus, but may also be caused by several other mechanisms, such as changes in GABA (Kapur and MacDonald, 1997) and NMDA receptors (Sayin et al., 1999). The time course of recovery of inhibition, however, was not clearly related to mossy fiber reorganization. Therefore, mossy fiber reorganization may not be the primary mechanism for restoration of inhibition, and mossy fiber sprouting may even inhibit the reinstitution of inhibition (Fig. 14B). Nonetheless, mossy fiber reorganization progresses for weeks and months after kainate treatment, and these data do not address the issue of whether it contributes to increased inhibition at later periods (Sloviter, 1991; Buckmaster and Dudek, 1997a).
The pathophysiological abnormalities observed in the septal dentate gyrus are only part of a series of complex changes that occur in multiple sites within the hippocampus and limbic system. Studies in other models have shown that inhibition in the dentate granule cell layer is relatively maintained, whereas other regions show loss of inhibition and enhanced excitation (Bekenstein and Lothman, 1993; Rempe et al., 1995, 1997). Enhanced sensitivity to excitatory input may play a more significant role than changes of inhibition.
Footnotes
This research was supported by National Institutes of Health Grant NS 16683 (F.E.D.) and the Veterans Affairs Medical Research Service (G.M.R.). We thank A. Hansen and E. Hernandez for technical assistance. We are grateful to A. Fails, K. Suter, P. Williams, and J.-P. Wuarin for their comments on an earlier draft of this manuscript. We thank E. Swiss for word processing.
Correspondence should be addressed to F. Edward Dudek, Department of Anatomy and Neurobiology, Colorado State University, Fort Collins, CO 80523. E-mail: edudek@cvmbs.colostate.edu.
Dr. Patrylo's present address: Section of Neurosurgery, Yale University School of Medicine, 333 Cedar Street, TMP 4, New Haven, CT 06520.
Dr. Rose's present address: Neuroscience Drug Discovery, Bristol-Myers Squibb Company, 5 Research Parkway, Wallingford, CT 06492.
REFERENCES
- 1.Babb TL, Kupfer WR, Pretorius JK, Crandall PH, Levesque MF. Synaptic reorganization by mossy fibers in human epileptic fascia dentata. Neuroscience. 1991;42:351–363. doi: 10.1016/0306-4522(91)90380-7. [DOI] [PubMed] [Google Scholar]
- 2.Bekenstein JW, Lothman EW. Dormancy of inhibitory interneurons in a model of temporal lobe epilepsy. Science. 1993;259:97–100. doi: 10.1126/science.8093417. [DOI] [PubMed] [Google Scholar]
- 3.Ben-Ari Y. Limbic seizures and brain damage produced by kainic acid: Mechanisms and relevance to human temporal lobe epilepsy. Neuroscience. 1985;14:375–403. doi: 10.1016/0306-4522(85)90299-4. [DOI] [PubMed] [Google Scholar]
- 4.Buckmaster PS, Dudek FE. Network properties of the dentate gyrus in epileptic rats with hilar neuron loss and granule cell axon reorganization. J Neurophysiol. 1997a;77:2685–2696. doi: 10.1152/jn.1997.77.5.2685. [DOI] [PubMed] [Google Scholar]
- 5.Buckmaster PS, Dudek FE. Neuron loss, granule cell reorganization, and functional changes in the dentate gyrus of epileptic kainate-treated rats. J Comp Neurol. 1997b;385:385–404. [PubMed] [Google Scholar]
- 6.De Jonge M, Racine RJ. The development and decay of kindling-induced increases in paired-pulse depression in the dentate gyrus. Brain Res. 1987;412:318–328. doi: 10.1016/0006-8993(87)91139-5. [DOI] [PubMed] [Google Scholar]
- 7.DeLorenzo RJ, Waterhouse EG, Towne AR, Boggs JG, Ko D, DeLorenzo GA, Brown A, Garnett L. Persistent nonconvulsive status epilepticus after the control of convulsive status epilepticus. Epilepsia. 1998;39:833–840. doi: 10.1111/j.1528-1157.1998.tb01177.x. [DOI] [PubMed] [Google Scholar]
- 8.Dudek FE, Spitz M. Hypothetical mechanisms for the cellular and neurophysiologic basis of secondary epileptogenesis: proposed role of synaptic reorganization. J Clin Neurophysiol. 1997;14:90–101. doi: 10.1097/00004691-199703000-00002. [DOI] [PubMed] [Google Scholar]
- 9.Drury I. Activation procedures. In: Wyllie E, editor. The treatment of epilepsy: principles and practice, Ed 2. Williams and Wilkins; Baltimore: 1996. pp. 251–263. [Google Scholar]
- 10.Engel J. Seizures and epilepsy. F.A. Davis; Philadelphia: 1989. [Google Scholar]
- 11.French JA, Williamson PD, Thadani VM, Darcey TM, Marson RH, Spencer SS, Spencer DD. Characteristics of medial temporal lobe epilepsy: I. Results of history and physiology examination. Ann Neurol. 1993;34:774–780. doi: 10.1002/ana.410340604. [DOI] [PubMed] [Google Scholar]
- 12.Hellier JL, Dudek FE. Spontaneous motor seizures of rats with kainate-induced epilepsy: effect of time of day and activity state. Epilepsy Res. 1999;35:47–57. doi: 10.1016/s0920-1211(98)00127-2. [DOI] [PubMed] [Google Scholar]
- 13.Hellier JL, Patrylo PR, Buckmaster PS, Dudek FE. Recurrent spontaneous motor seizures after repeated low-dose systemic treatment with kainate: assessment of a rat model of temporal lobe epilepsy. Epilepsy Res. 1998;31:73–84. doi: 10.1016/s0920-1211(98)00017-5. [DOI] [PubMed] [Google Scholar]
- 14.Houser CR, Miyashiro JE, Swartz BE, Walsh GO, Rich JR, Delgado-Escueta AV. Altered patterns of dynorphin immunoreactivity suggest mossy fiber reorganization in human hippocampal epilepsy. J Neurosci. 1990;10:267–282. doi: 10.1523/JNEUROSCI.10-01-00267.1990. [DOI] [PMC free article] [PubMed] [Google Scholar]
- 15.Kapur J, MacDonald RL. Rapid seizure-induced reduction of benzodiazepine and Zn2+ sensitivity of hippocampal dentate granule cell GABAA receptors. J Neurosci. 1997;17:7532–7540. doi: 10.1523/JNEUROSCI.17-19-07532.1997. [DOI] [PMC free article] [PubMed] [Google Scholar]
- 16.Maru E, Goddard GV. Alteration in dentate neuronal activities associated with perforant path kindling. III enhancement of synaptic inhibition. Exp Neurol. 1987;96:46–60. doi: 10.1016/0014-4886(87)90167-1. [DOI] [PubMed] [Google Scholar]
- 17.Milgram NW, Yearwood T, Khurgel M, Ivy GO, Racine R. Changes in inhibitory processes in the hippocampus following recurrent seizures induced by systemic administration of kainic acid. Brain Res. 1991;551:236–246. doi: 10.1016/0006-8993(91)90938-r. [DOI] [PubMed] [Google Scholar]
- 18.Nadler JV. Kainic acid as a tool for the study of temporal lobe epilepsy. Life Sci. 1981;29:2031–2042. doi: 10.1016/0024-3205(81)90659-7. [DOI] [PubMed] [Google Scholar]
- 19.Nadler JV, Perry BW, Cotman CW. Selective reinnervation of hippocampal area CA1 and the fascia dentata after destruction of CA3-CA4 afferents with kainic acid. Brain Res. 1980;182:1–9. doi: 10.1016/0006-8993(80)90825-2. [DOI] [PubMed] [Google Scholar]
- 20.Patrylo PR, Dudek FE. Physiological unmasking of new glutamatergic pathways in the dentate gyrus of hippocampal slices from kainate-induced epileptic rats. J Neurophysiol. 1998;79:418–429. doi: 10.1152/jn.1998.79.1.418. [DOI] [PubMed] [Google Scholar]
- 21.Quesney LF, Risinger MW, Shewmon DA. Extracranial EEG evaluation. In: Engel J, editor. Surgical treatment of the epilepsies, Ed 2. Raven; New York: 1993. pp. 173–195. [Google Scholar]
- 22.Racine RJ. Modification of seizure activity by electrical stimulation: II. Motor seizures. Electroencephalogr Clin Neurophysiol. 1972;32:281–294. doi: 10.1016/0013-4694(72)90177-0. [DOI] [PubMed] [Google Scholar]
- 23.Rempe DA, Mangan PS, Lothman EW. Regional heterogeneity of pathophysiological alterations in CA1 and dentate gyrus in a chronic model of temporal lobe epilepsy. J Neurophysiol. 1995;74:816–826. doi: 10.1152/jn.1995.74.2.816. [DOI] [PubMed] [Google Scholar]
- 24.Rempe DA, Bertram EH, Williamson JM, Lothman EW. Interneurons in area CA1 stratum radiatum and stratum oriens remain functionally connected to excitatory synaptic input in chronically epileptic animals. J Neurophysiol. 1997;78:1504–1515. doi: 10.1152/jn.1997.78.3.1504. [DOI] [PubMed] [Google Scholar]
- 25.Sayin U, Rutecki P, Sutula T. NMDA-dependent currents in granule cells of the dentate gyrus contribute to induction but not permanence of kindling. J Neurophysiol. 1999;81:564–574. doi: 10.1152/jn.1999.81.2.564. [DOI] [PubMed] [Google Scholar]
- 26.Shumate MD, Lin DD, Gibbs JW, III, Holloway KL, Coulter DA. GABA(A) receptor function in epileptic human dentate granule cells: comparison to epileptic and control rat. Epilepsy Res. 1998;32:114–128. doi: 10.1016/s0920-1211(98)00045-x. [DOI] [PubMed] [Google Scholar]
- 27.Sloviter RS. Permanently altered hippocampal structure, excitability, and inhibition after experimental status epilepticus in the rat: the “dormant basket cell” hypothesis and its possible relevance to temporal lobe epilepsy. Hippocampus. 1991;1:41–66. doi: 10.1002/hipo.450010106. [DOI] [PubMed] [Google Scholar]
- 28.Sloviter RS. Possible functional consequences of synaptic reorganization in the dentate gyrus of kainate-treated rats. Neurosci Lett. 1992;137:91–96. doi: 10.1016/0304-3940(92)90306-r. [DOI] [PubMed] [Google Scholar]
- 29.Spencer DD, Spencer SS. Hippocampal resections and the use of human tissue in defining temporal lobe epilepsy syndromes. Hippocampus. 1994;4:243–249. doi: 10.1002/hipo.450040303. [DOI] [PubMed] [Google Scholar]
- 30.Sutula T, Cascino G, Cavazos J, Parada I, Ramirez L. Mossy fiber synaptic reorganization in the epileptic human temporal lobe. Ann Neurol. 1989;26:321–330. doi: 10.1002/ana.410260303. [DOI] [PubMed] [Google Scholar]
- 31.Tauck DL, Nadler JV. Evidence of functional mossy fiber sprouting in hippocampal formation of kainic acid-treated rats. J Neurosci. 1985;5:1016–1022. doi: 10.1523/JNEUROSCI.05-04-01016.1985. [DOI] [PMC free article] [PubMed] [Google Scholar]
- 32.West MJ, Slomianka L, Gundersen HJG. Unbiased stereological estimation of the total number of neurons in the subdivisions of the rat hippocampus using the optical fractionator. Anat Rec. 1991;231:482–497. doi: 10.1002/ar.1092310411. [DOI] [PubMed] [Google Scholar]
- 33.Wuarin J-P, Dudek FE. Electrographic seizures and new recurrent excitatory circuits in the dentate gyrus of hippocampal slices from kainate-treated epileptic rats. J Neurosci. 1996;16:4438–4448. doi: 10.1523/JNEUROSCI.16-14-04438.1996. [DOI] [PMC free article] [PubMed] [Google Scholar]