

Abstract
Primary olfactory neurons project their axons to the olfactory bulb, where they terminate in discrete loci called glomeruli. All neurons expressing the same odorant receptor appear to terminate in a few glomeruli in each olfactory bulb. In the P2-IRES-tau-LacZ line of transgenic mice, LacZ is expressed in the perikarya and axons of primary olfactory neurons that express the P2 odorant receptor. In the present study, we examined the developmental appearance of P2 neurons, the topographical targeting of P2 axons, as well as the formation of P2 glomeruli in the olfactory bulb. P2 axons were first detected in the olfactory nerve fiber layer at embryonic day 14.5 (E14.5), and by E15.5 these axons terminated in a broad locus in the presumptive glomerular layer. During the next 5 embryonic days, the elongated cluster of axons developed into discrete glomerulus-like structures. In many cases, glomeruli appeared as pairs, which were initially connected by a fascicle of P2 axons. This connection was lost by postnatal day 7.5, and double glomeruli at the same locus were observed in 85% of adult animals. During the early postnatal period, there was considerable mistargeting of P2 axons. In some cases P2 axons entered inappropriate glomeruli or continued to grow past the glomerular layer into the deeper layers of the olfactory bulb. These aberrant axons were not observed in adult animals. These results indicate that olfactory axons exhibit errors while converging onto a specific glomerulus and suggest that guidance cues may be diffusely distributed at target sites in the olfactory bulb.
Keywords: olfactory, P2 receptor, glomerulus, development, topography, guidance
Primary olfactory neurons reside in the olfactory neuroepithelium lining the nasal cavity and project axons via the olfactory nerve to the olfactory bulb in which they terminate in discrete tufts of neuropil referred to as glomeruli. Each olfactory neuron appears to stochastically express one of at least 1000 different types of odorant receptor proteins. All neurons expressing the same protein are mosaically distributed within one of four longitudinally oriented zones in the nasal cavity (Ressler et al., 1993; Vassar et al., 1993; Strotmann et al., 1994a,b). The current dogma is that axons from primary olfactory neurons expressing the same receptor converge onto one or two glomeruli of a possible 1800 glomeruli in each olfactory bulb (Royet et al., 1988; Ressler et al., 1994).
In 1996, Mombaerts et al. developed a transgenic mouse line in which the axons of a subpopulation of primary olfactory neurons expressing a specific odorant receptor could be visualized by histochemical staining for β-galactosidase. The coding region of the P2 odorant receptor gene was replaced with a construct encoding the P2 receptor and a recombinant fusion protein consisting of the tau microtubule-associated protein and β-galactosidase. Histochemical staining for β-galactosidase allowed the trajectory of axons to be traced because the tau-β-galactosidase fusion protein was anterogradely transported. The P2 odorant receptor is expressed exclusively by neurons in zone three of the olfactory epithelium [according to the nomenclature of Buck and Axel (1991)], and the axons of these neurons project to one lateral and one medial glomerulus per olfactory bulb. When the P2 gene was deleted by homologous recombination, P2 axons failed to form glomeruli (Wang et al., 1998). Moreover, when the coding region of the P2 gene was substituted with the coding region of M12, an odorant receptor expressed in zone one, P2 axons formed glomeruli in aberrant locations (Mombaerts et al., 1996). Together, these results indicate that odorant receptors play a role in axon guidance; however, it remains unclear whether they are directly or indirectly involved.
Despite our understanding of the topography of the primary olfactory projection, we have no clear picture of the principal morphological or cellular events involved in the development of glomeruli innervated by axons expressing the same odorant receptor. In the present study, we have analyzed the development of the P2 subpopulation of primary olfactory neurons in the olfactory neuroepithelium, as well as their projections to the olfactory bulb using the P2-internal ribosome entry site (FRES)-tau-LacZ line of transgenic mice (Mombaerts et al., 1996). We show that P2 axons begin to target a specific site in the olfactory bulb as early as embryonic day 15.5 (E15.5) and that the P2 glomerulus arises from an initially broad locus that contains a mixed subpopulation of axons. In many cases, two glomeruli arise from a single site, and axons exhibit mistargeting by overshooting the glomerular layer or by projecting into inappropriate neighboring glomeruli. Thus, the P2 glomerulus emerges slowly and involves considerable axonal reorganization to achieve the highly topographical projection observed in adults.
MATERIALS AND METHODS
Animals. Homozygous P2-IRES-tau-LacZ transgenic mice (Mombaerts et al., 1996) were mated overnight, and seven embryos were collected at daily intervals from E12.5 to E18.5. The day of a positive sperm dam was designated E0.5. Seven mice were also collected on each of the following postnatal (PD) days: PD0.5, PD3.5, PD5.5, PD7.5, and PD14.5. The day of birth was designated PD0.5. Seven adults (12 weeks) were also collected. Animals were killed by cervical dislocation, and heads were fixed in 4% paraformaldehyde for 30 min at room temperature and then stored in 30% sucrose at 4°C for 48 hr. PD14.5 and adult tissue were fixed for 4 hr at room temperature and decalcified in 20% EDTA at 4°C for 1 and 3 weeks, respectively. Tissue was then embedded in O.C.T. compound (Sakura Finetek USA Inc., Torrance, CA) and frozen, and serial coronal 60 μm cryostat sections were collected on 2% gelatin and 0.1% chrome alum-coated slides.
5-Bromo-4-chloro-3-indolyl-β-d-galactropyranoside histochemistry. Sections were washed for three 20 min periods in wash buffer (0.1 m phosphate buffer, 2 mm MgCl2, 5 mm EGTA, 0.02% Nonidet P-40, and 0.01% sodium deoxycholate) and then incubated at 37°C for 1.5 hr with stain buffer [0.1 m phosphate buffer, 2 mm MgCl2, 5 mm EGTA, 0.02% Nonidet P-40, 0.01% sodium deoxycholate, 1 mg/ml 5-bromo-4-chloro-3-indolyl-β-d-galactropyranoside (X-gal) (Austral, Victoria, Australia), and 5 mmpotassium ferrocyanide]. The reaction was stopped with three 5 min washes of PBS. Because sections were 60-μm-thick, it was not possible to visualize glomerular boundaries using a nuclear counterstain. Consequently, after dehydration, sections were counterstained in 0.1% eosin for 9 sec. Three animals from each age were examined.
Immunohistochemistry. Serial sections from four animals at each age were incubated for 30 min in 2% bovine serum albumin (Sigma, St. Louis, MO) in Tris-buffered saline (TBS) containing 0.3% Triton X-100. Sections were then incubated overnight at 4°C with rabbit anti-β-galactosidase antiserum (1:300, 5 Prime → 3 Prime Inc., Boulder, CO) and goat anti-olfactory marker protein (OMP) (Keller and Margolis, 1975) in TBS containing 0.3% Triton X-100. Sections were washed in TBS containing 0.3% Triton X-100 (three 5 min washes) and incubated for 2 hr at room temperature with donkey anti-rabbit immunoglobulins conjugated to tetramethylrhodamine isothiocyanate (TRITC) (1:100; Jackson ImmunoResearch, West Grove, PA) and donkey anti-sheep immunoglobulins conjugated to FITC (1:50; Jackson ImmunoResearch) in TBS containing 0.3% Triton X-100. Sections were subsequently washed in TBS (three 5 min washes) and then mounted in glycerol. Fluorescence images were collected using a Bio-Rad (Hercules, CA) MRC 1024 confocal laser scanning microscope, with the 40 and 63× oil immersion lenses. Z-series images for TRITC and FITC were collected every 1.5 μm through the depth of the section and merged. Optical sectioning revealed continuity of staining throughout the depth of the section. A total of 12 glomeruli were analyzed at each age.
Image analysis. Digital images of X-gal-stained sections were collected using a SPOT cooled color digital camera and SPOT 32 software (Diagnostic Instruments Inc., Sterling Heights, MI) with a 10× objective lens. Because sections were 60-μm-thick, some regions of the photographs appear out of focus. An estimate of the volume of P2 glomeruli in adults was obtained by summing the cross sectional area of P2 glomeruli in serial sections using the Image Pro Plus computer program (Media Cybernetics, Bethesda, MD).
The number of P2 neurons was quantified by analyzing serial X-gal-stained sections of three animals at each age. Only P2 neuronal perikarya projecting a dendrite were counted to prevent counting the same neuron twice. A P2 neuron was considered to be in a cluster if it was less than one cell width (10 μm) from an adjacent P2 cell. A cluster consisted of three or more neurons in this configuration.
To determine the percentage of glomeruli exhibiting exuberant growth, confocal images were assessed for the presence of axons deep to the glomerular layer. The boundary between the glomerular layer and external plexiform layer boundary was defined by OMP, and even at the earliest ages analyzed, there was a clear boundary between these layers.
The distribution of P2 neurons in the nasal cavity was depicted in camera lucida drawings obtained using a 10× objective lens. Images were traced and scanned into Adobe Photoshop version 5 (Adobe Systems, San Jose, CA) and compiled in CorelDraw version 8 (Corel Corporation Ltd., Dublin, Ireland).
RESULTS
Expression of P2 in the olfactory neuroepithelium
Topology
The distribution of primary olfactory neurons that express the P2 odorant receptor protein (P2 neurons) was analyzed in P2-IRES-tau-LacZ homozygous transgenic mice from E12.5 to adults. Serial coronal sections were cut through the heads of these mice and histochemically stained for β-galactosidase to reveal P2 neurons. At E12.5, the nasal cavity consists of a simple chamber and a single rudimentary turbinate, ectoturbinate 2 (Fig. 1). There are few P2 neurons at E12.5; approximately three to five perikarya are present in each section of the nasal cavity. At E14.5, P2 neurons are clumped at the tips of both ectoturbinate 2 and the newly emerged and more caudally located ectoturbinate 3 (Fig.1B,C). Both of these turbinates fuse caudally with the roof of the nasal cavity (data not shown).
Fig. 1.

Camera lucida images detailing the distribution of P2 neurons in the olfactory neuroepithelium at different rostrocaudal levels. Cryostat sections were stained using X-gal histochemistry, and sections were chosen based on morphological detail. Regions of P2 expression were demarcated by black bands on camera lucida drawings. Each age is represented by the right nasal cavity only. Scale bar, 500 μm. 1, 2,3, and 4 refer to ectoturbinates 1, 2, 3, and 4, respectively; I, II, andIII refer to endoturbinates I, II, and III, respectively.
Between E14.5 and E16.5, the morphology of the nasal turbinates becomes considerably more complex. At E16.5, four new turbinates have emerged. Ectoturbinate 1 has protruded from the roof of the nasal cavity (Fig.1D), resulting in the separation of P2 neurons into two distinct clusters (Fig. 1E, arrows). A rudimentary endoturbinate II has formed at E16.5; however, it does not possess any P2 neurons. Endoturbinate III arises from the ventrolateral wall of the nasal cavity, and ectoturbinate 3 now produces a small lateral recess when it fuses with the roof of the nasal cavity (Fig.1F, arrowhead). Consequently, P2 neurons on the tip of ectoturbinate 3 (Fig. 1E) become continuous with the lateral cluster of P2 neurons in the roof neuroepithelium (Fig. 1E, open arrow). Caudally, ectoturbinate 4 (Fig. 1F) has projected into the nasal cavity. The P2 neurons on the tip of this turbinate fuse with the medial cluster of P2 neurons (Fig. 1F,open arrow), on the roof of the nasal cavity.
There is little change in either the morphology of the nasal cavity or the distribution of P2 neurons between E16.5 and E18.5. The only notable difference is that the medial end of ectoturbinate 2 has flattened, splitting its cluster of P2 into two groups (Fig.1G, arrowheads). At PD0.5, the roof of the nasal cavity broadens, and the lateral cluster of P2 neurons has divided (Fig. 1K, arrows). Ectoturbinate 2 has protruded further into the nasal cavity and fuses caudally with the roof of the nasal cavity (data not shown). The P2 neurons present on the tip of this ectoturbinate then become continuous with the P2 neurons on the roof of the neuroepithelium. At PD7.5, ectoturbinate 3 and endoturbinate III have increased in size, resulting in the separation of P2 clusters on both of these turbinates into two groups. There is very little change in the distribution of P2 neurons between PD7.5, PD14.5, and adults, except for separation of clusters on ectoturbinate 2 (Fig. 1S,W,arrowheads), ectoturbinate 4 (Fig. 1U,arrowheads), and endoturbinate II (Fig. 1W,arrows). In summary, this spatiotemporal analysis has revealed that the complex distribution pattern of P2 neurons observed in adults emerges from a simple band of P2 neurons at E12.5. As the nasal cavity enlarges and new turbinates are added, the P2 neurons appear in individual sections to become partitioned into segregated clusters. However, analysis of serial sections reveals that P2 neurons are distributed in continuous bands that merge along the rostrocaudal axis of the nasal cavity.
Quantification
The number of P2 neurons was determined by counting all LacZ stained perikarya in serial sections throughout the length of the nasal cavity in three animals at each time point from E12.5 to adults (Fig.2). There were 50 P2 neurons at E12.5 when the rostrocaudal length of the nasal cavity was 0.57 mm. This number gradually increased to 390 by E16.5, at which time the nasal cavity was 2.75-mm-long. During this same time period, there was also a considerable increase in the complexity of the nasal cavity (Fig. 1) and hence cross-sectional area of the olfactory neuroepithelium. By PD1.5, there were 1185 positive neurons present, which was greater than a 20-fold increase from E12.5. Although the number of P2 neurons continued to increase postnatally, the rate of increase was clearly reduced. Between PD1.5 and PD7.5, P2 neurons had merely doubled in number. In adults, there were 13,729 P2 neurons, representing an ∼10-fold increase over levels at PD1.5. It is interesting to note that, in the rat, there is a corresponding decrease in the total number of proliferating neurons throughout the same period (Weiler and Farbman, 1997).
Fig. 2.

Quantification of the total number of P2 neurons in both the left and right nasal cavities at different ages. The number of neurons was seen to increase with age, the largest rise occurring during embryogenesis. Three animals were counted at each age. Error bars represent SEM. Where error bars appear to be absent, errors were too small to be depicted.
P2 neurons are restricted to a discrete annular band in the nasal cavity, referred to as zone three, from as early as E12.5 (Fig.3A). Previous studies have indicated that primary olfactory neurons expressing a specific receptor are randomly dispersed as individual neurons within zones (Buck and Axel, 1991; Ressler et al., 1993; Vassar et al., 1993). However, our qualitative analysis throughout the entire nasal cavity revealed that, although P2 neurons are widely dispersed, they are either present as individual neurons (Fig. 3B,E) or located in small clusters (Fig. 3C,D). We semiquantified the presence of clusters by counting P2 neurons found in a group of three or more and whose perikarya were directly apposed or less than one cell diameter apart (Fig. 3C). It should be noted that our values may be underestimated because it was not possible to maintain continuity in counts between adjacent sections. Nonetheless, this analysis revealed that there were developmental and maturational changes in the spatial relationship between P2 neurons across the tangential surface of the neuroepithelium. For instance, 4% of all P2 neurons were clustered at E14.5, whereas this value increased to 12% at PD3.5. The level of clustering subsequently decreased, reaching an adult-like level of 6% (Table1).
Fig. 3.
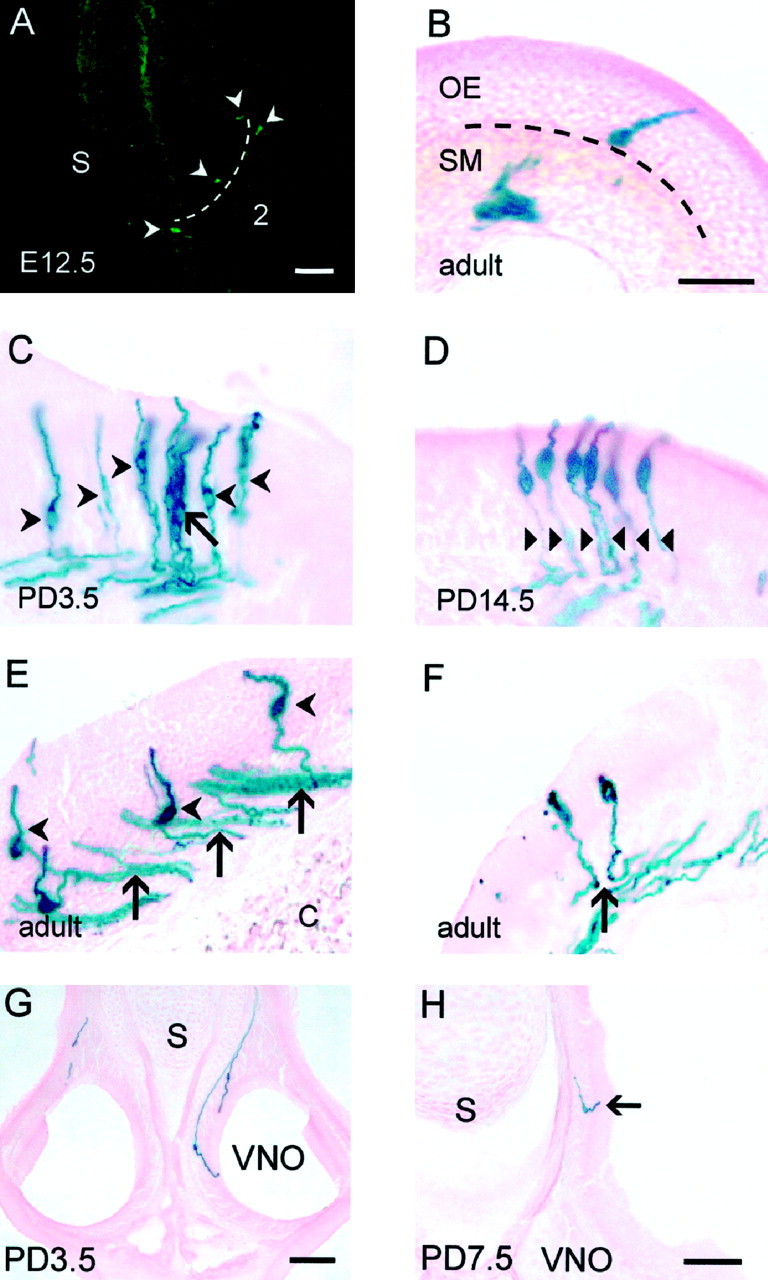
Analysis of the distribution of P2 neurons and their axonal projections. Coronal cryostat sections were stained using X-gal immunohistochemistry (A) and X-gal histochemistry (B–F, I).A, P2 was expressed in neurons (arrowheads) found in zone three (indicated bybroken line) of the olfactory neuroepithelium at E12.5.B, A lone P2 neuron with its cell body at the base of the olfactory neuroepithelium in adult. C, A cluster of P2 neurons at PD3.5 (arrow) are distinct from adjacent individual neurons (arrowheads). Individual neurons were identified by focusing through the thick section. D, Axons expressing P2 do not fasciculate (arrowheads) as they pass through the olfactory neuroepithelium (PD14.5).E, Once P2 axons have exited the olfactory neuroepithelium, they form numerous small bundles within the submucosa (arrows) in adult. Arrowheads depict widely separated perikarya. F, Adjacent P2 neurons send their axons in opposite directions (arrow) in the submucosa (adult). G, H, P2 neurons in other sensory neuroepithelia. Coronal cryostat sections were stained using X-gal histochemistry. G, Two neurons expressing P2 are seen in the vomeronasal organ (PD3.5). H, At PD7.5, a P2 neurons is present in the organ of Masera (arrow). Scale bar, 100 μm. C, Cartilage; OE, olfactory epithelium; S, nasal septum;SM, submucosa; VNO, vomeronasal organ;2, ectoturbinate 2.
Table 1.
Percentage of neurons found in clusters and the percentage of glomeruli with axons deep to the glomerular layer in three animals at each age
| Age | Percent of neurons clustered | Percent beyond |
|---|---|---|
| E14.5 | 4 | — |
| E16.5 | 3 | 56 |
| E18.5 | 8 | 58 |
| PD0.5 | 7 | 53 |
| PD3.5 | 12 | 54 |
| PD5.5 | 8 | 37 |
| PD7.5 | 9 | 20 |
| Adult | 6 | 0 |
P2 neurons were also observed in small numbers in other regions of the nasal cavity. Two to three P2 neurons were observed in the vomeronasal organ of all animals from E16.5 (Fig. 3G) and in the organ of Masera from E14.5 (Fig. 3H).
Projection of P2 axons in the olfactory nerve
We next examined the trajectory of the P2 axons between the nasal cavity and the olfactory bulb. P2 axons did not fasciculate as they exited the basal layers of the olfactory neuroepithelium, even when they arose from neurons in close apposition (Fig. 3D,arrowheads). There did not appear to be any correlation between position of perikarya in the neuroepithelium and the trajectory of axons in the submucosa. In some cases, axons clearly diverged into different fascicles (Fig. 3F, arrow). P2 axons penetrated the cribriform plate at numerous points along the anteroposterior axis of the nasal cavity. Axons arising from the nasal septum passed through the medial surface of the cribriform plate, whereas those emerging from the lateral neuroepithelium entered the nerve fiber layer through the lateral region of the cribriform plate.
Targeting of P2 axons to glomeruli
Topology
To investigate the formation of glomeruli by P2 axons, serial sections of embryonic tissue were double-labeled with antisera to β-galactosidase and OMP and then analyzed by confocal microscopy. P2 axons were first observed in the nerve fiber layer at E14.5. By E15.5, P2 axons had targeted a specific region on both the medial and lateral surfaces of the olfactory bulb (Fig.4A,B). However, unlike at E14.5, these axons had exited the nerve fiber layer and penetrated the underlying glomerular layer in which they terminated diffusely. Double labeling with OMP antiserum revealed that P2 axons were intermingled with axons expressing other receptors in the presumptive glomerular layer (Fig. 4B,arrow). At E17.5, the P2 axons began to cluster and target a specific region in the glomerular layer (Fig. 4C). By E18.5, the P2 axons had formed two to three tufts that were interconnected by bundles of axons (Fig. 4D, arrows). Between E18.5 and PD7.5, these tufts either condensed and formed a single glomerulus or instead separated into two discrete glomeruli that were connected by a bundle of axons (Fig. 4E). By PD14.5, all interconnected glomeruli had separated and formed discrete glomeruli (Fig. 4F). Mombaerts et al. (1996) reported that <5% of adult mice possess two glomeruli innervated by P2 axons at the same locus. In contrast, we found that interconnected glomeruli were present at all ages between PD0.5 and PD7.5 and that double glomeruli were found in 85% of adults examined. These glomeruli appeared as an adjacent pair or were separated by up to five glomerular widths from their partner. Double glomeruli were also three times more likely to be present on the medial rather than on the lateral surface of the bulb. In some adults, extra glomeruli formed in the posterior ventromedial region of the olfactory bulb (Fig.5A,B). These glomeruli were only partially innervated by P2 axons (Fig.5C,D). The P2 axons terminated in a discrete subregion of the glomerulus, either with a diffuse (Fig. 5C) or dense (Fig. 5D) distribution.
Fig. 4.
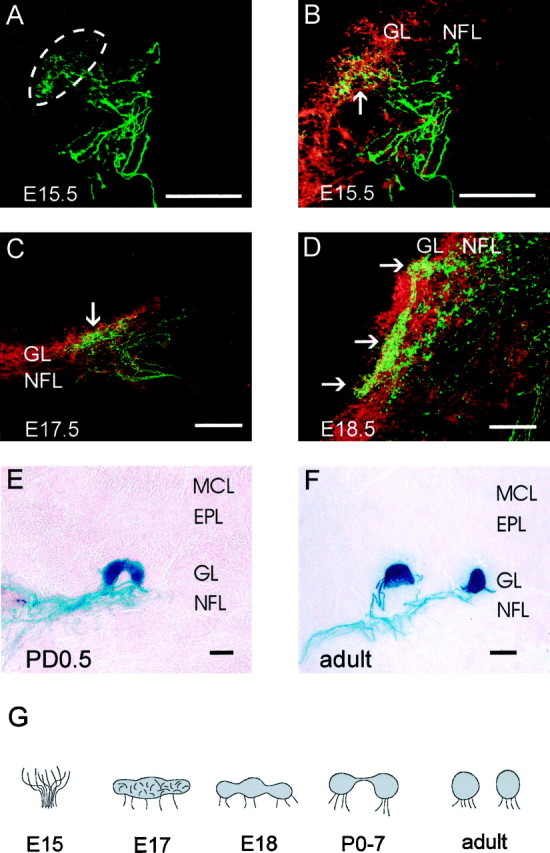
Development of glomeruli in the olfactory bulb. A–D, Double-label immunohistochemistry of coronal cryostat sections stained for β-galactosidase (green) and OMP (red). A single image for β-galactosidase is presented in A, and merged images for OMP and β-galactosidase are presented in B–D. B is the same section as A. E, F, Coronal cryostat sections stained with X-gal histochemistry. A, Confocal image of β-galactosidase at E15.5 reveals P2 axons are diffusely dispersed within a localized area of the olfactory bulb (dotted lines). B, Identical tissue section asA, disclosing both OMP and β-galactosidase, shows dispersed axons in the glomerular layer (arrow).C, By E17.5, P2 axons have begun to condense in the glomerular layer. D, At E18.5, individual glomeruli become visible (arrows) but remain connected by large bundles of axons. E, A glomerulus adopts a rounded morphology by PD0.5, although it remains joined by a band of axons.F, In the adult, glomeruli are completely separated.G, Schematic representation of double-glomerular development. Scale bar, 50 μm. EPL, External plexiform layer; GL, glomerular layer; MCL, mitral cell layer; NFL, nerve fiber layer.
Fig. 5.

A–D, Partial innervation of glomeruli by P2 axons. Coronal cryostat sections stained for X-gal histochemistry. C and D are high-power images of A and B, respectively.A, C, P2 axons are seen to completely innervate the target medial glomerulus (filled arrow), whereas P2 axons are dispersed throughout a subregion of the extra glomerulus (open arrow). B,D, A subregion of the extra glomerulus is innervated by P2 axons (the glomerular border is defined by a broken line). Scale bar, 100 μm.
Some primary olfactory axons have been observed to extend beyond the boundary of the target glomerulus and inappropriately penetrate the external plexiform layer during both the embryonic and early postnatal periods (Key and Akeson, 1993; Tenne-Brown and Key, 1999). To investigate whether P2 axons display similar aberrant trajectories, serial sections of olfactory bulb were double-labeled with antisera against β-galactosidase and OMP. Between E16.5 and PD7.5, individual P2 axons were observed to project through the glomerular layer and into the external plexiform layer. These axons were always OMP-negative and either bypassed their target glomerulus or passed directly through the glomerulus. Analysis of compiled scans collected through the thickness of the section at PD3.5 revealed that some misguided P2 axons coursed over the surface of adjacent P2-negative glomeruli (Fig.6A,B,arrows). At PD7.5, misguided axons were observed to branch (Fig. 6C,D, arrows), some axons coursed radially toward the mitral cell layer (Fig.6E,F, arrowheads), whereas others appeared to turn around and project back toward the P2 glomerulus (Fig. 6A–D, arrowheads). As animals increased in age from PD0.5 to PD7.5, the extent of exuberant growth decreased until it was no longer present in adults (Table 1). Our analysis of compiled scans through the topographically fixed glomeruli revealed that P2 axons arborized throughout the whole width and depth of glomeruli.
Fig. 6.
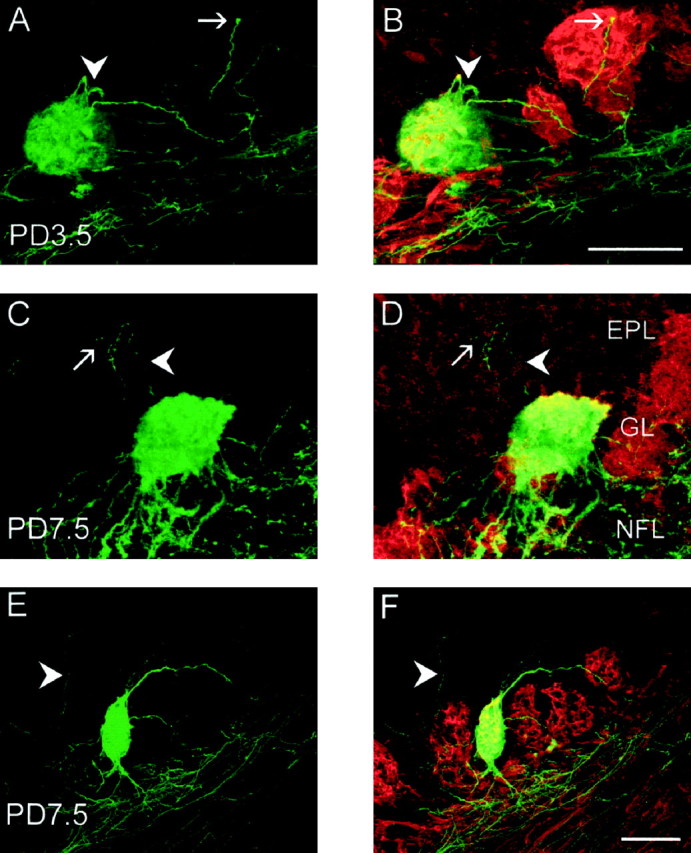
A–F, Behavior of axons targeting glomeruli in the early postnatal period. Coronal cryostat sections immunostained for β-galactosidase (green) and OMP (red). A, C, andE are single images of β-galactosidase staining only;B, D, and F are merged images of β-galactosidase and OMP. A,B, At PD3.5, the growth cone of a P2 axon (arrow) is seen at the surface of an adjacent P2-negative glomerulus. Axons loop back into the target glomerulus (arrowhead). C, D, At PD7.5, a P2 axon exits the target glomerulus (arrowhead), enters the mitral cell layer, and turns back to the glomerular layer. This axon also branches deep to the glomerular layer (arrow). E,F, At PD7.5, a P2 axon (arrowhead) passes through the glomerular layer and heads toward the mitral cell layer. Scale bars, 100 μm. EPL, External plexiform layer;GL, glomerular layer; NFL, nerve fiber layer.
Mombaerts et al. (1996) suggested that the topographical position of P2 glomeruli along the rostrocaudal axis remained constant between animals. We determined the position of the P2 glomeruli in both the left and right olfactory bulbs of three adult animals by measuring the distance from the rostral pole of the bulb to the beginning of the lateral glomerulus and from the rear of this glomerulus to the beginning of the medial glomerulus. This analysis revealed that the positions of the P2 glomeruli were topographically fixed within ∼180 μm; the lateral glomerulus was 1440 ± 75 μm from the front of the bulb, and the medial bulb was 770 ± 90 μm caudal to this position.
DISCUSSION
Although P2 axons target specific loci in the olfactory bulb as early as E15.5, we show that discrete glomeruli emerge slowly and that navigational errors occur for up to the next 10 d of development. In addition to terminating in two topographically fixed glomeruli, there are many instances in which P2 axons also innervate seemingly inappropriate extra glomeruli. In some cases, P2 axons converge onto subregions of these extra glomeruli, indicating that an individual glomerulus is innervated by distinct subpopulations of axons expressing different odorant receptor genes.
Previous studies have reported that primary olfactory axons expressing the same odorant receptor project to one of two topographically fixed glomeruli in the olfactory bulb of adult mice (Ressler et al., 1994;Mombaerts et al., 1996; Wang et al., 1998). Real-time analysis of the developing olfactory nerve in zebrafish embryos demonstrated that olfactory axons navigate directly to specific loci in the olfactory bulb (Dynes and Ngai, 1998). This has led to the suggestion that the targeting of these axons to specific glomeruli during development is precise and without error. However, tracing of individual axons in both rats and mice during the formation of glomeruli revealed there are considerable targeting errors (Tenne-Brown and Key, 1999). Our results here clearly demonstrate that the homing of functionally discrete subpopulations of olfactory axons to their glomerular targets is not without error during development. Interestingly, the topographical localization of extra glomeruli that form as a result of aberrant targeting are not fixed in space. This projection pattern has implications for our understanding of olfactory perception because it indicates that the glomerular coding of odorants is not preserved between individuals.
Temporal regulation of P2 receptor expression
Few neurons express P2 in the olfactory neuroepithelium at E12.5, but the number rapidly increased up to E18.5, rising approximately twofold to threefold every 2 d. Although this increase is consistent with the generation of new P2 neurons over time, it is also possible that the P2-IRES-tau-LacZ construct is gradually expressed in a preexisting population of neurons generated early in development. However, the expression of P2 in growing axons in vitro(our unpublished observations) suggests that P2 is expressed in differentiating neurons, which are constantly being produced in the olfactory neuroepithelium. Moreover, the large number of these neurons in the adult supports the de novo generation of P2 neurons throughout development and into adulthood. The number of P2 neurons increased postnatally, doubling between PD1.5 and PD7.5 and again from PD7.5 to PD14.5, which is in agreement with the overall increase in the size of the olfactory bulb in mice and rats during this period (Pomeroy et al., 1990). This continual increase in P2 neurons during the postnatal period may not be typical of all olfactory neuron subpopulations. For instance, the subpopulation of neurons expressing the odorant receptor OR3 remains relatively stable between PD0 and PD20 (Nef et al., 1992).
Non-stochastic mechanisms for neuronal specification
The number of neurons in the adult has been determined for the murine olfactory receptor subfamilies K4, K7, and K18 (Ressler et al., 1993). Each of these subfamilies contains between 10 and 15 different receptor genes. The total number of neurons in both sides of the animal expressing these receptors varied from ∼4500 to 8200 and was considerably lower than the 13,729 we observed in adult P2 mice. Thus, there appears to be considerable variability in the number of neurons expressing an individual receptor. This variability is not caused by differences between zones because the K4 and K7 subfamilies and the P2 receptor are all expressed in the same zone in the nasal cavity. Moreover, the variability is not a result of interanimal variability because the number of positive P2 receptor neurons present was relatively constant between animals.
What are the mechanisms that control the specification of receptor phenotype? One possibility is that inductive signals from the underlying mesenchyme delineate zonal boundaries in the olfactory neuroepithelium during early embryogenesis. Although the regulatory mechanisms are unknown, it is clear that there are independent processes controlling expression of receptor genes within zones and the selection of one of the four zones within the neuroepithelium (Qasba and Reed, 1998). The choice of zone probably then determines which set of olfactory genes are competent to be expressed. Each neuron within a zone may stochastically express one receptor from a restricted repertoire. However, a purely stochastic mechanism is unlikely because of the wide variability in size of receptor subpopulations within a zone. One would predict that stochastic mechanisms would instead generate subpopulations of similar size, at least within the same zone. Alternatively, it is possible that differences in final number arise because receptors begin to be expressed at different embryonic ages. Perhaps the repertoire is developmentally regulated (Barth et al., 1996) and the size of the receptor population decreases as the onset of expression begins at later embryonic ages. In this case, receptor type could still be stochastically selected, but it would be from a repertoire that changes during development. However, Barth et al. (1996) have shown that the final adult receptor number is independent of when it was first expressed in the olfactory neuroepithelium of zebrafish. Moreover, the K4 subfamily of receptors begins to be expressed at the same age (Sullivan et al., 1995) as the P2 receptor, indicating that final receptor number is not correlated with the time of onset of expression. In summary, it appears that stochastic mechanisms are not operating to choose the receptor expressed from a zonal repertoire.
Formation of glomeruli
Valverde suggested that protoglomeruli delimited by periglomerular cells are apparent at E17 in rat (Santacana et al., 1992; Valverde et al., 1992). These protoglomeruli were defined by anterogradely tracing axons to small defined loci in the olfactory bulb. However, by specifically examining the terminations of P2 axons in the olfactory bulb, we were able to define, for the first time, the major morphological events in the development of a chemically identifiable glomerulus (Fig. 4G). Initially, at E15.5, axons randomly penetrate the presumptive glomerular layer in the region destined to contain the target glomerulus. By E17.5, the axons have compacted, and at E18.5, the outline of single or numerous glomeruli can be recognized in the glomerular layer. When multiple glomeruli are present at the same site, they continue to be interconnected by a thick band of axons up to PD7.5. Individual discrete glomeruli are only observed from this age on. It appears that glomerular cues are initially widespread, which is consistent with recent reports of targeting errors in early postnatal animals (Tenne-Brown and Key, 1999).
Errors in axon targeting
In the present study, we have shown that P2 axons clearly exhibit errors in laminar growth during the early postnatal period, as well as during embryogenesis. At E16.5, P2 axons were observed growing beyond the glomerular layer into the deeper layers of the olfactory bulb. This exuberant growth was present in 55% of specific target sites examined and persisted until PD3.5. After this age, the prevalence of overshooting axons sharply declined. Most notably, mistargeting dropped after P7.5 from 20% to no evidence of mistargeting in adult animals. Although these results suggest that P2 neurons generated during this period do not exhibit as much mistargeting as younger axons, it should be pointed out that fewer axons are probably entering each glomerulus in adults than at early ages. Thus, we may need to examine more animals at these later stages to observe mistargeting.
Our detailed serial section analysis has now revealed that the innervation pattern of P2 axons in the olfactory bulb is more complex than previously described. We have found that P2 axons typically terminate in two to four glomeruli per olfactory bulb. In the P2 mice, there was no consistency in the presence or location of extra glomeruli. A few animals had no extra glomeruli in either bulb, some mice exhibited an extra glomerulus only at the lateral surface of one bulb, whereas other animals possessed extra glomeruli at all sites. The extra glomeruli were more likely to occur in the medial position than the lateral position; however, there was no preference shown for either the left or right bulb. In some cases, extra glomeruli were immediately adjacent, whereas others were separated by at least several glomeruli.
The extra glomeruli vary in size, and analysis of the area of glomeruli in each position revealed the total glomerular area was consistent across both bulbs, suggesting P2 neurons must create a fixed glomerular volume independent of how many glomeruli they form. Previous work has shown glomeruli are innervated by distinct subsets of olfactory neurons (Treloar et al., 1996), and we have confirmed this observation for axons expressing P2 receptors. We observed glomeruli in which P2 axons terminated in subregions. This is the first demonstration that more than one subpopulation of axons expressing different receptors innervate the same glomerulus. It is possible that these glomeruli represent the specific targeting of axons expressing more than one receptor or that the guidance cues for another receptor are so similar to those for P2 that some P2 axons terminate inappropriately.
Footnotes
This work was supported by a National Health and Medical Research Council Grant 970333 to B.K. and by a University of Melbourne Research Scholarship to S.J.R. We thank Dr. P. Mombaerts for providing the P2-IRES-tau-lacZ mice and Dr. F. Margolis for OMP antiserum.
Correspondence should be addressed to Brian Key, Neurodevelopment Laboratory, Department of Anatomical Sciences, University of Queensland, Brisbane, Queensland, 4072 Australia. E-mail:brian.key@mailbox.uq.edu.au.
REFERENCES
- 1.Barth AL, Justice NJ, Ngai J. Asynchronous onset of odorant receptor expression in the developing zebrafish olfactory system. Neuron. 1996;16:23–34. doi: 10.1016/s0896-6273(00)80020-3. [DOI] [PubMed] [Google Scholar]
- 2.Buck L, Axel R. A novel multigene family may encode odorant receptors: a molecular basis for odor recognition. Cell. 1991;65:175–187. doi: 10.1016/0092-8674(91)90418-x. [DOI] [PubMed] [Google Scholar]
- 3.Dynes JL, Ngai J. Pathfinding of olfactory neuron axons to stereotyped glomerular targets revealed by dynamic imaging in living zebrafish embryos. Neuron. 1998;20:1081–1091. doi: 10.1016/s0896-6273(00)80490-0. [DOI] [PubMed] [Google Scholar]
- 4.Keller A, Margolis FL. Immunological studies of the rat olfactory marker protein. J Neurochem. 1975;24:1101–1106. doi: 10.1111/j.1471-4159.1975.tb03883.x. [DOI] [PubMed] [Google Scholar]
- 5.Key B, Akeson R. Distinct subsets of sensory olfactory neurons in mouse: possible role in the formation of the mosaic olfactory projection. J Comp Neurol. 1993;334:1–14. doi: 10.1002/cne.903350306. [DOI] [PubMed] [Google Scholar]
- 6.Mombaerts P, Wang F, Dulac C, Chao SK, Nemes A, Mendelsohn M, Edmondson J, Axel R. Visualising an olfactory sensory map. Cell. 1996;87:675–686. doi: 10.1016/s0092-8674(00)81387-2. [DOI] [PubMed] [Google Scholar]
- 7.Nef P, Hermans-Borgmeyer I, Artières-Pin H, Beasley L, Dionne VE, Heinemann SF. Spatial pattern of receptor expression in the olfactory epithelium. Proc Natl Acad Sci USA. 1992;89:8948–8952. doi: 10.1073/pnas.89.19.8948. [DOI] [PMC free article] [PubMed] [Google Scholar]
- 8.Pomeroy SL, LaMantia A-S, Purves D. Postnatal construction of neural circuitry in the mouse olfactory bulb. J Neurosci. 1990;10:1952–1966. doi: 10.1523/JNEUROSCI.10-06-01952.1990. [DOI] [PMC free article] [PubMed] [Google Scholar]
- 9.Qasba P, Reed RR. Tissue and zonal-specific expression of an olfactory receptor transgene. J Neurosci. 1998;18:227–236. doi: 10.1523/JNEUROSCI.18-01-00227.1998. [DOI] [PMC free article] [PubMed] [Google Scholar]
- 10.Ressler KJ, Sullivan SL, Buck LB. A zonal organization of odorant receptor gene expression in the olfactory epithelium. Cell. 1993;73:597–609. doi: 10.1016/0092-8674(93)90145-g. [DOI] [PubMed] [Google Scholar]
- 11.Ressler KJ, Sullivan SL, Buck LB. Information coding in the olfactory system: evidence for a stereotyped and highly organized epitope map in the olfactory bulb. Cell. 1994;79:1245–1255. doi: 10.1016/0092-8674(94)90015-9. [DOI] [PubMed] [Google Scholar]
- 12.Royet JP, Souchier C, Jourdan F, Ploye H. Morphometric study of the glomerular population in the mouse olfactory bulb: numerical density and size distribution along the rostrocaudal axis. J Comp Neurol. 1988;270:559–568. doi: 10.1002/cne.902700409. [DOI] [PubMed] [Google Scholar]
- 13.Santacana M, Heredia M, Valverde F. Transient pattern of exuberant projections of olfactory axons during development in the rat. Dev Brain Res. 1992;70:213–222. doi: 10.1016/0165-3806(92)90200-g. [DOI] [PubMed] [Google Scholar]
- 14.Strotmann J, Wanner I, Helfrich T, Beck A, Breer H. Rostro-caudal patterning of receptor-expressing olfactory neurons in the rat nasal cavity. Cell Tissue Res. 1994a;278:11–20. doi: 10.1007/BF00305773. [DOI] [PubMed] [Google Scholar]
- 15.Strotmann J, Wanner I, Helfrich T, Beck A, Meinken C, Kubick S, Breer H. Olfactory neurones expressing distinct odorant receptor subtypes are spatially segregated in the nasal neuroepithelium. Cell Tissue Res. 1994b;276:429–438. doi: 10.1007/BF00343941. [DOI] [PubMed] [Google Scholar]
- 16.Sullivan SL, Bohm S, Ressler KJ, Horowitz LF, Buck LB. Target-independent pattern specification in the olfactory epithelium. Neuron. 1995;15:779–789. doi: 10.1016/0896-6273(95)90170-1. [DOI] [PubMed] [Google Scholar]
- 17.Tenne-Brown J, Key B. Errors in laminar growth of primary olfactory axons in the rat and mouse olfactory bulb. J Comp Neurol. 1999;410:20–30. doi: 10.1002/(sici)1096-9861(19990719)410:1<20::aid-cne3>3.0.co;2-t. [DOI] [PubMed] [Google Scholar]
- 18.Treloar H, Walters E, Margolis FL, Key B. Olfactory glomeruli are innervated by more than one distinct subset of primary olfactory neurons in mice. J Comp Neurol. 1996;367:550–562. doi: 10.1002/(SICI)1096-9861(19960415)367:4<550::AID-CNE6>3.0.CO;2-3. [DOI] [PubMed] [Google Scholar]
- 19.Valverde F, Santacana M, Heredia M. Formation of an olfactory glomerulus: morphological aspects of development and organization. Neuroscience. 1992;49:255–275. doi: 10.1016/0306-4522(92)90094-i. [DOI] [PubMed] [Google Scholar]
- 20.Vassar R, Ngai J, Axel R. Spatial segregation of odorant receptor expression in the mammalian olfactory epithelium. Cell. 1993;74:309–318. doi: 10.1016/0092-8674(93)90422-m. [DOI] [PubMed] [Google Scholar]
- 21.Wang F, Nemes A, Mendelsohn M, Axel R. Odorant receptors govern the formation of a precise topographic map. Cell. 1998;93:47–60. doi: 10.1016/s0092-8674(00)81145-9. [DOI] [PubMed] [Google Scholar]
- 22.Weiler E, Farbman AI. Proliferation in the rat olfactory epithelium: age-dependent changes. J Neurosci. 1997;17:3610–3622. doi: 10.1523/JNEUROSCI.17-10-03610.1997. [DOI] [PMC free article] [PubMed] [Google Scholar]