

Abstract
We investigated whether gaze direction modified the pattern of finger movement activation in human cerebral cortex using functional magnetic resonance imaging (MRI). Participants performed a sequential finger-tapping task or made no finger movements while maintaining gaze in the direction of the moving hand (aligned conditions) or away from the location of the moving hand. Functional MR signals, measured in the hemisphere contralateral to the moving hand, revealed finger movement-related activation in primary motor cortex, lateral and medial premotor cortex, and a wide extent of the lateral superior and inferior parietal lobules. In each area, the extent of the finger movement activation increased when static gaze was more aligned with the moving hand compared to when gaze was directed away from the moving hand. These data suggest the existence of large-scale cortical networks related to finger actions and indicate that skeletomotor processing in the cerebral cortex is consistently modified by gaze direction signals.
Keywords: functional magnetic resonance imaging, voluntary hand movement, eye position, motor cortical networks, cerebral cortex, oculcomotor–skeletomotor interactions
In humans, accurate goal-directed reach and grasp movements typically rely on foveal vision (Jeannerod et al., 1992). Ongoing registration of visual percepts with gaze and limb positioning would seem imperative to accomplish this behavior. How these processes evolve within the cerebral cortex is emerging from recent neurophysiological and neuroimaging studies. Neurons in occipital, parietal, and frontal lobes of monkeys change their sensory or motor response properties according to gaze direction, limb position, or alignment with other sensory modalities (Andersen et al., 1990; Fogassi et al., 1992; Boussaoud et al., 1993, 1998; Galletti et al., 1993; Graziano et al., 1994; Boussaoud, 1995; Mushiake et al., 1997; Trotter and Celebrini, 1999). In addition, a number of interconnected regions of cortex can show functional labeling when humans perform tasks requiring concurrent mapping of oculomotor and skeletomotor space (Iacoboni et al., 1997).
Understanding cortical mechanisms of visually guided movement requires identifying brain sites that register visual and motor information. Visual (Felleman and Van Essen, 1991) and motor processing (Rao et al., 1993; Sanes et al., 1995) both engage broad areas of cerebral cortex, but it is less clear how these signals become integrated across the cerebral cortex or subcortical areas for visually guided actions and object manipulation (Wise et al., 1997). Based on recordings in monkeys, visual information within the cortex first appears to be integrated with oculomotor, head, and body representations in posterior parietal cortex (Andersen et al., 1990; Duhamel et al., 1992, 1998;Johnson et al., 1996; Batista et al., 1999). Neurons in posterior parietal cortex alter their response to visual stimuli depending on gaze direction (Andersen et al., 1990; Duhamel et al., 1992, 1997) and to limb and head position (Graziano et al., 1994), indicating that baseline motor states influence properties of multimodal sensory neurons. Projection patterns from parietal lobe to frontal motor cortical areas (Luppino et al., 1993; Tanné et al., 1995; Johnson et al., 1996; Matelli et al., 1998) suggest that this visual motor integration proceeds in parallel across several parietal and frontal regions at once. In support of this view, Graziano et al. (1994)described neurons in the ventral portion of macaque lateral premotor cortex (PMA) that are responsive to both visual and somatic sensory stimuli and also have stable responses when gaze shifts (Graziano and Gross, 1998), indicating that these neurons code in an extraretinal coordinate system. By contrast, gaze angle modifies the directional tuning of arm-related neurons in dorsal PMA when monkeys prepared to reach (Boussaoud, 1995; Boussaoud et al., 1998). Additionally, Mushiake et al. (1997) found similar results for ventral PMA while monkeys moved, but gaze sensitivity did not occur for the sampled neurons in primary motor cortex (MI). Thus, gaze interactions occur for the monkey in several areas ordinarily believed linked to arm movement processing. Similar to the situation in monkey, multiple arm movement-related areas exist in human cortex. However, the direct influence of gaze on movement-related activity in human cortex has not been investigated. Consequently, we used functional neuroimaging techniques to investigate gaze direction effects on the level of activation in human cortex produced by sequential finger movements.
Parts of this paper have been published previously (Sanes et al., 1996).
MATERIALS AND METHODS
Participants. Eleven healthy normal volunteers (aged 20–35 years; six female, five male) were recruited from the Brown University and Beth Israel Deaconess Medical Center communities. All were right-handed as determined by a handedness survey that required participants to rate hand usage preferences for nine common functions, using the choices among always left, usually left, no preference, usually right, and always right. Each item was scored on an integer scale ranging from −2 (corresponding to “always left”) to +2 (corresponding to “always right”) to yield total scores between −18 and + 18. The group mean score (±SEM) was 15.8 ± 0.47, indicating a strong right-handed group tendency. Participants continued in the study after successful screening for contraindications such as bodily ferromagnetic objects and absence of general health problems. Before magnetic resonance imaging (MRI), participants were instructed and trained in the behavioral tasks. All participants gave written informed consent, according to established Institution Review Board guidelines at Brown University and Beth Israel Deaconess Medical Center (Boston, MA; the site of MRI) for human participation in experimental procedures.
Apparatus. A 1.5 T Vision Magnetom MR system (Siemens Medical Systems, Erlangen, Germany) equipped for echoplanar imaging was used for acquiring anatomical and functional MR images. Participants lay supine on a transport for insertion into the MRI system bore with the head resting within a circularly polarized head coil that was used for radio frequency transmission and reception. The nasion was aligned with a laser cross-hair projection, so that each participant's head would be approximately centered in the standing magnetic field of the MR system once within the MR bore. Head movement was minimized by mild restraint and cushioning.
MRI. After shimming the standing magnetic field to account for inhomogeneities introduced by the participant, we acquired a three-dimensional T1-weighted anatomical data set [Siemens MPRAGE; repetition time (TR), 10 msec; echo time (TE), 64 msec; inversion time (TI), 20 msec; 1 mm isotropic voxels] for off-line registration with functionally active sites. Functional MR images were acquired in an axial plane roughly parallel to the body of the corpus callosum using blood oxygenation level-dependent imaging (Kwong et al., 1992) that provides an MR signal likely related to local, aggregate neuronal processing. With this method, physiological changes in the oxygenation state of hemoglobin were used to produce functional maps of brain activation during finger movements. Using a 240 × 360 mm field of view with a 1282 sampling matrix, six or eight 8-mm-thick slices were sampled in a region from the superior convexity to about the level of the inferior frontal sulcus to yield voxels with in-plane resolution of 2.81 × 1.875 mm2 and a volume of 31.6–42.2 mm3. The imaging sequence used a TR of 2 sec and TE of 64 msec. The choice of six or eight slices was based on practical and theoretical considerations. The practical considerations related to limitations of the MR system when the MR data were obtained. From a theoretical perspective, the sampling space covered the arm areas of frontal motor areas (Rao et al., 1993; Sanes et al., 1995) and would also have been expected to sample the appropriate arm movement-related regions of parietal cortex.
Procedures. Functional MR images were obtained while participants alternately performed sequential finger movements or participated in a no-movement condition. The sequential finger movements consisted of finger tapping with the right hand in which the tip of each finger was touched in succession to the tip of the thumb at a rate of two touches per second. This movement rate was chosen to elicit robust yet discrete activation patterns across frontal and parietal motor areas of the cerebral cortex (Sadato et al., 1996;Schlaug et al., 1996). All movements were performed while the participant lay supine with the supinated right arm at the right side of the body. During a no-movement condition, participants lay still, maintained the same arm posture without making any finger movements, and fixed gaze in the instructed direction without thinking of or making any finger movements.
For both the movement and no-movement conditions, participants fixed gaze in one of three directions: leftward 10–15°, central, or rightward 10–15° (Fig.1A). Before MRI, the experimenter assessed each participant's ability to deviate and to maintain gaze by ∼10–15° without rotating the head and to perform sequential finger movements repetitively at 2 Hz for 30 sec. Once transported into the MR system bore, participants fixed gaze using self-selected visual cues on the illuminated ceiling of the bore. Although the experimenters visually monitored each participant's hand movements from the MR control room, no quantitative measures of movement characteristics were obtained. Nevertheless, all participants complied with the instructions and performed the movement task according to continual visual inspection by the experimenters and gaze deviation by a postimaging interview.
Fig. 1.
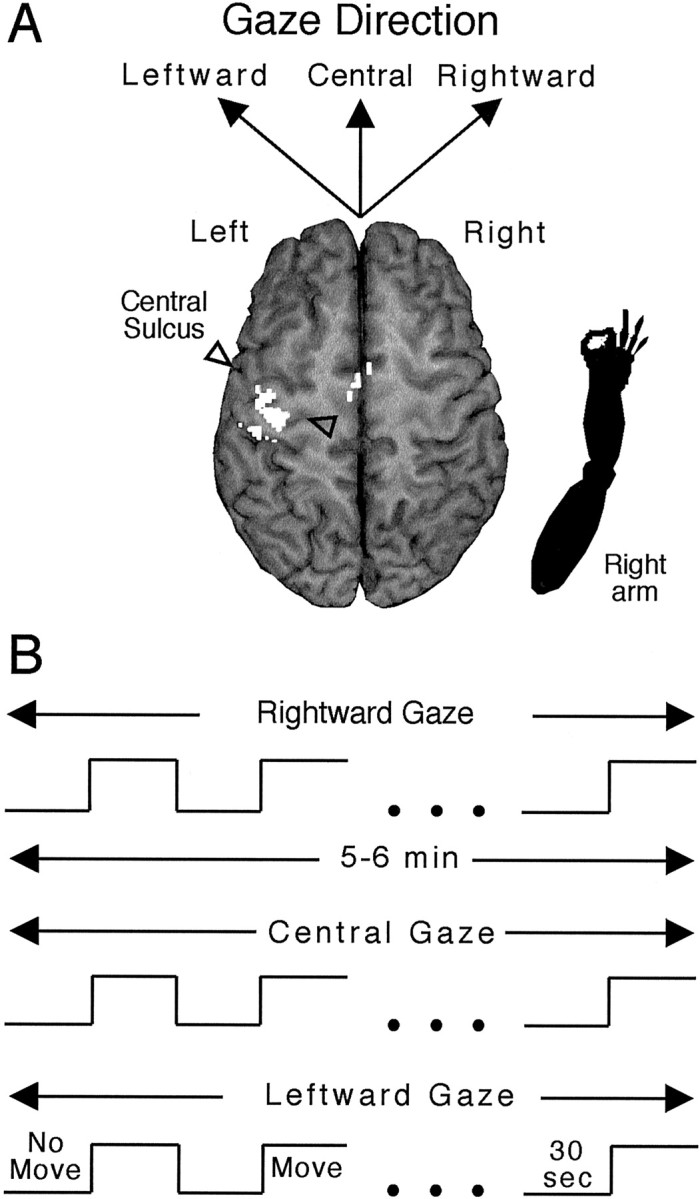
Experimental design. A, Schematic indicating the arm (bottom right) positioned at the right side of a participant, an expected activation in the contralateral hemisphere in motor areas (note area in opaque white in the vicinity of the central sulcus as demarcated by the two outlined triangles), and the three directions of gaze performed separately. B, Time and event lines indicating alternation of no-movement and finger movements for successive 30 sec periods for a total of 5–6 min for each gaze direction. See Materials and Methods for additional details and gaze terminology.
Sequences of successive 30 sec functional MRI measurements were obtained during the movement and no-movement conditions (Fig.1B). A 5–6 sec pause intervened between each condition. A repeating series of movement and no-movement conditions occurred for each direction of gaze. During each 30 sec movement or no-movement condition, 15 functional MR images were obtained for each of the sampled slices. MR data were obtained continuously for 15–18 min during which four or five alternations of 30 sec of the movement and no-movement conditions occurred for each of the three gaze directions. To account for nuisance variables that may have affected the functional MR signal, such as attention, habituation of the functional MR signal related to finger movement, and other global variables, the ordering of gaze direction was counterbalanced across participants. During the pauses between conditions, participants were verbally instructed about the direction of gaze to achieve and whether or not to move the fingers. For the four initial participants, an additional movement condition of repetitive 2 Hz index finger flexion and extension, interleaved among the other conditions, was included along with the sequential finger movement and no-movement conditions. These data are not considered in this report.
Data analysis. UNIX workstations were used for data processing and to create digital representations of the structural and functional MR data. For analysis and visualization, AVS 5.0x (Advanced Visual Systems, Inc., Waltham, MA) was used with a combination of supplied and custom-made processing modules.
We analyzed MR signals occurring in both hemispheres and initially processed the data obtained during each of the three gaze directions independently. The first two volumetric acquisitions were discarded because of MR signal overshoot leaving 13 data points per 30 sec epoch for subsequent analysis and a total of 104 data points for each of three separate analyses (leftward, central, and rightward gaze). The remaining time series of functional MR signal intensity for each voxel in the left hemisphere was correlated with a boxcar reference function to identify differences in MR signal between the movement and no-movement conditions (Fig. 1B;Bandettini et al., 1993). The boxcar reference function cannot readily detect possible response decrements occurring across the 30 sec movements blocks. However, qualitative inspection of the data did not indicate substantial response decrements across the movement periods. The counterbalanced design used for gaze direction across participants (see Procedures) controlled for possible interactions between gaze direction and response decrement. We used a probability threshold ofp ≤ 0.01 to identify voxels exhibiting increases in functional MR signal during finger movements in comparison to no-movement. To protect against type I statistical errors, we used a Bonferroni correction using the total number of voxels in the areas selected for analysis a priori. Across participants, the number of voxels in the regions assessed for a gaze effect on finger movement representations ranged from 3156 to 4896, and these numbers were used to correct the p value for each participant. The corrected p values (0.01/number of pixels × three comparisons) ranged from p = 0.34–0.53 × 10⁻⁷ to yield corrected rvalues from 0.46 to 0.47. We used r = 0.46 as the threshold to identify labeled voxels for all comparisons.
The correlation analysis yielded r maps with thresholded voxels for each gaze direction, hereafter referred to equivalently as label, activation, or the motor representation for a particular gaze direction. For localization of functional sites, the r maps were superimposed onto the three-dimensional structural MR images. We used the individual patterns of cerebral cortical gyri and sulci to determine the anatomic location of labeling (Kretschmann and Weinrich, 1986; Talairach and Tournoux, 1988) in five predefined regions of cerebral cortex; although for two regions we assessed MR label bilaterally. Figure 2Aillustrates the general location of these cerebral cortical regions, and Figure 2B depicts how they were defined on two horizontal slices of a single participant's brain. First, a region that likely corresponds to MI (Brodmann area 4; BA4); this region includes the posterior half of the precentral gyrus, from the fundus of the central sulcus to its lateral surface on each slice. The delineation of MI was straightforward, because the central sulcus was identifiable in MR images from all participants. A second cortical area that we term the lateral premotor area (PMA) likely corresponds to lateral BA6 or homologously PMd of the monkey. PMA includes the anterior half of the precentral gyrus immediately rostral to MI, and the gray matter immediately anterior to the precentral sulcus but not including cortex at the intersection of precentral and superior frontal sulci. Third, the medial frontal gyrus posterior to the vertical anterior commissure line (Talairach and Tournoux, 1988) and anterior to the paracentral lobule that likely corresponds to the posterior portions of medial BA6, that has commonly been termed supplementary motor area (SMA). For MI, PMA, and SMA, the sampled region extended from the topmost slice (at or near the superior convexity) to the bottommost slice with activation, although for SMA the lowest slice did not encroach on the cingulate gyrus. Fourth, the superior parietal lobule (SPL) encompassed cortex medial to the interparietal sulcus, including cortex on the medial wall of the interparietal sulcus, posterior to the postcentral sulcus, anterior to the parietal–occipital sulcus, and lateral to regions around sulci communicating with the central fissure. SPL likely included BA5 and lateral portions of BA7. Fifth, a region we termed the inferior parietal lobule (IPL) that likely encompassed portions of BA39 and BA40 within the angular and supramarginal gyri. The borders of IPL included the interparietal sulcus medially and superiorly, the occipital–parietal sulcus posteriorly and inferiorly (maximally, depending on the sampling extent) when the Sylvian fissure begins to curve superiorly in its anterior-to-posterior course, and the postcentral sulcus anteriorly. MR label in MI and SMA was assessed in both hemispheres, but was assessed only in the contralateral, left hemisphere for PMA, SPL, and IPL because of our judgment of insufficient (from statistical sampling perspectives) labeling in the ipsilateral hemisphere for these three regions.
Fig. 2.
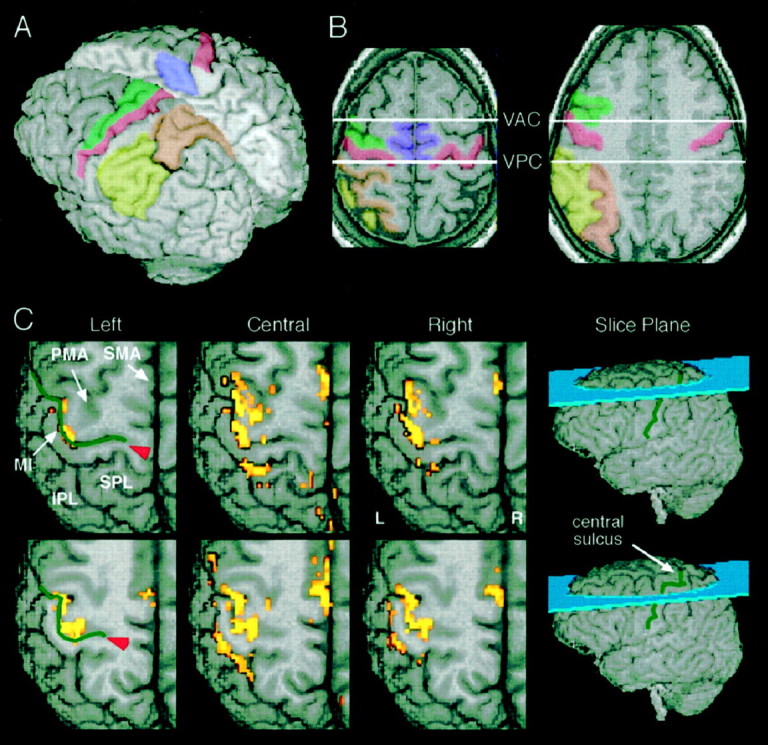
Cerebral cortical regions assessed and exemplar activation patterns. A, B, Color-coded illustration of the cortical regions assessed for functional MR activation. MI in red, PMA in green, SMA in purple, SPL in orange, and IPL inyellow. See Materials and Methods for additional details of sulcal and gyral landmarks defining each region. VAC, Vertical plane through the anterior commissure perpendicular to a line between the anterior and posterior commissures; VPC,vertical plane through the posterior commissure perpendicular to a line between the anterior and posterior commissures. C, Functional MR labeling in two exemplars, slice obtained from a single participant (slice planes indicated on whole brain volumes at right). The least activation occurred for leftward gaze, whereas that for both central and rightward gaze exceeded that for leftward gaze. The images with overlain label depict mostly portions of the left, contralateral hemisphere (L, left; R, right).Red arrowhead indicates fundus of central sulcus (indicated by green lines).
Using software sketching tools for each participant individually, we outlined each cortical region on the relevant slices of functional MR data using the anatomical data as guides. We checked the outlining by comparing parasagittal and horizontal slices using gyral and sulcal anatomy relative to a given region. When a regional border was manually drawn onto a slice of the structural MR image, statistical data characterizing the activation patterns found within that cortical region were obtained for all gaze directions to ensure common regional sampling for each gaze direction. The number of labeled voxels within a cortical region was used as the primary dependent variable for subsequent analyses, although we also obtained MR signal intensity data (see below). Using regression and other inferential statistical methods, the voxel counts were analyzed to assess how gaze direction influenced activation related to finger movements.
In a subsidiary analysis to determine additional aspects of the MR activation pattern, we measured the functional MR signal intensity of activated voxels only within contralateral MI (MIc) and contralateral SMA (SMAc). This analysis was restricted to MIc and SMAc again because of our judgment of small sample sizes in ipsilateral MI (MIi) and ipsilateral SMA (SMAi). For this analysis, we operationally classified voxels as being “gaze-dependent” or “gaze-independent” according to the observations of activation or no-activation of individual voxels. MR signal intensity changes across gaze directions were considered (see below) after making this classification. Independently for MIc and SMAc, the movement-related activation that occurred for leftward gaze became the reference for defining gaze-dependent or gaze-independent voxels. A voxel was classified as gaze-dependent if it had above-threshold MR signal for only one or two gaze directions. By contrast, gaze-independent voxels exhibited greater than baseline MR signal in relation to finger movements for all three gaze directions. We inspected the anatomical distribution of gaze-dependent and gaze-independent voxels. For each voxel, we also calculated the mean percentage increase of functional MR signal for the movement versus the no-movement condition and then compared these values between gaze-dependent and gaze-independent voxels using ANOVA methods. Furthermore, we compared the MR signal intensities for gaze-dependent and gaze-independent voxels obtained during the no-movement condition. Additionally, MR signal intensity was compared across the three gaze directions, to distinguish between two competing models of the cortical response.
RESULTS
Anatomic distribution of activation
Labeling occurred in aggregates most typically containing two or more contiguous voxels distributed primarily across the contralateral, left parietal, and frontal lobes, although labeling also occurred in ipsilateral cortex, particularly in MIi and SMAi. The labeled aggregates were often spatially segregated, even within presumed cytoarchitechtonic fields, to yield a patchy general activation pattern. For example, Figure 2C illustrates the distribution of functional activation obtained from one participant who exhibited typical functional MR labeling occurring in frontal and parietal cortex during finger movements.
Finger movement yielded labeled voxels in the left, and to a lesser extent the right, hemisphere when participants directed gaze toward at least one location for all 11 participants (Table1). Activation occurred in MIc for all participants when gaze was directed to at least one location. Activation of contralateral PMA (PMAc), SMA, SPL (SPLc), and IPL (IPLc) occurred as frequently as that for MIc, although with fewer activated voxels, as will be noted below.
Table 1.
Activation occurrence
| Participant | Cortical area | ||||||
|---|---|---|---|---|---|---|---|
| MIc | MIi | PMAc | SMAc | SMAi | SPLc | IPLc | |
| GA02 | + | + | + | + | + | − | + |
| GA03 | + | + | + | + | + | + | + |
| GA05 | + | + | + | + | + | + | + |
| GA07 | + | + | + | + | + | + | + |
| GA09 | + | + | + | + | + | + | + |
| GA10 | + | + | + | + | + | + | + |
| GA11 | + | +* | + | + | + | + | + |
| GA13 | + | + | + | + | + | + | + |
| GA14 | + | + | +* | +* | +* | + | + |
| GA15 | + | + | + | + | + | + | + |
| GA16 | + | + | +* | + | +* | +* | +* |
Tally of finger movement-related activation for each brain area. A plus sign indicates activation in at least one of the gaze directions; a minus sign indicates absence of movement-related activation.
*≤5 labeled voxels for all gaze directions individually.
Activation in MIc was typically distributed across several slices within each individual. We used the intersection of the fundus of the superior frontal sulcus and the precentral sulcus as an anatomic landmark to assess the superior–inferior extent of MIc labeling. All participants exhibited activation at this junction, and 9 of 11 exhibited label on both the slices superior and inferior to this sulcal intersection. Thus, most participants had MIc label spanning 18–24 mm in the superior–inferior dimension. The distribution of labeled voxels in MIc along the mediolateral dimension was not uniform across participants. However, qualitative inspection of the data indicated that MI activation typically occurred just lateral to the fundus of the central sulcus and extended about half-way toward the lateral surface of the gyrus. Labeling in MIi was sparser, on average about one-eighth the number of activated voxels in comparison to MIc (see quantification below).
Labeling in PMAc, SMAc SMAi, SPLc, and IPLc also occurred in patchy patterns with separate small aggregates of activated voxels or even single voxels interspersed within the borders of each region (Fig.2C). Aggregates of label in PMAc typically distributed along the anterior precentral gyrus and its various branches, most commonly located at or around the intersection of the precentral and superior frontal sulci. In most cases, PMAc activation extended laterally along the anterior half of the precentral gyrus toward the lateral surface. Label in SMAc or SMAi extended over a relatively small area and typically encompassed a single voxel cluster or a few scattered voxels across one or two slices. Activation in IPLc and SPLc most commonly occurred immediately posterior to the postcentral sulcus and in the gray matter, either superior or inferior to the interparietal sulcus.
Areal activation and gaze modulation
The amount of cortical label varied with brain area and gaze direction. Across the gaze directions, participants exhibited the largest areal activation in MIc (79.5 ± 7.1; p ≤ 0.0001; mean of participant means ± SEM; all gaze directions combined). The number of activated voxels decreased progressively for SMAc (22.6 ± 5.6), PMAc (20.45 ± 7.88), IPLc (17.48 ± 3.77), SPLc (16.0 ± 2.82), MIi (10.4 ± 2.5), and SMAi (6.5 ± 3.0). For MIc, MIi, SMAc, and SPLc, all 11 participants exhibited the greatest amount of MR label during either central or rightward gaze (Table 2), with no participant having the greatest activation for leftward gaze in these areas. Although leftward gaze yielded fewer activated voxels, it occasionally resulted in more activated voxels than central or rightward gaze across the sampled cortical regions (Table 2,Left, numbers in parentheses). For PMAc, SMAi, and IPLc, only one participant, although different for the three areas, exhibited the greatest activation for leftward gaze. Across the group of participants and brain areas, the regional volume of movement-related activation obtained during leftward gaze was always less than that obtained during either central or rightward gaze (χ2 ≥ 13.2; p ≤ 0.0005). A similar analysis comparing the regional activation volumes between central and rightward gaze revealed that only MIi showed a group difference in activation for these two directions (p ≤ 0.05; central < rightward). However, this effect in MIi accounted for only 15% of the variance and would be considered statistically weak.
Table 2.
Gaze direction exhibiting the greatest activation
| Gaze direction | ||||
|---|---|---|---|---|
| Left | Central | Right | n | |
| MIc | 0 (1C, 1R) | 5 | 6 | 11 |
| MIi | 0 (0C, 2R) | 8 | 3 | 11 |
| PMAc | 1 (1C, 2R) | 6 | 6 | 11 |
| SMAc | 0 (1C, 3R) | 5 | 6 | 11 |
| SMAi | 1 (2C, 2R) | 6 | 5 | 11 |
| SPLc | 0 (2S, 0R) | 7 | 4 | 10 |
| IPLc | 1 (2S, 2R) | 5 | 6 | 11 |
Numbers indicate frequency of greatest activation for each gaze direction. Ties were tabulated for both gaze directions yielding for some areas a total greater than the number of participants. Numbers in parentheses indicate the number of instances that individual activation for leftward gaze exceeded that either for central (C) or rightward (R) gaze.
Figure 3 illustrates the group results of labeled voxel counts by gaze condition for each cortical region. We quantified the effect of gaze direction on the area of functionally activated cortex by performing a regression analysis including gaze direction, cortical region, and participant as nominal factors and the number of voxels as a continuous dependent variable. The overall regression analysis revealed a main effect of gaze direction on brain activation (p ≤ 0.0001). Subsequent analyses statistically verified that activation area increased significantly for central and rightward gaze relative to leftward gaze (p ≤ 0.05). We found no difference in the number of activated voxels observed when comparing central and rightward gaze (p > 0.05). A power analysis indicated a least significant number of >42 million to approach a significant difference between central and rightward gaze atp ≤ 0.05. Qualitative inspection of the grouped data suggested that gaze direction differentially affected the amount of labeling across cortical areas, but this interaction effect did not reach statistical significance. A power analysis of these data indicated a least significant number of >600,000 to reach a significant gaze direction by area interaction at p ≤ 0.05. Subsidiary analyses also revealed that five of the seven cortical areas assessed exhibited significant changes in areal activation related to gaze direction. An absence of a significant main effect of gaze direction on finger movement-related activation occurred only in SMAi (p = 0.07; power analysis indicated that increase in observations from 33 to 37 observations would likely achieve a p ≤ 0.05), and IPLc (p = 0.23; power analysis indicated a needed increase from 33 to 67 observations).
Fig. 3.

Functional activation. The number of activated voxels in each analyzed brain region for each direction of gaze. All areas exhibited the least amount of activation for leftward gaze.
A further aspect of the maximal areal activation concerns the across region congruence of labeling (Table 3). In addition to the observation that participants exhibited the greatest areal activation for one gaze direction, we found that the activation pattern within a participant could have substantial across-region congruence in cerebral cortex contralateral to the finger movements regarding the direction of gaze that yielded the greatest activation. Figure 2C illustrates this effect qualitatively for a single participant who exhibited the greatest total activation while directing gaze centrally. In analyzing these data quantitatively, we found that MIc, SMAc, PMAc, and SPLc exhibited statistically significant congruencies for all possible between-area pairs across participants. IPLc exhibited this type of congruence pattern for MIc, SMAc, PMAc, but not for SPLc. MIi and SMAi did not exhibit regional congruence for maximal activation in a gaze direction. Across hemispheres, MIc and PMAc exhibited congruence with SMAi, but not with MIi, whereas SPLc exhibited congruence with MIi but not SMAi. In summary, 9 of 10 of the paired comparisons between contralateral cortical areas reached statistical significance (Table 3; χ2 = 14.72; p ≤ 0.0001). In comparison to the congruence of the gaze effect across regions in contralateral cortex, six of nine of these between-area comparisons across the hemispheres did not reach statistical significance (χ2 = 2.04;p > 0.05).
Table 3.
Areal congruence of the gaze direction effect
| Contralateral cortex | Ipsilateral cortex | |||||
|---|---|---|---|---|---|---|
| SMAc | PMAc | SPLc | IPLc | MIi | SMAi | |
| MIc | 11 /11* | 11 /11* | 9 /10* | 9 /11* | 8 /11 | 11 /11* |
| SMAc | 11 /11* | 8 /10* | 9 /11* | 8 /11 | 8 /11 | |
| PMAc | 8 /10* | 11 /11* | 8 /11 | 10 /11* | ||
| SPLc | 7 /10 | 8 /10* | 7 /10 | |||
| IPLc | 5 /11 | 8 /11 | ||||
| MIi | 8 /11 | |||||
Numbers in each table cell indicate the fraction of participants (only those with activation) having the greatest finger movement-related activation for the same gaze direction.
*Indicates rejection of null hypothesis, p ≤ 0.05, see Results for actual p levels.
Gaze dependency of functional MR labeling
General characteristics and anatomic distribution
To determine whether the anatomic distribution of gaze-dependent voxels differed from those of gaze-independent voxels, we qualitatively inspected sets of images depicting the relative locations of the two voxel types across the left hemisphere. Figure4 shows data from two participants, indicating no clear anatomic segregation of voxels with gaze-dependent activation from those with gaze-independent activation in MIc, PMAc, or SMAc or the parietal lobe areas examined. Across all areas, the numbers of gaze-independent voxels were small but tended to be largest in MIc and SMAc. Thus, we decided to restrict subsequent analysis of properties of gaze-independent and gaze-dependent voxels to MIc and SMAc. In MIc, all 11 participants exhibited gaze-dependent and gaze-independent voxels. For SMAc, all 11 participants had gaze-dependent voxels, and 8 of 11 had gaze-independent voxels, although an additional two of these eight participants had <10 gaze-independent voxels.
Fig. 4.

Spatial distribution for gaze-independent and gaze-dependent voxels. Exemplar activation patterns from two participants (one slice each in left and right panels), illustrating the intermixing of gaze-independent and gaze-dependent voxels across brain regions. Voxels indicated inwhite correspond to gaze-independent, and those inblack correspond to gaze-dependent. White triangle indicates the interparietal sulcus; white triangle with a black outline indicates SMAc;black triangle with white outlineindicates MIc.
Model of gaze modulation
How gaze direction affected finger movement-related activation might be explained by considering two competing models (Fig.5). For both models, we have assumed that the labeled voxels, along with a larger population of subthreshold voxels, comprise a Gaussian distribution of MR signal intensity. For the leftward gaze task, the labeled voxels occur within the central, above-threshold portion of the total voxel distribution (Fig. 5,left). The relative increase of the activation volume during central and rightward gaze could have resulted either from an expansion effect (Fig. 5, center) or an increase in the height or gain effect (Fig. 5, right) of the response function. Both effects would yield more suprathreshold voxels. However, the resulting average suprathreshold MR signal would differ between the two possible effects, with the expansion effect yielding little change or a decrease in average suprathreshold MR signal, whereas the gain effect must yield an increase in suprathreshold MR signal. Figure 5 (center) illustrates that for the expansion effect, only the voxels on the tails of the label distribution would exhibit MR signal increase. In contrast, a gain effect predicts that all labeled voxels would show increased MR signal (Fig. 5, right) for central and rightward gaze. Empirical data can distinguish between these two possible models of how gaze modulates movement-related MR signal, but only if the labeled voxels form two classes; gaze-dependent and gaze-independent voxels (see Materials and Methods for definitions of this classification).
Fig. 5.

Model of gaze-independent and gaze-dependent voxels. Hypothetical distributions of MR signal intensity for the sampled voxels for different gaze directions. Theleftmost distribution represents MR signal obtained during leftward gaze. The voxels passing the statistical criteria for identification as “activated” would fall between the twohorizontal dashed lines and exhibit the highest MR signal intensity for the entire distribution. The centerand rightmost distributions represent possible response functions that could explain the observed data, with the dashed lines remaining as that for leftward gaze. Additional details in Results.
MR signal intensity
Collapsed across all gaze directions, the percentage increase in functional MR signal related to finger movement was greater for gaze-independent than for gaze-dependent voxels (p ≤ 0.005, data not shown, but apparent from Fig. 6). Analysis of the individual M1c data revealed that all 11 participants exhibited a higher percentage functional MR signal change for gaze-independent voxels than that observed for the gaze-dependent voxels (p values < 0.01). For the six participants with >10 gaze-independent voxels in SMAc, the obtained percentage functional MR signal change was greater for gaze-independent than for gaze-dependent voxels (p values < 0.01). The mean functional MR signal obtained during the no-movement condition did not differ between gaze-independent and gaze-dependent voxels in M1c and SMAc (data not shown).
Fig. 6.

Gaze-related MR signal intensity. The percentage increase in movement-related (vs no-movement) in MR signal intensity is illustrated for MIc (A) and SMAc (B) for each of the gaze directions and for the two classes of activated voxels; gaze-dependent and gaze-independent. No differences in MR signal were observed for the gaze-independent voxels in either MIc or SMAc. By contrast, MR signal obtained from labeled voxels in MIc and SMAc in increased for the gaze-dependent voxels when participants looked in a sector of visual space that yielded more active voxels.
An analysis of functional MR signal intensity using gaze direction and voxel type (independent or dependent) as nominal factors indicated that the percentage increase in functional MR signal for gaze-dependent voxels differed between leftward and central gaze (p ≤ 0.05; Fig. 6, left). This finding has consistency with the model of both expansion and gain effects. By contrast, MR signal did not differ across gaze directions for the gaze-independent voxels (Fig. 6, right), nor did gaze direction affect the baseline MR signal (data not shown). Taken together, these findings have consistency with the expansion model of the cortical response function.
DISCUSSION
The current results indicate that gaze direction modulates movement-related activation in frontal and parietal cortex. We found that the greatest activation occurred while participants directed gaze either centrally or rightward to the hemisphere controlling the movement. Moreover, the gaze direction for which an individual exhibited the greatest activation remained congruent across several cortical regions, suggesting existence of coordinated neuronal networks spanning parietal and frontal lobes to register eye and hand movements. In contrast, MR signal intensity was only marginally affected by gaze direction. Neither the baseline MR signal nor the relative increase of MR signal occurring during movements varied with gaze position. Along with other behavioral and neurophysiology results (Boussaoud, 1995;Mushiake et al., 1997; Boussaoud et al., 1998; Henriques et al., 1998), the present data suggest that gaze direction is a salient variable for the neural systems controlling hand motor actions and that changes in gaze likely modify activation patterns dynamically and instantaneously.
Gaze modulation in cerebral cortex
The mechanisms for gaze modulation in cerebral cortex have not been completely determined, although recent neurophysiology recordings in monkeys provide clues as to how gaze direction could modify the activity in distributed neuronal populations (Andersen, 1995;Boussaoud, 1995; Mushiake et al., 1997; Boussaoud et al., 1998).Andersen (1995) has proposed that neurons in parietal cortical area BA 7a combine visual and gaze signals to form planar gain fields. Visual responses of these cells vary linearly with horizontal and vertical eye position, with the maximal neural response occurring when eye position and the most responsive part of its visual field are aligned. Although similar mechanisms have not been described in frontal motor areas, evidence exists suggesting the gaze can modify the arm direction coding of neurons in the dorsal and ventral portions of monkey premotor cortex (Boussaoud, 1995; Mushiake et al., 1997; Boussaoud et al., 1998). In combination, the data on gaze effects on visual and arm motor representations may suggest that gaze direction could dramatically and dynamically change movement representations for the arm and hand at the level of large neuronal populations.
The current data and work obtained from neural recordings in monkeys indicate that changes in gaze direction can modify response properties in several frontal and parietal areas. In monkeys, gaze can have regular and predictable effects on neuronal activity across visual space, as for the planar gaze fields for parietal neurons (Andersen, 1995, Bremmer et al., 1999). Alternatively, the effect of gaze on directional tuning of neurons can vary widely across individual neurons and not yield a population response, indicating a particular gaze-induced bias, as observed in PMA (Boussaoud et al., 1998) and the ventral intraparietal area (Bremmer et al., 1999). Our data indicate similarity of the gaze effect across parietal and frontal regions, but it remains uncertain whether similar mechanisms generated these effects in each area. Perhaps analogous to directional tuning for neurons in sensory and motor systems, although surely on a widely different scale, we found that each participant possessed a “preferred” gaze direction to modulate activation related to finger movements, and this preferred direction had consistency across several anatomically linked brain regions. Although this preference differed across participants, a seemingly consistent bias on motor processing existed within each participant, perhaps functioning to exert a concerted effect on multiple stages of sensory motor processing.
The inter-regional congruence of the general gaze effect across parietal and cortical areas may reflect operation of a coordinated neural network that plans movements in an eye-centered reference frame. These findings suggest but do not provide adequate details or confirm existence of such a network. Recent work has indicated that neurons in a posterior parietal region appear to code for reaching in an eye-centered coordinate framework (Batista et al., 1999), although these data may bear more on reaches to targets under direct visual guidance; a situation not studied in the current work. Connections from the SPL, likely including the parietal reach region to frontal premotor areas of monkeys (Johnson et al., 1996; Wise et al., 1997; Matelli et al., 1998), may provide an anatomical substrate for the common gaze effects on finger movements that we observed. Our data provide evidence of gaze modulation of finger movement in diverse motor-related areas, but the results do not indicate the precise role that gaze has in each of these cortical areas, nor do the results bear upon important gaze and skeletomotor processes mediated by subcortical structures. Nevertheless, the parietal reach region and nearby arm movement-related zones may have mechanisms that use gaze direction to help mediate visual motor coordinate transformations processed, in part, in posterior parietal areas (Johnson et al., 1996). In the frontal premotor areas, gaze direction may affect the final stages of motor planning, whereas in MI gaze direction may have a modulatory role in regulating ongoing movement. Further experiments will be needed to determine the specific role of gaze direction on human brain representation of finger movements.
Another point to consider concerns the spatial compatibility between gaze direction and the finger movements. Greater PET activation occurs bilaterally in SPL when visual stimuli are processed in the hemisphere opposite to that used for a motor response, an “incompatible” stimulus–response condition, compared to a “compatible” stimulus–response condition (Iacoboni et al., 1996). A parsimonious interpretation of these data relates to enhanced processing required for resolving stimulus–response incompatibilities with respect to primary brain processing sites. In the current work, both hemispheres received information about the static visual target as compared to lateralized visual input used previously (Iacoboni et al., 1996). However, the current tasks may have oculomotor and skeletomotor compatibility or incompatibility, with leftward gaze having spatial incompatibility whereas central and rightward gaze have spatial compatibility with the movement. Because greatest activation occurred for spatially compatible gaze and finger movement, it would seem that there exist differences between sensory–motor (Iacoboni et al., 1996) and motor–motor mappings.
Gaze effect is not a general processing effect
Evidence from neuropsychology suggests that spatial processing in humans is asymmetrical; the right hemisphere may be capable of performing spatial operations in both visual hemifields, whereas the left hemisphere is equipped for operations restricted to the right side of space (Perenin and Vighetto, 1988). Therefore, it is possible that rightward gaze engages a left hemisphere spatial processing system in a general sense. However, our data regarding baseline MR signal intensity do not support general processing biases during rightward gaze. MR signal intensity did not vary with gaze position during the no-movement task, suggesting that the gaze modulation is specific to conditions of movement.
Another potential confound in our data could be the effect of selective spatial attention on the activation extent. Various researchers have proposed that the attentional shifts may use the same neuronal populations involved in oculomotor behaviors (Kustov and Robinson, 1996). Furthermore, under normal conditions, attention is typically attached to the fovea and thus is directed in the same direction as gaze position. An alternative interpretation of the current results that could explain the changes in activation patterns with shifts in gaze would be a shifting of attentional focus that accompanied gaze changes. Whereas we cannot readily distinguish attentional from gaze effect, Corbetta et al. (1998) have described common sites of activation for attentional and oculomotor tasks, making such distinctions even more difficult in humans. However, other neuroimaging studies in humans have noted increases in MR signal intensity with added attention (O'Craven et al., 1997); a finding consistent with the gain effect but inconsistent with the expansion effect in our model of the observed cortical responses. Furthermore, if attention had overall salience for the results, we might have expected that gaze direction would have also affected the functional MR signal, not only the number of activated voxels, during the movement and no-movement tasks. This generalized elevation did not occur. Thus, we believe that the observed areal expansions in cortical motor representations with gaze shifts are more related to interactions between oculomotor and motor systems than to global attentional biases.
General conclusions
The major finding of this study indicates that gaze direction modulates the spatial extent of the movement-related activation pattern in the human cerebral cortex. Three main results emerge from analyzing functional activation occurring within multiple cortical regions while participants performed repetitive right-handed finger movements and fixed gaze leftward, central, or rightward. First, gaze direction modulates the activation amount during simple right-handed finger movements across multiple regions of human cerebral cortex. Second, the extent of functional MR label is greatest when participants direct gaze to the hemisphere contralateral to the movement. Third, sites showing activation for all gaze conditions exhibit different patterns of MR signal intensity from sites having gaze-selective activation. Although the mechanisms underlying these changes remain unknown, we propose that the rapid gaze-induced changes may indicate that neurons involved in controlling a finger movement can be dynamically modulated by input from oculomotor systems. Furthermore, this modulation may reflect increases in the processing demands of the motor system that occur when spatial signals are potentially available to guide actions. Thus, the current work upholds the suggestion from neurophysiology that spatial information contributes to motor control processes in the primate brain.
Footnotes
This work was supported by National Institutes of Health Grants AG10634 (J.N.S.), NS35376 (J.N.S.), NS25074 (J.P.D.), and the James S. McDonnell Foundation (J.N.S.).
Correspondence should be addressed to Dr. Jerome N. Sanes, Department of Neuroscience, Brown University, Box 1953, Providence, RI 02912. E-mail: Jerome_Sanes@Brown.edu.
J.T. Baker's present address: Department of Anatomy and Neurobiology, Washington University School of Medicine, 660 South Euclid Avenue, St. Louis, MO 63110.
REFERENCES
- 1.Andersen RA. Coordinate transformations and motor planning in posterior parietal cortex. In: Gazzaniga M, editor. The cognitive neurosciences. MIT; Cambridge: 1995. pp. 519–532. [Google Scholar]
- 2.Andersen RA, Asanuma C, Essick G, Siegel RM. Corticocortical connections of anatomically and physiologically defined subdivisions within the inferior parietal lobule. J Comp Neurol. 1990;296:65–113. doi: 10.1002/cne.902960106. [DOI] [PubMed] [Google Scholar]
- 3.Bandettini PA, Jesmanowicz A, Wong EC, Hyde JS. Processing strategies for time-course data sets in functional MRI of the human brain. Magn Reson Med. 1993;30:161–173. doi: 10.1002/mrm.1910300204. [DOI] [PubMed] [Google Scholar]
- 4.Batista AP, Buneo CA, Snyder LH, Andersen RA. Reach plans in eye-centered coordinates. Science. 1999;285:257–260. doi: 10.1126/science.285.5425.257. [DOI] [PubMed] [Google Scholar]
- 5.Boussaoud D. Primate premotor cortex: modulation of preparatory neuronal activity by gaze. J Neurophysiol. 1995;73:886–890. doi: 10.1152/jn.1995.73.2.886. [DOI] [PubMed] [Google Scholar]
- 6.Boussaoud D, Barth TM, Wise SP. Effects of gaze on apparent visual responses of frontal cortex neurons. Exp Brain Res. 1993;93:423–434. doi: 10.1007/BF00229358. [DOI] [PubMed] [Google Scholar]
- 7.Boussaoud D, Jouffrais C, Bremmer F. Primate premotor cortex: modulation of preparatory neuronal activity by gaze. J Neurophysiol. 1998;80:1132–1150. doi: 10.1152/jn.1998.80.3.1132. [DOI] [PubMed] [Google Scholar]
- 8.Bremmer F, Graf W, Ben Hamed S, Duhamel J-R. Eye position encoding in the macaque ventral intraparietal area (VIP). NeuroReport. 1999;10:873–878. doi: 10.1097/00001756-199903170-00037. [DOI] [PubMed] [Google Scholar]
- 9.Corbetta M, Akbudak E, Conturo TE, Snyder AZ, Ollinger JM, Drury HA, Linenweber MR, Petersen SE, Raichle ME, Van Essen DC, Shulman GL. A common network of functional areas for attention and eye movements. Neuron. 1998;21:761–773. doi: 10.1016/s0896-6273(00)80593-0. [DOI] [PubMed] [Google Scholar]
- 10.Duhamel JR, Colby CL, Goldberg ME. The updating of the representation of visual space in parietal cortex by intended eye movements. Science. 1992;255:90–92. doi: 10.1126/science.1553535. [DOI] [PubMed] [Google Scholar]
- 11.Duhamel JR, Bremmer F, Ben Hamed S, Graf W. Spatial invariance of visual receptive fields in parietal cortex neurons. Nature. 1997;389:845–848. doi: 10.1038/39865. [DOI] [PubMed] [Google Scholar]
- 12.Duhamel JR, Colby CL, Goldberg ME. Ventral intraparietal area of the macaque: congruent visual and somatic response properties. J Neurophysiol. 1998;79:126–136. doi: 10.1152/jn.1998.79.1.126. [DOI] [PubMed] [Google Scholar]
- 13.Felleman DJ, Van Essen DC. Distributed hierarchical processing in the primate cerebral cortex. Cereb Cortex. 1991;1:1–47. doi: 10.1093/cercor/1.1.1-a. [DOI] [PubMed] [Google Scholar]
- 14.Fogassi L, Gallese V, di Pellegrino G, Fadiga L, Gentilucci M, Luppino G, Matelli M, Pedotti A, Rizzolatti G. Space coding by premotor cortex. Exp Brain Res. 1992;89:686–890. doi: 10.1007/BF00229894. [DOI] [PubMed] [Google Scholar]
- 15.Galletti C, Battaglini PP, Fattori P. Parietal neurons encoding spatial locations in craniocentric coordinates. Exp Brain Res. 1993;96:221–229. doi: 10.1007/BF00227102. [DOI] [PubMed] [Google Scholar]
- 16.Graziano MSA, Yap GS, Gross CG. Coding of visual space by premotor neurons. Science. 1994;266:1054–1057. doi: 10.1126/science.7973661. [DOI] [PubMed] [Google Scholar]
- 17.Graziano MSA, Gross CG. Visual responses with and without fixation: neurons in premotor cortex encode spatial locations independently of eye position. Exp Brain Res. 1998;118:373–380. doi: 10.1007/s002210050291. [DOI] [PubMed] [Google Scholar]
- 18.Henriques DY, Klier EM, Smith MA, Lowy D, Crawford JD. Gaze-centered remapping of remembered visual space in an open-lop pointing task. J Neurosci. 1998;18:1583–1594. doi: 10.1523/JNEUROSCI.18-04-01583.1998. [DOI] [PMC free article] [PubMed] [Google Scholar]
- 19.Iacoboni M, Woods RP, Mazziotta JC. Brain-behavior relationships: evidence from practice effects in spatial stimulus-response compatibility. J Neurophysiol. 1996;76:321–331. doi: 10.1152/jn.1996.76.1.321. [DOI] [PubMed] [Google Scholar]
- 20.Iacoboni M, Woods RP, Lenzi GL, Mazziotta JC. Merging of oculomotor and somatomotor space coding in the human right precentral gyrus. Brain. 1997;120:1635–1645. doi: 10.1093/brain/120.9.1635. [DOI] [PubMed] [Google Scholar]
- 21.Jeannerod M, Paulignam Y, Mackenzie C, Marteniuk RM. Parallel visuomotor processing in human prehension movements. In: Caminiti R, Johnson PB, Burnod Y, editors. Control of arm movement in space: neurophysiological and computational approaches. Springer; Berlin: 1992. pp. 27–44. [Google Scholar]
- 22.Johnson PB, Ferraina S, Bianchi L, Caminiti R. Cortical networks for visual reaching: physiological and anatomical organization of frontal and parietal lobe arm regions. Cereb Cortex. 1996;6:102–119. doi: 10.1093/cercor/6.2.102. [DOI] [PubMed] [Google Scholar]
- 23.Kretschmann HJ, Weinrich W. Neuroanatomy and cranial computed tomography. Thieme; New York: 1986. [Google Scholar]
- 24.Kustov AA, Robinson DL. Shared neural control of attentional shifts and eye movements. Nature. 1996;384:74–77. doi: 10.1038/384074a0. [DOI] [PubMed] [Google Scholar]
- 25.Kwong KK, Belliveau JW, Chesler DA, Goldberg IE, Weisskoff RM, Poncelet BP, Kennedy DN, Hoppel BE, Cohen MS, Turner R, Cheng H-M, Brady TJ, Rosen BR. Dynamic magnetic resonance imaging of human brain activity during primary sensory stimulation. Proc Natl Acad Sci USA. 1992;89:5675–5679. doi: 10.1073/pnas.89.12.5675. [DOI] [PMC free article] [PubMed] [Google Scholar]
- 26.Luppino G, Matelli M, Camarda R, Rizzolatti G. Corticocortical connections of area F3 (SMA-proper) and area F6 (pre-SMA) in the macaque monkey. J Comp Neurol. 1993;338:114–140. doi: 10.1002/cne.903380109. [DOI] [PubMed] [Google Scholar]
- 27.Matelli M, Govoni P, Galletti C, Kutz DF, Luppino G. Superior area 6 afferents from the superior parietal lobule in the macaque monkey. J Comp Neurol. 1998;402:327–352. [PubMed] [Google Scholar]
- 28.Mushiake H, Tanatsugu Y, Tanji J. Neuronal activity in the ventral part of premotor cortex during target-reach movement is modulated by direction of gaze. J. Neurophysiol. 1997;78:567–571. doi: 10.1152/jn.1997.78.1.567. [DOI] [PubMed] [Google Scholar]
- 29.O'Craven KM, Rosen BR, Kwong KK, Treisman A, Savoy RL. Voluntary attention modulates fMRI activity in human MT-MST. Neuron 1997. 1997;18:591–598. doi: 10.1016/s0896-6273(00)80300-1. [DOI] [PubMed] [Google Scholar]
- 30.Perenin MT, Vighetto A. Optic ataxia: a specific disruption in visuomotor mechanisms. Brain. 1988;111:643–674. doi: 10.1093/brain/111.3.643. [DOI] [PubMed] [Google Scholar]
- 31.Rao SM, Binder JR, Bandettini PA, Hammeke TA, Yetkin FZ, Jesmanowicz A, Lisk LM, Morris GL, Mueller WM, Estkowski LD, Wong EC, Haughton VM, Hyde JS. Functional magnetic resonance imaging of complex human movements. Neurology. 1993;43:2311–2318. doi: 10.1212/wnl.43.11.2311. [DOI] [PubMed] [Google Scholar]
- 32.Sadato N, Ibanez V, Deiber MP, Campbell G, Leonardo M, Hallett M. Frequency-dependent changes of regional cerebral blood flow during finger movements. J Cereb Blood Flow Metab. 1996;16:23–33. doi: 10.1097/00004647-199601000-00003. [DOI] [PubMed] [Google Scholar]
- 33.Sanes JN, Donoghue JP, Thangaraj V, Edelman RR, Warach S. Shared neural substrates controlling hand movements in human motor cortex. Science. 1995;268:1775–1777. doi: 10.1126/science.7792606. [DOI] [PubMed] [Google Scholar]
- 34.Sanes JN, Donoghue JP, Siewert B, Edelman RR, Warach S. Gaze direction modifies human motor cortical hand representations. Soc Neurosci Abstr. 1996;22:1450. [Google Scholar]
- 35.Schlaug G, Sanes JN, Thangaraj V, Darby DG, Jancke L, Edelman RR, Warach S. Cerebral activation covaries with movements rate. NeuroReport. 1996;7:879–883. doi: 10.1097/00001756-199603220-00009. [DOI] [PubMed] [Google Scholar]
- 36.Talairach J, Tournoux P. Co-planar stereotaxic atlas of the human brain: 3-dimensional proportional system: an approach to cerebral imaging. Thieme; New York: 1988. [Google Scholar]
- 37.Tanné J, Boussaoud D, Boyer-Zeller N, Rouiller EM. Direct visual pathways for reaching movements in the macaque monkey. NeuroReport. 1995;7:267–272. [PubMed] [Google Scholar]
- 38.Trotter Y, Celebrini S. Gaze direction controls response gain in primary visual-cortex neurons. Nature. 1999;398:239–242. doi: 10.1038/18444. [DOI] [PubMed] [Google Scholar]
- 39.Wise SP, Boussaoud D, Johnson PB, Caminiti R. Premotor and parietal cortex: corticocortical connectivity and combinatorial computations. Annu Rev Neurosci. 1997;20:25–42. doi: 10.1146/annurev.neuro.20.1.25. [DOI] [PubMed] [Google Scholar]