

Abstract
Rhythm is determined solely by the relationship between the time intervals of a series of events. Psychological studies have proposed two types of rhythm representation depending on the interval ratio of the rhythm: metrical and nonmetrical representation for rhythms formed with small integer ratios and noninteger ratios, respectively. We used functional magnetic resonance imaging to test whether there are two neural representations of rhythm depending on the interval ratio. The subjects performed a short-term memory task for a seven-tone rhythm sequence, which was formed with 1:2:4, 1:2:3, or 1:2.5:3.5 ratios. The brain activities during the memory delay period were measured and compared with those during the retention of a control tone sequence, which had constant intertone intervals. The results showed two patterns of brain activations; the left premotor and parietal areas and right cerebellar anterior lobe were active for 1:2:4 and 1:2:3 rhythms, whereas the right prefrontal, premotor, and parietal areas together with the bilateral cerebellar posterior lobe were active for 1:2.5:3.5 rhythm. Analysis on individual subjects revealed that these activation patterns depended on the ratio of the rhythms that were produced by the subjects rather than the ratio of the presented rhythms, suggesting that the observed activations reflected the internal representation of rhythm. These results suggested that there are two neural representations for rhythm depending on the interval ratio, which correspond to metrical and nonmetrical representations.
Keywords: rhythm, short-term memory, metrical representation, nonmetrical representation, interval ratio, cerebellar anterior lobe, cerebellar posterior lobe, right hemisphere, left hemisphere
Rhythm is a flow of time, a series of time intervals marked off by the onsets of sensory or motor events, such as tones, flashes of lights, and steps in dances. Thus, rhythm is a supramodal entity that is determined solely by time information. The fact that we can recognize, discriminate, and reproduce a large number of rhythms suggests that individual rhythms can be internally represented, but its neural mechanism has not been well understood.
To date, most of the studies on neural processing of rhythm have been based on brain-damaged patients. Rhythm processing can be selectively impaired without any deficit in melody processing, suggesting the presence of a neural system specialized for rhythm (Peretz and Kolinsky, 1993). A number of studies have shown that the left cerebral hemisphere is involved in rhythm processing (Gordon and Bogen, 1974;Robinson and Solomon, 1974; Brust, 1980; Mavlov, 1980; Polk and Kertesz, 1993), but others indicated that the processing of rhythm is not clearly lateralized (Peretz and Morais, 1980; Peretz, 1990). The variation in the location and size of the lesions hampered the precise localization of the responsible neural structures.
The inconsistency among these studies may be attributable to the fact that they used actual music as a test stimulus, which contains various types of rhythms. In this respect, previous psychological studies have identified an important constraint. Essens (1986) has shown that rhythms formed with ratios expressed as small integer values (1:2, 1:3, or 1:4) can be reproduced precisely, whereas rhythms related with larger values (1:5) or noninteger values (1:2.5 or 1:3.5) may be represented inaccurately. Based on the finding, Essens and Povel (1985)have proposed two modes of rhythm representation: metrical and nonmetrical representations. Metrical representation is to map a rhythm onto a temporal reference frame called an internal clock, by which the series of time intervals are metrically related with one another. Rhythms formed with small integer ratios belong to this class. However, this strategy cannot be applied to the rhythms formed with large ratios or noninteger ratios. These rhythms are represented in a nonmetrical manner with which the series of time intervals are maintained as independent, unrelated values. This theory predicts that the neural correlates for rhythm processing may be composed of separate neural networks depending on the interval ratio of the rhythm.
In the present study, we have used functional magnetic resonance imaging (fMRI) to identify the neural representation of rhythm and tested whether there are two types of neural representation of rhythm, which correspond to metrical and nonmetrical representations. For this purpose, we used rhythms with their time intervals formed with 1:2:4, 1:2:3, and 1:2.5:3.5 ratios. We took advantage of fMRI to make selective measurement of brain activations during the memory delay period, which would reflect the neural activation underlying the internal representation of rhythm.
MATERIALS AND METHODS
Subjects
Six normal subjects participated in the study (four males and two females; age 27–44; all right-handed). None of them were professional musicians. Informed consents were obtained from all the subjects before the study. The experimental protocol was approved by the ethics committee of the Communications Research Laboratory (Kobe, Japan).
Behavioral paradigm
A sequence of seven short tone bursts was presented to the subjects. Each tone had the same frequency: 1 kHz; rise–fall time, 5 msec; plateau, 20 msec; and intensity, 95 dB. The six intervals marked off by the onsets of the seven tones were determined to comprise two short (S), two intermediate (I), and two long intervals (L), where the S, I, and L were related with 1:2:4 (1:2:4 rhythm), 1:2:3 (1:2:3 rhythm), or 1:2.5:3.5 (1:2.5:3.5 rhythm) ratios (Fig.1). By taking all the possible orders of the two Ss, Is, and Ls (e.g., SISLLI), we created 90 (6C2 ×4C2 ×2C2) sequences for each of the three types of the rhythm sequence. The duration of the rhythm sequence, as measured by the time interval from the onset of the first tone to the onset of the last tone, was randomly chosen from 3220, 3360, 3500, 3640, and 3780 msec.
Fig. 1.

Task procedure. Procedure of a task to examine the short-term memory of rhythm. An experiment consisted of 120 trials. For each trial, the subjects were presented with a sequence of seven tones during the first 4.0 sec and were asked to keep it in memory for 10.8 sec. At the last 1.8 sec of the memory delay period, the scans were performed. During the subsequent 5.2 sec period, the subjects reproduced the maintained sequence by pressing a button. The intertone time intervals of the tone sequence was related with 1:2:4 ratio (1:2:4 rhythm), 1:2:3 ratio (1:2:3 rhythm), or 1:2.5:3.5 ratio (1: 2.5: 3.5 rhythm), and the total duration of the sequence was varied across trials ranging from 3220 to 3780 msec. The control sequence consisted of seven tones separated by a fixed intertone interval.
The subjects were asked to hold the presented rhythm sequence in memory for a period of 10.8 sec and then to reproduce it by pressing a button with the right index finger. Instruction was given to keep the relative relations of the time intervals, as well as the absolute time intervals of the presented sequence.
The memory performance was assessed based on the reproduced sequence of button presses. Three measures were used for this purpose: order of the time intervals classified as S, I, and L; ratio of the S, I, and L; and duration of the sequence.
Order. The six time intervals of button pressing in the reproduced sequence were classified into two Ss, two Is, and two Ls. The order of the three classes of the time intervals (e.g., SISLLI) was compared with that of the presented tone sequence. If the order was different, the trial was regarded as an error and was eliminated from the following behavioral data analysis.
Ratio. Subsequently, we calculated the ratios of the button press intervals of the reproduced sequence. The mean of the two Is and the mean of the two Ls of reproduced rhythm was respectively divided by the mean of the two Ss. The ideal ratios would be 2 and 4 for 1:2:4 rhythm, 2 and 3 for 1:2:3 rhythm, and 2.5 and 3.5 for 1:2.5:3.5 rhythm.
Duration. Another index for the accuracy of retention was the duration of the sequence. The regression analysis was performed on the duration of the reproduced sequence with that of the presented tone sequence. Ideally, these durations should be correlated linearly with a slope of 1.0 and an intercept of 0.
In the present study, we were interested in the rhythm, which can be expressed by the order and ratio. To eliminate the effects of the processes required for retention of absolute time intervals (duration), we also presented the control tone sequences (control), which were formed with seven tones separated by a constant interval. The total duration of the control sequence was randomly chosen from 3220, 3360, 3500, 3640, and 3780 msec to match that of the rhythm sequences. The comparison between the rhythm sequence (order+ ratio + duration) and control sequence (duration) would selectively reveal the processes for retention of the rhythm (order + ratio).
fMRI data acquisition
Before the fMRI experiments, the subjects underwent practice sessions using 10 of the 90 sequences for each type of the rhythm sequence. For fMRI experiments, the rhythm sequences were chosen from the remaining 80 sequences. Each sequence was used only once in each experiment.
An experiment comprised 120 trials, each of which is composed of the tone presentation period (4 sec), memory delay period (10.8 sec), followed by the reproduction period (5.2 sec) (Fig. 1). The subjects fixated their gaze at the center spot on the screen and were not allowed to move any body parts or to vocalize the rhythms throughout the experiment, except for button presses during the reproduction period. The motion of the subject's head was minimized by using a strap around the forehead, bite bar, and ear fixation blocks. In the tone presentation period, the tone sequence was delivered to a headphone through a pair of plastic tubes (length, 180 cm), and the subjects kept the sequence in memory during the memory delay period. At the end of the delay period, a brief high-pitched tone (frequency, 2 kHz; duration, 30 msec) was presented, which served as a cue to reproduce the presented tone sequence with button presses. The subjects had to reproduce the sequence within the 5.2 sec reproduction period, after which the next trial started.
For measurement of brain activation, we used Siemens (Erlagen, Germany) Vision 1.5 tesla scanner equipped with a circular polarized head coil. Fourteen slices of T2*-weighted gradient-echo echo-planar images [repetition time (TR), 20 sec; echo time (TE), 66 msec; inversion time (TI), 300 msec; flip angle (FA), 90 degree] were collected within the 1.8 sec period at the end of the TR with the use of clustered volume acquisition (Edmister et al., 1999; Talavage et al., 1999). The images of 7 mm thickness [field of view (FOV), 220 × 220 mm; matrix, 128 × 128] were obtained parallel to the line connecting the anterior and posterior commissure (AC-PC line). The AC-PC line was determined based on the structure images obtained before the functional experiments (Turbo FLASH; TR, 2.8 sec; TE, 4 msec; TI, 300 msec; FA, 15 degree; matrix: 256 × 256; FOV, 256 × 256 mm; slice thickness, 1 mm). The timing of the scans was adjusted to start 9 sec after the end of the tone presentation period. Therefore, even if we take into account the delay of hemodynamic response, the auditory-related activity should have almost returned to the baseline level at the time of scans (Kwong et al., 1992; Buckner et al., 1996). Indeed, our supplementary experiments conducted by using 2.5 sec interscan interval (using TR of 2.5 sec) have shown that no significant activation relative to rest was present in the primary auditory area 7.5 sec after the cessation of the auditory stimuli (our unpublished observation). In the present study, a series of the volume of brain images was acquired with long interscan intervals (20 sec). This sparse temporal sampling procedure (Hall et al., 1999) was advantageous in that the scan noise did not hamper the perceptual and encoding processes for the presented rhythm. In addition, no movements occurred during the period for at least 13.0 sec before the time of the scans. Therefore, the magnetic resonance signals obtained would reflect the brain activations specifically associated with the retention of rhythms.
The following two sets of functional MRI experiments were performed, with their orders counterbalanced across the six subjects.
Experiment 1. The experiment comprised 120 task trials: 40 trials of 1:2:4 rhythm, 40 trials of 1:2:3 rhythm, and 40 trials of control. Ten trials for each type of the sequence were performed successively in a block. The blocks for the three types of the sequence were alternated in a counterbalanced order and were repeated for four times (e.g., 1:2:4 rhythm × 10 trials → 1:2:3 rhythm × 10 trials → control × 10 trials → 1:2:3 rhythm × 10 trials → 1:2:4 rhythm × 10 trials → control × 10 trials …). After two dummy scans, the task procedure was started while a series of 120 scans separated by a 20 sec interscan interval were performed for the 120 trials.
Experiment 2. Experiment 2 was conducted using the same experimental procedure as experiment 1, except that 1:2.5:3.5 rhythm was used instead of 1:2:3 rhythm.
fMRI data analysis
Location of active areas. First, we performed a statistical parametric analysis on the functional images of the six subjects to identify the brain areas associated with retention of rhythms. For each experiment, the 120 functional images were realigned to the first image of each subject and were stereotaxically normalized into the T2 template of the standard brain using the software of SPM96 (Welcome Department of Cognitive Neurology, London, UK,http://www.fil.ion.ucl.ac.uk) (Friston et al., 1995). The images were then smoothed with a gaussian filter of 4.5 mm full-width half-maximum (FWHM). After application of temporal high-pass filter (400 sec) to the time course of magnetic resonance signals, the confounding effect of variation in the global magnetic resonance signal intensity across the subjects was removed by ANCOVA. Subsequently, the time series of magnetic resonance signals was cross-correlated with a boxcar reference function derived from the alternation of the task blocks. The reference function was not shifted because of the usage of long TR (20 sec). For experiment 1, 1:2:4 and 1:2:3 rhythms were respectively compared with control. For experiment 2, 1:2:4 and 1:2.5:3.5 rhythms were respectively compared with control. A statistical parametric map of thet statistics was constituted from the resulting voxel values and was transformed to the unit normal distribution (SPM{Z}, thresholded at 3.09). Taking the spatial extent of activation into consideration, a corrected p value of 0.05 was then used as a final threshold for significance.
Correlation of activation with memory performance. The above statistical parametric analysis provides the averaged brain activations for the six subjects. However, as will be shown in the behavioral data in Results, the memory performance differed across the subjects. Therefore, we also analyzed the brain activation pattern for each subject and correlated it with the memory performance. Instead of normalizing the anatomical structures into the Talairach space (Talairach and Tournoux, 1988), the foci of significantly increased activation was mapped onto the anatomical echo-planar images for each subject. After application of a gaussian filter with FWHM of 4.5 mm, the brain areas with significantly increased activities for rhythm compared with control were identified using a cross-correlation method (thresholded at cross-correlation coefficient of 0.35).
RESULTS
Behavioral data
The memory performance was assessed based on the order, ratio, and duration of the reproduced rhythms (examples shown in Fig.2a). None of the six subjects showed error rates above 10%. The error rates were not significantly different between 1:2:3 and 1:2:4 rhythms (experiment 1,t(1,5) = −2.0; p > 0.1) but were significantly larger for 1:2.5:3.5 rhythm than 1:2:4 rhythm (experiment 2, t(1,5) = −2.91;p < 0.05). In Figure 2b are shown the reproduced ratios for the three types of rhythms, respectively, for the six subjects. The mean ratio for the six subjects was 1:2.06:4.04 and 1:2.02:3.18, respectively, for 1:2:4 and 1:2:3 rhythms in experiment 1, and 1:2.01:4.00 and 1:2.33:3.69, respectively, for 1:2:4 and 1:2.5:3.5 rhythms in experiment 2. For 1:2.5:3.5 rhythm, the reproduced ratio for 2.5 was significantly smaller than 2.5 (t(1,5) = −3.40; p < 0.05), and that for 3.5 was significantly larger than 3.5 (t(1,5) = 2.84; p < 0.05). In contrast, the reproduced ratios for 1:2:4 and 1:2:3 rhythms were not significantly different from the original ratios except for that for 3 in 1:2:3 rhythm, which was larger than 3 (t(1,5) = 6.76; p < 0.05) [for further analysis, see below (Correlation of activation with memory performance)]. The duration of the sequence was maintained fairly precisely for all the rhythms; all the six subjects showed significant linear correlation (r2 > 0.5) between the total duration of the reproduced sequence and that of the presented sequence. For all the subjects and tone sequences, the slopes and intercepts of the regression lines were close to 1.0 and 0, respectively (Fig.2b).
Fig. 2.

Behavioral data. a, Three examples of the presented tone sequence (circles with lines) and the reproduced sequence (crosses) obtained from one subject are shown for 1:2:4, 1:2:3, and 1:2.5:3.5 rhythms and control.b, Summary of the behavioral data from six subjects.Left, Reproduced ratios shown respectively for the six subjects. Each X represents the mean value for one subject. Middle, Right, Means of the slopes (middle) and intercepts (right) of the regression lines between the total duration of reproduced and presented sequences. Error bars indicate the SEs. Data from experiment 1 (top) and experiment 2 (bottom).
fMRI data
Location of active areas
Comparisons of 1:2:4, 1:2:3, and 1:2.5:3.5 rhythms with control revealed brain areas associated with retention of the rhythm components (Table 1). 1:2:4 rhythm was tested twice (experiments 1 and 2), and activations in the left premotor and parietal areas were consistently observed, confirming the reproducibility of the finding (Fig.3a). In addition, almost the same set of brain areas was active for 1:2:3 rhythm. In contrast, the activation pattern for 1:2.5:3.5 rhythm was completely different; the right prefrontal, premotor, and parietal areas were active. The anterior part of the right prefrontal cortex was active only for 1:2.5:3.5 rhythm but not for 1:2:4 and 1:2:3 rhythms (Fig.3b). The analysis of individual subjects showed that this prefrontal activation focus was located within the anterior part of the middle frontal gyrus close to the inferior frontal gyrus (Fig. 4b, blue circle). Additional activation foci were found in the cerebellum; the right anterior lobe was active for 1:2:4 and 1:2:3 rhythms but not for 1:2.5:3.5 rhythm, whereas the bilateral cerebellar posterior lobe was active for 1:2.5:3.5 rhythm but not for 1:2:4 rhythm (Fig.3b). Only the right posterior lobe was active for 1:2:3 rhythm. Individual subject analysis showed that the activation foci in the cerebellar anterior lobe were located in the quadrangular lobule [corresponding to hemispheric lobule IV (HIV)–HV] (Fig.4a, pink circle), whereas the foci in the posterior lobe were located within the simplex lobule and the superior semilunar lobule of the cerebellum (corresponding to HVI–crus I of HVIIa) (Fig. 4b, green circle).
Table 1.
Stereotaxic coordinates and Z scores of active areas
| Comparison | Region | Area | Coordinates | Z score | ||
|---|---|---|---|---|---|---|
| x | y | z | ||||
| Experiment 1 | ||||||
| 1∶2∶4 rhythm | Frontal | PMC | −52 | 4 | 48 | 4.24 |
| - control | Parietal | IPS | −36 | −42 | 54 | 4.52 |
| Cerebellar | Anterior | 16 | −48 | −16 | 4.82 | |
| 1∶2∶3 rhythm | Frontal | PMC | −46 | 10 | 44 | 4.88 |
| - control | Parietal | IPS | −52 | −30 | 52 | 4.46 |
| Cerebellar | Anterior | 16 | −52 | −16 | 4.91 | |
| Cerebellar | Posterior | 34 | −66 | −20 | 4.10 | |
| Experiment 2 | ||||||
| 1∶2∶4 rhythm | Frontal | PMC | −42 | −6 | 52 | 5.32 |
| - control | −56 | 16 | 32 | 4.14 | ||
| Parietal | IPS | 36 | −34 | 66 | 4.79 | |
| −50 | −32 | 56 | 5.94 | |||
| Cerebellar | Anterior | 18 | −52 | −20 | 5.07 | |
| 1∶2.5∶3.5 rhythm | Frontal | PFC | 42 | 46 | 18 | 4.94 |
| - control | PMC | 42 | 14 | 48 | 4.97 | |
| 52 | 0 | 48 | 5.36 | |||
| Parietal | IPS | 34 | −48 | 66 | 4.34 | |
| −44 | −42 | 54 | 5.48 | |||
| Temporal | STG | 64 | −32 | 16 | 5.12 | |
| Cerebellar | Posterior | 34 | −58 | −22 | 4.94 | |
| −32 | −60 | −22 | 6.07 | |||
PMC, Premotor cortex; IPS, intraparietal sulcus; Anterior, anterior lobe; Posterior, posterior lobe; PFC, prefrontal cortex; STG, superior temporal gyrus.
Fig. 3.

Statistical parametric analysis. a, Statistical parametric maps (SPM{z}) of the six subjects when 1:2:4, 1:2:3, and 1:2.5:3.5 rhythms were respectively compared with control. The foci of significantly increased activities were rendered onto the surface template of the standard brain as implemented in SPM96 (Welcome Department of Cognitive Neurology, London, UK) and are shown in red. b, Activation foci ina are shown in three slices at 18 mm above (left), 16 mm below (middle), and 22 mm below (right) the level of the AC-PC line; the prefrontal cortex (blue circle), cerebellar anterior lobe (pink circle), and cerebellar posterior lobe (green circle). White dotted linesin the cerebellum indicate the primary fissure that separates the anterior and posterior lobes of the cerebellum. Theright corresponds to the right hemisphere.
Fig. 4.
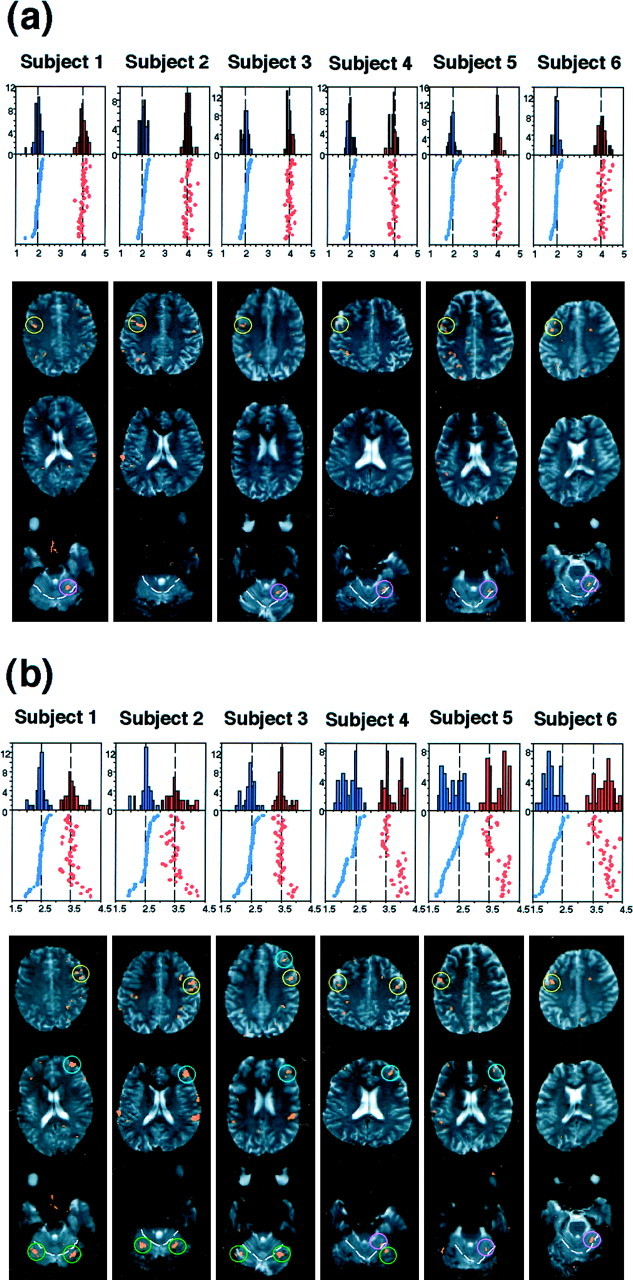
Individual subject analysis. The distribution of the interval ratios of the reproduced rhythms, shown as histograms and rasters. Data are shown for 40 trials of 1:2:4 (a) and 1:2.5:3.5 (b) rhythms in experiment 2. Abscissa of the histogram and raster represents the reproduced ratio. The smaller ratios are shown inblue, and larger ratios are shown in red. For the raster display, trials have been sorted such that the smaller ratios are arranged in the decrementing order from topto bottom. The ratios for the presented rhythms are indicated by the two vertical dotted lines. The activation maps for each subject are shown in three slices in which significant activations are shown in orange. Theright corresponds to the right hemisphere. White dotted lines in the cerebellum indicate the primary fissure.a, Activation pattern for 1:2:4 rhythm. The left premotor cortex (yellow circle) and the right cerebellar anterior lobe (pink circle) were consistently active, except for subject 2. b, Activation pattern for 1:2.5:3.5 rhythm. Note the difference in the ratio distribution and activation patterns across the subjects. For the premotor cortex (yellow circle), the right side was active in subjects 1–4, whereas the left side was active in subjects 5 and 6. The prefrontal cortex (blue circle) was active in subjects 1–5, most prominently in subjects 1 and 2. The cerebellar posterior lobe (green circle) was bilaterally active in subjects 1–3, whereas the right cerebellar anterior lobe (pink circle) was active in subjects 4–6.
Correlation of activation with memory performance
As shown in Figure 2b, the memory performance for 1:2:4 and 1:2:3 rhythms was not different across the six subjects, whereas that for 1:2.5:3.5 rhythm considerably differed with respect to its reproduced ratios. The reproduced ratio for 2.5 ranged from 2.15 to 2.45, and that for 3.5 ranged from 3.52 to 3.92 among the six subjects. To further analyze the performance of each subject, we plotted the reproduced ratios for the 40 trials for 1:2:4 and 1:2.5:3.5 rhythms (experiment 2) in histograms and rasters (Fig. 4). Histograms for 1:2:4 rhythm revealed two peaks of the reproduced ratios at 2 and 4 for all the six subjects (Fig. 4a). On the other hand, for 1:2.5:3.5 rhythm, the peaks were found at 2.5 and 3.5 for subjects 1–3, whereas additional two peaks were found at 2 and 4 for subjects 4–6 (Fig.4b). For subject 6, the peaks at 2 and 4 were higher than those at 2.5 and 3.5. The results indicated that the increased variance in the reproduced ratios and deviation of them from the original ratios for 1:2.5:3.5 rhythm were because of these additional peaks. Furthermore, rasters in the figure have shown that the subjects reproduced the rhythms in either 1:2.5:3.5 or in 1:2:4 ratios. Whenever the subject reproduced the 1:2.5 ratio as 1: 2, he reproduced the 1:3.5 ratio as 1:4 in the same trial. The proportion of the two types of reproduction, 1:2.5:3.5 or 1:2:4 ratios, in the 40 trials was varied across the subjects.
Looking into the activation maps of each subject for 1:2:4 rhythm, the active areas were found in the left premotor cortex and the right cerebellar anterior lobe but not in the prefrontal cortex, consistent across the six subjects (Fig. 4a). In contrast, for 1:2.5:3.5 rhythm, subjects 1–3 showed prominent activation in the right prefrontal cortex, right premotor cortex, and the bilateral cerebellar posterior lobe (Fig. 4b), whereas subjects 5 and 6 showed activation in the left premotor cortex and the right cerebellar anterior lobe. Thus, the brain activation patterns of subjects 5 and 6, who reproduced the 1:2.5:3.5 rhythm in 1:2:4 ratio, were quite similar to those when 1:2:4 rhythm was presented (Fig.4a). This finding suggests that the brain activation pattern depends on the ratios of the reproduced rhythms rather than the ratio of the presented rhythms.
DISCUSSION
Two modes of neural representation for rhythm
Earlier psychological studies have, based solely on the behavioral data, proposed two types of rhythm representation depending on the interval ratio of the rhythm (Essens, 1986). The aim of the present study was to test whether these metrical and nonmetrical representations recruit different sets of neural network. To elucidate the internal representation of rhythm, we used a short-term memory task in which the subjects maintained a rhythm internally during the delay period. However, MRI scans themselves produce rhythmic noise and would have severely disturbed the experiment if they had been performed during the tone presentation period or memory delay period. To eliminate the interactive effects of the scan noise on the perceptual and memory processes, we used a sparse temporal sampling procedure (Hall et al., 1999) with clustered volume acquisition (Edmister et al., 1999; Talavage et al., 1999) so that no scan was performed during the delay period. The dependence of brain activation patterns on the reproduced rhythm rather than the presented rhythm (as shown in Fig.4b) strongly suggests that the measured brain activations reflect the internal representation of rhythm.
The present study used three types of rhythm whose interval ratios were expressed as 1:2:4, 1:2:3, and 1:2.5:3.5, respectively. According to the theory proposed in the psychological literature (Povel, 1984; Essens and Povel, 1985; Povel and Essens, 1985), the former two rhythms are represented in a metrical form, whereas the latter one is represented in a nonmetrical form. The behavioral data in the present study were consistent with this idea; the reproduction of 1:2:4 and 1:2:3 rhythms was precise, whereas that of 1:2.5:3.5 rhythm was inaccurate, especially in its reproduced ratio. Interestingly, some subjects unintentionally transformed the 1:2.5:3.5 rhythm into 1:2:4 rhythm, which was consistent with the finding of Essens (1986). It has also been shown that voluntary motor behaviors tended to fall into a time sequence related with 1:2 ratios (Essens and Povel, 1985; Fulop et al., 1992). Together, the results suggest that a rhythm is represented, by default, in a metrical form rather than a nonmetrical form.
Our functional imaging data indicated that the brain activation patterns for 1:2:4 and 1:2:3 rhythms were quite similar but were completely different from that for 1:2.5:3.5 rhythm. First, the right prefrontal cortex was active for 1:2.5:3.5 rhythm but not for 1:2:4 and 1:2:3 rhythms. Second, the cerebellar posterior lobe was bilaterally active for 1:2.5:3.5 rhythm, whereas the right cerebellar anterior lobe was active for 1:2:4 and 1:2:3 rhythms. Third, the right hemisphere was predominantly active for 1:2.5:3.5 rhythm, whereas the left side was more active for 1:2:4 and 1:2:3 rhythms. Considering that retention of 1:2.5:3.5 rhythm was more difficult than 1:2:4 and 1:2:3 rhythms (as shown in the increase in the error rate), the difference in the brain activation pattern could reflect the level of attention required for the memory task. We think that this is unlikely, however, because different sets of brain areas were activated in these conditions, some areas showing clear double dissociation. Instead, the results suggest the presence of two distinctive neural representations of rhythm.
Prefrontal cortex
The prefrontal cortex has been regarded as the key structure for working memory, and its activity was shown to reflect the on-line processing of memorized materials (Funahashi et al., 1989;Goldman-Rakic, 1996; Cohen et al., 1997; Courtney et al., 1997, 1998). Involvement of the prefrontal cortex in memory of temporal information has been shown in animal study (Niki and Watanabe, 1979). The present study has shown that the right side of the prefrontal cortex located in the anterior part of the middle frontal gyrus was active only for 1:2.5:3.5 rhythm. Its stereotaxic coordinates (42, 46, 18) were close to the areas activated in retention of melody and pitch (Zatorre et al., 1992, 1994). Because we used isopitch tone sequence, the prefrontal activity may be related generally to the manipulation or monitoring of memorized information (Petrides, 1994; Fletcher et al., 1998; Mangels et al., 1998).
In contrast, the absence of the prefrontal activation for 1:2:4 and 1:2:3 rhythms may suggest that metrical representation does not require additional monitoring processes relative to the control sequence. In metrical representation, the maintenance of a single time interval alone allows to specify all the other time intervals of a rhythm.
Cerebellum
We found a clear double dissociation between the cerebellar anterior and posterior lobe activations, the former being active for 1:2:4 rhythm, and the latter being active for 1:2.5:3.5 rhythm. The anterior lobe of the cerebellum, especially HIV–HV, is related to the ipsilateral upper limb movements (Nitschke et al., 1996; Allen et al., 1997), whereas the posterior lobe, especially HVI–HVIIa, may be involved in higher order cognitive processes, such as attention and working memory (Allen et al., 1997; Desmond et al., 1997). From this perspective, the right anterior lobe activation for 1:2:4 and 1:2:3 rhythms might reflect the preparatory processes for the following reproduction with the right index finger. This seems unlikely, however, because the primary motor cortex or supplementary motor area, which has been shown to be active in motor imagery or motor preparation (Roland et al., 1980; Stephan et al., 1995; Porro et al., 1996), was not active in the present study.
In contrast, the cerebellar posterior lobe has been shown to be related to explicit temporal representation (Ivry et al., 1988; Ivry, 1993;Jueptner et al., 1996; Mangels et al., 1998; Sakai et al., 1998). The cerebellar posterior lobe activation in the present study may reflect the retention of a series of time intervals for 1:2.5:3.5 rhythm. The posterior lobe activation was absent for 1:2:4 rhythm, perhaps because the time intervals of this rhythm were metrically related and encoding of individual time intervals was not necessary.
Right versus left hemispheric predominance
We found that metrical representation for 1:2:4 or 1:2:3 rhythms was predominantly associated with left hemispheric activation, whereas the nonmetrical representation for 1:2.5:3.5 rhythm was associated with right hemispheric activation. Previous clinical studies have shown that rhythm deficits were found after left hemispheric lesions, especially when the left premotor and parietal areas were damaged (Brust, 1980;Mavlov, 1980; Polk and Kertesz, 1993). Considering that most of the music, especially from western countries, was metrically related (Palmer and Kelly, 1992; Palmer, 1997), the present finding showing activations in the left premotor and parietal areas for metrical rhythms is consistent with these clinical studies. In contrast, the right hemispheric activations for rhythms related with complex ratios are consistent with an earlier study of Roland et al. (1981), which showed predominant right hemispheric activations in discrimination of two rhythm patterns related with complex ratios. The right frontoparietal areas may be involved in memory of time intervals (Harrington et al., 1998), which is necessary for the nonmetrical rhythm representation. Thus, the present results indicate that the processing of rhythm is not confined to one cerebral hemisphere, asPeretz (1990) has suggested.
Although we used auditory stimuli for presenting rhythms, the temporal lobes did not show significant activation; only a small portion on the right side was active for 1:2.5:3.5 rhythm. The frontoparietal network active in the present study would, thus, reflect the supramodal mechanism for rhythm processing, as suggested by Mavlov (1980). Indeed, it was shown that the ability in rhythm processing was preserved, even after the lesions in the temporal lobe (Peretz and Kolinsky, 1993;Peretz, 1996).
To summarize, we have shown that there are two modes of neural representation for rhythm. Their selection depends on the interval ratios of the rhythm or, more precisely, on the strategy used for encoding the rhythm, metrical or nonmetrical. Nonmetrical strategy may require explicit processing for the individual time intervals, whereas metrical strategy may operate automatically, and possibly implicitly, to allow hierarchical encoding of the whole rhythm. In this regard, the right and left hemispheric dissociation observed in the nonmetrical and metrical rhythm processing may be closely related to the finding ofHazeltine et al. (1997), who showed a similar hemispheric dissociation between explicit and implicit motor sequence learning.
Footnotes
This study was supported by Japan Society for the Promotion of Science (JSPS) Research for the Future program and Basic Research System Core. K.S. was supported by JSPS Research Fellowship for Young Scientists. We are grateful to Hiroshi Imamizu and Mitsuo Kawato at Japan Science and Technology Corporation for their cooperation with SPM analysis. We are also grateful to Haruo Uesugi at Department of Neurology, University of Tokyo, who is a professional musician, for his helpful advice on musical theory.
Correspondence should be addressed to Katsuyuki Sakai, Department of Physiology, Juntendo University, School of Medicine, 2-1-1 Hongo, Bunkyo-ku, Tokyo 113, Japan. E-mail: katz@med.juntendo.ac.jp.
REFERENCES
- 1.Allen G, Buxton RB, Wong EC, Courchesne E. Attentional activation of the cerebellum independent of motor involvement. Science. 1997;275:1940–1943. doi: 10.1126/science.275.5308.1940. [DOI] [PubMed] [Google Scholar]
- 2.Brust J. Music and language: musical alexia and agraphia. Brain. 1980;103:367–392. doi: 10.1093/brain/103.2.367. [DOI] [PubMed] [Google Scholar]
- 3.Buckner RL, Bandettini PA, O'Craven KM, Savoy RL, Petersen SE, Raichle ME, Rosen BR. Detection of cortical activation during averaged single trials of a cognitive task using functional magnetic resonance imaging. Proc Nat Acad Sci USA. 1996;93:14878–14883. doi: 10.1073/pnas.93.25.14878. [DOI] [PMC free article] [PubMed] [Google Scholar]
- 4.Cohen JD, Perlstein WM, Braver TS, Nystrom LE, Noll DC, Jonides J, Smith EE. Temporal dynamics of brain activation during a working memory task. Nature. 1997;386:604–608. doi: 10.1038/386604a0. [DOI] [PubMed] [Google Scholar]
- 5.Courtney SM, Ungerleider LG, Keil K, Haxby JV. Transient and sustained activity in a distributed neural system for human working memory. Nature. 1997;386:608–611. doi: 10.1038/386608a0. [DOI] [PubMed] [Google Scholar]
- 6.Courtney SM, Petit L, Maisog JM, Ungerleider LG, Haxby JV. An area specialized for spatial working memory in human frontal cortex. Science. 1998;279:1347–1351. doi: 10.1126/science.279.5355.1347. [DOI] [PubMed] [Google Scholar]
- 7.Desmond JE, Gabrieli JDE, Wagner AD, Ginier BL, Glover GH. Lobular patterns of cerebellar activation in verbal working-memory and finger-tapping tasks as revealed by functional MRI. J Neurosci. 1997;17:9675–9685. doi: 10.1523/JNEUROSCI.17-24-09675.1997. [DOI] [PMC free article] [PubMed] [Google Scholar]
- 8.Edmister WB, Talavage TM, Ledden PJ, Weisskoff RM. Improved auditory cortex imaging using clustered volume acquisitions. Hum Brain Mapp. 1999;7:89–97. doi: 10.1002/(SICI)1097-0193(1999)7:2<89::AID-HBM2>3.0.CO;2-N. [DOI] [PMC free article] [PubMed] [Google Scholar]
- 9.Essens PJ. Hierarchical organization of temporal patterns. Percept Psychophys. 1986;40:69–73. doi: 10.3758/bf03208185. [DOI] [PubMed] [Google Scholar]
- 10.Essens PJ, Povel DJ. Metrical and nonmetrical representations of temporal patterns. Percept Psychophys. 1985;37:1–7. doi: 10.3758/bf03207132. [DOI] [PubMed] [Google Scholar]
- 11.Fletcher PC, Shallice T, Frith CD, Frackowiak RSJ, Dolan RJ. The functional roles of prefrontal cortex in episodic memory. II. Retrieval. Brain. 1998;121:1249–1256. doi: 10.1093/brain/121.7.1249. [DOI] [PubMed] [Google Scholar]
- 12.Friston KJ, Holmes AP, Worsley KJ, Poline J-B, Frith CD, Frackowiak RS. Statistical parametric maps in functional imaging: a general linear approach. Hum Brain Mapp. 1995;2:189–210. [Google Scholar]
- 13.Fulop AC, Kirby RH, Coates GD. Use of rhythm in acquisition of a computer-generated tracking task. Percept Mot Skills. 1992;75:59–66. doi: 10.2466/pms.1992.75.1.59. [DOI] [PubMed] [Google Scholar]
- 14.Funahashi S, Bruce CJ, Goldman-Rakic PS. Mnemonic coding of visual space in the monkey's dorsolateral prefrontal cortex. J Neurophysiol. 1989;61:331–349. doi: 10.1152/jn.1989.61.2.331. [DOI] [PubMed] [Google Scholar]
- 15.Goldman-Rakic PS. Regional and cellular fractionation of working memory. Proc Natl Acad Sci USA. 1996;93:13473–13480. doi: 10.1073/pnas.93.24.13473. [DOI] [PMC free article] [PubMed] [Google Scholar]
- 16.Gordon HW, Bogen JE. Hemispheric lateralization of singing after intracarotid sodium amylobarbitone. J Neurol Neurosurg Psychiatry. 1974;37:727–738. doi: 10.1136/jnnp.37.6.727. [DOI] [PMC free article] [PubMed] [Google Scholar]
- 17.Hall DA, Haggard MP, Akeroyd MA, Palmer AR, Summerfield AQ, Elliot MR, Gurney EM, Bowtell RW. “Sparse” temporal sampling in auditory fMRI. Hum Brain Mapp. 1999;7:213–223. doi: 10.1002/(SICI)1097-0193(1999)7:3<213::AID-HBM5>3.0.CO;2-N. [DOI] [PMC free article] [PubMed] [Google Scholar]
- 18.Harrington DL, Haaland KY, Knight R. Cortical networks underlying mechanisms of time perception. J Neurosci. 1998;18:1085–1095. doi: 10.1523/JNEUROSCI.18-03-01085.1998. [DOI] [PMC free article] [PubMed] [Google Scholar]
- 19.Hazeltine E, Grafton ST, Ivry R. Attention and stimulus characteristics determine the locus of motor-sequence encoding A PET study. Brain. 1997;120:123–140. doi: 10.1093/brain/120.1.123. [DOI] [PubMed] [Google Scholar]
- 20.Ivry R. Cerebellar involvement in the explicit representation of temporal information. Ann NY Acad Sci. 1993;682:214–230. doi: 10.1111/j.1749-6632.1993.tb22970.x. [DOI] [PubMed] [Google Scholar]
- 21.Ivry RI, Keele SW, Diener HC. Dissociation of the lateral and medial cerebellum in movement timing and movement execution. Exp Brain Res. 1988;73:167–180. doi: 10.1007/BF00279670. [DOI] [PubMed] [Google Scholar]
- 22.Jueptner M, Flerich L, Weiller C, Mueller SP, Diener H-C. The human cerebellum and temporal information processing-results from a PET experiment. NeuroReport. 1996;7:2761–2765. doi: 10.1097/00001756-199611040-00071. [DOI] [PubMed] [Google Scholar]
- 23.Kwong KK, Belliveau JW, Chesler DA, Goldberg IE, Weisskoff RM, Poncelet BP, Kennedy DN, Hoppel BE, Cohen MS, Turner R, Cheng H-M, Brady TJ, Rosen BR. Dynamic magnetic resonance imaging of human brain activity during primary sensory stimulation. Proc Natl Acad Sci USA. 1992;89:5675–5679. doi: 10.1073/pnas.89.12.5675. [DOI] [PMC free article] [PubMed] [Google Scholar]
- 24.Mangels JA, Ivry RB, Shimizu N. Dissociable contributions of the prefrontal and neocerebellar cortex to time perception. Cognit Brain Res. 1998;7:15–39. doi: 10.1016/s0926-6410(98)00005-6. [DOI] [PubMed] [Google Scholar]
- 25.Mavlov L. Amusia due to rhythm agnosia in a musician with left hemisphere damage: a non-auditory supramodal defect. Cortex. 1980;16:331–338. doi: 10.1016/s0010-9452(80)80070-0. [DOI] [PubMed] [Google Scholar]
- 26.Niki H, Watanabe M. Prefrontal and cingulate unit activity during timing behavior in the monkey. Brain Res. 1979;171:213–224. doi: 10.1016/0006-8993(79)90328-7. [DOI] [PubMed] [Google Scholar]
- 27.Nitschke MF, Kleinschmidt A, Wessel K, Frahm J. Somatotopic motor representation in the human anterior cerebellum. A high-resolution functional MRI study. Brain. 1996;119:1023–1029. doi: 10.1093/brain/119.3.1023. [DOI] [PubMed] [Google Scholar]
- 28.Palmer C. Music performance. Annu Rev Psychol. 1997;48:115–138. doi: 10.1146/annurev.psych.48.1.115. [DOI] [PubMed] [Google Scholar]
- 29.Palmer C, Kelly MH. Linguistic prosody and musical meter in song. J Mem Lang. 1992;31:525–542. [Google Scholar]
- 30.Peretz I. Processing of local and global musical information in unilateral brain damaged patients. Brain. 1990;13:1185–1205. doi: 10.1093/brain/113.4.1185. [DOI] [PubMed] [Google Scholar]
- 31.Peretz I. Can we lose memory for music? A case of music agnosia in a non-musician. J Cognit Neurosci. 1996;8:481–496. doi: 10.1162/jocn.1996.8.6.481. [DOI] [PubMed] [Google Scholar]
- 32.Peretz I, Kolinsky R. Boundaries of separability between melody and rhythm in music discrimination: a neuropsychological perspective. Q J Exp Psychol. 1993;46A:301–325. doi: 10.1080/14640749308401048. [DOI] [PubMed] [Google Scholar]
- 33.Peretz I, Morais J. Modes of processing melodies and ear asymmetry in non-musicians. Neuropsychologia. 1980;18:477–489. doi: 10.1016/0028-3932(80)90150-5. [DOI] [PubMed] [Google Scholar]
- 34.Petrides M. Frontal lobes and behavior. Curr Opin Neurobiol. 1994;4:207–211. doi: 10.1016/0959-4388(94)90074-4. [DOI] [PubMed] [Google Scholar]
- 35.Polk M, Kertesz A. Music and language in degenerative disease of the brain. Brain Cognit. 1993;22:98–117. doi: 10.1006/brcg.1993.1027. [DOI] [PubMed] [Google Scholar]
- 36.Porro CA, Francescato MP, Cettolo V, Diamond ME, Baraldi P, Zuiani C, Bazzocchi M, Di Prampero PE. Primary motor and sensory cortex activation during motor performance and motor imagery: a functional magnetic resonance imaging study. J Neurosci. 1996;16:7688–7698. doi: 10.1523/JNEUROSCI.16-23-07688.1996. [DOI] [PMC free article] [PubMed] [Google Scholar]
- 37.Povel DJ. A theoretical framework for rhythm perception. Psychol Res. 1984;45:315–337. doi: 10.1007/BF00309709. [DOI] [PubMed] [Google Scholar]
- 38.Povel DJ, Essens P. Perception of temporal patterns. Music Percept. 1985;2:411–440. doi: 10.3758/bf03207132. [DOI] [PubMed] [Google Scholar]
- 39.Robinson G, Solomon DJ. Rhythm is processed by the speech hemisphere. J Exp Psychol. 1974;102:508–511. doi: 10.1037/h0036025. [DOI] [PubMed] [Google Scholar]
- 40.Roland PE, Larsen B, Lassen NA, Skinhøj E. Supplementary motor area and other cortical areas in organization of voluntary movements in man. J Neurophysiol. 1980;43:118–136. doi: 10.1152/jn.1980.43.1.118. [DOI] [PubMed] [Google Scholar]
- 41.Roland PE, Skinhøj E, Lassen NA. Focal activation of human cerebral cortex during auditory discrimination. J Neurophysiol. 1981;45:1139–1151. doi: 10.1152/jn.1981.45.6.1139. [DOI] [PubMed] [Google Scholar]
- 42.Sakai K, Takino R, Hikosaka O, Miyauchi S, Sasaki Y, Pütz B, Fujimaki N. Separate cerebellar areas for motor control. NeuroReport. 1998;9:2359–2363. doi: 10.1097/00001756-199807130-00038. [DOI] [PubMed] [Google Scholar]
- 43.Stephan KM, Fink GR, Passingham RE, Silbersweig D, Ceballos-Baumann AO, Frith CD, Frackowiak RSJ. Functional anatomy of the mental representation of upper extremity movements in healthy subjects. J Neurophysiol. 1995;73:373–386. doi: 10.1152/jn.1995.73.1.373. [DOI] [PubMed] [Google Scholar]
- 44.Talairach J, Tournoux P. Co-planar stereotaxic atlas of the human brain. Thieme; New York: 1988. [Google Scholar]
- 45.Talavage TM, Edmister WB, Ledden PJ, Weisskoff RM. Quantitative assessment of auditory cortex responses induced by imager acoustic noise. Hum Brain Mapp. 1999;7:79–88. doi: 10.1002/(SICI)1097-0193(1999)7:2<79::AID-HBM1>3.0.CO;2-R. [DOI] [PMC free article] [PubMed] [Google Scholar]
- 46.Zatorre RJ, Evans AC, Meyer E, Gjedde A. Lateralization of phonetic and pitch discrimination in speech processing. Science. 1992;256:846–849. doi: 10.1126/science.1589767. [DOI] [PubMed] [Google Scholar]
- 47.Zatorre RJ, Evans AC, Meyer E. Neural mechanisms underlying melodic perception and memory for pitch. J Neurosci. 1994;14:1908–1919. doi: 10.1523/JNEUROSCI.14-04-01908.1994. [DOI] [PMC free article] [PubMed] [Google Scholar]