

Abstract
The p75 neurotrophin receptor (p75NTR) binds all known neurotrophins and has been suggested to either function as a coreceptor for the trk receptor tyrosine kinases or be involved in independent signaling leading to cell death. We have analyzed the effects of nerve growth factor (NGF) on the growth of cultured hippocampal pyramidal neurons and examined the possibility that the effects of NGF are mediated via generation of ceramide produced by neutral sphingomyelinase (N-SMase). During the initial hour of culture, the only detectable NGF receptor is p75NTR, which by comparative Western blot is expressed at 50- to 100-fold lower levels than on PC12 cells. At this early stage of culture, NGF accelerates neurite formation and outgrowth and induces ceramide formation in a dose-dependent manner. An NGF mutant that is deficient in p75NTR binding has no effect on neuronal morphology or ceramide formation. Furthermore, two anti-p75NTR antibodies (REX and 9651), which are known to compete with NGF for binding to p75NTR, mimic the effects of NGF, whereas a monoclonal antibody (MC192) targeted against a different epitope does not. Finally, scyphostatin, a specific N-SMase inhibitor, blocks the effects of NGF. We propose that a neurotrophin–p75NTR–ceramide signaling pathway influences outgrowth of hippocampal neurons. This signaling role of p75NTR may be distinct from other signaling pathways that lead to apoptosis.
Keywords: neurotrophins, NGF, p75NTR, ceramide, sphingomyelin, neurons, axons
Neurotrophic factors are polypeptide growth factors with activity and expression profiles mainly, if not exclusively, targeted to the nervous system. The paradigmal family of neurotrophic factors are the neurotrophins (Thoenen, 1991). All neurotrophins interact with two receptor types, the shared p75 neurotrophin receptor (p75NTR) (Chao, 1994) and discriminative receptor tyrosine kinases of the trk family (Barbacid, 1995). Although it is well established that the trk receptors are crucial in mediating the survival role of neurotrophins (Barbacid, 1995), the functions of p75NTR are still a matter of some debate. p75NTR has been proposed to act as a coreceptor for the trks (Barker and Shooter, 1994;Hantzopoulos et al., 1994; Chao and Hempstead, 1995; Huber and Chao, 1995) or to initiate independent signaling pathways. The most prominent trk-independent activity proposed for p75NTR is regulation of cell death (Casaccia-Bonnefil et al., 1996; Frade et al., 1996;Bredesen and Rabizadeh, 1997; Majdan et al., 1997; Bamji et al., 1998). Other p75-mediated activities have been proposed, including influencing the migration of Schwann cells (Anton et al., 1994), enhancing synaptic transmission (Blochl and Sirrenberg, 1996), regulating the functions of sensory neurons (Stucky and Koltzenburg, 1997), regulating myogenic differentiation (Seidl et al., 1998), and modulating calcium currents (Jiang et al., 1997). The proximal effectors and signaling pathways mediating these diverse effects have not been elucidated.
One potential signaling mechanism for p75NTR involves the membrane lipid ceramide (Cer). Over the past decade, it has become apparent that ceramide, when produced by the regulated hydrolysis of sphingomyelin (SM), acts as a second messenger in a variety of signaling pathways (Spiegel et al., 1996; Liu et al., 1997; Kolesnick and Kronke, 1998). It has also been shown that SM hydrolysis is induced by all four mammalian neurotrophins after binding to p75NTR, independent of trk activation (Dobrowsky et al., 1994, 1995). These observations, coupled with the diverse effects observed for ceramide in cultured postmitotic neurons (Schwarz et al., 1995; de Chaves et al., 1997; Furuya et al., 1998; Irie and Hirabayashi, 1998), provide a rationale for examining the possibility that the activity of p75NTR in neurons might be mediated by ceramide.
Specific impetus for the current work was provided by a previous study examining the effects of ceramide on one specific facet of the growth of cultured hippocampal neurons (Schwarz and Futerman, 1997). Thein vitro development of hippocampal neurons, cultured according to protocols developed by Banker and colleagues (Goslin et al., 1998), has been divided into a number of well-characterized stages (Dotti et al., 1988). Immediately after plating on glass coverslips, the neurons display many lamellipodia around the cell body (stage 1). The second stage of growth is marked by extension of a number of short processes, designated “minor processes” (stage 2). After some hours, one of the minor processes starts to grow rapidly and develops axonal characteristics (stage 3). Ceramide plays two distinct roles during these initial stages of growth, depending on its concentration (Schwarz and Futerman, 1997). The formation of minor neuronal processes from lamellipodia can be stimulated by incubation with low concentrations of short-acyl chain analogs of ceramide or by generation of endogenous ceramide by incubation with exogenously added sphingomyelinase (SMase); in contrast, high concentrations of ceramide induce apoptosis. The purpose of the current study was to investigate the growth-promoting effects of low concentrations of ceramide and specifically to determine whether these effects are mediated via activation of the p75NTR.
MATERIALS AND METHODS
Materials. Mouse 2.5S NGF was purchased from Promega (Madison, WI),N-{6-[(7-nitrobenzo-2-oxa-1,3-diazol-4-yl)amino]hexanoyl}-d-erythro-sphingosylphosphorylcholine (C6-NBD-SM) was from Molecular Probes (Eugene, OR), and the monoclonal anti-p75 antibody MC192 was from Boehringer Mannheim (Indianapolis, IN). The following reagents were provided as indicated: the NGF triple mutant was from C. F. Ibanez (Karolinska Institute, Stockholm, Sweden); the REX anti-p75 antibody was from G. Weskamp and L. Reichardt (University of California, San Francisco, CA); the 9651 anti-p75 antibody was from M. Chao (Skirball Institute, New York, NY); and scyphostatin was from T. Ogita (Sankyo Ltd., Tokyo, Japan). Other chemicals were from Sigma (St. Louis, MO), and solvents (analytical grade) were from Bio-Lab Laboratories Ltd. (Jerusalem, Israel).
Hippocampal cultures. Hippocampal neurons were cultured at low density as described previously (Goslin et al., 1998) with some modifications (Harel and Futerman, 1993; Schwarz et al., 1995; Schwarz and Futerman, 1997). Briefly, the dissected hippocampi of embryonic day 18 (E18) rats (Wistar), obtained from the Weizmann Institute Breeding Center, were dissociated by trypsinization (0.25% w/v, for 15 min at 37°C). The tissue was washed in Mg2+–Ca2+-free HBSS (Life Technologies, Gaithersburg, MD) and dissociated by repeated passage through a constricted Pasteur pipette. Cells were plated in minimal essential medium (MEM) with 10% horse serum at a density of 6000 or 12,000 cells per 13 mm glass coverslip that had been precoated with poly-l-lysine (1 mg/ml). After 2–4 hr, coverslips were transferred into 24-well multidishes (Nunc, Naperville, IL) containing a monolayer of astroglia. Coverslips were placed with the neurons facing downward and were separated from the glia by paraffin “feet.” Cultures were maintained in serum-free medium (MEM), which included N2 supplements (Goslin et al., 1998), ovalbumin (0.1%, w/v) and pyruvate (0.1 mm). In some experiments, neurons were analyzed before plating (“preplated neurons”), and in others, neurons were transferred into multiwell dishes that did not contain a glial monolayer but contained glial-conditioned medium (obtained from parallel dishes that contained a glial monolayer). Neurons cultured at high density (230,000 cells per 24 mm glass coverslip in 100 mm petri dishes) were used for biochemical analyses (Hirschberg et al., 1996;Schwarz and Futerman, 1997).
Analysis of neuronal morphology. For morphological analysis, coverslips were removed from the 24-well multidishes, and neurons were fixed in 1% (v/v) glutaraldehyde in PBS for 20 min at 37°C and mounted for microscopic examination in 50% glycerol in PBS. Neurons were examined by phase-contrast microscopy using an Achroplan 32× 0.4 NA phase two objective of a Zeiss (Oberkochen, Germany) Axiovert 35 microscope. Neuronal growth was analyzed based on the developmental criteria of Dotti et al. (1988). The number of cells in stages 1, 2, and 3 was analyzed; a cell was considered to be in stage 3 when the major axonal process was ≥30 μm (i.e., ∼10 μm longer than the next longest minor process (Goslin and Banker, 1989; Schwarz and Futerman, 1997).
SMase activity in vitro. Hippocampal neurons were incubated with a short-acyl chain derivative of SM, C6-NBD-SM, previously used to assay SMase activity in various cells and cell homogenates (Koval and Pagano, 1989,1991; Futerman et al., 1990; Futerman and Pagano, 1992). Neurons were collected before plating and homogenized in TK buffer (50 mm Tris, pH 7.4, and 25 mmKCl) for assay of neutral SMase (N-SMase) activity or in MES buffer (2-[N-morpholino]ethanesulfonic acid), pH 4.7, for assay of acid SMase (A-SMase) activity (Futerman et al., 1990). After determination of protein concentration (Bradford, 1976), homogenates were incubated with C6-NBD-SM (added as an equimolar complex with BSA (Pagano and Martin, 1994) at 37°C for various times. The reaction was terminated by addition of CHCl3/CH3OH (1:2, v/v), lipids were extracted (Bligh and Dyer, 1959) and separated by thin-layer chromatography (TLC) using CHCl3/CH3OH/9.8 mm CaCl2 (60:35:8, v/v/v) as the developing solvent and identified using authentic standards. For quantification of NBD fluorescence, lipids were recovered from the TLC plates by scraping, followed by extraction (Bligh and Dyer, 1959), and NBD fluorescence (excitation, 467 nm; emission, 520 nm) was measured using a Perkin-Elmer (Emeryville, CA) LS-5B luminescence spectrometer. Background fluorescence in the area corresponding to C6-NBD-Cer was measured by incubating with the same concentration of C6-NBD-SM in the absence of neuronal homogenates, extracting, separating by TLC, scraping the area corresponding to C6-NBD-Cer, and subtracting from C6-NBD-Cer fluorescence in the corresponding experimental lane.
SMase activity in vivo. Neurons were plated at a density of 230,000 cells per 24 mm coverslip (Hirschberg et al., 1996) and incubated with C6-NBD-SM (dissolved in EtOH) for 1 hr before addition of NGF. After various times of incubation with NGF, cells were removed from the coverslips by scraping with a rubber policeman into ice-cold distilled water and lyophilized. C6-NBD lipids were extracted and analyzed as described above.
C6-NBD-Cer is able to exit its site(s) of formation from C6-NBD-SM (Koval and Pagano, 1989) and accumulate in the Golgi apparatus in which it is metabolized to C6-NBD-glucosylceramide (C6-NBD-GlcCer) (Futerman and Pagano, 1991) and resynthesized to C6-NBD-SM (Futerman et al., 1990). Therefore, in our analysis of C6-NBD-Cer formation, we added the amount of C6-NBD-GlcCer formed (C6-NBD-GlcCer can only be formed from C6-NBD-Cer) to that of C6-NBD-Cer. In addition, C6-NBD-Cer can be metabolized back to C6-NBD-SM. Because newly synthesized C6-NBD-SM cannot be distinguished from exogenously added C6-NBD-SM, the amount of newly synthesized C6-NBD-SM (and hence the amount of C6-NBD-Cer lost to resynthesis) was calculated by incubating cells directly with similar amounts of C6-NBD-Cer as generated during incubations with C6-NBD-SM and calculating the ratio of C6-NBD-GlcCer synthesis to C6-NBD-SM synthesis. This ratio (1:0.39) was then used to correct for the amount of C6-NBD-Cer lost to resynthesis of C6-NBD-SM, exactly as described previously (Koval and Pagano, 1989).
Transcript identification. Expression of neurotrophin receptors in hippocampal neurons was analyzed by RNase protection assays (RPA), as described previously (Funakoshi et al., 1993). Total RNA from preplated hippocampal neurons was incubated with32P-labeled antisense riboprobes [expected protected fragment sizes (nt) in parentheses], generated by transcription from linearized subclones of p75NTR (400), TrkA (420), TrkB (390), TrkC (420), and glyceraldehyde 3-phosphate dehydrogenase (GAP-DH) (150).
Reverse transcription (RT)-PCR on poly(A+) mRNA was subsequently performed using the Titan one-tube system from Boehringer Mannheim, as per manufacturer’s instructions. The expression of p75NTR, TrkA, and GAP-DH was examined in both pre-plated and cultured neurons, using primer sequences as described: (1) p75NTR, sense primer, GTCGTGGGCCTTGTGGCC; reverse primer, CTGTGAGTTCACACTGGGG; product size, 480 bp; (2) TrkA, sense primer, CGTTGATGCTGGCTTGTGC; reverse primer, GGAGAGATTCAGGTGACTGA; product size, 296 bp; (3) GAP-DH, sense primer, TTAGCACCCCTGGCCAAGG; reverse primer, CTTACTCCTTGGAGGCCATG; product size, 540 bp.
Western blot. Cultured neurons on coverslips were processed for Western blotting by extraction in 0.125 mTris-HCl, pH 6.8, 4% SDS, and 0.2 m DTT. The neuronal extract was passed six times through a 21-gauge syringe needle to ensure complete homogenization, followed by pelleting of debris by microcentrifugation. Extracts were supplemented with 10% glycerol and loading dye and boiled for 10 min before SDS-PAGE. Gels were blotted to nitrocellulose, and the blots were incubated overnight in ice-cold blocking solution. The blots were then probed with primary antibodies (anti-REX IgG at final concentration of 1 μg/ml or 9651 antiserum at 1:1000 dilution) for 2.5 hr at room temperature, before developing with secondary antibody and ECL detection. Densitometric scans of blots were analyzed with the Bio-Rad (Hercules, CA) Multi-Analyst 1.01 program.
Statistical analysis. A one-way ANOVA was performed to determine whether there were significant differences between treatments (see Figs. 4-6). When ANOVA was used and when this analysis indicated significance (p < 0.01),post hoc Fisher’s protected least significant difference test analysis was used to determine which conditions were significantly different from each other.
Fig. 4.

Effect of NGFtm and anti-p75NTR on neuronal growth. A, Hippocampal neurons were incubated with NGF or NGFtm immediately after placing coverslips in multiwell dishes with or without a glial monolayer, and development was compared with control cells (Con); NGF and NGFtm were added at a concentration of 200 ng/ml in the presence of glia and 50 ng/ml in the absence of glia. Data are means ± SEM of the percent of stage 3 cells after 18 hr in culture for three different cultures in which 50 cells per coverslip were analyzed for four coverslips per treatment. *p < 0.01, statistically significant differences from control; ANOVA. B, Neurons were placed in multiwell dishes that did not contain a glial monolayer and incubated with REX IgG versus a nonrelevant (NR) IgG (both IgGs at final concentration of 15 μg/ml), 9651 antiserum (ser) versus a nonrelevant antiserum (sera at 1:100 dilution), or with the 192 monoclonal antibody versus a nonrelevant monoclonal antibody (monoclonals at final concentration of 0.2 μg/ml). Development was compared after 18 hr with control cells (100%) and with neurons incubated with NGF (100 ng/ml). Data are means ± SEM for three to seven different cultures in which 50 cells per coverslip were analyzed for two (REX and 192) or four (9651) coverslips per treatment. *p < 0.01, statistically significant differences; ANOVA.
Fig. 5.
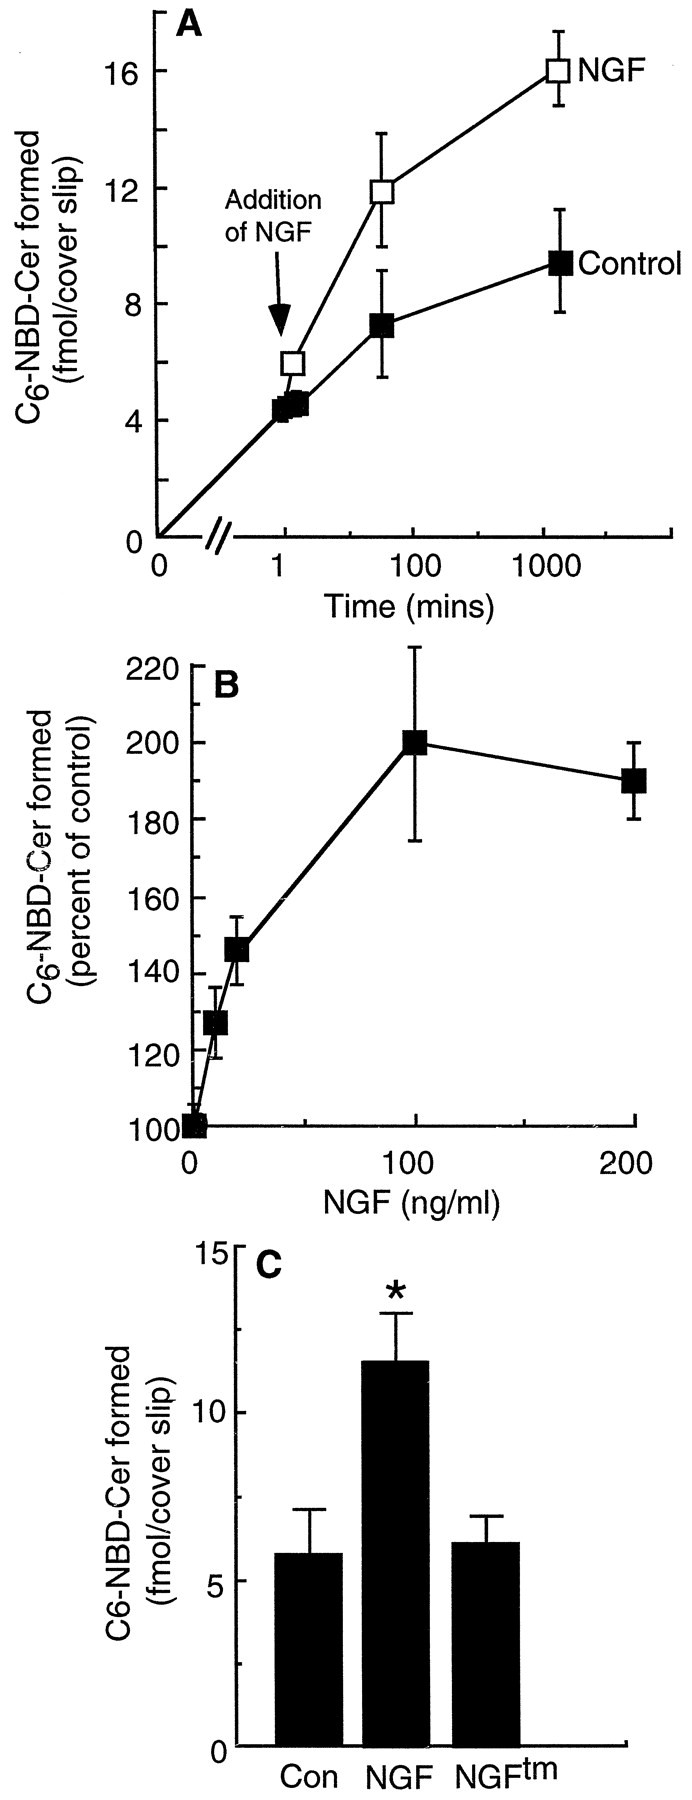
Time and dose dependence of C6-NBD-Cer formation after incubation with NGF. A, Neurons were incubated for 1 hr with C6-NBD-SM before addition of NGF (200 ng/ml). C6-NBD-Cer formation was calculated as described in Materials and Methods. Data are means ± SEM from five experiments. Note that, as the amount of C6-NBD-SM hydrolyzed to C6-NBD-Cer increases, more C6-NBD-SM transfers from the medium to the neurons (Futerman and Pagano, 1992), with an approximately linear relationship between the amount of cell-associated C6-NBD-SM and the amount of C6-NBD-Cer formed. The slope of NGF-treated cells is significantly different from that of control cells (p < 0.05). B, Neurons were incubated for 1 hr with C6-NBD-SM, followed by an additional 12 min incubation with various concentrations of NGF, before analysis of C6-NBD-Cer formation. Note that, after 12 min incubation, essentially no C6-NBD-GlcCer is synthesized from C6-NBD-Cer, and the data were therefore not corrected to take into account synthesis of C6-NBD-GlcCer and resynthesis of C6-NBD-SM (see Materials and Methods). Data are means ± SEM from three independent experiments.C, Comparison of the effects of NGF and the NGFtm on C6-NBD-Cer formation. Neurons were incubated for 1 hr with C6-NBD-SM and for a further 1 hr with 200 ng/ml NGF or NGFtm before analysis of C6-NBD-Cer formation. *p < 0.01, statistically significant differences; ANOVA.
Fig. 6.

Effect of scyphostatin on C6-NBD-Cer formation. A, Rat embryonic cerebral cortex was homogenized in TK buffer, pH 7.4 (with or without 10 mm MgCl2) or in 10 mm MES buffer, pH 4.7, for analysis of SMase activities. Homogenates (20 μg of protein) were incubated for 15 min with scyphostatin (dissolved in ethanol; corresponding amounts of ethanol were added to control samples), followed by a 30 min incubation with 10 μmC6-NBD-SM. After terminating the reaction, C6-NBD-Cer formation was analyzed. Results are means ± SEM of three independent experiments. The slope of A-SMase activity is significantly different from that of N-SMase activity (with or without Mg) (p < 0.0001).B, Top, Coverslips containing neurons were placed in dishes that did not contain a glial monolayer and incubated for 1 hr with or without scyphostatin (1 μm), followed by an additional 1 hr incubation after addition of 1.5 μm C6-NBD-SM. NGF (100 ng/ml) was then added and, after a further 1 hr, the amount of C6-NBD-Cer formed was analyzed. Data are means ± SEM for three independent experiments. Bottom, Neuronal morphology was analyzed 18 hr after adding reagents. Results are means of the number of cells in stage 3 as a percent of the control ± SEM for three different cultures in which 50 cells per coverslip were analyzed for four coverslips per treatment (bottom). *p < 0.01, statistically significant differences; ANOVA.
RESULTS
Hippocampal neurons contain high levels of N-SMase
A previous study demonstrated that addition of bacterial N-SMase to hippocampal neurons, or incubation with short-acyl chain derivatives of ceramide, stimulated early stages of neuronal growth in cultured hippocampal neurons, namely the transition through stages 1 to 3 (Schwarz and Futerman, 1997). To ascertain whether the growth of hippocampal neurons might be regulated by endogenous SMase, we have now characterized the relative activities of N-SMase and A-SMase in homogenates of hippocampal neurons, using a short-acyl chain fluorescent derivative of SM, C6-NBD-SM, as substrate (Koval and Pagano, 1989). In vitro, SMase activity at neutral pH could be stimulated approximately twofold by addition of MgCl2 and completely abolished by EDTA (Fig.1A), a characteristic of membrane-bound N-SMase (Sperker and Spence, 1983). Moreover, the specific activity of N-SMase assayed in the presence of MgCl2 was approximately threefold higher than that of A-SMase, irrespective of whether A-SMase was assayed in the presence of divalent cations (Fig. 1B). These data demonstrate that N-SMase is the major SMase activity in hippocampal neurons; similarly, earlier studies demonstrated high activity of N-SMase in brain (Sperker and Spence, 1983).
Fig. 1.

Characterization of SMase activities in hippocampal neurons. A, Cation dependence. Homogenates of hippocampal neurons (preplated) (20 μg of protein) were assayed in 25 mm KCl, and 50 mm Tris, pH 7.4, for N-SMase activity or in MES buffer, pH 4.7, for A-SMase activity, by incubation with C6-NBD-SM (10 μm) in a final volume of 200 μl, with or without addition of cations or EDTA. After 1 hr at 37°C, the reaction was terminated, and C6-NBD-Cer formation was analyzed. Results are means ± SEM of three independent experiments. B, Specific activity. Homogenates of hippocampal neurons (20 μg of protein) were assayed in 25 mm KCl, 10 mm MgCl2, and 50 mm Tris, pH 7.4, for N-SMase activity or in MES buffer, pH 4.7, for A-SMase activity, by incubation with C6-NBD-SM in a final volume of 50 μl. After 1 hr at 37°C, the reaction was terminated, and C6-NBD-Cer formation was analyzed. Results are means ± SEM of two independent experiments.
Cultured hippocampal neurons express p75NTR
We next characterized neurotrophin receptor expression in cultured hippocampal neurons. Because activated trk receptors have been reported to block p75NTR signaling (Dobrowsky et al., 1995; Yoon et al., 1998), it was also important to determine which trk receptors are coexpressed with p75NTR in the neurons. RNase protection assays on preplated neurons (Fig. 2A) revealed robust expression of both TrkB and TrkC, low expression of p75NTR, and no observable expression of TrkA. This was confirmed by RT-PCR analysis in which no detectable expression of TrkA was observed in the initial hour of culture, although extremely low levels of TrkA transcript were detected after 1 d in culture (Fig.2B). p75NTR mRNA is expressed in preplated neurons and somewhat upregulated after 24 hr in culture (Fig.2B). p75NTR protein expression in cultured neurons was confirmed by Western blots with both the αREX (Weskamp and Reichardt, 1991) and 9651 (Huber and Chao, 1995) antibodies (Fig.2C). Densitometric quantitation of the blots suggests that these cultured neurons express p75NTR at a 50- to 100-fold lower level than PC12 cells, allowing for an average of a few hundred receptor molecules per neuron (p75 in PC12 has been quantified at ∼50,000 receptors per cell) (Mahadeo et al., 1994; Akar and Wallace, 1998). To examine whether this low level of expression is uniform, hippocampal neurons were examined by immunofluorescence analysis using the anti-REX antibody. Low levels of immunoreactivity were observed on axonal processes and cell bodies and were at similar levels on nearly all neurons in the culture (data not shown).
Fig. 2.

Neurotrophin receptor expression in hippocampal neurons. A, Total RNA was extracted from neurons before plating (preplating) and analyzed by RPA. Assays were repeated on three different RNA extractions, producing the same results. The position of a 400 nt marker is shown. H, hippocampal neurons; Y, yeast tRNA. B, Poly(A+) mRNA was extracted from neurons before plating (−3), 1 hr after coculturing with the glia (1), and 24 hr after coculturing (24). Comparison samples include mRNA from glia (G) and from PC12 cells (PC12). RT-PCR was repeated three times producing the same results. C, Western blot analysis was performed on total cellular protein of hippocampal neurons after 1 hr in culture. PC12 cell extracts were run for comparison. Each lanerepresents ∼300,000 cells. Right, Probed with anti-REX IgG; left, probed with 9651 antiserum. Note that the PC12 lane probed with anti-REX is overexposed to enable detection in the neuronal sample.
NGF stimulates neuronal growth
Because hippocampal neurons express p75NTR, TrkB, and TrkC, but not TrkA (Fig. 2), NGF is the only neurotrophin that can signal in a trk-independent manner via p75NTR in this system. We therefore determined whether NGF stimulates neuronal growth. NGF was applied to hippocampal neurons immediately after the cells were placed in culture, and morphology was analyzed after 18 hr. Initial dose–response experiments showed that 200 ng/ml NGF significantly enhanced the outgrowth of hippocampal neurons, although lower concentrations (∼50 ng/ml) also had an effect. The number of stage 3 neurons (i.e., neurons with a defined axon) was 45% in control cells but 70% in NGF-treated neurons (200 ng/ml), with a corresponding decrease in the number of stages 1 and 2 neurons in NGF-treated versus control cells (Fig.3). The number of stage 3 cells after 18 hr treatment with NGF is similar to that obtained after incubation with exogenously added N-SMase or C6-NBD-Cer (Schwarz and Futerman, 1997).
Fig. 3.

Effect of NGF on neuronal development. NGF (200 ng/ml) was added to cultures immediately after the coverslips containing the neurons were placed in multiwell dishes containing a glial monolayer. Neuronal morphology was analyzed after 18 hr. Theleft panel shows the percent of cells in each developmental stage as means for three different cultures in which 50 cells per coverslip were analyzed for four coverslips per treatment: stage 1 (filled bars), stage 2 (spotted bars), and stage 3 (striped bars). The distribution of control cells is statistically different from that of NGF-treated cells (p = 0.0001; χ2 test). The right panel shows camera lucida drawings obtained from distinct fields of typical control and NGF-treated cells and gives examples of each developmental stage.
To determine whether the glial cells present in the culture dishes might be contributing to the ability of NGF to stimulate neuronal growth, similar incubations with NGF were performed using neurons cultured in the absence of a glial monolayer. A lower concentration of NGF was required to accelerate neuronal outgrowth than in the presence of glia. A 32% increase in the number of stage 3 neurons was observed using 50 or 100 ng/ml NGF. These data confirm that the effects of NGF are mediated by a direct interaction of NGF with neurons and not via an indirect effect mediated by glia.
The fact that TrkA expression is almost undetectable in cultured hippocampal neurons strongly suggests that the effects of NGF in these neurons are mediated via p75NTR. To rigorously test this hypothesis, we used three separate reagents that are known to discriminate between p75NTR and TrkA. The first series of experiments was conducted with the NGF triple mutant (NGFtm), which is deficient in p75NTR binding but nevertheless activates TrkA (Ibanez et al., 1992). Incubation of neurons with NGFtm at 200 ng/ml did not stimulate neuronal outgrowth, irrespective of whether neurons were cultured with or without the glial monolayer (Fig.4A). NGFtm from the same batch was active when assayed for TrkA phosphorylation on a TrkA-expressing fibroblast cell line (data not shown); thus, the lack of effect of NGFtm in the hippocampal cultures appears to be caused by its deficiency in interaction with p75NTR.
In the second series of experiments, we tested the effects of two polyclonal antisera raised against the extracellular domain of p75NTR, αREX (Weskamp and Reichardt, 1991), and α9651 (Huber and Chao, 1995). Because both antisera have been shown previously to block NGF binding to p75NTR, we assumed that the effects of NGF on neurons would be blocked by coincubation with the antisera. Unexpectedly, preliminary experiments applying anti-REX serum alone at dilutions of 1:200–1:100 revealed pronounced effects on neuronal outgrowth. To ensure specificity of the response, the αREX serum was purified over a Protein G column, and purified IgG was used thereafter. The 9651 antiserum was used directly. Both anti-REX IgG and 9651 antiserum had pronounced effects on neuronal outgrowth (Fig. 4B). The effects were specific, because they could not be mimicked by a number of IgGs or antisera raised against unrelated antigens (Fig.4B). Coapplication of NGF together with αREX did not reveal any significantly additive effects above that observed with each reagent alone (151.3 ± 13.7% increase above control with the combination vs 138–145% with each alone); thus, it appears that, in this assay, they act as functionally interchangeable ligands of p75NTR.
MC192 is a monoclonal antibody against an extracellular epitope on p75NTR that appears to be distinct from the NGF binding site (Chandler et al., 1984; Barker and Shooter, 1994). It affects trophic responses in cells that coexpress TrkA and p75NTR (Barker and Shooter, 1994;Maliartchouk and Saragovi, 1997) and was recently shown to block NGF-induced p75NTR-mediated induction of dopamine release in mesencephalic neurons (Blochl and Sirrenberg, 1996). We therefore compared its effects with those of the NGF competitor antibodies used previously. In contrast to anti-REX and 9651, MC192 application at 0.2 μg/ml [a concentration shown previously to be optimal for modulating NGF trophic effects (Maliartchouk and Saragovi, 1997)] did not cause any significant changes in neuronal morphology in the hippocampal neuron cultures (Fig. 4B).
NGF stimulates ceramide formation in a time- and dose-dependent manner
The data presented above suggest that the outgrowth-promoting effects of NGF are mediated via p75NTR in cultured hippocampal neurons. Because p75NTR has been shown to signal via the SM pathway (Dobrowsky et al., 1994) and because exogenously added ceramide (Schwarz and Futerman, 1997) is able to accelerate the early stages of neuronal outgrowth in a similar manner to that observed for NGF, we examined whether NGF binding to the p75NTR receptor stimulates ceramide formation in cultured neurons. Hippocampal neurons were incubated with C6-NBD-SM for 1 hr and subsequently incubated for up to 24 hr with or without NGF (200 ng/ml). During the first 12 min after addition of NGF, the rate of C6-NBD-Cer formed from C6-NBD-SM increased more than sevenfold in NGF-treated neurons (0.14 fmol/min per coverslip in the presence of NGF, compared with 0.02 fmol/min per coverslip in control neurons). This steep increase in ceramide formation results in an accumulative approximate twofold increase in the total amount of C6-NBD-Cer formed per coverslip in NGF-treated versus control neurons after 24 hr (Fig.5A). Furthermore, there is a dose-dependent relationship between the concentration of NGF and the amount of C6-NBD-Cer formed after 12 min (Fig.5B) and 1 hr (data not shown).
In contrast to the ability of NGF to stimulate ceramide formation, NGFtm had no such effect (Fig.5C). This is consistent with its lack of effect on neuronal morphology (Fig. 4A). Thus, NGF stimulation of ceramide formation in hippocampal neurons is a direct consequence of p75NTR binding.
NGF stimulates neuronal growth via N-SMase
To determine whether the ability of NGF to stimulate ceramide formation after binding to p75NTR is the cause of the morphological response or simply correlated with it, we attempted to block the effects of NGF using scyphostatin, a recently described inhibitor of N-SMase (Tanaka et al., 1997). We first determined the specificity and concentration dependence of scyphostatin in embryonic rat brain tissuein vitro. A dose-dependent inhibition of N-SMase was observed at scyphostatin concentrations between 0.1 and 50 μm (Fig.6A), whereas essentially no inhibition of A-SMase was detected. Even at 50 μm scyphostatin, a concentration representing fivefold molar excess over the substrate C6-NBD-SM, A-SMase activity was only inhibited to a minor extent; these data are consistent with the differences in IC50 values for N-SMase and A-SMase (Tanaka et al., 1997). Thus, scyphostatin specifically inhibits N-SMase activity in brain.
Preincubation of neurons with 1 μm scyphostatin completely blocked the ability of NGF to stimulate ceramide formation (Fig. 6B), confirming that inhibition of N-SMase blocks ceramide signaling downstream of p75NTR. Furthermore, preincubation (1 hr) with scyphostatin before application of NGF abolished the ability of NGF to stimulate neuronal growth (Fig.6C). Thus, ceramide signaling induced by NGF binding to the p75NTR is part of the signal pathway linking NGF to effects on neuronal outgrowth during the early stages of development of cultured hippocampal neurons.
DISCUSSION
The data presented above demonstrate that NGF stimulates the growth–development of cultured hippocampal neurons via the generation of ceramide by N-SMase. P75NTR is the only detectable NGF-specific receptor in these neurons, and an NGF mutant deficient in p75NTR-binding is not active. Furthermore, two anti-p75NTR antibodies (REX and 9651), which can compete with NGF for binding to p75NTR, mimic the effects of NGF in this in vitro system, whereas another antibody (MC192) targeted to a distinct p75NTR epitope does not. Finally, a specific N-SMase inhibitor blocks NGF effects on hippocampal neuron outgrowth. These data strongly support a primary role for the p75NTR–ceramide signaling pathway in mediating the effects of NGF on the growth of cultured hippocampal neurons. It should be noted, however, that a secondary or supplementary role for TrkB and/or TrkC signaling cannot be ruled out, in light of the recent finding that C2-ceramide exposure augments trk tyrosine phosphorylation (MacPhee and Barker, 1999).
The mode of ceramide action in mediating various cellular responses, particularly apoptosis, has recently received great attention (Hofmann and Dixit, 1998; Kolesnick and Kronke, 1998). Although a number of important issues remain to be resolved concerning the mechanism of activation and possible distinct roles of ceramide generated from A-SMase and N-SMase, concerning the membrane topology of SM and ceramide, and concerning the down-stream targets of ceramide, there appears to be little doubt that ceramide is an important second messenger in signaling pathways that lead to a variety of cellular responses. Although there is some evidence that ceramide generated byde novo synthesis can act in signaling pathways (Bose et al., 1995), the major mechanism for generating ceramide appears to be via degradation of SM at the plasma membrane by SMase(s), of yet undefined molecular identity(ies) (Liu et al., 1998; Tomiuk et al., 1998). The complexity of these issues is illustrated by a recent study in which TNF induced a multiphasic increase in intracellular ceramide levels in Kym-1 rhabdomyosarcoma cells (Bourteele et al., 1998). Distinct enzymes were found to contribute to three waves of ceramide generation, N-SMase, ceramide synthase, and A-SMase, with peak activities at 1–2, 40, and ∼200 min, respectively, the latter coinciding with progression to irreversible damage. Interestingly, we observed an increase in the rate of generation of ceramide from SM after as little as 12 min exposure to NGF. The low concentrations of ceramide generated by p75NTR activation in cultured hippocampal pyramidal neurons result in enhanced rates of neuronal growth.
Although our data suggest a role for p75NTR in regulating neuronal growth, the most prominent trk-independent physiological role suggested so far for p75NTR is the control of cell death in specific cell types in the nervous system (Casaccia-Bonnefil et al., 1996; Frade et al., 1996; Bredesen and Rabizadeh, 1997; Bamji et al., 1998). However, a number of studies have suggested involvement of p75NTR in regulation of neuronal function and in plasticity-related activities of neurotrophins (Greene, 1977; Anton et al., 1994; Blochl and Sirrenberg, 1996; Stucky and Koltzenburg, 1997; Seidl et al., 1998). For instance, NGF induces the release of dopamine via activation of p75NTR in cultured mesencephalic neurons from embryonic (E14) rats (Blochl and Sirrenberg, 1996). Strikingly, a short-acyl chain analog of ceramide, C2-ceramide, as well as exogenously added SMase, also induced dopamine release at a comparable level with that released via NGF (Blochl and Sirrenberg, 1996). The MC192 antibody inhibited ceramide generation in that study (Blochl and Sirrenberg, 1996), which is consistent with its lack of effect on neuronal morphology in the current work (Fig. 4B). These results, together with ours, support a role for ceramide signaling downstream of p75NTR in the regulation of neuronal physiology and function. The in vivosignificance of ceramide signaling downstream of p75NTR is currently unknown, although it is striking that deficits in sympathetic target innervation in p75NTR−/− mice were attributed to a lack in axonal growth (Lee et al., 1994). The currently available line of p75NTR−/− mice reveal a relatively mild phenotype (Lee et al., 1992), although a suggestion has been raised that this line is not a complete null mutation (Dechant and Barde, 1997). Future analyses of p75NTR−/− and N-SMase−/− mice, when available, will be required to address this issue. Furthermore, because functional effects might not necessarily be reflected in gross anatomy or histology, advanced physiological analyses may be the best option to shed light on these questions (Stucky and Koltzenburg, 1997).
The signaling mechanisms downstream of the binding of NGF to p75NTR may differ from the mechanisms described for other receptors, such as the well characterized cascade of protein–protein interactions, which links the Fas/TNF receptor family to caspase enzymes involved in apoptosis (Yuan, 1997). For instance, in contrast to the Fas/TNF receptor family, the p75NTR death domain does not self-aggregate (Liepinsh et al., 1997), although it has a death domain with a similar sequence and structure to that of the Fas/TNF receptor family. Candidate downstream signaling mechanisms for p75NTR include ceramide generation via N-SMase (Dobrowsky and Carter, 1998;Dobrowsky et al., 1994, 1995; current study) and pathways that lead to jun kinase or NFκB activation (Carter et al., 1996; Casaccia-Bonnefil et al., 1996). Ceramide generation is the only p75NTR signaling response described to date for all neurotrophins (Dobrowsky et al., 1995), whereas the other responses were originally thought to be NGF-specific. Recently, however, it was observed that BDNF-induced apoptosis of sympathetic neurons is mediated via p75NTR and jun kinase (Bamji et al., 1998). This apparent conflict can be resolved if it is assumed that different signaling pathways are responsible for the different effects of binding of neurotrophins to p75NTR. Such a possibility is reminiscent of a model proposed for signaling of the p55 TNF receptor in which the death domain of p55 signals apoptosis, although a distinct 11 amino acid domain activates the N-SMase pathway (Adam-Klages et al., 1996). The effects of the REX antiserum in blocking NGF-induced apoptosis (Frade et al., 1996), although inducing neuronal outgrowth (this study), are consistent with this hypothesis. Further support is provided by an earlier study in which deletion of residues 249–305 of p75NTR abolished its capacity to mediate SM hydrolysis (Dobrowsky et al., 1995). This region contains juxtamembrane and cytoplasmatic sequences that are N terminal to the p75NTR death domain. Thus, an important issue for future studies is to clarify which segments of the p75NTR intracellular domain are required for apoptotic signaling and which are required for ceramide generation through N-SMase.
Footnotes
This work was supported by grants from the Buddy Taub Foundation (A.H.F. and M.F.), the Israel Science Foundation (A.H.F.), the Human Frontiers Science Program (M.F.), and the Nella and Leon Benoziyo Center For Neurosciences at the Weizmann Institute (M.F.). M.F is an Allon fellow and the incumbent of the Daniel E. Koshland Sr. Career Development Chair. We thank Rivka Zisling for expert help in preparing and maintaining the hippocampal cultures and the following for generously providing reagents and antibodies: C. F. Ibanez (Karolinska Institute, Stockholm, Sweden), G. Weskamp (Sloan-Kettering Cancer Center, New York, NY), L. Reichardt (University of California, San Francisco, CA), M. V. Chao (Skirball Institute, New York, NY), and T. Ogita (Sankyo Inc., Tokyo, Japan).
Correspondence should be addressed to Michael Fainzilber, Molecular Neurobiology Group, Department of Biological Chemistry, Weizmann Institute of Science, Rehovot 76100, Israel. E-mail:bmfainz@weizmann.weizmann.ac.il.
REFERENCES
- 1.Adam-Klages S, Adam D, Wiegmann K, Struve S, Kolanus W, Schneider-Morgener J, Kronke M. FAN, a novel WD-repeat protein, couples the p55 TNF-receptor to neutral sphingomyelinase. Cell. 1996;86:937–947. doi: 10.1016/s0092-8674(00)80169-5. [DOI] [PubMed] [Google Scholar]
- 2.Akar CA, Wallace WC. Amyloid precursor protein modulates the interaction of nerve growth factor with p75 receptor and potentiates its activation of trkA phosphorylation. Brain Res Mol Brain Res. 1998;56:125–132. doi: 10.1016/s0169-328x(98)00037-0. [DOI] [PubMed] [Google Scholar]
- 3.Anton ES, Weskamp G, Reichardt LF, Mathew WD. Nerve growth factor and its low-affinity receptor promote Schwann cell migration. Proc Natl Acad Sci USA. 1994;91:2795–2799. doi: 10.1073/pnas.91.7.2795. [DOI] [PMC free article] [PubMed] [Google Scholar]
- 4.Bamji SX, Majdan M, Pozniak CD, Belliveau DJ, Aloyz R, Kohn J, Causing CG, Miller FD. The p75 neurotrophin receptor mediates neuronal apoptosis and is essential for naturally occurring sympathetic neuron death. J Cell Biol. 1998;140:911–923. doi: 10.1083/jcb.140.4.911. [DOI] [PMC free article] [PubMed] [Google Scholar]
- 5.Barbacid M. Structural and functional properties of the Trk family of neurotrophin receptors. Ann NY Acad Sci. 1995;766:442–558. doi: 10.1111/j.1749-6632.1995.tb26693.x. [DOI] [PubMed] [Google Scholar]
- 6.Barker PA, Shooter EM. Disruption of NGF binding to the low affinity neurotrophin receptor p75LNTR reduces NGF binding to TrkA on PC12 cells. Neuron. 1994;13:203–215. doi: 10.1016/0896-6273(94)90470-7. [DOI] [PubMed] [Google Scholar]
- 7.Bligh EG, Dyer WJ. A rapid method of total lipid extraction and purification. Can J Biochem Physiol. 1959;37:911–917. doi: 10.1139/o59-099. [DOI] [PubMed] [Google Scholar]
- 8.Blochl A, Sirrenberg C. Neurotrophins stimulate the release of dopamine from rat mesencephalic neurons via trk and p75(lntr) receptors. J Biol Chem. 1996;271:21100–21107. doi: 10.1074/jbc.271.35.21100. [DOI] [PubMed] [Google Scholar]
- 9.Bose R, Verheij M, Haimovitz-Friedman A, Scotto K, Fuks Z, Kolesnick R. Ceramide synthase mediates daunorubicin-induced apoptosis: an alternative mechanism for generating death signals. Cell. 1995;82:405–414. doi: 10.1016/0092-8674(95)90429-8. [DOI] [PubMed] [Google Scholar]
- 10.Bourteele S, Haubetaer A, Doppler H, Horn-Muller J, Ropke C, Schwarzmann G, Pfizenmaier K, Muller G. Tumor necrosis factor induces ceramide oscillations and negatively controls sphingolipid synthases by caspases in apoptotic kym-1 cells. J Biol Chem. 1998;273:31245–31251. doi: 10.1074/jbc.273.47.31245. [DOI] [PubMed] [Google Scholar]
- 11.Bradford MM. A rapid and sensitive method for the quantitation of microgram quantities of protein utilizing the principle of protein-dye binding. Anal Biochem. 1976;72:248–254. doi: 10.1016/0003-2697(76)90527-3. [DOI] [PubMed] [Google Scholar]
- 12.Bredesen DE, Rabizadeh S. p75NTR and apoptosis: Trk-dependent and Trk-independent effects. Trends Neurosci. 1997;20:287–290. doi: 10.1016/s0166-2236(96)01049-1. [DOI] [PubMed] [Google Scholar]
- 13.Carter BD, Kaltschmidt C, Kaltschmidt B, Offenhauser N, Bohm MR, Baeuerle PA, Barde YA. Selective activation of NF-kappa B by nerve growth factor through the neurotrophin receptor p75. Science. 1996;272:542–545. doi: 10.1126/science.272.5261.542. [DOI] [PubMed] [Google Scholar]
- 14.Casaccia-Bonnefil P, Carter BD, Dobrowsky RT, Chao MV. Death of oligodendrocytes mediated by the interaction of nerve growth factor with its receptor p75. Nature. 1996;383:716–719. doi: 10.1038/383716a0. [DOI] [PubMed] [Google Scholar]
- 15.Chandler CE, Parsons LM, Hosang M, Shooter EM. A monoclonal antibody modulates the interaction of nerve growth factor with PC12 cells. J Biol Chem. 1984;259:6882–6889. [PubMed] [Google Scholar]
- 16.Chao MV. The p75 neurotrophin receptor. J Neurobiol. 1994;25:1373–1385. doi: 10.1002/neu.480251106. [DOI] [PubMed] [Google Scholar]
- 17.Chao MV, Hempstead BL. p75 and trk: a two-receptor system. Trends Neurosci. 1995;18:321–326. [PubMed] [Google Scholar]
- 18.de Chaves EIP, Bussiere M, Vance DE, Campenot RB, Vance JE. Elevation of ceramide within distal neurites inhibits neurite growth in cultured rat sympathetic neurons. J Biol Chem. 1997;272:3028–3035. doi: 10.1074/jbc.272.5.3028. [DOI] [PubMed] [Google Scholar]
- 19.Dechant G, Barde YA. Signalling through the neurotrophin receptor p75NTR. Curr Opin Neurobiol. 1997;7:413–418. doi: 10.1016/s0959-4388(97)80071-2. [DOI] [PubMed] [Google Scholar]
- 20.Dobrowsky RT, Carter BD. Coupling of the p75 neurotrophin receptor to sphingolipid signaling. Ann NY Acad Sci. 1998;845:32–45. doi: 10.1111/j.1749-6632.1998.tb09660.x. [DOI] [PubMed] [Google Scholar]
- 21.Dobrowsky RT, Werner MH, Castellino AM, Chao MV, Hannun YA. Activation of the sphingomyelin cycle through the low-affinity neurotrophin receptor. Science. 1994;265:1596–1599. doi: 10.1126/science.8079174. [DOI] [PubMed] [Google Scholar]
- 22.Dobrowsky RT, Jenkins GM, Hannun YA. Neurotrophins induce sphingomyelin hydrolysis: modulation by co-expression of p75NTR with Trk receptors. J Biol Chem. 1995;270:22135–22142. doi: 10.1074/jbc.270.38.22135. [DOI] [PubMed] [Google Scholar]
- 23.Dotti CG, Sullivan CA, Banker GA. The establishment of polarity by hippocampal neurons in culture. J Neurosci. 1988;8:1454–1468. doi: 10.1523/JNEUROSCI.08-04-01454.1988. [DOI] [PMC free article] [PubMed] [Google Scholar]
- 24.Frade JM, Rodriguez-Tebar A, Barde YA. Induction of cell death by endogenous nerve growth factor through its p75 receptor. Nature. 1996;383:166–168. doi: 10.1038/383166a0. [DOI] [PubMed] [Google Scholar]
- 25.Funakoshi H, Frisen J, Barbany G, Timmusk T, Zachrisson O, Verge VMK, Persson H. Differential expression of mRNAs for neurotrophins and their receptors following axotomy of the sciatic nerve. J Cell Biol. 1993;123:455–466. doi: 10.1083/jcb.123.2.455. [DOI] [PMC free article] [PubMed] [Google Scholar]
- 26.Furuya S, Mitoma J, Makino A, Hirabayashi Y. Ceramide and its interconvertible metabolite sphingosine function as indispensable lipid factors involved in survival and dendritic differentiation of cerebellar Purkinje cells. J Neurochem. 1998;71:366–377. doi: 10.1046/j.1471-4159.1998.71010366.x. [DOI] [PubMed] [Google Scholar]
- 27.Futerman AH, Pagano RE. Determination of the intracellular sites and topology of glucosylceramide synthesis in rat liver. Biochem J. 1991;280:295–302. doi: 10.1042/bj2800295. [DOI] [PMC free article] [PubMed] [Google Scholar]
- 28.Futerman AH, Pagano RE. Use of N-([1–14C]hexanoyl) sphingolipids to assay sphingolipid metabolism. Methods Enzymol. 1992;209:437–446. doi: 10.1016/0076-6879(92)09054-7. [DOI] [PubMed] [Google Scholar]
- 29.Futerman AH, Stieger B, Hubbard AL, Pagano RE. Sphingomyelin synthesis in rat liver occurs predominantly at the cis and medial cisternae of the Golgi apparatus. J Biol Chem. 1990;265:8650–8657. [PubMed] [Google Scholar]
- 30.Goslin K, Banker G. Experimental observations on the development of polarity by hippocampal neurons in culture. J Cell Biol. 1989;108:1507–1516. doi: 10.1083/jcb.108.4.1507. [DOI] [PMC free article] [PubMed] [Google Scholar]
- 31.Goslin K, Asmussen H, Banker G. Rat hippocampal neurons in low density. In: Banker G, Goslin K, editors. Culturing nerve cells. MIT; Cambridge, MA: 1998. pp. 339–370. [Google Scholar]
- 32.Greene LA. Quantitative in vitro studies on the nerve growth factor (NGF) requirement of neurons. II. Sensory neurons. Dev Biol. 1977;58:106–113. doi: 10.1016/0012-1606(77)90077-x. [DOI] [PubMed] [Google Scholar]
- 33.Hantzopoulos PA, Suri C, Glass DJ, Goldfarb MP, Yancopoulos GD. The low affinity NGF receptor, p75, can collaborate with each of the Trks to potentiate functional responses to the neurotrophins. Neuron. 1994;13:187–201. doi: 10.1016/0896-6273(94)90469-3. [DOI] [PubMed] [Google Scholar]
- 34.Harel R, Futerman AH. Inhibition of sphingolipid synthesis affects axonal outgrowth in cultured hippocampal neurons. J Biol Chem. 1993;268:14476–14481. [PubMed] [Google Scholar]
- 35.Hirschberg K, Zisling R, van Echten-Deckert G, Futerman AH. Ganglioside synthesis during the development of neuronal polarity: major changes occur during axonogenesis and axon elongation, but not during dendrite growth or during synaptogenesis. J Biol Chem. 1996;271:14876–14882. doi: 10.1074/jbc.271.25.14876. [DOI] [PubMed] [Google Scholar]
- 36.Hofmann K, Dixit VM. Ceramide in apoptosis—does it really matter? Trends Biochem Sci. 1998;23:374–377. doi: 10.1016/s0968-0004(98)01289-4. [DOI] [PubMed] [Google Scholar]
- 37.Huber LJ, Chao MV. A potential interaction of p75 and trkA NGF receptors revealed by affinity crosslinking and immunoprecipitation. J Neurosci Res. 1995;40:557–563. doi: 10.1002/jnr.490400415. [DOI] [PubMed] [Google Scholar]
- 38.Ibanez CF, Ebendal T, Barbany G, Murray-Rust J, Blundell TL, Persson H. Disruption of the low affinity receptor-binding site in NGF allows neuronal survival and differentiation by binding to the trk gene product. Cell. 1992;69:329–341. doi: 10.1016/0092-8674(92)90413-7. [DOI] [PubMed] [Google Scholar]
- 39.Irie F, Hirabayashi Y. Application of exogenous ceramide to cultured rat spinal motoneurons promotes survival or death by regulation of apoptosis depending on its concentrations. J Neurosci Res. 1998;54:475–485. doi: 10.1002/(SICI)1097-4547(19981115)54:4<475::AID-JNR5>3.0.CO;2-P. [DOI] [PubMed] [Google Scholar]
- 40.Jiang H, Ulme DS, Dickens G, Chabuk A, Lavarreda M, Lazarovici P, Guroff G. Both p140trk and p75NGFR nerve growth factor receptors mediate nerve growth factor-stimulated calcium uptake. J Biol Chem. 1997;272:6835–6837. doi: 10.1074/jbc.272.11.6835. [DOI] [PubMed] [Google Scholar]
- 41.Kolesnick RN, Kronke M. Regulation of ceramide production and apoptosis. Annu Rev Physiol. 1998;60:643–665. doi: 10.1146/annurev.physiol.60.1.643. [DOI] [PubMed] [Google Scholar]
- 42.Koval M, Pagano RE. Lipid recycling between the plasma membrane and intracellular compartments: transport and metabolism of sphingomyelin analogs in cultured fibroblasts. J Cell Biol. 1989;108:2169–2181. doi: 10.1083/jcb.108.6.2169. [DOI] [PMC free article] [PubMed] [Google Scholar]
- 43.Koval M, Pagano RE. Intracellular transport and metabolism of sphingomyelin. Biochim Biophys Acta. 1991;1082:113–125. doi: 10.1016/0005-2760(91)90184-j. [DOI] [PubMed] [Google Scholar]
- 44.Lee KF, Li H, Huber LJ, Landis SC, Sharpe AH, Chao MV, Jaenisch R. Targeted mutation of the gene encoding the low affinity NGF receptor p75 leads to deficits in the peripheral sensory nervous system. Cell. 1992;69:737–749. doi: 10.1016/0092-8674(92)90286-l. [DOI] [PubMed] [Google Scholar]
- 45.Lee KF, Bachman K, Landis S, Jaenisch R. Dependence on p75 for innervation of some sympathetic targets. Science. 1994;263:1447–1449. doi: 10.1126/science.8128229. [DOI] [PubMed] [Google Scholar]
- 46.Liepinsh E, Ilag LL, Otting G, Ibanez CF. NMR structure of the death domain of the p75 neurotrophin receptor. EMBO J. 1997;16:4999–5005. doi: 10.1093/emboj/16.16.4999. [DOI] [PMC free article] [PubMed] [Google Scholar]
- 47.Liu B, Obeid LM, Hannun YA. Sphingomyelinases in cell regulation. Semin Cell Dev Biol. 1997;8:311–322. doi: 10.1006/scdb.1997.0153. [DOI] [PubMed] [Google Scholar]
- 48.Liu B, Hassler DF, Smith GK, Weaver K, Hannun YA. Purification and characterization of a membrane bound neutral pH optimum magnesium-dependent and phosphatidylserine-stimulated sphingomyelinase from rat brain. J Biol Chem. 1998;273:34472–34479. doi: 10.1074/jbc.273.51.34472. [DOI] [PubMed] [Google Scholar]
- 49.MacPhee I, Barker PA. Extended ceramide exposure activates the trkA receptor by increasing receptor homodimer formation. J Neurochem. 1999;72:1423–1430. doi: 10.1046/j.1471-4159.1999.721423.x. [DOI] [PubMed] [Google Scholar]
- 50.Mahadeo D, Kaplan L, Chao MV, Hempstead BL. High affinity nerve growth factor binding displays a faster rate of association than p140trk binding. Implications for multi-subunit polypeptide receptors. J Biol Chem. 1994;269:6884–6891. [PubMed] [Google Scholar]
- 51.Majdan M, Lachance C, Gloster A, Aloyz R, Zeindler C, Bamji S, Bhakar A, Belliveau D, Fawcett J, Miller FD, Barker PA. Transgenic mice expressing the intracellular domain of the p75 neurotrophin receptor undergo neuronal apoptosis. J Neurosci. 1997;17:6988–6998. doi: 10.1523/JNEUROSCI.17-18-06988.1997. [DOI] [PMC free article] [PubMed] [Google Scholar]
- 52.Maliartchouk S, Saragovi HU. Optimal nerve growth factor trophic signals mediated by synergy of TrkA and p75 receptor-specific ligands. J Neurosci. 1997;17:6031–6037. doi: 10.1523/JNEUROSCI.17-16-06031.1997. [DOI] [PMC free article] [PubMed] [Google Scholar]
- 53.Pagano RE, Martin O. Use of fluorescent analogs of ceramide to study the Golgi apparatus of animal cells. In: Cerlis JE, editor. Cell biology: a laboratory handbook. Academic; New York: 1994. pp. 387–393. [Google Scholar]
- 54.Schwarz A, Futerman AH. Distinct roles for ceramide and glucosylceramide at different stages of neuronal growth. J Neurosci. 1997;17:2929–2938. doi: 10.1523/JNEUROSCI.17-09-02929.1997. [DOI] [PMC free article] [PubMed] [Google Scholar]
- 55.Schwarz A, Rapaport E, Hirschberg K, Futerman AH. A regulatory role for sphingolipids in neuronal growth: inhibition of sphingolipid synthesis and degradation have opposite effects on axonal branching. J Biol Chem. 1995;270:10990–10998. doi: 10.1074/jbc.270.18.10990. [DOI] [PubMed] [Google Scholar]
- 56.Seidl K, Erck C, Buchberger A. Evidence for the participation of nerve growth factor and its low- affinity receptor (p75NTR) in the regulation of the myogenic program. J Cell Physiol. 1998;176:10–21. doi: 10.1002/(SICI)1097-4652(199807)176:1<10::AID-JCP2>3.0.CO;2-B. [DOI] [PubMed] [Google Scholar]
- 57.Sperker ER, Spence MW. Neutral and acid sphingomyelinases of rat brain: somatotopographical distribution and activity following experimental manipulation of the dopaminergic system in vivo. J Neurochem. 1983;40:1182–1184. doi: 10.1111/j.1471-4159.1983.tb08112.x. [DOI] [PubMed] [Google Scholar]
- 58.Spiegel S, Foster D, Kolesnick R. Signal transduction through lipid second messengers. Curr Opin Cell Biol. 1996;8:159–167. doi: 10.1016/s0955-0674(96)80061-5. [DOI] [PubMed] [Google Scholar]
- 59.Stucky CL, Koltzenburg M. The low-affinity neurotrophin receptor p75 regulates the function but not the selective survival of specific subpopulations of sensory neurons. J Neurosci. 1997;17:4398–4405. doi: 10.1523/JNEUROSCI.17-11-04398.1997. [DOI] [PMC free article] [PubMed] [Google Scholar]
- 60.Tanaka M, Nara F, Suzuki-Konagi K, Hosoya T, Ogita T. Structural elucidation of scyphostatin, an inhibitor of membrane-bound neutral sphingomyelinase. J Am Chem Soc. 1997;119:7871–7872. [Google Scholar]
- 61.Thoenen H. The changing scene of neurotrophic factors. Trends Neurosci. 1991;14:165–170. doi: 10.1016/0166-2236(91)90097-e. [DOI] [PubMed] [Google Scholar]
- 62.Tomiuk S, Hofmann K, Nix M, Zumbansen M, Stoffel W. Cloned mammalian neutral sphingomyelinase: functions in sphingolipid signaling? Proc Natl Acad Sci USA. 1998;95:3638–3643. doi: 10.1073/pnas.95.7.3638. [DOI] [PMC free article] [PubMed] [Google Scholar]
- 63.Weskamp G, Reichardt L. Evidence that biological activity of NGF is mediated through a novel subclass of high affinity receptors. Neuron. 1991;6:649–663. doi: 10.1016/0896-6273(91)90067-a. [DOI] [PubMed] [Google Scholar]
- 64.Yoon SO, Casaccia-Bonnefil P, Carter B, Chao MV. Competitive signaling between TrkA and p75 nerve growth factor receptors determines cell survival. J Neurosci. 1998;18:3273–3281. doi: 10.1523/JNEUROSCI.18-09-03273.1998. [DOI] [PMC free article] [PubMed] [Google Scholar]
- 65.Yuan J. Transducing signals of life and death. Curr Opin Cell Biol. 1997;9:247–251. doi: 10.1016/s0955-0674(97)80069-5. [DOI] [PubMed] [Google Scholar]