

Abstract
We have characterized two separate odorant receptor (OR) gene clusters to examine how olfactory neurons expressing closely linked and homologous OR genes project their axons to the olfactory bulb. Murine OR genes, MOR28, MOR10, and MOR83, share 75–95% similarities in the amino acid sequences and are tightly linked on chromosome 14. In situ hybridization has demonstrated that the three genes are expressed in the same zone, at the most dorsolateral and ventromedial portions of the olfactory epithelium, and are rarely expressed simultaneously in individual neurons. Furthermore, we have found that olfactory neurons expressing MOR28, MOR10, or MOR83 project their axons to very close but distinct subsets of glomeruli on the medial and lateral sides of the olfactory bulb. Similar results have been obtained with another murine OR gene cluster for A16 and MOR18 on chromosome 2, sharing 91% similarity in the amino acid sequences. These results may indicate an intriguing possibility that olfactory neurons expressing homologous OR genes within a cluster tend to converge their axons to proximal but distinct subsets of glomeruli. These lines of study will shed light on the molecular basis of topographical projection of olfactory neurons to the olfactory bulb.
Keywords: axonal projection, odorant receptor gene, olfactory bulb, olfactory epithelium, olfactory sensory map, gene cluster
The olfactory system of mammals can recognize a large number of different odorants. The initial step in odor perception occurs on the cilia of olfactory sensory neurons (OSNs), where odorous ligands interact with G-protein-coupled seven transmembrane (TM) receptors (Reed, 1992; Shepherd, 1994; Buck, 1996;Hildebrand and Shepherd, 1997). A multigene family encoding odorant receptors (ORs) was first identified in rat (Buck and Axel, 1991), and usually contains hundreds of related genes in mammals (Parmentier et al., 1992). OR genes are clustered within multiple loci that are broadly distributed throughout the genome (Sullivan et al., 1996). The discrimination of different odors is most likely achieved by a large repertoire of OR genes. In situ hybridization analyses in rodents reveal that the olfactory epithelium can be divided into four topographically distinct zones, and that each member of the OR gene family is expressed only in a particular zone, although OSNs expressing a particular OR gene are randomly distributed within a zone (Ressler et al., 1993; Vassar et al., 1993; Strotmann et al., 1994a,b). It has been assumed that only a single OR gene is expressed in individual neurons (Ressler et al., 1993; Chess et al., 1994; Malnic et al., 1999), and that only one allele, either maternal or paternal, is activated for transcription (Chess et al., 1994).
To discriminate a variety of odorants, the CNS must be able to determine which OSNs have been activated. It has been shown that neurons expressing a given OR gene project their axons to a limited number of topographically fixed glomeruli among ∼2000 on the olfactory bulb (Ressler et al., 1994; Vassar et al., 1994; Mombaerts et al., 1996). It appears that the chemical information, of which OSNs had been activated by a given odorant, is converted to a topographical information, of which glomeruli had been activated. In addition, studies on the basis of 2-deoxyglucose uptake (Stewart et al., 1979;Jourdan et al., 1980; Shepherd, 1994), c-fos expression (Guthrie et al., 1993; Sallaz and Jourdan, 1993) and voltage-sensitive dye recordings (Kauer and Cinelli, 1993) indicate that the physical map of glomeruli at the bulbar surface represents a topographical map of OR types encoding odor quality. Furthermore, electrophysiological recordings of single units suggest that ORs mapped to neighboring glomeruli tend to have similar structures in their receptive sites for odor molecules (Mori, 1995; Mori and Yoshihara, 1995).
In the present study, we have characterized two OR gene clusters, MOR28-MOR10-MOR83 on chromosome 14 and A16-MOR18 on chromosome 2, to examine how OSNs expressing closely linked and homologous OR genes project their axons to the olfactory bulb. Our results may indicate an intriguing possibility that olfactory neurons expressing homologous OR genes within a cluster tend to converge their axons to very close but distinct subsets of glomeruli.
MATERIALS AND METHODS
Oligonucleotides. The following oligonucleotides were used as primers in the present study. OR-II: CGGAATTCCC(A/G/C/T)ATGTA(C/T)(C/T)T(A/G/C/T)TT(C/T)CT (Levy et al., 1991); OR-VI: ATAAGCTTAG(A/G)TG(A/G/C/T)(G/C)(A/T)(A/G/C/T)(G/C)C(A/G)CA(A/G/C/T)GT (Levy et al., 1991); OSP-1: CCTGTGAGCCGAAATGACATC (see Fig.3A); OSP-2: GTTTGGTTGATGAGGACAGCC (see Fig. 3A); OSP-3: GGACAGCCTTTTCCATTCTTTTAG (see Fig. 3A); OSP-4: TGGAGAAGGTGAGAAATCCTG (see Fig. 3A); OSP-5: GGAATAGTGCCTCTCTGC (see Fig. 3A); OSP-6: GACAAGG(A/G)CAGTGTAT (see Fig. 3A); OSP-7: TTCACATA(A/G)GGTCACT (see Fig. 3A); OSP-8: TGCTTACAAAGTTAGAGTCCC; ORM28: CTCTTGCTTGAATTCGGACTA (Peterson, 1998); ORM29: TAGTCCGAATTCAAGCAAGAGCACA (Peterson, 1998); A16F: AAGCCCCTACACTATACCAC (Ressler et al., 1993); A16R: AGACAGAGCTTTCCGTCTTC (Ressler et al., 1993); QT: CCAGTGAGCAGAGTGACGAGGACTCGAGCTCAAGC(T)17(Frohman, 1993); Qo: CCAGTGAGCAGAGTGACG (Frohman, 1993); QI: GAGGACTCGAGCTCAAGC (Frohman, 1993).
Fig. 3.
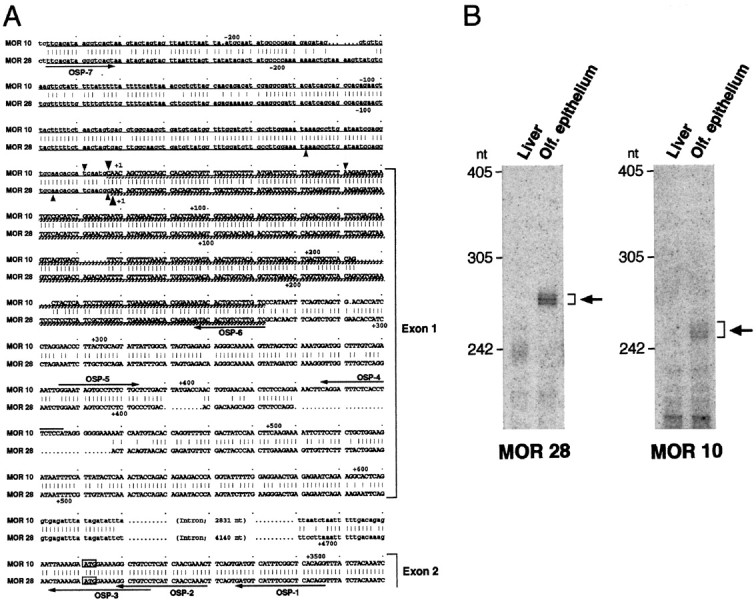
The 5′-noncoding sequences of the MOR10 and MOR28 transcripts. A, Nucleotide sequence comparison of the 5′-noncoding regions of the MOR10 and MOR28 genes. Identical nucleotides are connected by vertical bars, and both noncoding and coding sequences in exon 1 and exon 2 are depicted byuppercase letters. Upstream genomic sequences as well as intron sequences are noted by lowercase letters. The ATG initiation codons are boxed. Underlined sequences show regions used for antisense RNA probes in the RNase protection assay, and cross-hatched underlining sequences indicate protected regions. The major transcription start sites, identified by the 5′-RACE analysis and by the RNase protection assay, are marked bysmall and large arrowheads, respectively. Primers for the 5′-RACE and RT-PCR analyses are indicated byarrows along the sequences. B, The RNase protection assay. Antisense RNA probes labeled with 32P were hybridized to poly(A)+ RNAs from the mouse liver or olfactory epithelium. After hybridization, samples were digested with RNase and separated on a denaturing polyacrylamide gel (6%). In olfactory poly(A)+ RNA, three protected fragments of 247, 252, and 258 nt were detected for the MOR10 probe, whereas those of 269, 271, and 276 nt were detected for the MOR28 probe. No protected products were detected in liver mRNA.
Cloning of the MOR28, MOR10 and MOR83 genes. A pair of degenerate primers were synthesized from two conserved peptide sequences of the OR molecules expressed in the murine olfactory epithelium: PMY(L/F)FL for the OR-II primer was taken from the TM-II domain; and TC(G/A)SHL for the OR-VI primer was from the TM-VI domain (Levy et al., 1991). Poly(A)+ RNA from the olfactory epithelium was prepared from BALB/c mice with a Fast Track kit (Invitrogen, San Diego, CA). Reverse transcription (RT) with random hexamers was performed using Superscript Preamplification system (Life Technologies, Rockville, MD): 1 μg of the olfactory mRNA was used for each RT reaction after DNase I (Life Technologies) digestion. PCR for the first-strand cDNA was performed with the degenerate primers using Taq polymerase (Promega, Madison, WI) under the following conditions: one cycle of 97°C (3 min), 37°C (2 min), and 72°C (3 min), followed by 36 cycles of 94°C (1 min), 37°C (2 min), and 72°C (3 min). PCR products were subcloned into the pBluescript vector (Stratagene, La Jolla, CA) and sequenced with anfmol DNA cycle sequence system (Promega).
To isolate genomic clones, a BALB/c mouse library in a phage vector λEMBL3-SP6/T7 (Clontech, Palo Alto, CA) was screened with the MOR28 cDNA probe. Two clones, λ28–2 and λ28–71, were isolated for the MOR28 and MOR10 genes, respectively, and subcloned into the pBluescript vector (Stratagene). Furthermore, two clones, λ28-L11 and λ28-R7, linked physically with λ28–2 were isolated for characterizing sequences upstream and downstream of the MOR28 gene.
Genomic libraries of a 129/SvJ mouse in a P1 phage vector pAd 10-SacBII (Genome Systems, St. Louis, MO) and of the 129/SvJ mouse in a BAC plasmid vector pBeloBAC11 (Genome Systems) were screened by PCR using two primers, OSP-1 and OSP-8. A 43 kb region covering the sequence between the MOR28 and MOR10 genes as well as a 5 kb region of the MOR83 gene were sequenced with an ABI 373A sequencer (PE; Applied Biosystems, Foster City, CA).
To characterize the 5′ regions of MOR10 and MOR28 transcripts in the olfactory epithelium, we performed 5′-rapid amplification of cDNA ends (RACE) analyses as described below. OSP-1-directed cDNA was amplified by a first-round PCR with the OSP-2 primer, followed by a second-round PCR with the OSP-3 primer (see Fig. 3A). Sequencing indicated that 5′-RACE products contained both the 16 bp coding sequence and the 585–621 bp noncoding sequence of MOR28 (see Fig. 3A). The noncoding sequences of the MOR28-RACE products did not continuously match its genomic sequence from 10 bp upstream of the ATG codon (see Fig. 3A). Sequence analysis of the genomic clone revealed that the unmatched sequences in the RACE products were located 4.14 kb upstream of the initiation codon. A similar situation was found for MOR10: the other 5′-RACE products contained the 16 bp coding sequence as well as the ∼260 bp noncoding sequence that were also interrupted by a 2.83 kb spacer. To further characterize the MOR10-specific transcripts, we amplified the OSP-1-directed cDNA by a first-round PCR with the OSP-2 primer, followed by a second-round PCR with the OSP-4 primer (see Fig.3A). Sequencing revealed that MOR10-RACE products contained the 399–459 bp noncoding sequence (see Fig. 3A).
5′-RACE. The 5′-RACE analysis was performed according to the method of Frohman (1993). Poly(A)+ RNA was prepared as described above, followed by digestion with DNase I. After reverse transcription with olfactory mRNA (1 μg) and the OSP-1 primer (see Fig. 3A), dATP was added to the 3′ end of cDNAs with terminal deoxynucleotidyl transferase (Life Technologies). The first round amplification was performed with three primers of OSP-2 (see Fig.3A), Qo and QT: the QT primer contains oligo-dT, Qo, and QI sequences. The second round amplification was performed with two primers, QI and OSP-3 (see Fig. 3A). The purified PCR products were cloned into the pGEM-T vector (Promega). To further identify the start sites of MOR10 transcripts, the MOR10-specific primers, OSP-3 and OSP-4 (see Fig. 3A), were used for the first and the second set of amplifications, respectively.
RNase protection assay. The 5′-noncoding MOR28 sequence of 530 bp was amplified with λ28–2 DNA using two primers, OSP-6 and OSP-7 (see Fig. 3A), whereas the noncoding MOR10 sequence of 506 bp was also amplified with λ28–71 DNA using the same primers. The amplified DNA was subcloned into the pGEM-T vector and sequenced. An antisense RNA probe was prepared with an in vitrotranscription kit T7/SP6 (Boehringer Mannheim, Indianapolis, IN) using the linearized plasmid. The assay was performed with an RNase Protection kit (Boehringer Mannheim). The32P-labeled antisense probe (3 × 10⁵ cpm) was hybridized to poly(A)+ RNA (5 μg) isolated from the liver or olfactory tissue. After RNase A and T1 digestion, and inactivation, protected fragments were separated in a polyacrylamide gel (6%) containing 8 m urea. The autoradiograph was visualized with a bioimage analyzer BAS-2000 II (Fuji Photo Film, Tokyo, Japan).
Direct cDNA selection. Direct cDNA selection was performed as described by Peterson (1998). Poly(A)+RNA was prepared as described above, followed by digestion with DNase I. Double-stranded cDNA was synthesized from 5 μg of mRNA using Superscript II cDNA synthesis kit (Life Technologies) with random hexamers. One microgram of double-stranded cDNA was ligated to a pair of primer-adapter oligonucleotides, ORM28 and ORM29. The primer-adapter-ligated cDNA (100 ng) was preamplified with the ORM28 primer by PCR (20 cycles of 94°C for 30 sec, 58°C for 30 sec, and 72°C for 1 min).
BAC plasmid DNA (50 ng) was biotinylated with biotin-14-dATP (Life Technologies), random hexamers, and DNA polymerase I Klenow fragment (New England Biolabs, Beverly, MA), and purified with Chroma Spin-10 columns (Clontech). Five micrograms of preamplified cDNA and 5 μg of mouse Cot-1 DNA (Life Technologies) were prehybridized in 4 μl at 65°C for 90 min to block the repetitive sequences in the cDNA. Then, 1 μg of the prehybridized cDNA and 100 ng of the biotinylated BAC DNA fragments were hybridized in 5 μl at 65°C for 40 hr. After hybridization, BAC-cDNA hybrids were captured on streptavidin-coated magnetic beads (Dynabeads M-280; Dynal, Oslo, Norway), washed twice in 0.1× SSC/0.1% SDS for 15 min at room temperature, and washed twice in 0.1× SSC/0.1% SDS for 15 min at 65°C. The cDNA was eluted with 50 μl of 50 mm NaOH for 5 min at room temperature, followed by neutralization with 50 μl of 1 m Tris-HCl (pH 7.0). The eluted cDNA was amplified with the ORM28 primer by PCR (20 cycles of 94°C for 30 sec, 58°C for 30 sec, and 72°C for 1 min). The secondary cycle of enrichment was performed under the same condition as described above. After the secondary hybridization, wash, and elution, cDNA was amplified by PCR, and cloned into the pGEM-T vector (Promega).
Cloning of the A16 and MOR18 genes. A partial coding sequence of the A16 gene (Ressler et al., 1993) was amplified from mouse genomic DNA with A16F and A16R primers by PCR (40 cycles of 94°C for 30 sec, 56°C for 30 sec, and 72°C for 1 min). To isolate genomic clones, the 129/SvJ mouse genomic library in the BAC vector pBeloBAC11 (Genome Systems) was screened with the A16 coding probe. One clone, BAC15577, was found to contain the A16 gene and a novel gene, MOR18. The coding regions of the A16 and MOR18 genes were subcloned into the pBluescript vector (Stratagene). The 5′-noncoding regions of these genes were characterized by the 5′-RACE analysis as described above.
In situ hybridization of olfactory epithelium sections.DNA fragments including the 5′-noncoding exon 1 regions (constructed in the pBluescript vector; Stratagene) were used as templates to synthesize probes for the MOR10 and MOR28 genes. For the MOR83, MOR18, and A16 genes, the coding regions were used to make probes. Digoxigenin (DIG)- and fluorescein (FLU)-labeled probes were prepared by a DIG RNA Labeling kit (Boehringer Mannheim).
Four-week-old C57BL/6 and BALB/c mice were anesthetized with sodium pentobarbital (2.5 mg/animal) and perfused intracardially with 4% paraformaldehyde. Olfactory tissues were dissected out and fixed overnight in 4% paraformaldehyde in PBS. Tissues were decalcified by incubation for 2 d in 0.5 m EDTA at 4°C, placed in 30% sucrose, and embedded rapidly in O.C.T. compound (Tissue-Tek, Torrance, CA) in dry ice acetone. Serial coronal sections (9 μm) were cut with a JUNG CM3000 cryostat (Leica, Nussloch, Germany) and collected on 3-aminopropyl-triethoxysilane-coated slide glasses.
The procedures used for hybridization, washings, antibody reaction, and color reaction were as described by Hirota et al. (1992). In double-label in situ hybridization, antisense RNA probes labeled with either FLU or DIG were hybridized to sections (Hauptmann and Gerster, 1994). After washing, slides were incubated with alkaline phosphatase-conjugated anti-FLU antibody (anti-FLU-AP; Boehringer Mannheim), and positive cells were stained red with Fast Red (Boehringer Mannheim) in the first round. After washing out the anti-FLU-AP with acid (0.1 m glycine–HCl, pH 2.2), the slides were incubated with alkaline phosphatase-conjugated anti-DIG antibody (anti-DIG-AP; Boehringer Mannheim) in the second round, and positive cells were stained purple with nitroblue tetrazolium salt (NBT) and 5-bromo-4-chloro-3-indolyl phosphate toludinium salt (BCIP). The sections were analyzed and photographed on an Olympus AX70 microscope (Olympus Optical, Tokyo, Japan), and then images were processed by Adobe Photoshop. Except for small adjustments of brightness and contrast, the images were not altered.
In situ hybridization of olfactory bulb sections. In situ hybridization was performed essentially as described by Vassar et al. (1994). Probes for the exon 1 regions of the MOR28 and MOR10 genes and for the coding regions of the MOR83, MOR18, and A16 genes were synthesized in a 20 μl reaction with 50 μCi of [33P]UTP (3000 Ci/mmol; Amersham Pharmacia Biotech, Uppsala, Sweden) using an AmpliScribe T3 or T7 Transcription kit (Epicentre Technologies, Madison, WI).
Fresh-frozen olfactory bulbs of adult C57BL/6 mice (7 weeks old) were oriented for coronal sections and cut to 20 μm thickness. Serial sections of entire bulbs were dried and fixed for 10 min in 4% paraformaldehyde in PBS at room temperature. After rinsing twice in PBS, sections were incubated 0.25% acetic anhydride and 0.1m triethanolamine, pH 8, washed in PBS, dehydrated with ethanol, and prehybridized in the hybridization buffer (Vassar et al., 1994) for 1 hr. Probes were diluted to a concentration of 1 × 10⁵ cpm/μl in the same hybridization buffer, and 100 μl was applied to each slide. After a 16–20 hr incubation at 60°C, sections were washed in 0.2× SSC for 1 hr at 60°C, treated with 2 μg/ml of RNase A for 30 min, and washed twice in 0.2× SSC at 60°C for 20 min. After dehydration, slides were dipped in Hypercoat film-emulsion LM-1 (Amersham Pharmacia Biotech) and allowed to expose at 4°C. After 4–6 weeks, the slides were developed, and sections were counterstained with toluidine blue O (Sigma, St. Louis, MO). The slides were viewed using a Nikon Optiphot microscope equipped with a dark-field illumination device (Nikon, Tokyo, Japan). Images were acquired with an HC-2500 CCD camera (Fuji Photo Film) using Photograb-2500 software (Fuji Photo Film) and processed by Adobe Photoshop. With the exception of minor adjustments in brightness and contrast, the images were not altered.
RESULTS
Cloning and genomic structure of three adjacent OR genes
Murine OR gene fragments were isolated from olfactory mRNA by RT-PCR, using a pair of degenerate primers, OR-II and OR-VI (Levy et al., 1991). The resulting PCR products of ∼560 bp contained at least five novel OR genes. Among them, MOR10 and MOR28 clones were chosen for further analyses since they were found frequently in the PCR products and were highly homologous in sequence. To characterize the genomic structure, we isolated λ phage clones of mouse DNA hybridizing to the MOR28 clone. Among 23 prospective clones, λ28–2 and λ28–71 were characterized further by both restriction mapping and DNA sequencing (Fig. 1). The MOR10 gene has a coding sequence of 930 bp (310 amino acids), and the MOR28 gene has one of 939 bp (313 amino acids) (Fig. 2). The coding sequences of the MOR10 and MOR28 genes share 92% DNA identity and 95% amino acid similarity.
Fig. 1.

Genomic structure of the MOR28, MOR10, and MOR83 genes. At the top, isolated phage and BAC clones are shown as horizontal lines. The bottomrepresents schematically the 5′-RACE analysis. The flanking regions of the MOR28, MOR10, and MOR83 genes are enlarged. Boxesindicate exons, and hatched portions depict coding regions. DCRs and MARs are shown by ovals andtriangles, respectively. The MAR sites are predicted by MAR finder according to the method of Singh et al. (1997).E, EcoRI; H,HindIII; P, PstI;Sf, SfiI; X,XbaI; Xh, XhoI.
Fig. 2.
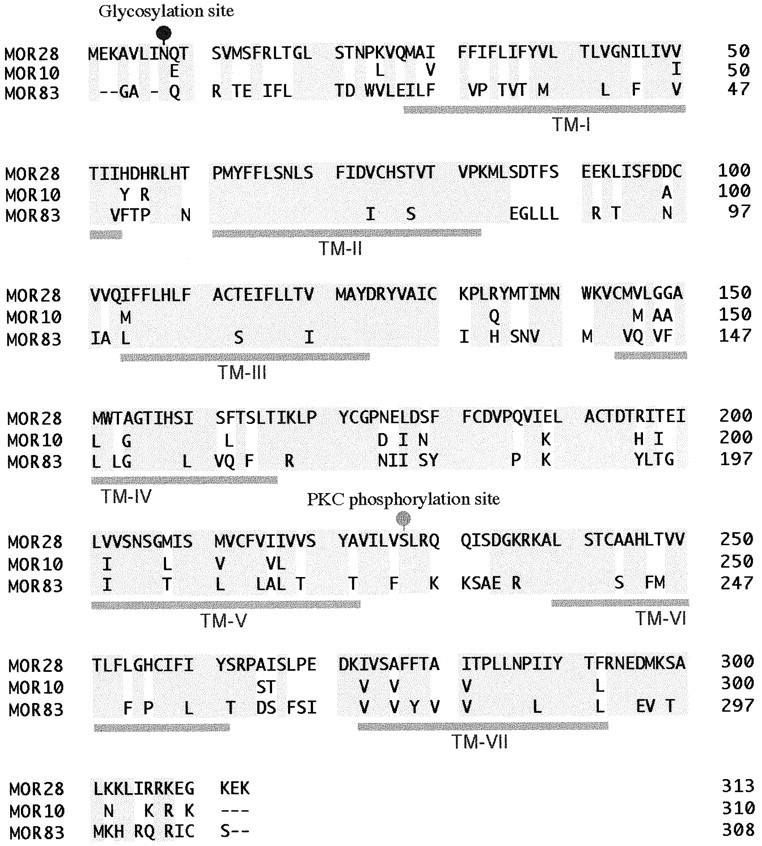
Comparison of amino acid sequences of the MOR28, MOR10, and MOR83 proteins. The MOR28 sequence is shown withone-letter code, whereas only amino acid differences are indicated for the MOR10 and MOR83 sequences. Gray shading represents conserved amino acid residues among the three sequences. The predicted positions of the seven transmembrane domains (TM-I to TM-VII) are depicted below the sequences and the putative glycosylation and phosphorylation sites (blackand gray circles) above the sequences.
To determine the physical linkage of these genes, we screened mouse P1 and BAC libraries by PCR. One clone, P1/2394, was found to contain the MOR28 gene as well as a 5′-noncoding region of the MOR10 gene (Fig. 1). Sequence analysis has indicated that the MOR28 and MOR10 genes are tandemly linked and separated by a 25 kb spacer in the mouse genome. In addition, one BAC clone, 14399, was found to contain not only the MOR28 and MOR10 genes, but also a novel gene, MOR83 (Fig. 1). Further analyses have indicated that the MOR83 gene is downstream of the MOR10 gene and is separated by a 10 kb spacer in the genome. The MOR83 gene has a coding sequence of 924 bp (308 amino acids) and is more homologous in nucleotide sequence to the MOR10 gene (65%) than to the MOR28 gene (60%). It should be noted that MOR83 shares 75% amino acid similarity with MOR10 and with MOR28 (Fig. 2).
To characterize the 5′ regions of MOR28 and MOR10 transcripts, 5′-RACE analysis was performed with poly(A)+RNA of the olfactory epithelium. Sequence analysis of the RACE products indicated that these genes contain an intron, which separates the highly homologous coding sequences (exon 2) and the less homologous 5′-noncoding sequences (exon 1) containing transcription-initiation regions (Fig. 3A). The transcriptional start sites of these genes were confirmed by an RNase protection assay (Fig. 3B). To analyze the 5′ region of MOR83 transcripts as well, cDNA clones that had been selected with BAC14399 DNA by a direct cDNA selection method were screened with the 5′ terminus of the MOR83 coding sequence (330 bp) by Southern hybridization. Among 32 prospective clones, five clones had almost the same 5′-terminal noncoding sequences. Comparison of these sequences with the genomic sequence has revealed that the MOR83 gene has two introns in the 5′-noncoding region: exon 1 (112 bp), intron (0.75 kb), exon 2 (173 bp), intron (6 kb), and exon 3 (1 kb). It should be noted that an orientation of transcription from the MOR83 gene is opposite to that from the MOR28 or MOR10 gene (Fig. 1).
A 43 kb region covering the sequence between the MOR28 and MOR10 genes was determined to search for other genes or highly conserved sequences. There are no open reading frames except for the MOR28 and MOR10 genes in this region. Comparison of both nucleotide sequences by dot matrix plotting using a software of Geneworks (IntelliGenetics, Mountain View, CA) has revealed that these genes are very similar not only in the coding sequence with 92% nucleotide identity, but also in two noncoding sequences: a 250 bp region with 92% nucleotide identity around the transcription-initiation site in the 5′ end of exon 1, and a 500 bp region with 94% nucleotide identity ∼2 kb downstream of the coding sequence, termed downstream conserved region (DCR) (Fig. 1). Furthermore, computer analysis with matrix attachment region (MAR) finder (Singh et al., 1997) has predicted three MARs (∼500 bp long), where the chromatin fibers attach to the nuclear matrix: two of them are located ∼1 kb upstream of the transcription-initiation sites in both genes (Fig. 1).
The MOR28 gene cluster was assigned to the central portion of the C region of chromosome 14 by fluorescence in situhybridization (FISH) with P1/2394 DNA (data not shown). Comparison of the R-banding pattern has indicated that the MOR28 cluster is located at the C2-D1 region of the mouse chromosome 14, and is flanked by the T-cell receptor Vα gene cluster.
MOR28, MOR10, and MOR83 genes are expressed in the same zone of the olfactory epithelium, but not simultaneously in individual olfactory neurons
To examine the expression patterns of the three adjacent genes in the olfactory epithelium, we performed in situ hybridization with the 5′-noncoding probes for the MOR28 and MOR10 genes as well as with the coding probe for the MOR83 gene. DIG-labeled antisense RNA probes for the 5′-noncoding sequences were used to detect either MOR28 or MOR10 transcript specifically in the coronal sections of the mouse nasal cavity. The MOR28 probe clearly detected neurons expressing the gene within the most dorsolateral and ventromedial zone, zone 4, according to the nomenclature of Sullivan et al. (1996) (Fig.4A). The MOR10 transcripts were confined in the same zone as well (Fig.4B). DIG-labeled antisense RNA probes for the coding region of the MOR83 gene, which did not cross-hybridize to the other genes, also detected positive neurons within the same zone (Fig.4C). Within the zone, the olfactory neurons expressing these genes appeared to be concentrated in portions of ectoturbinates 1 and 2, according to the nomenclature of Astic and Saucier (1986).
Fig. 4.
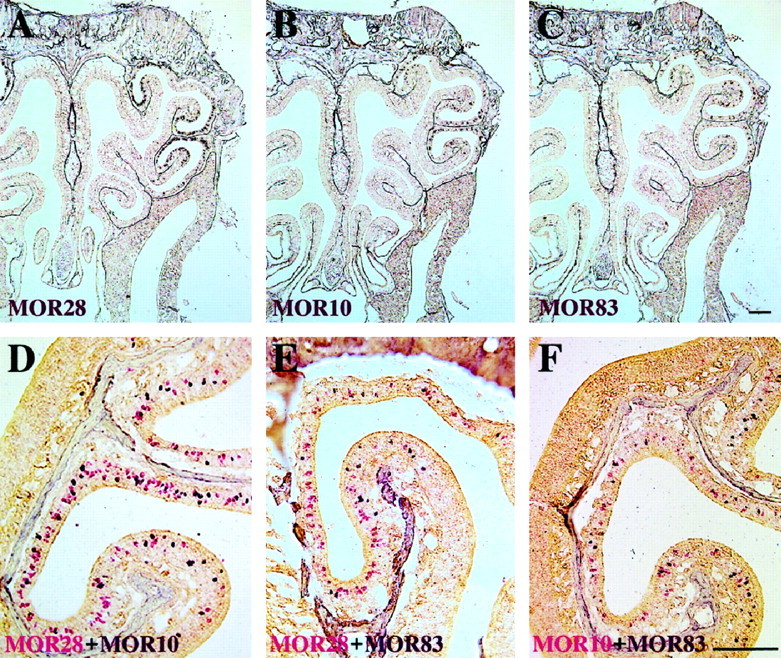
The MOR28, MOR10, and MOR83 genes are expressed in the same zone within the olfactory epithelium, but in different olfactory neurons. A–C, Coronal sections of the mouse olfactory epithelium were hybridized with a DIG-labeled antisense RNA probe from the MOR28, MOR10, or MOR83 gene. Sections were washed under a high stringency condition, followed by chromogenic reaction.A, The MOR28 probe hybridized to neurons that lie in some parts of ectoturbinates 1 and 2, according to the nomenclature ofAstic and Saucier (1986). The MOR10 probe (B) and the MOR83 probe (C) also hybridized to neurons that are located in the same zone as the MOR28 probe.D–F, Double-label in situ hybridization of olfactory epithelium sections with two differently labeled probes. Coronal sections were hybridized simultaneously with the following probes: D, MOR28 noncoding (FLU) and MOR10 noncoding (DIG); E, MOR28 noncoding (FLU) and MOR83 coding (DIG);F, MOR10 noncoding (FLU) and MOR83 coding (DIG). Positive cells are red in the first reaction (FLU), whereas positive cells are dark purple in the second reaction (DIG). Scale bars, 200 μm.
To examine whether individual olfactory neurons express only one of the three genes or not, their transcripts were separately detected byin situ hybridization of the same coronal sections. As shown in Figures 4D–F and 5, combinations of double-labelin situ hybridization were performed with two different labeling reagents and detection dyes. Antisense RNA probe was labeled with either FLU or DIG. Then, the two labeled probes were mixed and hybridized to coronal sections. Hybridization signals for one of the two genes were detected as a red stain with a combination of anti-FLU-AP antibody and the detection substrate, Fast Red. After eliminating the first antibody with acid, signals for the second gene were detected as a purple stain with a combination of anti-DIG-AP antibody and the detection substrates, NBT–BCIP.
Fig. 5.

The MOR10 and MOR28 genes are not expressed simultaneously in individual neurons. Double-label in situ hybridization of olfactory epithelium sections with two differently labeled probes from the MOR10- and MOR28-exon 1 regions. Coronal sections were hybridized simultaneously with the following probes: A,B, MOR10 (FLU) and MOR28 (DIG); C,D, MOR10 (FLU) and MOR10 (DIG). The photographs were taken sequentially after each color reaction: the first FLU-red reaction (A,C), the second DIG-purple reaction (B,D). Scale bars, 100 μm.
For double-staining experiments, two antisense RNA probes of the MOR10- and MOR28-exon 1 regions were labeled with FLU and DIG, respectively. MOR10-positive neurons were stained red (Fig.5A), whereas MOR28-positive neurons were stained purple (Fig. 5B). We did not find any neurons that were simultaneously stained red and purple. Furthermore, combinations of MOR28 (FLU)–MOR10 (DIG), MOR28 (FLU)–MOR83 (DIG), and MOR10 (FLU)–MOR83 (DIG) antisense RNA probes detected red and purple neurons, respectively (Fig. 4D–F). No neurons were found to express the MOR28, MOR10, and MOR83 genes simultaneously in coronal sections throughout the nasal cavities, indicating that the three genes are not coexpressed in the same cells, even though they are highly homologous and linked in the genome.
Because the second stain could be diminished through alkaline phosphatase inactivation by acid treatment, there was a concern that both signals could not be detected in the same neurons. To exclude this possibility, we performed double-label hybridization with both types of MOR10 probes; one was labeled with FLU, and the other was with DIG. All MOR10-positive cells stained red by the first procedure (Fig.5C) were subsequently stained purple in the second one (Fig.5D). No newly stained cells appeared in the second staining.
OSNs expressing MOR28, MOR10, or MOR83 project their axons to proximal glomeruli on the olfactory bulb
We next designed experiments to examine whether olfactory neurons expressing MOR28, MOR10, or MOR83 project their axons to discrete subsets of glomeruli, which would be located near or far from each other in the olfactory bulb. In situ hybridization was performed to serial frontal sections of the olfactory bulb because OR mRNA can be detected in the axon terminals of OSNs within the bulb (Ressler et al., 1994; Vassar et al., 1994).
Sequential 20 μm sections cut through the olfactory bulbs of 7-week-old mice were hybridized with a33P-labeled antisense RNA probe from the MOR28 or MOR10 noncoding sequence or with a33P-labeled antisense RNA probe from the MOR83 coding sequence. Each probe was hybridized to either every fifth or every sixth tissue section. Regions of hybridization were defined as glomeruli by counterstaining hybridized sections with toluidine blue. The MOR83 probe detected glomeruli that resided ventrolaterally in the posterior part of the olfactory bulb (Fig.6A). The MOR10-positive glomeruli were located at a position 60–100 μm (one glomerular width) ventral to the MOR83-positive glomeruli, and approximately in the same anteroposterior plane (Fig. 6B). The MOR28-positive glomeruli were located at a position 200–300 μm (two to four glomerular widths) posterior to the MOR10-positive glomeruli, and roughly in the same dorsoventral plane (Fig. 6C). Furthermore, in the most posterior part of the bulb, the same set of signals hybridizing to the MOR83, MOR10, and MOR28 probes were observed on glomeruli that resided ventromedially (Fig.6D–F). These relative positions were maintained on both the lateral and medial sides of the bulb, and were bilaterally symmetric; positive glomeruli were located in approximately the same relative positions in the right and the left bulbs among four animals. These results demonstrate that the neurons expressing one of the three linked and homologous OR genes project their axons to two sets of proximal glomeruli, on the medial and lateral portions of the olfactory bulb (see Fig. 9).
Fig. 6.

Localization of the MOR28, MOR10, and MOR83 transcripts to proximal glomeruli within the olfactory bulb. Serial coronal sections of the mouse olfactory bulb were hybridized with a33P-labeled antisense RNA probe, washed under a high-stringency condition, and exposed to emulsion for 5 weeks. Dark-field micrographs of sections show two pairs of very close, but discrete glomeruli that hybridize to the MOR83 (A,D) or MOR10 (B,E) probe. It should be noted that there are almost neighboring sections exhibiting positive glomeruli in both the ventrolateral (A, B) and ventromedial (D,E) parts of the bulb. In addition, micrographs of sections indicate two pairs of proximal, but discrete glomeruli that hybridize to the MOR10 (B,E) or MOR28 (C,F) probe. These sections are ordered in an anteroposterior manner. Arrows depict positive glomeruli on the bulb. Scale bars, 500 μm.
Fig. 9.

Relative positions of MOR28, MOR10, MOR83, MOR18, and A16 glomeruli within the olfactory bulb. Consecutive coronal sections of the olfactory bulb in different mice were hybridized with five different 33P-labeled antisense RNA probes, washed under a high stringency condition, and exposed to emulsion for 6 weeks. To summarize the results, signals of the ventrolateral (A,C) and ventromedial (B,D) glomeruli within the left half of the bulb are represented schematically. Relative positions of glomeruli for the OR genes in the MOR28 cluster (A, B) and the A16 cluster (C,D) are shown. Four sets of the coronal bulb sections from the four different mice were analyzed to determine the relative distances of glomeruli using the MOR10 or A16 glomerulus as a standard position. The relative distance between two glomeruli was calculated by a geometric mean of both distances of 20 μm coronal sections containing the center of each site and the two sites in the anteroposterior plane. The MOR10 and MOR83 glomeruli are arranged very closely at a distance of 80 ± 20 μm, and approximately in the same anteroposterior plane in both sides. The MOR10 and MOR28 glomeruli are arranged at a distance of 250 ± 50 μm and 190 ± 60 μm in the lateral and medial sides, respectively. The A16 and MOR18 glomeruli are arranged at a distance of 190 ± 50 μm and 210 ± 60 μm in the lateral and medial sides, respectively. Abbreviations are A (anterior),P (posterior), D (dorsal), andV (ventral).
OSNs expressing either A16 or MOR18 project their axons to proximal glomeruli on the olfactory bulb
We examined another cluster to determine if it is a general tendency that neurons expressing homologous OR genes within a cluster project to proximal glomeruli. The A16 gene was reported to be expressed in the same zone (zone 4) as the MOR28-expression zone within the olfactory epithelium (Ressler et al., 1994), and also to be located in the OR gene locus (Olfr4) of the mouse chromosome 2 (Sullivan et al., 1996). To isolate the A16 gene and its related gene or genes, which had been presumed to exist closely within the locus, we screened the mouse BAC library by Southern hybridization. One clone, BAC15577, was found to contain the A16 gene and a tightly linked novel gene, MOR18. The A16 gene has a coding sequence of 906 bp (302 amino acids), and the MOR18 gene has one of 924 bp (308 amino acids) (Fig.7). The coding sequences of the A16 and MOR18 genes share 82% DNA identity and 91% amino acid similarity (Fig. 7). The 5′-RACE analysis has indicated that the A16 and MOR18 genes have an intron of 4 and 3 kb, respectively, in the 5′-noncoding regions (data not shown). It appears to be a general feature that OR genes have at least one intron within the 5′-noncoding sequences.
Fig. 7.

Comparison of amino acid sequences of the A16 and MOR18 proteins. The A16 sequence is shown withone-letter code, whereas only amino acid differences are indicated for the MOR18 sequence. Gray shadingrepresents conserved amino acid residues between both sequences. The predicted positions of the seven transmembrane domains (TM-I to TM-VII) are depicted below the sequences and the putative glycosylation and phosphorylation sites (black and gray circles) above the sequences.
In situ hybridization of the olfactory epithelium sections has demonstrated that the two genes are expressed in the same spatial zone (zone 4), but not expressed simultaneously in individual olfactory neurons (data not shown). In situ hybridization of the olfactory bulb sections revealed that the A16 probe detected glomeruli that resided ventrolaterally in the middle part of the olfactory bulb, whereas the MOR18-positive glomeruli were located at a position 140–240 μm (two to three glomerular widths) posterior to the A16-positive glomeruli (Fig.8A,B). Furthermore, in the more posterior part of the bulb, the same set of signals hybridizing to the A16 and MOR18 probes were observed on glomeruli that resided ventromedially (Fig. 8C,D). These relative positions were maintained on both the lateral and medial sides of the bulb, and were bilaterally symmetric. These results suggest an intriguing possibility that neurons expressing homologous OR genes within the same cluster tend to project their axons to two sets of proximal glomeruli, on the medial and lateral portions of the olfactory bulb (Fig.9).
Fig. 8.
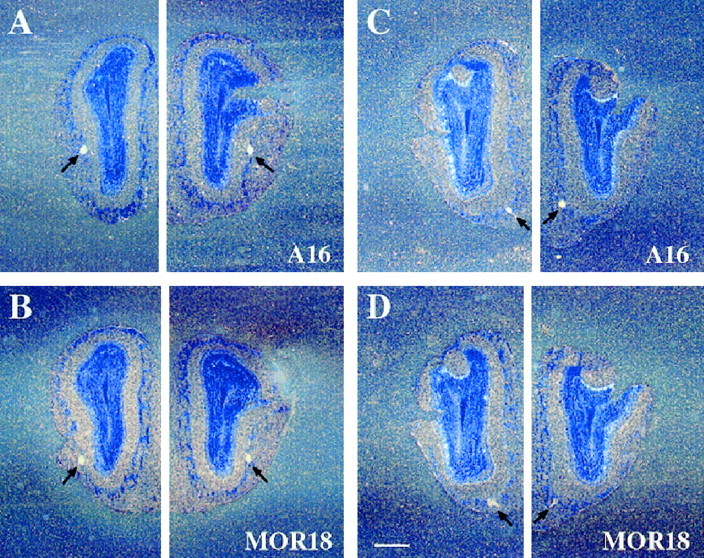
Localization of the A16 and MOR18 transcripts to proximal glomeruli within the olfactory bulb. Serial coronal sections of the olfactory bulb were hybridized with a 33P-labeled antisense RNA probe, washed under a high-stringency condition, and exposed to emulsion for 6 weeks. Dark-field micrographs of sections indicate two pairs of proximal, but discrete glomeruli that hybridize to the A16 (A,C) or MOR18 (B,D) probe. These sections are ordered in an anteroposterior manner. Arrows depict positive glomeruli on the bulb. Scale bars, 500 μm.
DISCUSSION
We have characterized a murine OR gene cluster of MOR28, MOR10, and MOR83 on chromosome 14. These genes share 75–95% similarities in the amino acid sequences. In situ hybridization demonstrates that neurons expressing one of the three genes are distributed randomly in the same zone within the olfactory epithelium, although these genes are rarely expressed simultaneously in individual neurons. We have also found that neurons expressing one of these genes project their axons to proximal but distinct subsets of glomeruli in the olfactory bulb. Similar results have been obtained with another OR gene cluster of A16 and MOR18 on the mouse chromosome 2.
Genomic structure of the MOR28 cluster
The MOR28 cluster contains the MOR28, MOR10, and MOR83 genes that are tightly linked on the genome in this order, although the orientation of MOR83 transcription is opposite to those of MOR28 and MOR10 (Fig. 1). We have sequenced the 43 kb DNA region encompassing the MOR28 and MOR10 genes to search for novel coding regions or highly conserved sequences. Although we do not find any open reading frames other than the MOR28 and MOR10 genes, dot matrix plotting shows that they share significant homology in the region from exon 1 through exon 2. In particular, the MOR28 and MOR10 genes are highly homologous not only in the coding region, but also in two noncoding regions: a 250 bp region surrounding the transcription-initiation site in the 5′ end of exon 1 and a 500 bp segment ∼2 kb downstream of the coding sequence, termed DCR (Fig. 1). These DCR sequences share a surprising homology of 94% nucleotide identity, which is higher than that for the coding sequences. Furthermore, Southern blot and FISH analyses revealed that another region homologous to these DCRs was located on a different chromosome (chromosome 10). Deletion studies of these DCRs will allow us to know why they are highly conserved even between two separate chromosomes. Moreover, computer analysis has predicted three MARs (∼500 bp long), two of which are located ∼1 kb upstream of the transcription-start sites in both genes (Fig. 1). The MARs are relatively short (100–1000 bp long) sequences that anchor the chromatin loops to the nuclear matrix, and often include the origin of DNA replication and a concentrated area of nuclear factor-binding sites for transcription (Singh et al., 1997). It is possible that the two newly found homologous regions and MARs may play a role in the transcriptional regulation of MOR28 and MOR10 genes. Our genomic studies of the MOR28 cluster indicate that the MOR28 and MOR10 genes may have evolved through tandem duplication. Since the choice of a gene for expression and the choice of a glomerular target must be regulated separately, it will be quite interesting to know how these two regulations are interrelated each other.
Mutually exclusive expression of the MOR genes in olfactory neurons
In situ hybridization experiments demonstrate that MOR28-, MOR10-, and MOR83-positive neurons are distributed randomly in the same zone (zone 4) within the olfactory epithelium, but no individual neurons, so far tested, express these homologous genes simultaneously (Figs. 4, 5). These observations are in accord with recent experiments by Malnic et al. (1999) using single cell RT-PCR, which indicated that individual OSNs express only one OR gene. Ourin situ hybridization experiment for the adult-mouse olfactory epithelia showed that the ratio of cell numbers expressing MOR28, MOR10, or MOR83 was ∼5:2:1. These results suggest that receptor choice even among the three highly homologous OR genes is biased, rather than occurring by a purely stochastic mechanism. It has been reported in zebrafish that the onset of specific OR expression in a gene cluster occurs asynchronously in the olfactory placode during development (Barth et al., 1996, 1997). It is possible that the gene organization within the cluster MOR28–MOR10–MOR83 may give rise to a bias of receptor choice as well as to asynchronous regulation of the onset of specific OR expression during embryogenesis.
Proximity of projection sites of OSNs within the olfactory bulb
It may be a general rule that OSNs expressing homologous OR genes within a cluster tend to project their axons to two topographically fixed subsets of neighboring glomeruli on the medial and lateral sides of the olfactory bulb (Fig. 9). Our present study indicates that MOR28 glomeruli are located at positions 200–300 μm (two to four glomerular widths) posterior to MOR10 glomeruli, and roughly in the same anteroposterior axis of the bulb (Fig. 6). In addition, MOR18 glomeruli also reside 140–240 μm posterior to A16 glomeruli (Fig.8). A similar finding has been reported for other OR gene cluster, P1–P2–P4–P3–M50–I7–P5: neurons expressing P2 or P3 project their axons to close glomeruli ∼200 μm apart from each other (Wang et al., 1998). Moreover, both P2 deletion and substitution experiments have demonstrated that OR molecules may play an instructive role in selecting target sites, but cannot be the sole determinant in the guidance process (Mombaerts et al., 1996; Wang et al., 1998). These findings suggest that projection sites of neurons expressing an OR in the dorsoventral axis of the olfactory bulb are dependent on the zone in which the OR is expressed, whereas projection sites in the anteroposterior axis are dependent on the specific OR expressed (Mombaerts et al., 1996; Wang et al., 1998; O’Leary et al., 1999).
If glomeruli targeted by neurons expressing highly homologous OR genes within a cluster are located at close sites along the anteroposterior axis of the bulb, it raises two possible speculations. One is that the OR itself functions as a guidance receptor, which binds the proposed guidance ligands present in an anteroposterior gradient across the olfactory bulb. In this model, the binding affinities of highly homologous ORs to these putative ligands appear to be similar, leading to axonal projection of neurons expressing these ORs to the neighboring glomeruli. Another speculation is that ORs do not bind the putative anteroposterior guidance molecules, but each OR gene locus contains a second and distinct set of receptors, which bind these guidance molecules and are expressed if an OR gene within that locus is also expressed. Knock-in studies as well as the transgenic approach as described by Qasba and Reed (1998) may allow us to identify the regulatory regions that dictate a tight linkage between the choice of a receptor and the choice of a glomerular target.
Processing of sensory information on the olfactory bulb
We have observed that OSNs expressing highly homologous OR genes within a cluster converge their axons to neighboring glomeruli on the olfactory bulb. These glomeruli separated by one to four glomerular widths may receive olfactory inputs from the OSNs that recognize related odorant molecules. Using a combination of calcium imaging and single-cell RT-PCR, it has been shown that ORs interacting with similar odorants appear to be highly related (Malnic et al., 1999). Electrophysiological data also suggest that glomeruli responding to related odorants are closely localized on the olfactory bulb; single-unit recordings of individual rabbit mitral/tufted (M/T) cells have revealed that neighboring M/T cells respond to highly related molecules, but not to distant ones (Mori, 1995; Mori and Yoshihara, 1995). Moreover, individual M/T cells excited by a series ofn-aliphatic aldehydes (e.g., with a 4-, 5-, or 6-carbon chain) are often inhibited by aldehydes whose aliphatic chain is one carbon shorter or longer (Yokoi et al., 1995). The proximity of glomeruli targeted by OSNs recognizing related odorants may allow individual M/T cells to respond to the olfactory inputs with excitation as well as with suppression by lateral inhibition via interneurons from the neighboring glomeruli, leading to sharpening the odor codes. Our present results are consistent with those electrophysiological data and may provide a molecular basis for topographical mapping of the glomeruli on the olfactory bulb. These lines of studies will shed light on the molecular basis of topographical projection of OSNs to the olfactory bulb.
Footnotes
This work was supported by the Special Promotion Research Grant from the Ministry of Education and Culture of Japan and by grants from Toray Science Foundation, Nissan Science Foundation, Mitsubishi Foundation, and Sumitomo Foundation. A.T. was supported by fellowships from the Daikou Foundation and the Tohkai Foundation for the Promotion of Industry and Technology. We thank Drs. Hiroshi Kiyama (Asahikawa Medical School), Ichiro Naruse (Kyoto University), and Tetsuo Yamamori (Institute for Basic Biology) for helpful discussion and suggestions, and Dr. Anthony J. Otsuka (Illinois State University) and Ms. Hitomi Sakano (University of California at Berkeley) for critical reading of this manuscript.
Dr. Tsuboi and Mr. Yoshihara contributed equally to this work.
The DDBJ accession numbers for the sequences reported in this paper areAB030892-AB030896.
Correspondence should be addressed to Dr. Akio Tsuboi, Room 111B, Science Building #3, Department of Biophysics and Biochemistry, University of Tokyo, 2-11-16 Yayoi, Bunkyo-ku, Tokyo 113–0032, Japan.
REFERENCES
- 1.Astic L, Saucier D. Anatomical mapping of the neuroepithelial projection to the olfactory bulb in the rat. Brain Res Bull. 1986;16:445–454. doi: 10.1016/0361-9230(86)90172-3. [DOI] [PubMed] [Google Scholar]
- 2.Barth AL, Justice NJ, Ngai J. Asynchronous onset of odorant receptor expression in the developing zebrafish olfactory system. Neuron. 1996;16:23–34. doi: 10.1016/s0896-6273(00)80020-3. [DOI] [PubMed] [Google Scholar]
- 3.Barth AL, Dugas JC, Ngai J. Noncoordinate expression of odorant receptor genes tightly linked in the zebrafish genome. Neuron. 1997;19:359–369. doi: 10.1016/s0896-6273(00)80945-9. [DOI] [PubMed] [Google Scholar]
- 4.Buck LB. Information coding in the vertebrate olfactory system. Annu Rev Neurosci. 1996;19:517–544. doi: 10.1146/annurev.ne.19.030196.002505. [DOI] [PubMed] [Google Scholar]
- 5.Buck L, Axel R. A novel multigene family may encode odorant receptors: a molecular basis for odorant recognition. Cell. 1991;65:175–187. doi: 10.1016/0092-8674(91)90418-x. [DOI] [PubMed] [Google Scholar]
- 6.Chess A, Simon I, Cedar H, Axel R. Allelic inactivation regulates olfactory receptor gene expression. Cell. 1994;78:823–834. doi: 10.1016/s0092-8674(94)90562-2. [DOI] [PubMed] [Google Scholar]
- 7.Frohman MA. Rapid amplification of complementary DNA ends for generation of full-length complementary DNAs: thermal RACE. Methods Enzymol. 1993;218:340–356. doi: 10.1016/0076-6879(93)18026-9. [DOI] [PubMed] [Google Scholar]
- 8.Guthrie KM, Anderson AJ, Leon M, Gall C. Odor-induced increases in c-fos mRNA expression reveal an anatomical “unit” for odor processing in olfactory bulb. Proc Natl Acad Sci USA. 1993;90:3329–3333. doi: 10.1073/pnas.90.8.3329. [DOI] [PMC free article] [PubMed] [Google Scholar]
- 9.Hauptmann G, Gerster T. Two-color whole-mount in situ hybridization to vertebrate and Drosophila embryos. Trends Genet. 1994;10:266. doi: 10.1016/0168-9525(90)90008-t. [DOI] [PubMed] [Google Scholar]
- 10.Hildebrand JG, Shepherd GM. Mechanisms of olfactory discrimination: converging evidence for common principles across phyla. Annu Rev Neurosci. 1997;20:595–631. doi: 10.1146/annurev.neuro.20.1.595. [DOI] [PubMed] [Google Scholar]
- 11.Hirota S, Ito A, Morii E, Wanaka A, Tohyama M, Kitamura Y, Nomura S. Localization of mRNA for c-kit receptor and its ligand in the brain of adult rats: an analysis using in situ hybridization. Mol Brain Res. 1992;15:47–54. doi: 10.1016/0169-328x(92)90150-a. [DOI] [PubMed] [Google Scholar]
- 12.Jourdan F, Duveau A, Astic L, Holley A. Spatial distribution 2- deoxyglucose uptake in the olfactory bulb of rats stimulated with two different odors. Brain Res. 1980;188:139–154. doi: 10.1016/0006-8993(80)90563-6. [DOI] [PubMed] [Google Scholar]
- 13.Kauer JS, Cinelli AR. Are there structural and functional modules in the vertebrate olfactory bulb? Microsc Res Tech. 1993;24:157–167. doi: 10.1002/jemt.1070240207. [DOI] [PubMed] [Google Scholar]
- 14.Levy NS, Bakalyar HA, Reed RR. Signal transduction in olfactory neurons. J Steroid Biochem Mol Biol. 1991;39:633–637. doi: 10.1016/0960-0760(91)90262-4. [DOI] [PubMed] [Google Scholar]
- 15.Malnic B, Hirono J, Sato T, Buck LB. Combinatorial receptor codes for odors. Cell. 1999;96:713–723. doi: 10.1016/s0092-8674(00)80581-4. [DOI] [PubMed] [Google Scholar]
- 16.Mombaerts P, Wang F, Dulac C, Chao SK, Nemes A, Mendelsohn M, Edmondson J, Axel R. Visualizing an olfactory sensory map. Cell. 1996;87:675–686. doi: 10.1016/s0092-8674(00)81387-2. [DOI] [PubMed] [Google Scholar]
- 17.Mori K. Relation of chemical structure to specificity of response in olfactory glomeruli. Curr Opin Neurobiol. 1995;5:467–474. doi: 10.1016/0959-4388(95)80007-7. [DOI] [PubMed] [Google Scholar]
- 18.Mori K, Yoshihara Y. Molecular recognition and olfactory processing in the mammalian olfactory system. Prog Neurobiol. 1995;45:585–619. doi: 10.1016/0301-0082(94)00058-p. [DOI] [PubMed] [Google Scholar]
- 19.O’Leary DDM, Yates PA, McLaughlin T. Molecular development of sensory maps: representing sights and smells in the brain. Cell. 1999;96:255–269. doi: 10.1016/s0092-8674(00)80565-6. [DOI] [PubMed] [Google Scholar]
- 20.Qasba P, Reed RR. Tissue and zonal-specific expression of an olfactory receptor transgene. J Neurosci. 1998;18:227–236. doi: 10.1523/JNEUROSCI.18-01-00227.1998. [DOI] [PMC free article] [PubMed] [Google Scholar]
- 21.Parmentier M, Libert F, Schurmans S, Schiffmann S, Lefort A, Eggerickx D, Ledent C, Mollereau C, Gerard C, Perret J, Grootegoed A, Vassart G. Expression of members of the putative olfactory receptor gene family in mammalian germ cells. Nature. 1992;355:453–455. doi: 10.1038/355453a0. [DOI] [PubMed] [Google Scholar]
- 22.Peterson AS. Direct cDNA selection. In: Birren B, Green ED, Klapholz S, Myers RM, Roskams J, editors. Genome analysis: a laboratory manual, Vol 2, Detecting genes. Cold Spring Harbor Laboratory; New York: 1998. pp. 159–190. [Google Scholar]
- 23.Reed RR. Signaling pathways in odorant detection. Neuron. 1992;8:205–209. doi: 10.1016/0896-6273(92)90287-n. [DOI] [PubMed] [Google Scholar]
- 24.Ressler KJ, Sullivan SL, Buck LB. A zonal organization of odorant receptor gene expression in the olfactory epithelium. Cell. 1993;73:597–609. doi: 10.1016/0092-8674(93)90145-g. [DOI] [PubMed] [Google Scholar]
- 25.Ressler KJ, Sullivan SL, Buck LB. Information coding in the olfactory system: evidence for a stereotyped and highly organized epitope map in the olfactory bulb. Cell. 1994;79:1245–1255. doi: 10.1016/0092-8674(94)90015-9. [DOI] [PubMed] [Google Scholar]
- 26.Sallaz M, Jourdan F. C-fos expression and 2-deoxyglucose uptake in the olfactory bulb of odour-stimulated awake rats. NeuroReport. 1993;4:55–58. doi: 10.1097/00001756-199301000-00014. [DOI] [PubMed] [Google Scholar]
- 27.Shepherd GM. Discrimination of molecular signals by the olfactory receptor neuron. Neuron. 1994;13:771–790. doi: 10.1016/0896-6273(94)90245-3. [DOI] [PubMed] [Google Scholar]
- 28.Singh GB, Kramer JA, Krawetz SA. Mathematical model to predict regions of chromatin attachment to the nuclear matrix. Nucleic Acids Res. 1997;25:1419–1425. doi: 10.1093/nar/25.7.1419. [DOI] [PMC free article] [PubMed] [Google Scholar]
- 29.Stewart WB, Kauer JS, Shepherd GM. Functional organization of rat olfactory bulb, analyzed by the 2-deoxyglucose method. J Comp Neurol. 1979;185:715–734. doi: 10.1002/cne.901850407. [DOI] [PubMed] [Google Scholar]
- 30.Strotmann J, Wanner I, Helfrich T, Beck A, Meinken C, Kubick S, Breer H. Olfactory neurones expressing distinct odorant receptor subtypes are spatially segregated in the nasal neuroepithelium. Cell Tissue Res. 1994a;276:429–438. doi: 10.1007/BF00343941. [DOI] [PubMed] [Google Scholar]
- 31.Strotmann J, Wanner I, Helfrich T, Beck A, Breer H. Rostro-caudal patterning of receptor expressing neurones in the rat nasal cavity. Cell Tissue Res. 1994b;278:11–20. doi: 10.1007/BF00305773. [DOI] [PubMed] [Google Scholar]
- 32.Sullivan SL, Adamson MC, Ressler KJ, Kozak CA, Buck LB. The chromosomal distribution of mouse odorant receptor genes. Proc Natl Acad Sci USA. 1996;93:884–888. doi: 10.1073/pnas.93.2.884. [DOI] [PMC free article] [PubMed] [Google Scholar]
- 33.Vassar R, Ngai J, Axel R. Spatial segregation of odorant receptor expression in the mammalian olfactory epithelium. Cell. 1993;74:309–318. doi: 10.1016/0092-8674(93)90422-m. [DOI] [PubMed] [Google Scholar]
- 34.Vassar R, Chao SK, Sitcheran R, Nunez JM, Vosshall LB, Axel R. Topographic organization of sensory projections to the olfactory bulb. Cell. 1994;79:981–991. doi: 10.1016/0092-8674(94)90029-9. [DOI] [PubMed] [Google Scholar]
- 35.Wang F, Nemes A, Mendelsohn M, Axel R. Odorant receptors govern the formation of a precise topographic map. Cell. 1998;93:47–60. doi: 10.1016/s0092-8674(00)81145-9. [DOI] [PubMed] [Google Scholar]
- 36.Yokoi M, Mori K, Nakanishi S. Refinement of odor molecule tuning by dendrodendritic synaptic inhibition in the olfactory bulb. Proc Natl Acad Sci USA. 1995;92:3371–3375. doi: 10.1073/pnas.92.8.3371. [DOI] [PMC free article] [PubMed] [Google Scholar]