

Abstract
Vibration at ∼70 Hz on the biceps tendon elicits a vivid illusory arm extension. Nobody has examined which areas in the brain are activated when subjects perceive this kinesthetic illusion. The illusion was hypothesized to originate from activations of somatosensory areas normally engaged in kinesthesia. The locations of the microstructurally defined cytoarchitectonic areas of the primary motor (4a and 4p) and primary somatosensory cortex (3a, 3b, and 1) were obtained from population maps of these areas in standard anatomical format. The regional cerebral blood flow (rCBF) was measured with15O-butanol and positron emission tomography in nine subjects. The left biceps tendon was vibrated at 10 Hz (LOW), at 70 or 80 Hz (ILLUSION), or at 220 or 240 Hz (HIGH). A REST condition with eyes closed was included in addition. Only the 70 and 80 Hz vibrations elicited strong illusory arm extensions in all subjects without any electromyographic activity in the arm muscles. When the rCBF of the ILLUSION condition was contrasted to the LOW and HIGH conditions, we found two clusters of activations, one in the supplementary motor area (SMA) extending into the caudal cingulate motor area (CMAc) and the other in area 4a extending into the dorsal premotor cortex (PMd) and area 4p. When LOW, HIGH, and ILLUSION were contrasted to REST, giving the main effect of vibration, areas 4p, 3b, and 1, the frontal and parietal operculum, and the insular cortex were activated. Thus, with the exception of area 4p, the effects of vibration and illusion were associated with disparate cortical areas. This indicates that the SMA, CMAc, PMd, and area 4a were activated associated with the kinesthetic illusion. Thus, against our expectations, motor areas rather than somatosensory areas seem to convey the illusion of limb movement.
Keywords: positron emission tomography (PET); kinesthetic illusion; cytoarchitectural areas 4a, 4p, 3a, 3b, and 1; supplementary motor area (SMA); caudal part of cingulate motor cortex (CMAc); dorsal premotor cortex (PMd); human
Perception of limb movements does not necessarily require the actual movement of the limbs. Vibration stimuli, of ∼70 Hz, on a tendon elicit a vivid illusory limb movement (Eklund, 1972; Goodwin et al., 1972a,b; Craske, 1977; Roll and Vedel, 1982). The vibrations excite muscle spindles and tendon organs. The primary endings are most sensitive (Goodwin et al., 1972a,b; Burke et al., 1976; Roll and Vedel, 1982). The frequency of action potentials in afferents from muscle spindle primary endings and tendon organs increases during muscle lengthening (Roll and Vedel, 1982; Ribot-Ciscar and Roll, 1998). The increased afferent activity from spindles and tendon organs during vibration-induced illusory movement therefore might simulate the proprioceptive discharge occurring during true muscle stretch, although the muscles do not increase in length.
Signals from muscle spindles play a very important role in kinesthesia, the perception of limb movements (Burke et al., 1976,1988; Capaday and Cooke, 1981, 1983; Roll and Vedel, 1982; Rogers et al., 1985; Edin and Vallbo, 1990; Frederick et al., 1990; Macefield et al., 1990; Cordo et al., 1995; Ribot-Ciscar and Roll, 1998). There is evidence that areas 3a and 2 predominantly receive kinesthetic inputs from muscle afferents and joint afferents in cats (Rasmusson et al., 1979; Dykes, 1983) and monkeys (Phillips et al., 1971; Iwamura et al., 1983, 1993; Pons et al., 1992). We consequently expected that areas 3a and 2 would be active in humans as well even when kinesthetic illusions were produced only by vibration. Vibrotactile information arising from skin mechanoreceptor afferents on the other hand would, in accordance with studies in the monkey, be expected to activate predominantly cortical areas 3b and 1 (Jones and Friedman, 1982; Garraghty et al., 1990; Pons et al., 1992; Recanzone et al., 1992; Lebedev and Nelson, 1996; Romo et al., 1998).
In addition, high-amplitude vibrations applied to humans, usually of 100 or 110 Hz, have been reported to activate the primary somatosensory cortex, the secondary somatosensory cortex, the cortex of insula, the supplementary motor area (SMA), and the anterior lobe of cerebellum (Fox et al., 1987; Seitz and Roland, 1992; Burton et al., 1993; Coghill et al., 1994). Although these strong vibrations also activated the M1 and the SMA, they were, however, often associated with paresthesias of the hand and fingers and often even elicited a grasp reflex. In a recent study, Weiller et al. (1996) found that not only the somatosensory cortex but also the SMA and motor cortex were activated by passive movements of the arm.
To detect brain areas that were exclusively activated in association with kinesthetic illusions, we attempted to distinguish the effect of kinesthesia from the effect of vibration. For this reason, we vibrated the biceps tendon at frequencies that elicited kinesthetic illusions and at frequencies that elicited no illusion. The activations related to the kinesthetic illusion we hypothesized to originate from areas 3a and 2, perhaps associated with activations of motor areas. In this study we relate the activations to population maps of the quantitatively defined cytoarchitectural areas 4a, 4p, 3a, 3b, and 1 (Roland et al., 1997; Roland and Zilles, 1998; Schleicher et al., 1999).
MATERIALS AND METHODS
Psychophysical experiment. Twenty healthy right-handed male subjects participated in the psychophysical experiment. Their age ranged from 23 to 33 years. They were blindfolded, and their left arms were fixed to a plastic plate with adhesive tape. This kept the angle of the elbow fixed at 130°. We asked the subjects to completely relax their left arm and close their eyes during the vibrations. Ear plugs and headphones prevented the subjects from hearing the sound of the vibrator. We used a vibrator (Mini-shaker type 4810, 1935497; Brüel & Kjär, Närum, Denmark) and stimuli from 10 to 240 Hz. The frequency was changed from 10 to 100 Hz in 10 Hz steps and from 100 to 240 Hz in 20 Hz steps to find the optimal frequency that elicited a clear and strong illusion of elbow extension and to find other frequencies that did not elicit any illusions. An additional measurement at 190 Hz was also included. Each frequency was tested three times in each subject, with the exceptions of 120, 140, and 160 Hz, which were only tested once in each subject. The amplitudes of vibration ranged from 0.2 to 3 mm (Fig.1A). The vibrations were rectangular pulse sequences. The tendon was vibrated tangentially. The order of frequencies was randomized. The duration of each vibration was 60 sec. We vibrated the biceps tendon of the left arm applying a light pressure on the surface of the skin over the tendon. We told the subjects that we were going to vibrate here (on the tendon) and that this might cause a feeling of the arm moving. We asked the subjects to say “start” when they felt the start of an eventual illusory movement of the arm and to say “stop” when the sense of movement disappeared. From these responses, the start time and the duration of the illusion were calculated. After 60 sec of vibration, we asked the subjects to evaluate the subjective psychological experiences of illusion by scoring from 0 to 10 the vividness, duration, and strength of the illusion. Vividness was defined as the clarity of the experience compared with an actual arm movement. When they felt the illusory arm movement as if their arm were actually moving, they should have scored 10. The continuance was their subjective scaling on how long they felt the illusion during the 60 sec. If they felt the illusion throughout the whole period of stimulation, they should have scored 10. The strength of illusion was how much the arm moved. If they felt that the arm had been maximally extended, they should have scored 10. When they did not feel any illusion at all, they should have scored 0 in all three questionnaires. We calculated the correlation coefficients between the mean values of the durations of illusions across all subjects and the mean continuance scores to assess the reliability of psychological rating.
Fig. 1.

Amplitudes of vibration (A), psychological scores of illusion (continuance, duration, and strength) (B), and actually measured duration and onset time of kinesthetic illusion (C) in the psychophysical experiment. The actually measured duration and psychological scores changed in the same manner as a function of vibration frequency. B, Dark filled barsrepresent psychological scores for continuance of the illusion;gray bars represent vividness; and white bars represent strength. C, White bars represent the onset time, i.e., delay between the onset of the vibration and the onset of the illusion; dark barsindicate duration of illusion. The duration of illusion was getting longer as vibration frequency increased from 10 to 70 Hz. It was maximal at 70 Hz and declined again with further increases in frequency. Changes in the onset time of the illusion after the start of the vibration corresponded to the changes of the duration.
Subjects and conditions in positron emission tomography scan. Nine subjects from our psychophysical experiment, who experienced a strong illusion of arm extension at 70 or 80 Hz and no illusion at 10 and 220 or 240 Hz, participated in the positron emission tomography (PET) experiment. Their age ranged from 23 to 33 years. The study was approved by the Ethics Committee of the Karolinska Hospital and the Radiation Safety Committee of the Karolinska Institute and Hospital and performed following the principles and guidelines of the Declaration of Helsinki, 1975. The blindfolded subjects rested comfortably in a supine position with their ears plugged. The subjects had their heads fixed to the scanner by a stereotaxic helmet (Bergström et al., 1981), which was also used for fixation during the magnetic resonance imaging (MRI) scan. Otherwise, the conditions were identical to the psychophysical experiment, with the exception that no psychological scoring was done.
Each subject had a catheter placed into the right brachial vein for tracer administration and another inserted, under local anesthesia, into the left radial artery for measurement of arterial radioisotope activity and partial pressure of arterial CO2(PaCO2). The arterial PaCO2 was sampled once during each PET scan. Each subject had 12 PET scans. The experiment consisted of four conditions, each having three repetitions. The subjects were instructed to focus their attention on the feeling coming from their left arm without thinking about psychological scores. The subjects were not allowed to say “start” and “stop” in the PET experiment. The four conditions were as follows: (1) REST; the subjects were instructed to relax completely; during rest, the vibrator was on but did not touch the skin; this was done to balance the humming of the vibrator across conditions; (2) 10 Hz vibration (LOW); (3) 70 or 80 Hz vibration (ILLUSION); either 70 Hz or 80 Hz was selected, depending on which frequency was optimal to produce the illusion in each subject; and (4) 220 or 240 Hz (HIGH); 220 Hz or 240 Hz was selected, depending on which frequency did not produce any kinesthetic illusion. The order of REST and test conditions was randomized after a balanced randomized schedule. The vibration site was ∼1 cm2 and was marked on the surface of the skin over the left biceps tendon. The experimenter vibrated this site as precisely and constantly as possible to keep the amplitude of the waveforms constant during the scan. The amplitude was shown on an oscilloscope and monitored with an accelerometer (Cubic Deltatron accelerometer type 4503, 1873682; Brüel & Kjär) mounted on the top of the vibrator.
Electromyogram recording. We recorded the electromyogram (EMG) from the biceps and triceps. Two electrodes (Neuroline disposable neurology electrodes, type 700 01-A 12; Ölstykke) were put on the surface of the skin, over the biceps belly and triceps belly. The gain of the amplifier was 2000, and the high-cut filter was set at 20 kHz.
PET and MRI scanning and analysis. The methods for regional cerebral blood flow (rCBF) measurement were as described earlier (Hadjikhani and Roland, 1998). Each subject, equipped with a stereotaxic helmet, had a magnetic resonance tomogram and a PET scan. The magnetic resonance tomograms were obtained from spoiled gradient echo sequences obtained with a 1.5 T General Electric (Milwaukee, WI) Signa scanner [echo time, 5 msec; repetition time, 21 msec; flip angle, 50°, giving rise to a three-dimensional (3D) volume of 128 × 256 × 256 isotropic voxels of 1 mm3; field of view, 256 mm2]. The rCBF was measured with a PET camera (ECAT Exact HR; Siemens, Erlangen, Germany) in 3D mode. Approximately 15 mCi of15O-butanol were injected intravenously as a bolus. The arterial input function was continuously monitored, and the rCBF was calculated on the basis of the data from 0 to 50 sec by an autoradiographic procedure (Meyer, 1989). The sinograms were reconstructed with a 4 mm ramp filter. The reconstructed images were filtered with a 5 mm 3D isotropic Gaussian filter. The PET scans from each subject were spatially aligned on the first PET scan, using the AIR software (Woods et al., 1992).
Each individual’s MR image of the brain was transformed to the standard anatomical format of the Human Brain Atlas (HBA), and subsequently the PET images were transformed by the HBA to standard brain format (Roland et al., 1994). Affine and nonaffine transformations were used, and special care was taken to optimize the fit of the central sulcus. The anatomically standardized images had a voxel size of 2 × 2 × 2 mm3. All voxels outside the brain were excluded from the statistical analysis. The statistical analysis was done by describing the data by a general linear model (Ledberg et al., 1998). The design matrix had tasks and subjects as factors. The common effect of vibration was detected by contrasting LOW, ILLUSION, and HIGH conditions versus REST. The effect of illusion was detected by contrasting ILLUSION versus LOW and HIGH conditions. The effect of pure vibration was detected by contrasting LOW and HIGH conditions versus REST. The results of these contrasts in the general linear model are z images, having highz values where the differences between the contrasted conditions were conspicuous. Regions of significant clusters of voxels having high z values were determined using the cluster method of Ledberg et al. (1998). The probability of false-positive clusters in the whole brain was estimated by Monte Carlo simulations of 9652 noise images (Ledberg et al., 1998). The simulations gave a cluster size of 576 mm3 and a z threshold of 2.58 as significant (p < 0.05) for the whole brain space. We only report clusters of a size corresponding to an omnibus p < 0.05 or better and present the images containing these significant clusters of activations.
The activations covering the sensorimotor cortices were examined for localization within cytoarchitectonic areas 4a, 4p, 3a, 3b, and 1 (Geyer et al., 1996; Roland et al., 1997; Schleicher et al., 1999). The cytoarchitectonic regions were delineated with observer-independent techniques in a small sample of four postmortem brains and were subsequently transformed into the same standard anatomical format as were the functional images. Corresponding areas from different brains were superimposed in 3D space, and overlay maps were calculated for each area. The activated fields were then compared with the spatial extent of each cytoarchitectural area defined as the 50% population map of this area, i.e., the voxels in which this area can be found in ≥50% of population brains (Roland and Zilles, 1998).
The active fields were thus located in relation to cytoarchitectural areas 4a, 4p, 3a, 3b, and 1. This left the premotor cortex (PM) and SMA to be defined arbitrarily. By the SMA, we understand the cortex rostral to area 4a on the medial side of the hemisphere, above the cingulate sulcus. The rostral border of the SMA is arbitrarily set at the vertical plane y = 16 (Buser and Bancaud, 1967). The lateral PM is located rostrally to lateral area 4a (Geyer et al., 1996;Roland and Zilles, 1996). Its rostral border is not known. The cingulate motor areas (CMAs) and their preliminary parceling into a rostral part and a caudal part (CMAc) were described in Roland and Zilles (1996).
RESULTS
Psychophysical data
All 20 subjects perceived an illusory arm movement during the 70 or 80 Hz vibration of the biceps tendon. The direction of the illusory movement was consistently an arm extension. The psychological scores (continuance, vividness, and strength) changed in the same manner when the vibration frequency changed. The subjects experienced that the duration of the illusion increased as the vibration frequency increased from 20 to 70 Hz. The continuance was the longest at 70 Hz; after that it gradually decreased as the frequency increased (Fig.1B). The 20 subjects also felt that the delay between the onset of the vibration and the onset of the illusion decreased with frequencies increasing from 10 to 60 Hz. Once the illusion started, it usually persisted as long as the tendon was vibrated at frequencies close to 70 Hz. The duration was the longest at 70 Hz; after that the duration decreased gradually as the frequency increased (Fig. 1C). The correlation coefficients between the mean psychological scores (continuance, vividness, and strength) and mean measured duration were 0.98, 0.99, and 0.97, respectively. From this we concluded that the psychological rating was reliable.
From this psychophysical experiment in the 20 subjects we found that 70 or 80 Hz (ILLUSION condition) was the optimal frequency to elicit the illusion of arm extension and that 10 Hz (LOW) and 220 or 240 Hz (HIGH) were appropriate frequencies, which in almost all subjects did not elicit any illusion at all (Fig. 1B,C). However, some subjects still felt minute illusory movements even when we used 10 or >220 Hz. We excluded these subjects from the PET study. A total of nine subjects were selected for the PET experiments. We retested every one of these nine subjects, who participated in the PET experiment, a few months after the PET experiment and did the psychophysical experiment again using 10, 70 or 80, or 220 or 240 Hz to make sure that the experience of illusion was reproducible. All subjects experienced the same strong illusion at 70 or 80 Hz but no illusion at 10, 220, or 240 Hz. We concluded that the experience of the illusion was very stable.
Behavioral aspects and EMG activity during PET scanning
After each PET experiment, all nine subjects reported continuous and slow illusory arm extensions when their tendons were vibrated at 70 or 80 Hz. None of the nine subjects experienced any illusion at 10 and 220 or 240 Hz. We did not find any EMG activity from the biceps or the triceps in any subject. This also meant that none of the nine subjects had any tonic vibration reflex or any response to the vibration in an antagonist muscle.
The main effects of vibration
We first contrasted (LOW + ILLUSION + HIGH) versus REST. We found four significant clusters, whose local maxima were located in the contralateral (right) postcentral gyrus, parietal operculum, frontal operculum, and ipsilateral parietal operculum (Fig.2A–D, Table1). The activation in the precentral and postcentral gyri covered cytoarchitectural areas 4p, 3b, and 1 (Table1). Area 4a, dorsal premotor cortex (PMd), SMA, and CMAc were not activated.
Fig. 2.

The main effects of vibration. Common active fields were obtained from (LOW + ILLUSION + HIGH) versus REST. The fields were superimposed on the standard brain. A, Horizontal section at z = +60. Contralateral activation occurred in the postcentral gyrus (SI). Area 4a, PMd, SMA, and CMAc were not activated. B, Horizontal section atz = +21. Bilateral activation occurred in the parietal operculum (PO). C, Horizontal section at z = +14. Contralateral activations occurred in the frontal operculum (FO), extending into the insular cortex. D, Coronal section aty = −27, showing bilateral activations of the parietal operculum (PO).
Table 1.
Locations and sizes of significant activations in (LOW + ILLUSION + HIGH) versus REST
| Structures | Coordinates of peakz value (HBA; Roland et al., 1994) (mm3) | Volume | Peak z value | ||
|---|---|---|---|---|---|
| x | y | z | |||
| Right hemisphere | |||||
| SI, M11-a | −30 | −36 | 50 | 1704 | 4.01 |
| Cytoarchitectonic areas | |||||
| Area 4p | 121 | ||||
| Area 1 | 256 | ||||
| Area 3b | 148 | ||||
| Parietal operculum | −40 | −27 | 20 | 816 | 4.38 |
| Frontal operculum1-b | −38 | −4 | 15 | 616 | 4.29 |
| Left hemisphere | |||||
| Parietal operculum | 44 | −34 | 27 | 584 | 3.39 |
The peak was located in the postcentral gyrus. This activation overlapped with cytoarchitectonic areas 4p, 3b, and 1. Overlaps smaller than 50 mm3 are not shown.
This extended into the insular cortex.
Active fields for ILLUSION versus REST and (LOW + HIGH) versus REST
We contrasted ILLUSION and REST. We found three significant clusters, whose local maxima were located in the contralateral (right) SMA, postcentral gyrus, and anterior part of the parietal operculum (Table 2). The SMA activation extended into the CMAc. The activation in the postcentral gyrus covered cytoarchitectural areas 3b and 1 and extended anteriorly into areas 4p and 4a and further into the PMd. Posteriorly, this activation extended into the cortex lining the postcentral sulcus (Table 2).
Table 2.
Locations and sizes of significant activations in the ILLUSION versus REST and (LOW + HIGH) versus REST
| Structures | Coordinates of peakz value (HBA; Roland et al., 1994) (mm3) | Volume | Peak z value | ||
|---|---|---|---|---|---|
| x | y | z | |||
| ILLUSION vs REST | |||||
| Right hemisphere | |||||
| SI, M12-a | −32 | −38 | 63 | 3680 | 5.17 |
| Cytoarchitectonic areas | |||||
| Area 4a | 330 | ||||
| Area 4p | 388 | ||||
| Area 3b | 191 | ||||
| Area 1 | 293 | ||||
| SMA2-b | −5 | −22 | 49 | 1000 | 4.28 |
| Parietal operculum (anterior) | −40 | −28 | 21 | 624 | 4.89 |
| (LOW + HIGH) vs REST | |||||
| Right hemisphere | |||||
| Anterior cingulate2-c | −2 | 30 | 30 | 640 | 4.23 |
| Frontal operculum2-d | −38 | −6 | 15 | 952 | 4.22 |
The peak was located in the postcentral gyrus. This activation overlapped with cytoarchitectonic areas 4a, 4p, 3b, and 1. Overlaps smaller than 50 mm3 are not shown. This field extended anteriorly into area 6 and posteriorly into the gyri lining the postcentral sulcus.
This was extending into the CMAc.
This extended into the left anterior cingulate cortex.
This also extended into the right cortex of the insula.
The SMA, CMAc, PMd, areas 4a, 4p, 3b, and 1, and the cortex lining the postcentral sulcus were not significantly activated when the LOW and HIGH conditions were contrasted to REST (Table 2).
Active fields for ILLUSION contrasted with (LOW + HIGH)
We made a contrast image ILLUSION versus (LOW + HIGH). In this contrast, the procedures and effects of vibration were supposedly balanced. Two clusters appeared significant in this contrast. The first was located in the contralateral (right) SMA extending into the CMAc. A large part overlapped with the activation that was found in the ILLUSION versus REST condition. The second cluster had its local maximum in area 4a (−24, −32, and 60) but covered cytoarchitectural areas 4p, 3b, and 1 as well (Fig.3A–D, Table3). Rostrally it extended into the PMd (Fig. 3C, Table 3). The parietal operculum and the cortex lining the postcentral sulcus were not significantly activated in this contrast.
Fig. 3.
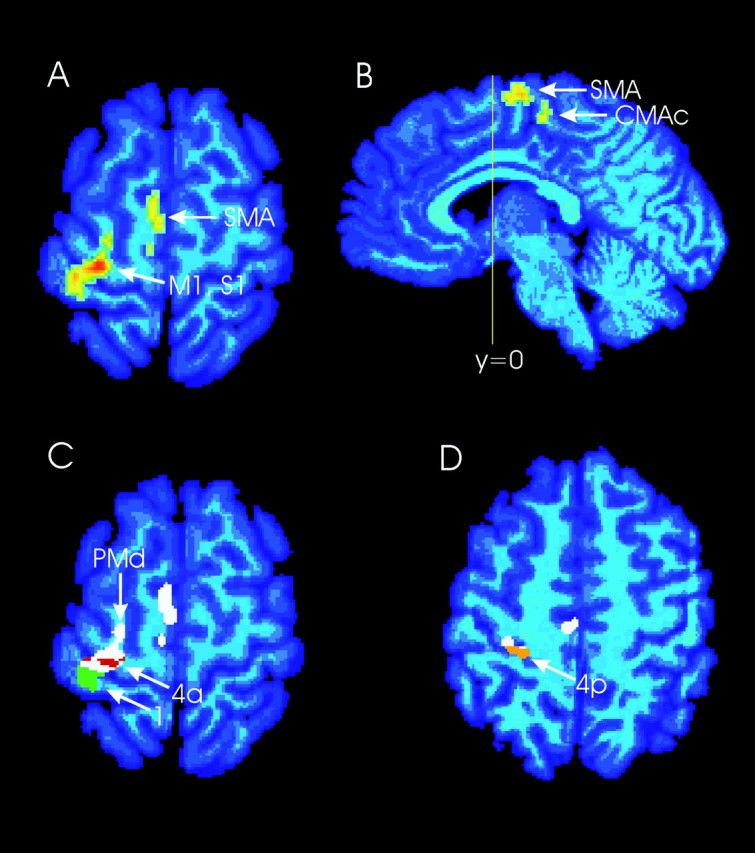
Active fields obtained from ILLUSION versus (LOW + HIGH). The active fields were superimposed on the standard brain.A, Horizontal section at z = +60. The contralateral primary motor cortex (area 4a), postcentral gyrus, PMd, and SMA were activated. B, Sagittal section atx = −4, showing SMA and CMAc activation.C, Horizontal section at z = +60. The significant clusters are white. Engagement of cytoarchitectural areas 4a (red) and 1 (green) is shown. Rostrally the activation extends into area 6 (PMd, white). D, Horizontal section at z = +50. The engagement of cytoarchitectural area 4p is shown (orange).
Table 3.
Locations and sizes of significant activations specific to the illusion [ILLUSION versus (LOW + HIGH)]
| Structures | Coordinates of peak z value (HBA; Roland et al., 1994) (mm3) | Volume | Peakz value | ||
|---|---|---|---|---|---|
| x | y | z | |||
| Right hemisphere | |||||
| M1, SI3-a | −24 | −32 | 60 | 2112 | 4.85 |
| Cytoarchitectonic areas | |||||
| Area 4a | 437 | ||||
| Area 4p | 257 | ||||
| Area 3b | 99 | ||||
| Area 1 | 116 | ||||
| SMA3-b | −4 | −14 | 60 | 664 | 4.19 |
The peak was located in cytoarchitectonic area 4a. This activation extended anteriorly into the PMd and posteriorly into areas 4p, 3b, and 1. Overlaps smaller than 50 mm3 are not shown.
This also extended into the ventral part of SMA and the CMAc.
Volume of interest analysis: rCBF increases in areas 4a, 4p, 3b, and 1
The cluster images showing the statistically significant fields of activation and their engagement of cytoarchitectural areas 4a, 4p, 3b, and 1 do not answer the question of whether each of these cytoarchitectural areas was statistically significantly activated. The evaluation of whether a cytoarchitectural area is significantly activated is best done by examining the mean blood flows in the part of the cytoarchitectural area covered by the cluster. In the image showing the statistically significant clusters of the contrast ILLUSION versus REST, the parts of the sensorimotor cluster engaging cytoarchitectural areas 4a, 4p, 3b, and 1 were used as volumes of interest (VOIs). Because cytoarchitectural area 3a was not activated in >12 mm3 in any of the contrasts, the area 3a engagement was clearly insignificant, and area 3a was not included in the VOI analysis. The mean rCBF of these VOIs was then calculated for each PET scan. The effect of repetition of the same condition was then removed by calculating the mean rCBF for each condition. When ILLUSION was contrasted to REST, each of areas 4a, 4p, 3b, and 1 was significantly activated (p < 0.01 for each area, one-tailedt test after Bonferroni correction for four comparisons). When these VOIs were also used to evaluate the contrast between HIGH and REST, it turned out that areas 4p and 3b were significantly activated (p < 0.04 for each area, one-tailedt test after Bonferroni correction). Similarly, areas 4a, 4p, 3b, and 1 were significantly activated in the contrast LOW versus REST (p < 0.04 for each area, one-tailedt test after Bonferroni correction). This meant that areas 4p and 3b were activated in each condition when contrasted to the REST.
When ILLUSION was contrasted to (HIGH + LOW), only area 4a was significantly more activated in ILLUSION (p < 0.02, one-tailed t test after Bonferroni correction) (Fig.4).
Fig. 4.

rCBF increases in areas 4a, 4p, 3b, and 1. Mean relative rCBF for VOIs of cytoarchitectural areas 4a, 4p, 3b, and 1 is shown. The VOIs were the intersections between these areas and the significant cluster from the contrast ILLUSION versus REST.White bars represent mean relative rCBF for HIGH condition; gray bars represent ILLUSION; black bars represent LOW condition. Error bars indicate SEM. The mean relative rCBF of these VOIs was then calculated for each PET scan, divided by the mean of the REST rCBF. The effect of repetition of the same condition was then removed by calculating the mean rCBF for each condition.
DISCUSSION
When ILLUSION was contrasted with LOW and HIGH, the contralateral (right) SMA, CMAc, PMd, and area 4a were significantly activated. None of these areas were activated in the contrast of (LOW + ILLUSION + HIGH) versus REST. This demonstrated that the effects of illusion and vibration were associated with different sets of cortical fields. The activity in motor areas SMA, CMAc, PMd, and 4a was associated with the illusion of kinesthesia. This was in contrast to our hypothesis that somatsosensory areas should be active when kinesthetic illusions were experienced.
Vibration of the left biceps tendon at 70 or 80 Hz (ILLUSION) elicited a vivid kinesthetic illusion of arm extension in all subjects, whereas 10 Hz (LOW) and 220 or 240 Hz (HIGH) did not. The stimulus conditions were matched for attention, inasmuch as the subjects in all three conditions were requested to pay attention to the feelings coming from the arm. We did not observe any arm movements or any EMG activity, meaning that there were no tonic vibration reflexes (Eklund and Hagbart, 1966; Tardy-Gervet et al., 1986) in any of the conditions. The kinesthetic feeling of the subjects at 70 Hz vibrations was thus a true illusion, because the phenomenon could not be explained by actual movement of the arm or by any muscular activity. The vibrator produced a hum having the same frequency as the vibration. Although the subjects had their ears plugged and covered by the helmet, a faint hum might have reached their ears. In the REST condition, however, a hum matching the three vibration conditions was also presented. The vibration conditions, however, were not matched for stimulus energy and frequency of the vibrations. It is unlikely that the differences in stimulus energy could explain the activations of the somatosensory and motor cortices. The energy of the 240 Hz stimulus was much higher than the 70 or 80 Hz stimuli.
Active fields specific for illusion
The contralateral SMA, CMAc, PMd, areas 4a, 4p, 3b, and 1, and the cortex lining the postcentral sulcus were activated in the ILLUSION versus REST. The SMA, CMAc, PMd, and area 4a were significantly more activated when ILLUSION was contrasted to the LOW and HIGH conditions. This contrast revealed no statistically significant differences in rCBF in the cortex lining the postcentral sulcus and the cortex of the parietal operculum, thus no indications that these somatosensory regions would be engaged in the production of kinesthetic illusions. This meant that the activations of the contralateral SMA, CMAc, PMd, and area 4a were specific for the 70 Hz vibration and the kinesthetic illusion. The main effect of vibration, as mentioned, was associated with activations in a different set of cortical fields, demonstrating that the activations of SMA, CMAc, PMd, and area 4a could not have been attributable to the condition of vibration per se. It appears consequently that the SMA, CMAc, PMd, and area 4a seem specifically associated with the experience of kinesthetic illusions.
Perceptual illusions of kinesthesia probably are produced by the neuronal populations engaged in computation of kinesthesia under normal conditions. In the visual system, for example, illusory motion has been shown to be associated with activation of functional areas engaged in computation of correlated motion (Zeki et al., 1993; Tootell et al., 1995). Stimulation of the SMA and CMA in awake humans sometimes produces a kinesthetic illusion (Fried et al., 1991; Lim et al., 1994). The surprising finding is that the motor areas 4a, PMd, SMA, and CMAc, and not the somatosensory areas, seem associated with kinesthetic illusions.
Kinesthesia
Weiller et al. (1996) showed that the SMA, sensorimotor cortices, and inferior parietal cortex were activated when they flexed and extended the elbow in normal passive subjects compared with rest. Their activation in the inferior parietal lobule (coordinates +42, −32, and 20) might have been attributable to the lack of a sensory control, because this activation was close to our activations in the right parietal operculum when the ILLUSION was compared with the REST (−40, −28, and 21) (Table 2). However, when ILLUSION was contrasted to the sensory controls (LOW + HIGH), only the activations of the motor areas remained. Thus, given the data of Weiller et al. (1996) and the appropriate sensory controls, there is a remarkable correspondence in the cortical areas active in kinesthesia and during kinesthetic illusions.
If the motor areas are conveying the illusion of arm movement, one may ask how the signals set up by vibrating the biceps tendon reach these areas, and whether the motor areas have any known role in kinesthesia. Passive movements activate receptors in joints, receptors in the skin responding to skin stretch and touch, as well as muscle spindles. Afferents from all these receptors thus are usually active in microneurographical studies (Vallbo, 1974; Burke et al., 1988; Edin and Vallbo, 1988, 1990; Edin, 1990, 1992; Edin and Abbs, 1991; Edin and Johansson, 1995; Vallbo et al., 1995). Vibration on the tendon of a muscle excites muscle spindle afferents (Goodwin et al., 1972a,b; Burke et al., 1976; Roll and Vedel, 1982) and skin mechanoreceptors (Johansson et al., 1982) but presumably does not activate joint and cutaneous stretch receptors, making tendon vibration a more specific kinesthetic stimulus than passive movement.
The afferent activity from skin mechanoreceptors is quite different at 10 and 240 Hz because only the Pacinians are able to follow 240 Hz vibration with one impulse per cycle (Johansson et al., 1982). The afferents from muscle spindles presumably end in area 3a (Landgren et al., 1967; Landgren and Silfvenius, 1969, 1971; Phillips et al., 1971;Hore et al., 1976; Jones and Porter, 1980; Maendly et al., 1981;Iwamura et al., 1983, 1993). The muscle spindle primary endings are able to follow 10 and 70 Hz vibrations in a one-per-cycle manner, but not 240 Hz (Burke et al., 1976). This means that area 3a should be expected to get the most afferent input from muscle spindles at 70–80 Hz. Area 4p was activated in all three conditions of vibration, but area 3a was not significantly activated in any of the contrasts, giving no support for an engagement of area 3a from the present data. Reasons for the lack of area 3a engagement may also be its small volume (Roland et al., 1997), the variance in the position of the bottom of the central sulcus, and the small number of cytoarchitecturally mapped brains (Roland et al., 1997).
Area 3a has major connections to areas 4a, 4p, SMA, and CMA (Huerta and Pons, 1990; Darian-Smith et al., 1993; Stepniewska et al., 1993). In the ILLUSION condition, one may then think that the muscle spindle afferent signals are spread to area 4a, the PMd, the SMA, and CMA. There is some independent support for this from single-unit recording in monkeys. First area 4a (and probably also 4p) neurons fire in response to muscle stretch (Rosén and Asanuma, 1972; Lemon and Porter, 1976; Lemon et al., 1976; Wong et al., 1978; Fetz et al., 1980;Lemon, 1981a,b; Tanji and Wise, 1981; Strick and Preston, 1982; Ghosh et al., 1987; Colebatch et al., 1990; Crutcher and Alexander, 1990;Picard and Smith, 1992; Aizawa and Tanji, 1994; Widener and Cheney, 1997). Second, neurons in the SMA and PMd respond to passive elbow flexions and extensions (Brinkman and Porter, 1979; Wise and Tanji, 1981; Wiesendanger et al., 1985; Wiesendanger, 1986; Hummelsheim et al., 1988). Third, many neurons in the CMA respond to proprioceptive input, such as joint rotation and muscle stretch (Cadoret and Smith, 1995). If the signals from the muscle spindles do not reach the motor cortex via area 3a, another possibility is that area 4a, PMd, SMA, and CMAc were specifically activated by thalamocortical afferents from the VLo and VPLo nuclei, which project to area 4a, PMd, SMA, and CMA (Horne and Tracy, 1979; Lemon and van der Burg, 1979; Asanuma et al., 1980; Schell and Strick, 1984; Brinkman et al., 1985; Greenan and Strick, 1986; Holsapple et al., 1991; Darian-Smith and Darian-Smith, 1993). We cannot exclude this on the basis of the present data. What speaks against this hypothesis is the lack of cerebellar, basal ganglia, and thalamic activations in the present study. What according to the present data seems to be the most plausible interpretation is that the character of the afferent signals at 70 Hz vibration of the tendon is such that area 4a, PMd, CMAc, and SMA are recruited either by afferent input via 3a or from subcortical sources when the subjects experience the kinesthetic illusion.
Footnotes
This work was supported by Biotech Grant Bio-CT-96-0177 from the European Council, by the Medical Research Council of Sweden, and by Deutsche Forschungsgemeinschaft Grant SFB 194/A6. E.N. was supported by the Brain Science Foundation and the Naito Foundation in 1997. H.H.E. was supported by the A. and M. Ax:sson Johnsson Foundation.
Correspondence should be addressed to Dr. Per E. Roland, Division of Human Brain Research, Department of Neuroscience, Karolinska Institute, Doktorsringen 12, 171 77 Stockholm, Sweden.
Dr. Naito’s present address: Faculty of Human Studies, Kyoto University, Sakyo-ku, Kyoto 606-8501 Japan.
REFERENCES
- 1.Aizawa H, Tanji J. Corticocortical and thalamocortical responses of neurons in the monkey primary motor cortex and their reaction to a trained motor task. J Neurophysiol. 1994;71:550–560. doi: 10.1152/jn.1994.71.2.550. [DOI] [PubMed] [Google Scholar]
- 2.Asanuma H, Larsen K, Yumiya H. Peripheral input pathways to the monkey motor cortex. Exp Brain Res. 1980;38:349–355. doi: 10.1007/BF00236655. [DOI] [PubMed] [Google Scholar]
- 3.Bergström M, Boethius J, Eriksson L, Greitz T, Ribbe T, Widen L. Head fixation device for reproducible position alignment in transmission CT and positron emission tomography. J Comput Assist Tomogr. 1981;5:136–141. doi: 10.1097/00004728-198102000-00027. [DOI] [PubMed] [Google Scholar]
- 4.Burke D, Hagbarth K, Lofstedt L, Wallin G. The responses of human muscle spindle endings to vibration of non-contracting muscles. J Physiol (Lond) 1976;261:673–693. doi: 10.1113/jphysiol.1976.sp011580. [DOI] [PMC free article] [PubMed] [Google Scholar]
- 5.Burke D, Gandevia SC, Macefield G. Responses to passive movement of receptors in joint, skin, and muscle of the human hand. J Physiol (Lond) 1988;401:347–361. doi: 10.1113/jphysiol.1988.sp017208. [DOI] [PMC free article] [PubMed] [Google Scholar]
- 6.Brinkman C, Porter R. Supplementary motor area in the monkey: Activity of neurons during performance of a learned motor task. J Neurophysiol. 1979;42:681–709. doi: 10.1152/jn.1979.42.3.681. [DOI] [PubMed] [Google Scholar]
- 7.Brinkman J, Colebatch JG, Porter R, York DH. Responses of precentral cells during cooling of postcentral cortex in conscious monkeys. J Physiol (Lond) 1985;368:611–625. doi: 10.1113/jphysiol.1985.sp015879. [DOI] [PMC free article] [PubMed] [Google Scholar]
- 8.Burton H, Videen TO, Raichle ME. Tactile-vibration-activated foci in insula and parietal-opercular cortex studied with positron emission tomography: mapping the second somatosensory area in humans. Somatosens Mot Res. 1993;10:297–308. doi: 10.3109/08990229309028839. [DOI] [PubMed] [Google Scholar]
- 9.Buser P, Bancaud J. Bases techniques et méthodologiques de l’éxploration fonctionelle stéréotaxique de télencephale. In: Talairach F, Szikta G, editors. Atlas stéréotaxique du télencéphale. Masson et Cie; Paris: 1967. pp. 251–318. [Google Scholar]
- 10.Cadoret G, Smith AM. Input-output properties of hand-related cells in the ventral cingulate cortex in the monkey. J Neurophysiol. 1995;73:2584–2590. doi: 10.1152/jn.1995.73.6.2584. [DOI] [PubMed] [Google Scholar]
- 11.Capaday C, Cooke JD. The effects of muscle vibration on the attainment of intended final position during voluntary human arm movement. Exp Brain Res. 1981;42:228–230. doi: 10.1007/BF00236912. [DOI] [PubMed] [Google Scholar]
- 12.Capaday C, Cooke JD. Vibration-induced changes in movement-related EMG activity in humans. Exp Brain Res. 1983;52:139–146. doi: 10.1007/BF00237158. [DOI] [PubMed] [Google Scholar]
- 13.Coghill RC, Talbot JD, Evans AC, Meyer E, Gjedde A, Bushnell MC, Duncan GH. Distributed processing of pain and vibration by the human brain. J Neurosci. 1994;14:4095–4108. doi: 10.1523/JNEUROSCI.14-07-04095.1994. [DOI] [PMC free article] [PubMed] [Google Scholar]
- 14.Colebatch JG, Sayer RJ, Porter R, White OB. Responses of monkey precentral neurones to passive movements and phasic muscle stretch: relevance to man. Electroencepharogr Clin Neurophysiol. 1990;75:44–55. doi: 10.1016/0013-4694(90)90151-9. [DOI] [PubMed] [Google Scholar]
- 15.Cordo P, Gurfinkel VS, Bevan L, Kerr GK. Proprioceptive consequences of tendon vibration during movement. J Neurophysiol. 1995;74:1675–1688. doi: 10.1152/jn.1995.74.4.1675. [DOI] [PubMed] [Google Scholar]
- 16.Craske B. Perception of impossible limb positions induced by tendon vibration. Science. 1977;196:71–73. doi: 10.1126/science.841342. [DOI] [PubMed] [Google Scholar]
- 17.Crutcher MD, Alexander GE. Movement-related neuronal activity selectively coding either direction or muscle pattern in three motor areas of the monkey. J Neurophysiol. 1990;64:151–163. doi: 10.1152/jn.1990.64.1.151. [DOI] [PubMed] [Google Scholar]
- 18.Darian-Smith C, Darian-Smith I. Thalamic projections to area 3a, 3b, and 4 in the sensorimotor cortex of the mature and infant macaque monkey. J Comp Neurol. 1993;335:173–199. doi: 10.1002/cne.903350204. [DOI] [PubMed] [Google Scholar]
- 19.Darian-Smith C, Darian-Smith I, Burman K, Ratcliffe N. Ipsilateral cortical projections to areas 3a, 3b, and 4 in the macaque monkey. J Comp Neurol. 1993;335:200–213. doi: 10.1002/cne.903350205. [DOI] [PubMed] [Google Scholar]
- 20.Dykes RW. Parallel processing of somatosensory information: a theory. Brain Res Rev. 1983;6:47–115. doi: 10.1016/0165-0173(83)90004-8. [DOI] [PubMed] [Google Scholar]
- 21.Edin BB. Finger joint movement sensitivity of non-cutaneous mechanoreceptor afferents in the human radial nerve. Exp Brain Res. 1990;82:417–422. doi: 10.1007/BF00231261. [DOI] [PubMed] [Google Scholar]
- 22.Edin BB. Quantitative analysis of static strain sensitivity in human mechanoreceptors from hairy skin. J Neurophysiol. 1992;67:1105–1113. doi: 10.1152/jn.1992.67.5.1105. [DOI] [PubMed] [Google Scholar]
- 23.Edin BB, Abbs JH. Finger movement responses of cutaneous mechanoreceptors in the dorsal skin of human hand. J Neurophysiol. 1991;65:657–670. doi: 10.1152/jn.1991.65.3.657. [DOI] [PubMed] [Google Scholar]
- 24.Edin BB, Johansson N. Skin strain patterns provide kinaesthetic information to the human central nervous system. J Physiol (Lond) 1995;487:243–251. doi: 10.1113/jphysiol.1995.sp020875. [DOI] [PMC free article] [PubMed] [Google Scholar]
- 25.Edin BB, Vallbo ÅB. Strech sensitization of human muscle spindles. J Physiol (Lond) 1988;400:101–111. doi: 10.1113/jphysiol.1988.sp017113. [DOI] [PMC free article] [PubMed] [Google Scholar]
- 26.Edin BB, Vallbo ÅB. Dynamic response of human muscle spindle afferents to strech. J Neurophysiol. 1990;63:1297–1306. doi: 10.1152/jn.1990.63.6.1297. [DOI] [PubMed] [Google Scholar]
- 27.Eklund G. Position sense and state of contraction: the effects of vibration. J Neurol Neurosurg Psychiatry. 1972;35:606–611. [Google Scholar]
- 28.Eklund G, Hagbarth KE. Normal variability of tonic vibration reflexes in man. Exp Neurol. 1966;16:80–92. doi: 10.1016/0014-4886(66)90088-4. [DOI] [PubMed] [Google Scholar]
- 29.Fetz EE, Finocchio DV, Baker MA, Soso MJ. Sensory and motor responses of precentral cortex cells during comparable passive and active joint movements. J Neurophysiol. 1980;43:1070–1089. doi: 10.1152/jn.1980.43.4.1070. [DOI] [PubMed] [Google Scholar]
- 30.Fox PT, Burton H, Raichle ME. Mapping human somatosensory cortex with positron emission tomography. J Neurosurg. 1987;67:34–43. doi: 10.3171/jns.1987.67.1.0034. [DOI] [PubMed] [Google Scholar]
- 31.Frederick WJC, Schwartz MP, Smit GP. Proprioceptive guidance of human voluntary wrist movements studied using muscle vibration. J Physiol (Lond) 1990;427:455–470. doi: 10.1113/jphysiol.1990.sp018181. [DOI] [PMC free article] [PubMed] [Google Scholar]
- 32.Fried I, Katz A, McCarthy G, Sass KJ, Williamson P, Spencer SS, Spencer DD. Functional organization of human supplementary motor cortex studied by electrical stimulation. J Neurosci. 1991;11:3656–3666. doi: 10.1523/JNEUROSCI.11-11-03656.1991. [DOI] [PMC free article] [PubMed] [Google Scholar]
- 33.Garraghty PE, Florence SL, Kaas JH. Ablations of areas 3a and 3b of monkey somatosensory cortex abolish cutaneous responsivity in area 1. Brain Res. 1990;528:165–169. doi: 10.1016/0006-8993(90)90213-u. [DOI] [PubMed] [Google Scholar]
- 34.Geyer S, Ledberg A, Schleicher A, Kinomura S, Schomann T, Bürgel U, Klingberg T, Larsson J, Zilles K, Roland PE. Two different areas within the primary motor cortex of man. Nature. 1996;382:805–807. doi: 10.1038/382805a0. [DOI] [PubMed] [Google Scholar]
- 35.Ghosh S, Brinkman C, Porter RA. A quantitative study of the distribution of neurons projecting to the precentral motor cortex in the monkey (M. fascicularis). J Comp Neurol. 1987;259:424–444. doi: 10.1002/cne.902590309. [DOI] [PubMed] [Google Scholar]
- 36.Goodwin GM, McCloskey DI, Matthews PBC. The contribution of muscle afferents to kinesthesia shown by vibration induced illusions of movement and by the effects of paralysing joint afferents. Brain. 1972a;95:705–748. doi: 10.1093/brain/95.4.705. [DOI] [PubMed] [Google Scholar]
- 37.Goodwin GM, McCloskey DI, Matthews PBC. Proprioceptive illusions induced by muscle vibration: Contribution by muscle spindles to perception? Science. 1972b;175:1382–1384. doi: 10.1126/science.175.4028.1382. [DOI] [PubMed] [Google Scholar]
- 38.Greenan TJ, Strick PL. Do thalamic regions which project to rostral primate motor cortex receive spinothalamic input? Brain Res. 1986;362:384–388. doi: 10.1016/0006-8993(86)90469-5. [DOI] [PubMed] [Google Scholar]
- 39.Hadjikhani N, Roland PE. Cross-modal transfer of information between the tactile and the visual representations in the human brain: a positron emission tomographic study. J Neurosci. 1998;18:1072–1084. doi: 10.1523/JNEUROSCI.18-03-01072.1998. [DOI] [PMC free article] [PubMed] [Google Scholar]
- 40.Holsapple JW, Preston JB, Strick PL. The origin of thalamic inputs to the “hand” representation in the primary motor cortex. J Neurosci. 1991;11:2644–2654. doi: 10.1523/JNEUROSCI.11-09-02644.1991. [DOI] [PMC free article] [PubMed] [Google Scholar]
- 41.Hore J, Preston JB, Durkovic RG, Cheney PD. Responses of cortical neurons (area 3a and 4) to ramp stretch of hindlimb muscles in the baboon. J Neurophysiol. 1976;39:484–500. doi: 10.1152/jn.1976.39.3.484. [DOI] [PubMed] [Google Scholar]
- 42.Horne MK, Tracey DJ. The afferents and projections of the ventroposterolateral thalamus in the monkey. Exp Brain Res. 1979;36:129–141. doi: 10.1007/BF00238473. [DOI] [PubMed] [Google Scholar]
- 43.Huerta MF, Pons TP. Primary motor cortex receives input from area 3a in macaque. Brain Res. 1990;537:367–371. doi: 10.1016/0006-8993(90)90388-r. [DOI] [PubMed] [Google Scholar]
- 44.Hummelsheim H, Bianchetti M, Wiesendanger M, Wiesendanger R. Sensory inputs to agranular motor fields: a comparison between precentral, supplementary-motor and premotor areas in the monkey. Exp Brain Res. 1988;69:289–298. doi: 10.1007/BF00247574. [DOI] [PubMed] [Google Scholar]
- 45.Iwamura Y, Tanaka M, Sakamoto M, Hikosaka O. Functional subdivisions representing different finger regions in area 3 of the first somatosensory cortex of the conscious monkey. Exp Brain Res. 1983;51:315–326. [Google Scholar]
- 46.Iwamura Y, Tanaka M, Sakamoto M, Hikosaka O. Rostrocaudal gradients in the neuronal receptive field complexity in the finger region of the alert monkey’s postcentral gyrus. Exp Brain Res. 1993;92:360–368. doi: 10.1007/BF00229023. [DOI] [PubMed] [Google Scholar]
- 47.Johansson RS, Landström U, Lundström R. Responses of mechanoreceptive afferent units in the glabrous skin of the human hand to sinusoidal skin displacement. Brain Res. 1982;244:17–25. doi: 10.1016/0006-8993(82)90899-x. [DOI] [PubMed] [Google Scholar]
- 48.Jones EG, Friedman DP. Projection pattern of functional components of thalamic ventrobasal complex on monkey somatosensory cortex. J Neurophysiol. 1982;48:521–544. doi: 10.1152/jn.1982.48.2.521. [DOI] [PubMed] [Google Scholar]
- 49.Jones EG, Porter R. What is area 3a? Brain Res Rev. 1980;2:1–43. doi: 10.1016/0165-0173(80)90002-8. [DOI] [PubMed] [Google Scholar]
- 50.Landgren S, Silfvenius H. Projection to cerebral cortex of group I muscle afferents from the cat’s hind limb. J Physiol (Lond) 1969;200:353–372. doi: 10.1113/jphysiol.1969.sp008698. [DOI] [PMC free article] [PubMed] [Google Scholar]
- 51.Landgren S, Silfvenius H. Nucleus Z, the medullary relay in the projection path to the cerebral cortex of group I muscle afferents from the cat’s hind limb. J Physiol (Lond) 1971;218:551–571. doi: 10.1113/jphysiol.1971.sp009633. [DOI] [PMC free article] [PubMed] [Google Scholar]
- 52.Landgren S, Silfvenius H, Wolsk D. Somato-sensory paths to the second cortical projection area of the group I muscle afferents. J Physiol (Lond) 1967;191:543–559. doi: 10.1113/jphysiol.1967.sp008267. [DOI] [PMC free article] [PubMed] [Google Scholar]
- 53.Lebedev MA, Nelson RJ. High-frequency vibratory sensitive neurons in monkey primary somatosensory cortex: entrained and nonentrained responses to vibration during the performance of vibratory-cued hand movement. Exp Brain Res. 1996;111:313–325. doi: 10.1007/BF00228721. [DOI] [PubMed] [Google Scholar]
- 54.Ledberg A, Åkerman S, Roland PE. Estimation of the probabilities of 3D clusters in functional brain images. NeuroImage. 1998;8:113–128. doi: 10.1006/nimg.1998.0336. [DOI] [PubMed] [Google Scholar]
- 55.Lemon RN. Functional properties of monkey motor cortex neurones receiving afferent input from the hand and fingers. J Physiol (Lond) 1981a;311:497–519. doi: 10.1113/jphysiol.1981.sp013601. [DOI] [PMC free article] [PubMed] [Google Scholar]
- 56.Lemon RN. Variety of functional organization within the monkey motor cortex. J Physiol (Lond) 1981b;311:521–540. doi: 10.1113/jphysiol.1981.sp013602. [DOI] [PMC free article] [PubMed] [Google Scholar]
- 57.Lemon RN, Porter R. Afferent input to movement-related precentral neurones in conscious monkeys. Proc R Soc Lond B Biol Sci. 1976;194:313–339. doi: 10.1098/rspb.1976.0082. [DOI] [PubMed] [Google Scholar]
- 58.Lemon RN, Van Der Burg J. Short-latency peripheral inputs to thalamic neurons projecting the motor cortex in the monkey. Exp Brain Res. 1979;36:445–462. doi: 10.1007/BF00238515. [DOI] [PubMed] [Google Scholar]
- 59.Lemon RN, Hanby JA, Porter R. Relationship between the activity of precentral neurones during active and passive movements in conscious monkeys. Proc R Soc Lond B Biol Sci. 1976;194:341–373. doi: 10.1098/rspb.1976.0083. [DOI] [PubMed] [Google Scholar]
- 60.Lim SH, Dinner DS, Pillay PK, Lüders H, Morris HH, Klem G, Wyllie E, Awad IA. Functional anatomy of the human supplementary sensorimotor area: results of extraoperative electrical stimulation. Electroencepharogr Clin Neurophysiol. 1994;91:179–193. doi: 10.1016/0013-4694(94)90068-x. [DOI] [PubMed] [Google Scholar]
- 61.Macefield G, Gandevia SC, Burke D. Perceptual responses to microstimulation of single afferents innervating joints, muscles and skin of the human hand. J Physiol (Lond) 1990;429:113–129. doi: 10.1113/jphysiol.1990.sp018247. [DOI] [PMC free article] [PubMed] [Google Scholar]
- 62.Maendly R, Ruegg DG, Wiesendanger M, Wiesendanger R, Lagowska J, Hess B. Thalamic relay for group I muscle afferents of forelimb nerves in the monkey. J Neurophysiol. 1981;46:901–917. doi: 10.1152/jn.1981.46.5.901. [DOI] [PubMed] [Google Scholar]
- 63.Meyer E. Simultaneous correction for tracer arrival delay and dispersion in CBF. Measurements by the H215O autoradiographic method and dynamic PET. J Nucl Med. 1989;30:1069–1078. [PubMed] [Google Scholar]
- 64.Phillips CG, Powell TPS, Wiesendanger M. Projection from low threshold muscle afferents of hand and forearm to area 3a of baboon’s cortex. J Physiol (Lond) 1971;217:419–446. doi: 10.1113/jphysiol.1971.sp009579. [DOI] [PMC free article] [PubMed] [Google Scholar]
- 65.Picard N, Smith AM. Primary motor cortical responses to perturbations of prehension in the monkey. J Neurophysiol. 1992;68:1882–1894. doi: 10.1152/jn.1992.68.5.1882. [DOI] [PubMed] [Google Scholar]
- 66.Pons TP, Garraghty PE, Mishkin M. Serial and parallel processing of tactual information in somatosensory cortex of rhesus monkey. J Neurophysiol. 1992;68:518–527. doi: 10.1152/jn.1992.68.2.518. [DOI] [PubMed] [Google Scholar]
- 67.Rasmusson DD, Dykes RW, Hoeltzell PB. Segregation of modality and submodality information in SI cortex of cat. Brain Res. 1979;166:409–412. doi: 10.1016/0006-8993(79)90229-4. [DOI] [PubMed] [Google Scholar]
- 68.Recanzone GH, Merzenich MM, Jenkins WM, Grajski KA, Dinse HR. Topographic reorganization of the hand representation in cortical area 3b of owl monkeys trained in a frequency-discrimination task. J Neurophysiol. 1992;67:1031–1056. doi: 10.1152/jn.1992.67.5.1031. [DOI] [PubMed] [Google Scholar]
- 69.Ribot-Ciscar E, Roll JP. Ago-antagonist muscle spindle inputs contribute together to joint movement coding in man. Brain Res. 1998;791:167–176. doi: 10.1016/s0006-8993(98)00092-4. [DOI] [PubMed] [Google Scholar]
- 70.Rogers DK, Bendrups AP, Lewis MM. Disturbed proprioception following a period of muscle vibration in humans. Neurosci Lett. 1985;57:147–152. doi: 10.1016/0304-3940(85)90054-0. [DOI] [PubMed] [Google Scholar]
- 71.Roland PE, Zilles K. Functions and structures of the motor cortices in humans. Curr Opin Neurobiol. 1996;6:773–781. doi: 10.1016/s0959-4388(96)80027-4. [DOI] [PubMed] [Google Scholar]
- 72.Roland PE, Zilles K. Structural divisions and functional fields in the human cerebral cortex. Brain Res Rev. 1998;26:87–105. doi: 10.1016/s0165-0173(97)00058-1. [DOI] [PubMed] [Google Scholar]
- 73.Roland PE, Graufeld CJ, Wåhlin J, Ingelman L, Andersson M, Ledberg A, Pedersen J, Åkerman S, Dabringhaus A, Zilles K. Human Brain Atlas: for high-resolution functional and anatomical mapping. Hum Brain Mapp. 1994;1:173–184. doi: 10.1002/hbm.460010303. [DOI] [PubMed] [Google Scholar]
- 74.Roland PE, Geyer S, Amunts K, Schormann T, Schleicher A, Malikovic A, Zilles K. Cytoarchitectural maps of the human brain in standard anatomical space. Hum Brain Mapp. 1997;5:222–227. doi: 10.1002/(SICI)1097-0193(1997)5:4<222::AID-HBM3>3.0.CO;2-5. [DOI] [PubMed] [Google Scholar]
- 75.Roll JP, Vedel JP. Kinaesthetic role of muscle afferent in man, Studied by tendon vibration and microneurography. Exp Brain Res. 1982;47:177–190. doi: 10.1007/BF00239377. [DOI] [PubMed] [Google Scholar]
- 76.Romo R, Hernandez A, Zainos A, Salinas E. Somatosensory discrimination based on cortical microstimulation. Nature. 1998;392:387–390. doi: 10.1038/32891. [DOI] [PubMed] [Google Scholar]
- 77.Rosén I, Asanuma H. Peripheral afferent inputs to the forelimb area of the monkey motor cortex: Input-output relations. Exp Brain Res. 1972;14:257–273. doi: 10.1007/BF00816162. [DOI] [PubMed] [Google Scholar]
- 78.Schell GR, Strick PL. The origin of thalamic inputs to the arcuate premotor and supplementary motor areas. J Neurosci. 1984;4:539–560. doi: 10.1523/JNEUROSCI.04-02-00539.1984. [DOI] [PMC free article] [PubMed] [Google Scholar]
- 79.Schleicher A, Amunts K, Geyer S, Morosan P, Zilles K. Observer-independent method for microstructure parcellation of cerebral cortex: a quantitative approach to cytoarchitectonics. NeuroImage. 1999;9:165–177. doi: 10.1006/nimg.1998.0385. [DOI] [PubMed] [Google Scholar]
- 80.Seitz RJ, Roland PE. Vibratory stimulation increases and decreases the regional cerebral blood flow and oxidative metabolism: a positron emission tomography (PET) study. Acta Neurol Scand. 1992;86:60–67. doi: 10.1111/j.1600-0404.1992.tb08055.x. [DOI] [PubMed] [Google Scholar]
- 81.Stepniewska I, Preuss TM, Kaas JH. Architectonics, somatotopic organization, and ipsilateral cortical connections of the primary motor area (M1) of owl monkeys. J Comp Neurol. 1993;330:238–271. doi: 10.1002/cne.903300207. [DOI] [PubMed] [Google Scholar]
- 82.Strick PL, Preston JB. Two representations of the hand in area 4 of a primate. II. Somatosensory input organisation. J Neurophysiol. 1982;48:150–159. doi: 10.1152/jn.1982.48.1.150. [DOI] [PubMed] [Google Scholar]
- 83.Tanji J, Wise SP. Submodality distribution in sensori-motor cortex of the unanesthetized monkey. J Neurophysiol. 1981;45:467–481. doi: 10.1152/jn.1981.45.3.467. [DOI] [PubMed] [Google Scholar]
- 84.Tardy-gervet MF, Gilhodes JC, Roll JP. Interaction between visual and muscular information in illusions of limb movement. Behav Brain Res. 1986;20:161–174. doi: 10.1016/0166-4328(86)90001-x. [DOI] [PubMed] [Google Scholar]
- 85.Tootell RBH, Reppas JB, Dale AM, Look RB, Sereno MI, Malach R, Brady TJ, Rosen BR. Visual motion aftereffect in human cortical area MT revealed by functional magnetic resonance imaging. Nature. 1995;375:139–141. doi: 10.1038/375139a0. [DOI] [PubMed] [Google Scholar]
- 86.Vallbo ÅB. Afferent discharge from human muscle spindles in non-contracting muscle. Steady state impulse frequency as function of joint angle. Acta Physiol Scand. 1974;90:303–318. doi: 10.1111/j.1748-1716.1974.tb05593.x. [DOI] [PubMed] [Google Scholar]
- 87.Vallbo ÅB, Olausson H, Wessberg J, Kakuda N. Receptive field characteristics of tactile units with myelinated afferents in hairy skin of human subjects. J Physiol (Lond) 1995;483:783–795. doi: 10.1113/jphysiol.1995.sp020622. [DOI] [PMC free article] [PubMed] [Google Scholar]
- 88.Weiller C, Juptner M, Fellows S, Rijntjes M, Leonhardt G, Kiebel S, Muller S, Diener HC, Thilmann AF. Brain representation of active and passive movements. NeuroImage. 1996;4:105–110. doi: 10.1006/nimg.1996.0034. [DOI] [PubMed] [Google Scholar]
- 89.Wiesendanger M. Recent developments in studies of the supplementary motor area of primates. Rev Physiol Biochem Pharmacol. 1986;103:1–59. doi: 10.1007/3540153330_1. [DOI] [PubMed] [Google Scholar]
- 90.Wiesendanger M, Hummlesheim H, Bianchetti M. Sensory input to the motor fields of the agranular frontal cortex: a comparison of the precentral, supplementary motor and premotor cortex. Behav Brain Res. 1985;18:89–94. doi: 10.1016/0166-4328(85)90065-8. [DOI] [PubMed] [Google Scholar]
- 91.Widener GL, Cheney PD. Effects on muscle activity from microstimuli applied to somatosensory and motor cortex during voluntary movement in the monkey. J Neurophysiol. 1997;77:2446–2465. doi: 10.1152/jn.1997.77.5.2446. [DOI] [PubMed] [Google Scholar]
- 92.Wise SP, Tanji J. Supplementary and precentral motor cortex: Contrast in responsiveness to peripheral input in the hindlimb area of the unanesthetized monkey. J Comp Neurol. 1981;195:433–451. doi: 10.1002/cne.901950305. [DOI] [PubMed] [Google Scholar]
- 93.Wong YC, Kwan HC, MacKay WA, Murphy JT. Spatial organization of precentral cortex in awake primates. I. Somatosensory inputs. J Neurophysiol. 1978;41:1107–1119. doi: 10.1152/jn.1978.41.5.1107. [DOI] [PubMed] [Google Scholar]
- 94.Woods RP, Cherry SR, Mazziotta JC. Rapid automated algorithm for aligning and reslicing PET images. J Comput Assist Tomogr. 1992;16:620–633. doi: 10.1097/00004728-199207000-00024. [DOI] [PubMed] [Google Scholar]
- 95.Zeki S, Watson JD, Frackowiak RS. Going beyond the information given: the relation of illusory visual motion to brain activity. Proc R Soc Lond B Biol Sci. 1993;252:215–222. doi: 10.1098/rspb.1993.0068. [DOI] [PubMed] [Google Scholar]