

Abstract
Human malignant gliomas are highly invasive tumors. Mechanisms that allow glioma cells to disseminate, migrating through the narrow extracellular brain spaces are poorly understood. We recently demonstrated expression of large voltage-dependent chloride (Cl−) currents, selectively expressed by human glioma cells in vitro and in situ(Ullrich et al., 1998). Currents are sensitive to several Cl− channel blockers, including chlorotoxin (Ctx), (Ullrich and Sontheimer, 1996; Ullrich et al., 1996), tetraethylammonium chloride (TEA), and tamoxifen (Ransom and Sontheimer, 1998). Using Transwell migration assays, we show that blockade of glioma Cl− channels specifically inhibits tumor cell migration in a dose-dependent manner. Ctx (5 μm), tamoxifen (10 μm), and TEA (1 mm) also prevented invasion of human glioma cells into fetal rat brain aggregates, used as an in vitro model to assess tumor invasiveness. Anion replacement studies suggest that permeation of chloride ions through glioma chloride channel is obligatory for cell migration. Osmotically induced cell swelling and subsequent regulatory volume decrease (RVD) in cultured glioma cells were reversibly prevented by 1 mm TEA, 10 μmtamoxifen, and irreversibly blocked by 5 μm Ctx added to the hypotonic media. Cl− fluxes associated with adaptive shape changes elicited by cell swelling and RVD in glioma cells were inhibited by 5 μm Ctx, 10 μmtamoxifen, and 1 mm TEA, as determined using the Cl−-sensitive fluorescent dye 6-methoxy-N-ethylquinolinium iodide. Collectively, these data suggest that chloride channels in glioma cells may enable tumor invasiveness, presumably by facilitating cell shape and cell volume changes that are more conducive to migration and invasion.
Keywords: chlorotoxin, glioma invasiveness, chloride channel, RVD, MEQ, cell migration
A major biological feature of primary brain tumors, which precludes successful therapy, is their ability to invade the surrounding healthy brain tissue (Merzak and Pilkington, 1997). Highly invasive glioma cells are thought to transiently arrest from the cell cycle during migratory phases and thus become largely refractory to the various chemotherapy and radiotherapy regimens currently available. Once these migratory cells have traveled a certain distance from the primary tumor mass, they re-enter cell cycle and form recurrent tumors, both adjacent and distant from the primary neoplasm (Merzak and Pilkington, 1997). Tumor invasion is a multistep process that includes adhesion of tumor cells to extracellular matrix (ECM) components, ECM remodeling by proteolytic enzymes, and cellular mechanisms to generate locomotion and advance through narrow spaces (Giese et al., 1994; Suigiura et al., 1998). Thus, migration under spatial constraints requires that glioma cells undergo major cytoskeletal rearrangements to support shape and volume changes.
Essentially all cells regulate their cell volume. Multiple mechanisms are engaged during cellular volume regulation, including transport across cell membrane of Cl− ions, organic metabolites, and osmolytes. For example, activation of outwardly rectifying chloride currents is involved in volume regulation of secretory epithelial cells (Monaghan et al., 1997). Several of the cloned chloride channels comprising the CLC family, most notably CLC-2 and CLC-3, are swelling-activated channels, ubiquitously expressed (Jentsch and Gunther, 1997). We recently identified and characterized a chloride ion channel that is abundantly expressed in glioma cell lines (Ullrich et al., 1996) and acute patient biopsies (Ullrich et al., 1998). Cl− currents recorded in human gliomas showed voltage dependence and were sensitive to bath application of 1 μm chlorotoxin, a Cl− channel-specific peptide purified fromLeiurus quinquestriatus scorpion venom (DeBin et al., 1993). Currents were inhibited by TEA (1 mm), which has also been shown to inhibit muscle Cl− channels (Sanchez and Blatz, 1995). Chlorotoxin-sensitive Cl− currents are absent in normal astrocytes (Ullrich et al., 1996). However, astrocytes do express other Cl− channels that contribute to the regulatory volume decrease (RVD) after hypotonic cell swelling (Pasantes-Morales et al., 1994). Because the activity of the glioma, voltage-activated, current could be modulated by perturbations of the cell cytoskeleton (Ullrich and Sontheimer, 1997), we set out to investigate whether the glioma-specific Cl−channels may be involved in regulating cell volume.
We hypothesized that cell shrinkage is a requirement for successful tumor cell invasion through narrow extracellular spaces in the brain (20 nm). We show that inhibitors of glioma Cl−channels, including Ctx, TEA, and tamoxifen are also effective inhibitors of in vitro tumor cell migration and invasion. Moreover, using Cl−-sensitive fluorescent dyes, we show that Cl− fluxes associated with glioma cell volume changes are also modulated by Ctx, tamoxifen, and TEA. We propose that the upregulation of glioma Cl−channels may be a positive adaptation that facilitates cell shape and volume changes, thereby promoting tumor invasion.
MATERIALS AND METHODS
Cell culture
We have used the following glioma cell lines: U251MG and D54MG, from D. D. Bigner (Duke University, Durham, NC). In addition, we used SKMEL5 melanoma cell line, Balb3T3 fibroblasts from the American Tissue Culture Collection and primary cultured rat astrocytes as control glial cells. Primary culture of rat astrocytes has been described in detail elsewhere (Macfarlane and Sontheimer, 1997). Glioma cells were maintained in DMEM supplemented withl-glutamine (2 mm) (Life Technologies, Grand Island, NY) and 10% fetal bovine serum (FBS) (Life Technologies). Cells were harvested from logarithmic phase growth cultures by brief exposure to 0.5% trypsin and 0.53 mmEDTA or 0.2 m EDTA in PBS for invasion assays (see below). Cell lines tested negative for mycoplasma by PCR (Stratagene, La Jolla, CA).
Normal rat brain aggregates
Fetal brain aggregates were obtained from 18-d-old fetuses of Sprague Dawley rats as previously described (Penar et al., 1998). Brains were dissected out under aseptic conditions, the meninges were removed, and tissue was placed at 37°C, on a rotator, in oxygenated enzyme solution: 20 U/ml papain and (in mm): NaCl 137, KCl 5.3, Mg Cl2 1, glucose 25, HEPES 10, and CaCl2 3, supplemented with 0.5 mm EDTA and 0.2 mg/ml l-cysteine. Tissues were then pelleted and triturated using a fire-polished Pasteur pipette in astrocyte growth medium. Brain aggregates were produced by seeding 6 × 10⁶cells in minimum essential media (MEM; Life Technologies) and 10% FBS in 24 well plates (Fisher Scientific, Houston, TX) base-coated with 1% medium agar substrate. After 20 d in tissue culture, a three-layered structure was visible, and the cellular differentiation was complete: astrocytes, oligodendrocytes, and neurons could be identified. Mature aggregates were individually transferred to the plates used for confrontation assays.
Human glioma spheroids
Brain tumor spheroids were obtained as described elsewhere (Bjerkvig et al., 1990; Nygaard et al., 1998). Human glioma cell lines U251MG, D54MGLacZ, and acutely dissociated glioblastoma tissue obtained after surgical resection from the University of Alabama at Birmingham (UAB) Department of Neurosurgery, were plated on nonadhesive 0.75% Noble agar-coated 24 multiwell plates (Fisher Scientific) in DMEM-based growth medium. After 2 weeks in culture (37°C; 95% O2 and 5% CO2), tumor spheroids were formed.
Fluorescent dye labeling
For labeling of tumor spheroids and rat brain aggregates, we used the carbocyanine fluorescent dyes 1,1′-dioctadecyl-3,3,3,3′-tetramethylindocarbocyanine (DiI) and 3,3′-dioctadecycloxacarbocyanine perchlorate (DiO) (Molecular Probes, Eugene, OR), which have maximum absorption at 546 and 489 nm and maximum emission at 563 and 499 nm, respectively. The difference in fluorescence emissions allows for good separation of the dyes by use of specific fluorescence filter optics. For cell labeling, we followed the protocol by Nygaard et al. (1998) and the recommendations from the manufacturer. A final concentration of 5 μm for DiI and 10 μm for DiO were obtained by diluting the stock (2.5 mg/ml) in the DMEM-based growth media. The loading solution was sterile filtered through a 5 μm pore; 48 hr before the coculture began, equally sized tumor spheroids and fetal rat brain aggregates were incubated for 48 hr in media containing either DiO or DiI, respectively.
Coculture and video time-lapse microscopy
Glioma spheroids (200–300 μm) were transferred under a low magnification microscope using a sterile Pasteur pipette to 96 multiwell plates (Nunc, Roskilde, Denmark) and 35 mm glass bottom culture dishes (from the MatTek Corporation, Ashland, MA). Rat brain aggregates of similar size were chosen and individually placed in the vicinity of the tumor spheroids. Astrocyte growth media with or without Ctx (5 μm), TEA (1 μm), and tamoxifen (10 μm) was added to the cocultures. After 24 hr from the initiation of the coculture, the interaction was monitored by means of fluorescence time-lapse video microscopy. After overnight incubation at 37°C and 5% CO2 and 95% O2, slips were placed on the bottom of LU-CB-1 tissue culture chamber equipped with an NP-2 incubator that maintained temperature at 37°C and atmosphere at 95% O2 and 5% CO2. Cells were visualized by a Nikon Diaphot inverted microscope with phase contrast optics at 40× magnification. Images were recorded on a time-lapse VHS video recorder/player for 24–120 hr. The time-lapse microscope is also equipped with a mercury fluorescence lamp connected to a Lambda 10–2 filter wheel which controls excitation wavelength; a second intensifying CCD camera was used to capture images on a computer using Axon Imaging Workbench (version 2.1, 1997; Axon Instruments, Foster City, CA) software. In this manner simultaneous phase and fluorescent recordings were obtained. At the end of the recording period selected coverslips were further processed for fluorescence microscopy or transmission electron microscopy as explained bellow.
For time-lapse scrape migration assays U251MG cells were plated on coverslips as described, mechanically scarred and placed in the time lapse recording chamber. This technique has been described in detail elsewhere (MacFarlane and Sontheimer, 1997).
Immunohistochemistry
Processing and staining of the human brain sections for glial fibrillary acidic protein (GFAP) was done using a monoclonal antibody from Zymed Laboratories (San Francisco, CA), as previously described. Staining for Ki-67 antigen was done using the MIB1 antibody available from Dako (Carpinteria, CA), as described (Shiraishi, 1990; Cavalla and Schiffer, 1997). Slides were processed using a secondary biotinylated anti-mouse antibody and developed using an avidin–biotin kit (Elite; Vector Laboratories, Burlingame, CA) in conjunction with horseradish peroxidase. Counting of positive cells for 10 microscopic fields for each case was done independently by two researchers, and tissues were scored on a scale from negative to highly positive (+++).
Transmission electron microscopy
Cocultures of glioma spheroids and fetal brain aggregates were prepared for electron microscopy as previously described (Bernstein et al., 1990; Reuver and Garner, 1998). Thin sections (0.75 μm) were stained with toluidine blue (1%) and examined by light microscopy. Samples were processed for transmission electron microscopy according to the standard procedures (Weber et al., 1994). Ultra-thin sections (80 nm) were cut on a Ultracut-S ultramicrotome; grids were stained with lead citrate and uranyl acetate and examined on a JEOL 100CX electron microscope equipped with a camera used to obtain photomicrographs.
Invasion assay in brain slices
To be able to quantify the extent to which ion channel blockers prevent deep invasion of human glioma cells into the normal brain tissue, we used a brain slice invasion assay adapted after Ohnishi et al. (1998). An organotypic culture method previously used was modified as follows: brain slices were prepared from 2-d-old neonatal Sprague Dawley rats. Whole brains were quickly removed and placed in complete saline solution (Manning and Sontheimer, 1997), continuously bubbled with O2 and maintained at <4°C. The brain was mounted on the stage of a Vibratome (series 1000; Technical Products International, St. Louis, MO), and 300 μm coronal sections were cut. The tissue was maintained cold and well oxygenated at all times. Sections were collected and transferred onto a cell culture insert, 8 μm pore track-etched membrane, fit for six well plates (Becton Dickinson, Franklin Lakes, NJ) that had been coated with human vitronectin (10 μg/ml, 24 hr, at 37°C), and maintained moist by adding 1 ml of PBS in each well. After brain slices were placed on the membranes, PBS was aspirated and replaced with MEM. Brain slice cultures were incubated at 37°C under standard conditions (95% O2 and 5% CO2). Viability of slices was monitored for 14 d in culture using the vital dye Trypan blue and propidium iodide staining. After 5 d from initiating the brain slice culture, DiO-labeled glioma cells were added to the cultured normal brain, in the presence or absence of Ctx (5 μm), tamoxifen (10 μm), or TEA (1 mm). DiO-labeled human glioma cells were obtained as described for the confrontation assay. Semiconfluent glioma cells were harvested with 10% Trypsin–EDTA in PBS, and were resuspended at 1 × 10⁸ cells/ml in migration assay media (see below). Ten microliters of the labeled cells were placed on the surface of brain slices cultured on Transwell filter chambers as described. Drugs were added to the lower chamber to the same final concentration as in the cell suspension. For control experiments, either PBS or vehicle (DMSO) were used. Cocultures were inspected for 4–6 d every 12 hr by epifluorescence microscopy with a Nikon Diaphot 200 microscope equipped with a Nikon FM-2 camera or time-lapse fluorescence video microscopy (490 nm excitation and 535 nm mission filters) concomitant with phase-contrast microscopy as described for the confrontation assays. DiO-labeled tumor cells were visible both on the surface of the normal brain tissue, as well as on the bottom of the filter chamber (cells that invaded deeply through the slice). At 96 hr from the beginning of the coculture, the brain slices and any cells on the inside of the chamber were cleaned using a cotton swab. Filters were then cut, placed with the bottom side up on a glass slide, and viewed under a fluorescence microscope (Leica DMRB, Heerbrugg, Switzerland); images were captured on a computer using a 3-CCD camera, and the labeled glioma cells were counted over the entire filter area. Experiments were repeated three times for each pharmacological condition.
Transwell cell migration assays
We used 5–8 μm polycarbonate Transwell filter chambers (Costar Corporation, Cambridge, MA) coated on the lower surface with 200 μl of Vitronectin (Life Technologies) (10 μg/ml in PBS) or bovine serum albumin (BSA), 1% in PBS, and incubated at 37°C overnight. Filters were washed twice with PBS, blocked for 1 hr with 1% BSA in PBS, washed and kept moist in 200 μl of migration assay buffer (serum-free DMEM, with 1.5 l-glutamine, 0.1% BSA). Recently subcultured, semiconfluent U251MG cells were harvested with buffered EDTA (1.5 mm), washed with PBS, and resuspended in migration assay buffer at 400,000 cells/ml. Cell aliquots of 100 μl were plated on the upper filter surface. Ctx, TEA, and tamoxifen were added to the same final concentration to both upper (with cells) and lower chambers and filters were returned to 37°C and 95% O2 and 5% CO2 for 3–6 hr for glioma cell lines and overnight in the case of melanoma cells and rat astrocytes. Filters were then washed, and cells on the upper surface were removed using cotton swabs. Cells on the lower filter surface were fixed in 4% paraformaldehyde (5 min) and stained with 1% crystal violet in 0.2m sodium borate buffer, pH 9. Ten random 1 mm2 fields were counted to determine the number of cells that migrated and compared with untreated controls. For ion replacement experiments, solutions were made in migration assay media based on DMEM without NaCl (Life Technologies). Osmolality of the final solution was adjusted using mannitol to 308–312 mOsm/kg after addition of replacement ionic salts (sodium glutamate, sodium bromide). Experiments were repeated three times for each filter size (5 and 8 μm) and each of the ion substitution conditions.
Volume measurements
Preparation and loading of the dye. Fura-2 AM (Teflabs, Austin, TX) was added (5 μm) to U251MG cells plated on coverslips and incubated in the dark in an atmosphere of 95% O2 and 5% CO2 for 40 min. Cells were then rinsed with fresh saline, and the dye was allowed to de-esterify for 15 min before experiments. Coverslips with dye-loaded cells were placed in a Series 20 Micro-perfusion chamber (Warner Instruments, Hamden, CT) on the stage of a Nikon Diaphot 200 inverted epifluorescence microscope and visualized using a 40× oil immersion objective. Cells were kept under constant perfusion, and all solutions were maintained at 37°C with a TC-344 Dual Heater Controller and an SH-27A in-line heater (Warner Instruments, Hamden, CT). Changes between perfusion solutions were made using a Multi Channel Valve Driver II (General Valve Corporation, Fairfield, NJ). For some experiments, solutions were changed using an eight barrel fast application microperfusion system.
Volume measurements were obtained by means of microspectrofluorimetry that allows simultaneous monitoring of changes in cell water volume and [Ca2+ ]i in cells loaded with fura-2 AM. When excited at 357 nm (isosbestic point), the fluorescence intensity of fura-2 AM is insensitive to changes in [Ca2+ ]i, and thus is directly proportional with the dye concentration and the intracellular volume. For simultaneous [Cai]2+ measurements, the dye was alternately excited at 340 and 380 nm with a single wavelength monochrometer (Photon Technologies International, South Brunswick, NJ), and images were obtained every 10 sec. The emitted fluorescence above 520 nm was captured by an intensified CCD camera (Hamamatsu, Tokyo, Japan) then digitized and saved on a computer for later off-line analysis using ImageMaster software (Photon Technology International, South Brunswick, NJ). The ratio of the two images 340:380 was calculated and converted to absolute [Ca2+]i concentrations, as previously described (Manning and Sontheimer, 1997). U251MG cells were perfused with saline solution consisting of (in mm): NaCl, 122.6; KCl, 5.0; MgCl2, 1.2; CaCl2, 2.0; Na2HPO4, 1.6; NaH2PO4, 0.4; glucose, 10.5; HEPES 5.0; NaHCO3, 25.0; and Na2SO4, 1.2, pH 7.4. For osmotic challenges, this solution was modified by removing 50 mmNaCl in the case of hypo-osmotic solution (200 mOsm/kg) and adding back mannitol for the isotonic (308 mOsm/kg) solution. In this manner, solutions were maintained isoionic. Drugs were added to the isotonic and hypotonic solutions to final concentrations of: 5 μmCtx, 10 μm tamoxifen, and 1 mm TEA. Experiments were repeated three times for each condition, and recordings from 50 cells/coverslip were averaged.
Chloride flux measurements using the fluorescent dye 6-methoxy-N-ethylquinolinium iodide
The chloride-sensitive dye 6-methoxy-N-ethylquinolinium iodide (MEQ) was prepared as recommended by the manufacturer (Molecular Probes, Eugene, OR) and modified from the protocol by Biwerski and Verkman (1991). Briefly, 16 μm MEQ was reduced by adding a small volume of 12% sodium borohydride under constant flow of nitrogen. After the reaction was complete (30 min) the organic phase, which separates as a yellow oil, was transferred to the DMEM media (final concentration 5 μm) and used to load the cells in the dark, at 37°C for 20 min. The reduced form of MEQ is membrane-permeable; once loaded, diH-MEQ is converted to the oxidized form (MEQ), which is retained within the cell. Afterward, cells were rinsed and incubated in chloride-free DMEM-based media for an additional 10 min, at 37°C, for uniform distribution of the dye in the cytoplasm. During the recordings cells were superfused with a solution containing (in mm): Na gluconate 130, K gluconate, 5.4, MgSO4 0.8, Ca gluconate 1.2, NaH2PO4 1, glucose 5.5, and Tris 5, pH-adjusted to 7.4. To obtain a hypotonic solution, the sodium gluconate was reduced to 80 mm. Replacement of the chloride salts with gluconate was necessary to maintain a maximum initial fluorescence of MEQ, which is quenched by collision with halide ions (Cl−, SCN−). Drugs were added to each solution, as described for volume measurements. Recordings were obtained using the same equipment as described for fura-2 AM fluorescence measurements. The dye was excited at 344 nm, and images were captured above 440 nm every 10 sec. Experiments were repeated at least three times for each experimental paradigm. Average recordings from 50 cells per coverslip were analyzed.
Cl− flux measurements using a fluorescence plate reader
To obtain quantitative information regarding the effects of Cl− and K+ channel blockers on Cl− fluxes in glioma cells, a Fluostar 403 fluorescence plate reader was used (BMG LabTechnologies, Durham, NC). MEQ fluorescence measurements were obtained using 340 nm excitation and 440 emission filters. Glioma cells were plated in 96 multiwell plates (Fisher Scientific) at 105 cells/ml. After 24 hr from plating, cells were loaded with the Cl−-sensitive fluorescent dye MEQ, as described for microscope based recordings. Drugs were either added to the cells after rinsing the dye or applied during the recording using microinjectors capable of delivering defined volumes to individual wells. Experiments were performed at room temperature in the gluconate based buffers as described. Multiple readings of the same microplate during 60 min were obtained. Data were analyzed using Fluostar software that is integrated with the spreadsheet software Excel 5.0.
Materials and chemicals
All drugs and chemicals were purchased from Sigma (St. Louis, MO), except when otherwise mentioned. Tamoxifen was reconstituted in DMSO, which was used as “vehicle” control when indicated in the experimental results. Chlorotoxin was purchased from Alomone Laboratories (Jerusalem, Israel) and from Peninsula Laboratories (Belmont, CA).
Statistical analysis
Results were analyzed using GraphPAD (Instat). Student’st test (unpaired, two-tailed) was used for data with normal SD distribution. ANOVAs were used for multiple comparisons.
RESULTS
Effects of Cl− channel blockers on glioma cell migration in vitro
Previous data from our laboratory has shown that Ctx selectively blocks a voltage-activated chloride conductance (Ullrich et al., 1996) specifically expressed by human glial tumors. These outwardly rectifying currents are also sensitive to TEA and tamoxifen (Ransom and Sontheimer, 1998). To investigate the roles that glioma Cl− channels play in the invasive behavior of tumor cells, we used a Transwell migration assay (modified Boyden chamber assay) frequently used to assess cell chemotaxis and invasiveness. Glioma cells were plated on the upper side of a filter insert containing 5–8 μm pores and are attracted to migrate through these pores toward the extracellular matrix protein vitronectin. Several glioma cell lines and glioma culture preparations dissociated from human biopsies (passages 2–3) were subjected to Transwell assays in the presence or absence of various Cl− and K+ channel blockers. After 3–6 hr migration time, cells were fixed and stained with crystal violet. Figure1 shows representative fields of tumor cells obtained from a glioblastoma multiforme (UAB case no. 98040138) that have successfully migrated across the chamber filters in the presence (Fig. 1B) or absence (Fig.1A) of 5 μm Ctx. Migration of glioma cells was greatly reduced in the presence of chlorotoxin. Complete dose–response curves for the inhibitory effects of Ctx were obtained using the glioma cell line U251MG. As illustrated in Figure1C, Ctx caused a concentration dependent inhibition of Transwell migration with maximal inhibition of 54.6% (SD 3.5,n = 15) for concentrations >1 μm, and an apparent IC50 of 600 nm. Inhibition of Transwell migration by Ctx appears specific for human gliomas because 5 μm Ctx did not affect the Transwell migration of human melanoma cells (SKMEL5, 10% inhibition, SD = 2.3,n = 10), Balb3T3 fibroblasts (18.9% inhibition, SD = 3.4, n = 10), or primary cultures of rat hippocampal astrocytes (Fig. 1D).
Fig. 1.
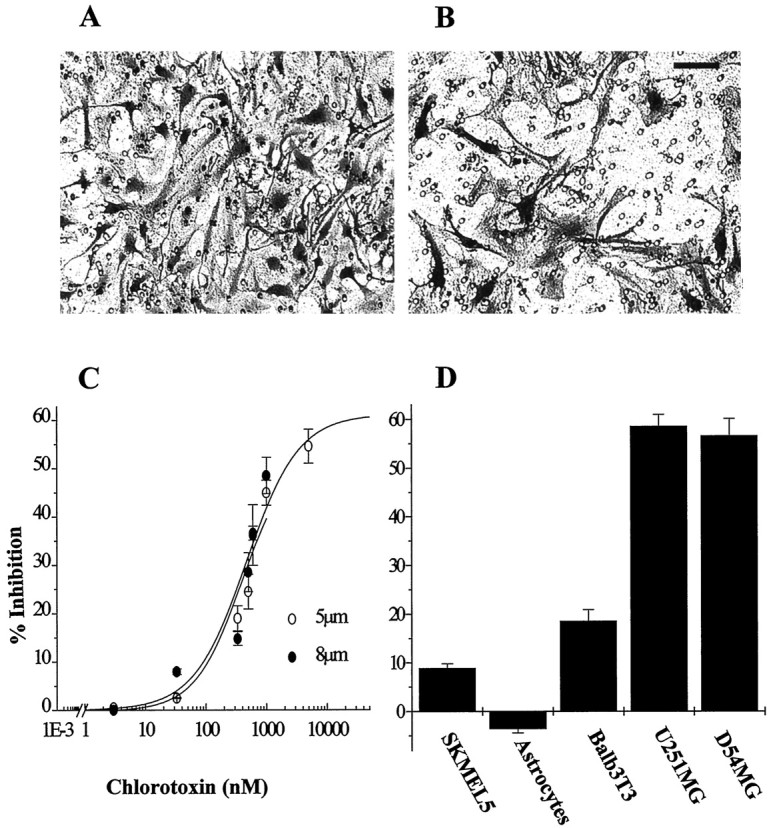
A, B, Representative microscopic fields of human glioblastoma cells that have migrated across an 8 μm pore size filter in the presence (B) or absence (A) of 1 μm Ctx. Cells were fixed and stained with crystal violet (see Materials and Methods). Scale bar, 50 μm.C, The ability of Ctx to inhibit Transwell migration of U251MG cells is dose-dependent for both 5 and 8 μm pore size filters. Half-maximal inhibition (IC50) for Ctx is ∼600 nm (log scale). The y-axis represents percentage inhibition calculated as decrease in the number of Ctx-treated cells that migrated across the filters normalized to control conditions. Data points are mean values from three independent experiments ± SD. Continuous lines represent a Langmuir-binding isotherm fitted to data. D, Inhibition of Transwell invasion by 5 μm chlorotoxin is glioma-specific: U251MG and D54MG human malignant glioma cell lines are >60% inhibited, whereas no significant effect is seen on control cell lines. They-axis represents percentage inhibition calculated as decrease in the number of cells that migrated across 8 μm filter in the presence of 5 μm Ctx compared with control conditions.
We investigated the effects of other Cl− and K+ ion channel blockers on Transwell migration of U251MG cells. These results are summarized in Table1. Dose–response curves for Transwell migration of glioma cells were also obtained for TEA concentrations (Fig. 2A) and tamoxifen (Fig. 2B) using U251MG cells. Both TEA and tamoxifen have been reported to block K+ and Cl− channels, and in glioma cells tamoxifen may indeed inhibit both (Chin et al., 1997). We have been able to effectively inhibit swelling-activated chloride currents in U251MG with ∼80% blocked by 10 μm tamoxifen (C. Ransom, unpublished observations). We tested a wide range of TEA and tamoxifen concentrations in Transwell assays and have found that doses <100 μm TEA and 100 nm tamoxifen were ineffective in preventing glioma cell invasion. The apparent half-maximal inhibition doses for TEA and tamoxifen were 1 mm and 10 μm, respectively (Fig.2A,B). Interestingly, the effectiveness of tamoxifen in this assay is consistent with the concentration required for channel block (Phillis et al., 1998) but ∼100-fold lower than required for its activation of PKC-dependent apoptosis (Chin et al., 1997). Treatment of cells with vehicle alone (DMSO) was without effect, moreover, neither of the drugs used showed any cellular toxicity (data not shown) using the Alamar blue (from Accumed, West Lake, Ohio) cell viability assay (Andreanski et al., 1997). Effects of Ctx, TEA, and tamoxifen on Transwell migration of acutely dissociated glioma cells from human biopsy tissue were investigated using the same approach as described for cell lines. Results obtained using cells (passages 2–3) from human glioblastoma multiforme (GBM), low grade astrocytoma, and epileptic tissues are summarized in Table 2. The variability of response between different cell preparations is not surprising given the tremendous cellular and physiological heterogeneity of these tumors. However, it is notable that most of the high-grade glioma samples exhibited significant sensitivity to Ctx (average inhibitory effect for GBMs = 34.06%, SD 4.6), and tamoxifen (average inhibition = 32.4%, SD5.1), whereas cells obtained from intractable epilepsy biopsy tissue (which we used as nonmalignant control) were not affected by either of the drugs in their migratory behavior. Tissue sections from the same specimens were immunohistochemically stained for GFAP, an astrocytic marker and for anti-Ki-67 antibody (clone MIB1; Dako), used as a histological marker, indicative of the proliferative activity (Giese et al., 1994).
Table 1.
Effects of ion channel blockers on U251MG cell Transwell migration
| Drug | Concentration | % Inhibition ± SD | Count (n) |
|---|---|---|---|
| Chlorotoxin | 1 μm | 56.26 ± 2.3 | 50 |
| TEA | 1 mm | 46.8 ± 3.6 | 75 |
| Tamoxifen | 10 μm | 64.8 ± 3.8 | 50 |
| Iberiotoxin | 10 nm | 21.36 ± 6.5 | 10 |
| Quinine | 1 mm | 32.63 ± 2.3 | 10 |
| Margatoxin | 10 nm | 3.69 ± 0.63 | 12 |
| DIDS | 200 μm | 52.36 ± 2.9 | 30 |
| ZnCl2 | 100 μm | 49.36 ± 3.6 | 30 |
| 4-AP | 4 mm | 5.6 ± 0.98 | 10 |
| Charybdotoxin | 10 nm | 4.36 ± 0.23 | 12 |
Results (mean values from three experiments ± SD) are expressed as percentage inhibition in cell migration from control.
Fig. 2.

Inhibition of Transwell migration of U251MG cells by TEA (A) and tamoxifen (B) is dose-dependent. Each data point represents mean values from three different experiments ± SD. They-axis represents percent inhibition calculated as the decrease in number of cells that migrated through the pores in the presence of TEA or tamoxifen as compared with vehicle-treated cells.
Table 2.
Effects of ion channel blockers on Transwell invasion of acutely dissociated human biopsy tissue
| Case number | Gender | Age (Years) | Pathology | % Inhibition by Ctx (5 μm) | % Inhibition by Tamoxifen (10 μm) | % Inhibition by TEA (1 mm) | GFAP | Ki-67 (MIB1) |
|---|---|---|---|---|---|---|---|---|
| 98030122 | Female | 38 | Intractable seizures | 11.3 ± 2.8 | 13.5 ± 1.8 | 18.3 ± 2.1 | +++ | + |
| 98080273 | Male | 3 | Giant cell astrocytoma | 41.8 ± 3.2 | 28.2 ± 1.9 | 48.2 ± 5.1 | ++ | + |
| 98030219 | Male | 2 | Pilocytic astrocytoma | 22.6 ± 1.8 | ND | 42.2 ± 3.8 | ++ | ++ |
| 98040138 | Male | 46 | Glioblastoma multiforme | 25.7 ± 1.9 | 26.2 ± 3.8 | 44.2 ± 3.7 | + | +++ |
| 98020215 | Male | 3 | Pilocytic astrocytoma | 16.5 ± 0.9 | 22.6 ± 2.7 | ND | − | ++ |
| 98090185 | Male | 65 | Glioblastoma multiforme | 32.4 ± 3.8 | ND | 48.6 ± 6.7 | ++ | +++ |
| 98090175 | Female | 62 | Glioblastoma multiforme | 36.5 ± 5.8 | 39.6 ± 5.9 | ND | + | ++ |
| 98090132 | Female | 65 | Glioblastoma multiforme | 29.5 ± 1.8 | ND | 38.6 ± 3.2 | +++ | ++ |
| 99010304 | Male | 62 | Glioblastoma multiforme | 36.59 ± 6.8 | 42.2 ± 2.3 | ND | ++ | +++ |
| 9803129 | Male | 59 | Glioblastoma multiforme | ND | 39.2 ± 2.8 | 52.2 ± 6.1 | + | ++ |
Results represent mean values (±SD) from three individual experiments, expressed as percentage inhibition in cell migration normalized to control. Immunohistochemical staining was scored on an arbitrary scale from negative (−) to +, for 20%, ++, for >50%, and +++, for >80% positive cells, based on cell counts from minimum 20 fields (200 × 200 μm) per slide, obtained by two independent researchers. ND, Not determined.
Effects of ion replacement on glioma cell migration
To confirm that the inhibitory effect of Cl−channel blockers on Transwell migration were indeed caused by inhibition of Cl− fluxes across cell membrane, we repeated the Transwell assays after replacing Cl− ions with other anions that show either similar or lesser permeability. Electrophysiological recordings indicated the following permeability sequence for the outwardly rectifying voltage activated glioma currents: I−>NO3−>Br−>Cl−>acetate> isethionate>F−>glutamate (Ullrich and Sontheimer, 1997). As shown in Figure 3, substitution of the chloride ions with an equally permeant species, such as bromide (125 mm NaBr in migration assay buffer based on Cl−-free DMEM media) did not affect the migration rate of U251MG human glioma cells. Furthermore, sensitivity to ion channel blockers, such as Ctx (1 μm), 4,4′-diisothyanostilbene-2,2′disulfonic acid (200 μm), and Zn2+ (100 mm) was preserved (Fig. 3). However, Transwell migration of glioma cells was significantly reduced (>60%inhibition) when NaCl was replaced by mannitol (120 mm) or Na glutamate, which are both impermeant to glioma voltage-activated channels (Fig. 3). These results support the notion that Cl− ion fluxes across the cell membrane are necessary for Transwell migration.
Fig. 3.

Effects of ion substitution on Transwell migration of U251MG cells. Results are expressed as percentage of cells that migrated normalized to control conditions (NaCl in migration media). Results represent mean values from three independent experiments ± SD. Statistics were computed from raw data, using ANOVA. ***p < 0.001; ** p < 0.01.
Effects of ion channel blockers on U251MG cell motility
To better understand the mechanisms underlying the inhibitory effects of ion channel blockers on tumor cell invasion, we first ascertained whether overall cell motility was affected by application of these drugs. Cell movement was monitored by video time lapse microscopy, using a scrape motility assay as previously described (MacFarlane and Sontheimer, 1997). The series of top panels in Figure4A–Dillustrates the time course of such an assay. U251MG cells readily migrate into and across an artificially created “scar” (∼150 μm) in the presence of 5 μm Ctx (A–D), and indistinguishable from control (vehicle alone, data not shown). Similarly, application of 1 mm TEA or 10 μm tamoxifen did not interfere with the cell motility in a two-dimension scrape motility assay that lacks the spatial constraints imposed by the Transwell assay. Rhodamine-conjugated phalloidin staining of Ctx, TEA, or tamoxifen-treated glioma cells showed integrity of stress fibers (data not shown), thus indicating that ion channel blockers used herein do not act by disrupting the actin–myosin molecular motor or interfering with the integrity of the cell cytoskeleton.
Fig. 4.

A–D represent time-lapse micrographs of a “scrape-migration” assay. U251MG cells treated with 5 μm Ctx were scarred and monitored for 24 hr. Glioma cell migration into the empty space results in gradual closure of the scar, which is complete at 24 hr, unchanged from control (data not shown). Scale bar, 100 μm. Phase (E–H) and fluorescent (I–L) micrographs of a confrontation assay between DiO-labeled BTs and DiI-labeled FBAs. The interaction was monitored by video time-lapse microscopy for 72 hr, in the presence or absence of ion channel blockers. H and Lillustrate significant reduction in the invasion of glioma cells into the FBA and preservation of a clear border between the two tissue types; also noticeable is the integrity of normal brain tissue in the presence of chlorotoxin (5 μm; H,L) in contrast to massive infiltration of the fetal rat brain with glioma cells in control conditions (G,K). Scale bars: A,E, 100 μm.
Inhibition of glioma invasion of normal brain aggregates
To more closely mimic glioma cell invasion into normal brain, we used a three-dimensional coculture system modified after Bjerkvig et al. (1990) and Penar et al. (1998). These confrontation assays between human glioma spheroids (BT) and fetal rat brain aggregates (FBA) were monitored for up to 120 hr by fluorescence video time-lapse microscopy. Human glioma spheroids labeled with DiO demonstrated infiltrative invasion of the FBA (Fig.4I,J) initiated by single cell migration around 24 hr after the beginning of the coculture. In control (vehicle treatment) conditions, the invasion process continues with a loss of border between the two spheroids and gradual replacement of the normal brain tissue with tumor cells (Fig.4E–G, I–K); local areas of tissue loss were noticeable in the FBA. Cells from the normal brain aggregate were also seen migrating toward the tumor spheroid, probably because of chemotaxic effects exerted by growth factors and cytokines released by glioma cells. Addition of 5 μm Ctx to the coculture significantly reduced the invasion of tumor cells into normal brain tissue. As shown in Figure 4, fluorescently labeled tumor cells migrate toward, surround the FBA, and attach to the normal tissue. However, no deep invasion of glioma cells is seen, and the border between the tissues remains clearly defined (Fig.4H,L, arrows). Furthermore, treatment with 1 mm TEA or 10 μmtamoxifen significantly diminished tumor invasion (data not shown). Experiments for each of the drugs were repeated three times with similar results. Although we did not attempt to quantitate the degree of tumor invasion inhibition by directly measuring the extent FBA destruction, this assays allowed for a qualitative sequential analysis of glioma invasion and modulation of invasion by Ctx, TEA, and tamoxifen. “Sister” cultures for the treated spheroids were maintained in 37°C, 95% O2 and 5% CO2simultaneously with those subjected to video recording, and cell viability was confirmed by staining with calcein and propidium iodide as previously described (Nygaard et al., 1998). None of the drugs exhibited cellular toxicity at the doses used in these experiments.
Inhibition of glioma cell invasion into brain slices
To quantify the effects of ion channel blockers on glioma cell invasion we used a modified organotypic culture system (Ohnishi et al., 1998). Viability of cultured rat brain slices was monitored for 14 d by propidium iodide staining and demonstrated cellular integrity, organotypic organization and preservation of laminar structure of the cortex, (although the thickness of the slice was reduced to ∼150 μm from the initial 300 μm). After 5 d in culture, fluorescently (DiO) labeled 106 glioma cells (U251MG cells and acutely dissociated cells from patient biopsy) were placed on the surface of the slice. Movement of tumor cells within the slice was monitored by epifluorescence microscopy; representative fields of glioma cells on the surface and within the brain slice are shown in Figure 5B (bright regions indicated by arrow). No significant differences in the number of tumor cells between preparations were noticed in the initial 24 hr after plating; we thus assumed that an equivalent number of glioma cells have become attached to the rat brain slice. After 96 hr in coculture, cells that migrated through the brain slice and across the 8 μm membrane were counted (entire filter area was counted in six filters per condition, in three independent experiments). As shown in Figure 5A, Ctx (5 μm) application reduced by 30% (SD= 4.6,n = 18, p < 0.05) the number of glioma cells that invaded through the brain slice, compared with vehicle-treated cells. TEA (1 mm) had the most prominent inhibitory effect on glioma cell invasion (45% decrease in the number of cells compared to control), suggesting that multiple TEA-sensitive transport mechanisms (including Cl− and K+ ion channels) are involved in mediating glioma cell shape and volume changes that take place during tumor invasion. Using the brain slice invasion assay we could best mimic the tridimensional environment of the healthy brain tissue, while also accurately count the distinctively labeled human tumor cells.
Fig. 5.

Slice invasion assay. A, Ten microliters of DiO-labeled glioma cells (106) were plated atop each of the brain slices placed in the top compartment of a two-well culture chamber. After 4–6 d, fluorescently marked tumor cells that had migrated through the neonatal rat brain slice and across the membrane were retrieved on the bottom of the filter and counted under the fluorescence microscope. Entire filter areas were counted in each condition (six filters per condition). Results represent mean values from three independent experiments. Percentage inhibition was calculated as the decrease in the number of drug-treated cells normalized to control. Bonferroni p values were obtained using ANOVA. **p < 0.01. B, Photomicrograph showing a representative field of a tissue culture insert with DiO-labeled glioma cells that successfully invaded the brain slice (arrows). Scale bar, 150 μm.
Effects of ion channel blockers on RVD in human glioma cells
Volume adaptive changes are essential for any cell survival. In the case of spatial constraints imposed by the skull, migratory tumor cells that disseminate from primary tumor mass are faced with a very narrow extracellular space, further reduced by edema present in the tumor environment. As such, glioma cells first shrink, reduce their volume by secreting water and ions, after which they undergo volume recovery. To investigate whether inhibition of Cl−channels by the drugs used for invasion assays perturb the tumor cells’ ability to regulate cell volume, we experimentally altered the cell volume of glioma cells by changes in bath osmolality and evaluated the effects of Cl− channel blockers on volume regulation. We subjected glioma cells to a brief hypo-osmotic swelling and monitor their gradual volume decrease toward the original cell size. This was accomplished using the isosbestic point of fura-2 AM (357 nm) where fluorescence changes are a good indicator of variations in cell volume. Furthermore simultaneous [Ca2+]i measurements can be obtained (Altamirano et al., 1998). Exposure of cultured glioma cells to a hypotonic solution (200 mOsm) induced rapid cell swelling measured as a fura-2 fluorescence intensity decrease when excited at the isosbestic point wavelength (357 nm) because of dilution of the dye. This was followed by a slow recovery up to 85% of the initial volume within the next 13.5 min; this volume recovery phase has been termed regulatory volume decrease (RVD) (Chamberlin and Strange, 1989). A recording obtained by averaging responses from 50 glioma cells is shown in Figure6A (bottom,thin trace). The volume recovery mechanisms in human glioma cells were Ca2+ independent, because the presence of EGTA (2 mm) in the hypotonic media did not alter the volume recovery rates (data not shown). Pretreatment with and inclusion in the perfusion solutions of 2 μm cytochalasin D (an actin-depolimerizing drug) did not prevent RVD, although glioma cells were swollen to a lesser extent compared with the control, under same hypotonic conditions (data not shown). Interestingly, application of hypotonic media induced [Ca2+ ]ioscillations with a transient increase in intracellular Ca2+ concentration of 400 nm above its levels in isotonic conditions (data not shown). The time course and characteristics exhibited by glioma cell RVD (rate, extracellular calcium independence) are in agreement with previous studies that explored volume regulatory mechanisms in astrocytes (Pasantes-Morales et al., 1994). Pretreatment with 5 μm Ctx, which was also included in the hypotonic solution, resulted in 40% less cell swelling and virtually no recovery of the cell volume (Fig.6A, top bold trace). The swelling decrease suggests a reduction in water influx. The inhibition of RVD suggests that Ctx blocks Cl− fluxes involved in water extrusion during cell shrinking. Ctx treatment did not alter the changes seen in [Ca2+]i during hypotonic media application. The effects of TEA (1 mm) and tamoxifen (10 μm) on glioma cell RVD were tested in the same manner as explained for chlorotoxin. Tamoxifen inhibited the rate of RVD by 60% (measured as difference in the slopes of recovery). Tamoxifen regulation of RVD has been described in other cell types, including neuroblastoma (Diaz, 1996). One millimolar TEA application inhibited by 50% RVD in osmotically challenged U251MG cells.
Fig. 6.

A, Swelling-induced volume changes in glioma cells were measured using fura-2 dye excited at its 357 nm isosbestic point. Hypo-osmotic shock results in a rapid decrease in fluorescence intensity that corresponds to the dye dilution after water entry, followed by a slow recovery termed RVD initiated while hypotonic conditions were maintained (bottom thin line). A sharp fluorescence increase above the initial levels was triggered by isotonic wash. Exposure to 5 μm Ctx before and during the hypotonic shock resulted in a marked decrease in cell swelling and virtually abolished RVD (top bold line). Both traces were obtained by averaging recordings from 50 cells. The bar above the traces denotes the duration of exposure to hypotonic solution. B, The degree of recovery was calculated by fitting the fluorescence plot to an exponential function (from microcal Origin version 5.0 software); mean values from three independent experiments for each of TEA (1 mm), Ctx (5 μm), and tamoxifen (10 μm) were normalized to their respective control. Results are presented as percentage inhibition of RVD. Error bars indicate SD. Statistics were computed using ANOVA; ***p < 0.001.
Modulation of Cl− fluxes in glioma cells by ion channel blockers
To better understand the mechanisms of Ctx, TEA, and tamoxifen action during hypo-osomotic challenge and volume recovery in glioma cells, we used the chloride-sensitive fluorescent indicator MEQ. Through fluorescence imaging of MEQ-loaded human glioma cells, we measured Cl− ion movement across the cell membrane during challenges with hypo-osmotic solutions and Cl− “pulses”, as described previously for epithelial cells, fibroblasts (Woll et al., 1996), synaptosomes, and brain slice (Yu and Schwartz, 1995). U251MG plated on 22 mm square coverslips were loaded with MEQ as described and perfused with a gluconate-based solution; in this low Cl− ion concentration environment MEQ fluorescence is maximum. Quenching of the MEQ signal (48% from resting conditions) was triggered by addition of a hypotonic (200 mOsm/kg) solution with 30 mm NaCl. DiH-MEQ fluorescence levels were completely restored by isotonic wash with no Cl− (Fig.7A, bottom thin trace). One millimolar TEA significantly reduced glioma cell permeability for Cl−. The MEQ signal decreased only by 5% from control and recovered after restoring of iso-osmotic conditions (Fig. 7A, top bold trace). We tested Ctx, TEA, and tamoxifen over a wide range of concentrations in their ability to impede Cl−fluxes across glioma cells plated in 96 multiwell dishes. The use of fluorescence plate reader allowed us to obtain multiple readings for 30 min. In U251MG cells pretreated with Ctx (1 μm) the swelling-induced Cl− influx was reduced by 60% as compared with the control conditions (Fig. 7B). Tamoxifen (10 μm) treatment diminished by 35% the quenching of the Cl−-sensitive dye in glioma cells during challenge by hypotonic solution, whereas 1 mm TEA application resulted in an almost complete block of Cl− influx (Fig. 7B). These results, together with fura-2 volume measurements, demonstrate that chlorotoxin, TEA, and tamoxifen are able to significantly reduce swelling induced chloride flux across glioma cell membrane, thus possibly interfering with the shape and volume changes required for tumor cell invasion.
Fig. 7.

A, Osmotically induced chloride fluxes in human glioma cells were measured using the Cl−-sensitive dye MEQ. Application of a hypotonic solution containing 30 mm NaCl resulted in a rapid fluorescence intensity decrease because of dye quenching, followed by recovery to initial levels after the restoration of iso-osmotic conditions (bottom thin line). In the presence of 1 mm TEA (both in the isotonic and hypotonic media), Cl− entry into the cells was significantly prevented (top bold line). Tracesrepresent average responses from 50 cells. The bar abovecorresponds to the duration of exposure to hypotonic media and 30 mm NaCl. B, Glioma cells plated in 96-well plates (5000 cells per well) were pretreated with TEA (1 mm), Ctx (5 μm), or tamoxifen (10 μm) and loaded with the Cl−-sensitive dye MEQ. Fluorescence measurements were done using a plate reader. A “chloride pulse” in hypotonic media was administered to glioma cells via microinjectors (100 μl/well, arrow). MEQ fluorescence intensity sharply decreases as a result of dye quenching by Cl− ions entering the cell in control conditions (■, bottom trace). In the presence of ion channel blockers, the dye quenching is significantly decreased, 60% in the case of Ctx (▵), 35% by tamoxifen (▴), and >85% by TEA pretreatment (●). The decrease in MEQ fluorescence quenching indicates reduced permeability of the glioma cell membrane to Cl−. Traces represent average recordings from four wells (20,000 cells) obtained at nine time intervals after the initial challenge. Error bars indicate SD.
DISCUSSION
Unlike tumors that form elsewhere in the body or tumors that are metastatic to brain, primary brain tumors are characterized by a relentless drive to invade surrounding healthy tissues. This invasive behavior has long been recognized as a major impediment in the treatment of gliomas. Mechanisms that contribute to the invasiveness of glioma cells have been studied by a number of laboratories and have identified alterations in cell adhesion molecules (Edvardsen et al., 1994), extracellular matrix molecules, and their cell surface receptors in gliomas (Giese et al., 1994; Haughland et al., 1997). Specifically these studies show upregulation of fibronectin, laminin, vitronectin, and collagen types I, III, and IV (Rutka et al., 1988) andde novo expression of a novel hyaluronan-binding protein BEHAB, believed to be a glioma-specific extracellular matrix element (Jaworski et al., 1996; Zhang et al., 1998). A neural cell adhesion molecule termed L1 has recently been implicated in promoting glioma cell adhesion and invasion along neuronal fibers (Izumoto et al., 1996). To date, a new candidate “invasion suppressor” gene for the CNS tumors has been proposed, Nm23, previously implicated in microtubule disruption and modulation of the metastatic potential of melanomas (Martin and Pilkington, 1998). Clearly, migration and invasion of cells are complex processes that require adhesion of cells to tissue structures, mechanisms to generate locomotion, and the ability to alter the space into which cells move (Liotta et al., 1991).
Little attention has been paid to the spatial constraints in which cells move and mechanisms by which cells adapt to such constraints. We propose here, as illustrated in Figure8A, that glioma cells can adjust their cell shape and cell volume to facilitate invasion into narrow spaces. These changes require secretion of Cl− ions along with either K+ or Na+ to allow water loss and cell shrinkage. We thus hypothesize that upregulation of Cl− channels represent an adaptive feature in human glioma cells. Light microscopy analysis of toluidine blue-stained sections obtained from cocultures of glioma spheroids with fetal rat brain aggregates (Fig.8B) and electron microscopy analysis of the same preparation (Fig. 8C) support the notion that invading glioma cells assume a pronounced elongated cells shape that is consistent with a loss in cell volume. Similar cell shape and volume changes have been recognized by computer reconstruction of electron microscopic sections of ascites carcinoma cells (Parsons et al., 1982) after penetration of the perineum. Cell shape and volume changes that facilitate migration of glioma cells within the brain are clearly not sufficient to account for long distance movements through narrow extracellular spaces. Brain tumor cells further enlarge this space by secretion of proteolytic enzymes (Sugiura et al., 1998) and show alterations in their interactions with extracellular matrix proteins. A role for Cl− and K+ channels and changes in cell morphology have been documented for various cell types including muscle cells, lymphocytes, melanocytes, and astrocytes (Cornett et al., 1993; Haussler et al., 1994; Kauranen et al., 1995). In the latter, chloride currents can be activated by changes in cell morphology or cell volume (Lascola and Kraig, 1996). Moreover, mitogen-activated protein and tyrosine kinases in astrocytes are activated by astrocytic volume changes (Crépel et al., 1998). Data presented here clearly support the notion that pharmacological blockade of glioma Cl− currents retards the ability of the cells to migrate across Transwell filters, without interfering with the overall motility.
Fig. 8.

A, Model representing glioma cell shape and volume-adaptive changes that occur during invasion in spatially restricted conditions. These changes, accompanied by water loss and cytoskeletal rearrangements, are mediated by ion fluxes through Cl− and K+ ion channels and other ion transport mechanisms. B, Semithin section through a coculture of tumor spheroids and fetal rat brain aggregates, stained with toluidine blue. Glioma cells are seen advancing through two normal rat brain cells (arrows). Scale bar, 20 μm.C, Area of detail of the same preparation as inB, analyzed by transmission electron microcopy. Glioma cells are easily recognized because of the abundance of ribosomes and other organelles that incorporate lead citrate and give a darker appearance. Arrows indicate area of contact between an elongated tumor cell and two other membranes, presumably of the fetal rat brain. Scale bar, 1 μm.
We currently speculate that Ctx, tamoxifen, and TEA each impede cell shrinkage by inhibiting Cl− fluxes that are obligatory for the movement of water across cell membranes. Indeed, this conclusion is supported by our ion replacement studies in which Transwell migration is undisturbed if Cl− is replaced by a permeant anion but greatly reduced if substituted by an impermeant anion. Moreover, direct measurements of Cl− fluxes and glioma cell volume using fluorescent techniques show that these Cl− channel blockers reduce transmembrane Cl− fluxes and greatly reduced osmotically induced cell volume changes. A recent study in another human glioma cell line (U138MG) showed the ability of halide and alkyl phenols to block volume-sensitive chloride channels (Roy et al., 1998). Studies by others further support the notion that ion channel function may be associated with certain cancers. Swelling-activated outwardly rectifying chloride currents were selectively expressed in carcinoma cells in situ and invasive cervical cancer cell lines in vitro that were absent in normal tissue or low grade tumor cells (Chou et al., 1995; Shen et al., 1996). Inhibition of voltage-activated Na+ channels can decrease the invasiveness of human prostate cancer cells (Laniado et al., 1997), and tamoxifen-sensitive Cl− channels support migration and invasion of human thyroid cancer cells (Hoelting et al., 1995). Although our in vitro experimental conditions could not completely mimic the spatial constraints and the complexity of the extracellular environment of the brain through which glioma cells migrate in vivo, results from confrontation assays and the slice invasion experiments further indicate that blockade of glioma ionic currents can modulate tumor invasiveness.
Expression and functional roles of the above described Cl− channels appear particularly enhanced in tumor cells. Interestingly, while absent in normal rat astrocytes, large, outwardly rectifying voltage-activated currents were described in embryonic rat glial cells (Ransom, unpublished observations). It is conceivable that such Cl− channels are also expressed during early brain developmental where neurogenesis and gliogenesis are associated with cell migration, because similar requirements for cell shape and cell volume exist under these conditions. Indeed, an earlier report documents the presence of a chlorotoxin-sensitive Cl− channel in preparations from embryonic fetal rat brain growth cones (DeBin et al., 1994). This “secretory” Cl− channel is hypothetically involved in plasmallemma expansion and membrane recycling occurring during neurite outgrowth (DeBin et al., 1994). Expression by glioma cells of a current with similar gating and pharmacological characteristics may recapitulate a phenotype that is expressed earlier in development. Our findings, corroborated with previous studies showing enhanced channel expression in highly malignant brain tumors propose that glioma ion currents may confer a growth advantage and represent a tumor-specific adaptive feature. Although other cancerous cells do not display the degree of invasiveness observed in gliomas, their initial penetration into organ tissues necessitate similar shape and volume changes in these cells (Parsons et al., 1982). It is conceivable that Cl−channels with related properties to the conductance described in this report are ubiquitously expressed in migrating cells. Targeting Cl− channels may thus provide a novel way to inhibit invasion and cell migration within tissues. Specifically, inhibition of glioma chloride ion currents may restrain dissemination of primary brain tumor cells and render these malignancies more amenable to surgical intervention.
Footnotes
This work was supported by Grants NS36692 from the National Institutes of Health and RPG-97-083-01CDD from the American Cancer Society. We thank Dr. Steven Rosenfeld for advice on cell migration assays, Dr. Yancey Gillespie for providing glioma biopsy tissue, Ed Phillips for technical support with electron microscopy, and Chris Ransom for critical comments.
Correspondence should be addressed to Dr. Harald Sontheimer, 1719 6th Avenue South CIRC 545, Birmingham, AL 35294-0021.
REFERENCES
- 1.Altamirano J, Brodwick MS, Alvarez -Leefmans FJ. Regulatory volume decrease and intracellular Ca2+ in murine neuroblastoma cells studied with fluorescent probes. J Gen Physiol. 1998;112:145–160. doi: 10.1085/jgp.112.2.145. [DOI] [PMC free article] [PubMed] [Google Scholar]
- 2.Andreanski S, Soroceanu L, Flotte ER, Chou J, Markert JM, Gillespie YG, Roizman B, Whitley RJ. Evaluation of genetically engineered herpes simplex viruses as oncolytic agents for human malignant brain tumors. Cancer Res. 1997;57:1502–1509. [PubMed] [Google Scholar]
- 3.Bernstein J, Goldberg WJ, Laws ER, Conger D, Morreale V, Wood RL. C6 glioma cell invasion and migration of rat brain after neural homografting: ultrastructure. J Neurosurg. 1990;26:622–628. doi: 10.1097/00006123-199004000-00010. [DOI] [PubMed] [Google Scholar]
- 4.Biwerski J, Verkman AS. Cell permeable fluorescent indicator for cytosolic chloride. Biochemistry. 1991;30:7879–7883. doi: 10.1021/bi00246a001. [DOI] [PubMed] [Google Scholar]
- 5.Bjerkvig R, Tonnesen A, Laerum OD, Backlund E. Multicellular tumor spheroids from human gliomas maintained in organ culture. J Neurosurg. 1990;72:463–475. doi: 10.3171/jns.1990.72.3.0463. [DOI] [PubMed] [Google Scholar]
- 6.Cavalla P, Schiffer D. Cell cycle and proliferation markers in neuroepithelial tumors. Anticancer Res. 1997;17:4135–4144. [PubMed] [Google Scholar]
- 7.Chamberlin ME, Strange K. Anti-iso-osmotic cell volume regulation: a comparative view. Am J Physiol. 1989;257:C159–C172. doi: 10.1152/ajpcell.1989.257.2.C159. [DOI] [PubMed] [Google Scholar]
- 8.Chin LS, Park CC, Zitnay KM, Sinha M, DiPatri AJ, Perillan, Simard JM. 4-Aminopyridine causes apoptosis and blocks an outward rectifier K+ channel in malignant astrocytoma cells. J Neurosci Res. 1997;48:122–127. [PubMed] [Google Scholar]
- 9.Chou CY, Shen MR, Wu S. Volume sensitive chloride channels associated with human cervical carcinogenesis. Cancer Res. 1995;55:6077–6083. [PubMed] [Google Scholar]
- 10.Cornett M, Lambert IH, Hoffmann EK. Relation between cytoskeleton, hypo-osmotic treatment and volume regulation in Erlich ascites tumor cells. J Membr Biol. 1993;131:55–66. doi: 10.1007/BF02258534. [DOI] [PubMed] [Google Scholar]
- 11.Crépel V, Panenka W, Kelly MEM, MacVicar BA. Mitogen-activated protein and tyrosine kinases in the activation of astrocyte volume-activated chloride current. J Neurosci. 1998;18:1196–1206. doi: 10.1523/JNEUROSCI.18-04-01196.1998. [DOI] [PMC free article] [PubMed] [Google Scholar]
- 12.DeBin JA, Maggio JE, Strichartz GR. Purification and characterization of chlorotoxin, a chloride channel ligand from the venom of the scorpion. Am J Physiol. 1993;264:C361–C369. doi: 10.1152/ajpcell.1993.264.2.C361. [DOI] [PubMed] [Google Scholar]
- 13.DeBin JA, Wood MR, Pfenninger KH, Strichartz GR. A chloride channel reconstituted from fetal rat brain growth cones. J Membr Biol. 1994;141:7–19. doi: 10.1007/BF00232869. [DOI] [PubMed] [Google Scholar]
- 14.Diaz M. Volume-activated chloride channels in neuroblastoma cells are blocked by the antiestrogene toremifene. Cell Mol Neurobiol. 1996;16:403–409. doi: 10.1007/BF02088104. [DOI] [PMC free article] [PubMed] [Google Scholar]
- 15.Edvardsen K, Pedersen PH, Bjerkvig R, Hermann GG, Zeuthen J, Laerum OD, Walsh FS, Bock E. Transfection of glioma cells with the neural-cell adhesion molecule NCAM: effect on glioma-cell invasion and growth in vivo. Int J Cancer. 1994;58:116–122. doi: 10.1002/ijc.2910580119. [DOI] [PubMed] [Google Scholar]
- 16.Giese A, Rief MD, Loo MA, Berens ME. Determinants of human astrocytoma migration. Cancer Res. 1994;54:3897–3904. [PubMed] [Google Scholar]
- 17.Haughland HK, Tysnes BB, Tysnes OB. Adhesion and migration of human glioma cells are differently dependent on extracellular matrix molecules. Anticancer Res. 1997;17:1035–1043. [PubMed] [Google Scholar]
- 18.Haussler A, Rivet-Bastide M, Fahlke C, Muller D, Zachar E, Rudel R. Role of the cytoskeleton in the regulation of Cl− channels in human embryonic skeletal muscle cells. Pflügers Arch. 1994;428:323–330. doi: 10.1007/BF00724514. [DOI] [PubMed] [Google Scholar]
- 19.Hoelting T, Siperstein AE, Duh QY, Clarck O. Tamoxifen inhibits growth, migration and invasion of human follicular and papillary thyroid cancer cells in vitro and in vivo. J Clin Endocrinol Metab. 1995;80:308–313. doi: 10.1210/jcem.80.1.7829632. [DOI] [PubMed] [Google Scholar]
- 20.Izumoto S, Ohnishi T, Arita N, Hiraga S, Taki T, Hayakawa T. Gene expression of neural cell adhesion molecule l1 in malignant gliomas and biological significance of L1 in glioma invasion. Cancer Res. 1996;56:1440–1444. [PubMed] [Google Scholar]
- 21.Jaworski DM, Kelly GM, Piepmeier JM, Hockfield S. BEHAB (brain enriched hyaluronan binding) is expressed in surgical samples of glioma and in intracranial grafts of invasive glioma cell lines. Cancer Res. 1996;56:2293–2298. [PubMed] [Google Scholar]
- 22.Jentsch TJ, Gunther W. Chloride channels: an emerging molecular picture. Bioessays. 1997;19:117–126. doi: 10.1002/bies.950190206. [DOI] [PubMed] [Google Scholar]
- 23.Kauranen M, Kiviniity K, Weckstrom M. Voltage-activated and spontaneous Cl− channel activity in cultured melanoma cells A2058. Biochim Biophys Acta. 1995;1269:281–289. doi: 10.1016/0167-4889(95)00150-9. [DOI] [PubMed] [Google Scholar]
- 24.Laniado ME, Lalani EN, Fraser SP, Grimes JA, Bhangal G, Djamgoz MBA, Abel PD. Expression and functional analysis of voltage activated Na+ channels in human prostate cancer cell lines and their contribution to invasion in vitro. Am J Pathol. 1997;150:1213–1221. [PMC free article] [PubMed] [Google Scholar]
- 25.Lascola CD, Kraig RP. Whole-cell chloride currents in rat astrocytes accompany changes in cell morphology. J Neurosci. 1996;16:2532–2545. doi: 10.1523/JNEUROSCI.16-08-02532.1996. [DOI] [PMC free article] [PubMed] [Google Scholar]
- 26.Liotta LA, Stetler-Stevenson WG, Steeg PS. Cancer invasion and metastasis: positive and negative regulatory elements. Cancer Invest. 1991;9:543–551. doi: 10.3109/07357909109018952. [DOI] [PubMed] [Google Scholar]
- 27.MacFarlane SN, Sontheimer H. Electrophysiological changes that accompany reactive gliosis in vitro. J Neurosci. 1997;17:7316–7329. doi: 10.1523/JNEUROSCI.17-19-07316.1997. [DOI] [PMC free article] [PubMed] [Google Scholar]
- 28.Manning TJ, Jr, Sontheimer H. Bovine serum albumin and lysophosphatidic acid stimulate calcium mobilization and reversal of c-AMP- induced stellation in rat cortical astrocytes. Glia. 1997;20:163–172. doi: 10.1002/(sici)1098-1136(199706)20:2<163::aid-glia8>3.0.co;2-a. [DOI] [PubMed] [Google Scholar]
- 29.Martin KK, Pilkington GJ. Nm23: an invasion suppressor gene in CNS tumors? Anticancer Res. 1998;18:919–926. [PubMed] [Google Scholar]
- 30.Merzak A, Pilkington GJ. Molecular and cellular pathology of intrinsic brain tumours. Cancer Metastasis Rev. 1997;16:155–177. doi: 10.1023/a:1005760726850. [DOI] [PubMed] [Google Scholar]
- 31.Monaghan AS, Mintenig GM, Sepulveda FV. Outwardly rectifying Cl− channel in guinea pig small intestinal villus enterocytes: effects of inhibitors. Am J Physiol. 1997;273:G1141–G1152. doi: 10.1152/ajpgi.1997.273.5.G1141. [DOI] [PubMed] [Google Scholar]
- 32.Nygaard SJT, Haukland HKR, Laerum OD, Lund-Johansen M, Bjerkvig R, Tysnes OB. Dynamic determination of human glioma invasion in vitro. J Neurosurg. 1998;89:441–447. doi: 10.3171/jns.1998.89.3.0441. [DOI] [PubMed] [Google Scholar]
- 33.Ohnishi T, Matsumara H, Izumoto S, Hiraga S, Hayakawa T. A novel model of glioma cell invasion using organotypic brain slice culture. Cancer Res. 1998;58:2935–2940. [PubMed] [Google Scholar]
- 34.Parsons DF, Marko M, Braun SJ, Wansor KJ. Ascites tumor invasion of mouse peritoneum studied by high-voltage electron microscope stereoscopy. Cancer Res. 1982;42:4574–4583. [PubMed] [Google Scholar]
- 35.Pasantes-Morales H, Murray AR, Lilja L, Moran J (1994) Regulatory volume decrease in cultured astrocytes: I. Potassium- and chloride - activated permeability. Am J Physiol C165–C171. [DOI] [PubMed]
- 36.Penar PL, Khoshyomn S, Bhuskhan A, Tritton T. Inhibition of glioma invasion of fetal brain aggregates. In Vivo. 1998;12:75–84. [PubMed] [Google Scholar]
- 37.Phillis JW, Song D, O’Regan MH. Tamoxifen a chloride channel blocker, reduces glutamate and aspartate release from the ischemic cerebral cortex. Brain Res. 1998;780:352–355. doi: 10.1016/s0006-8993(97)01352-8. [DOI] [PubMed] [Google Scholar]
- 38.Ransom C, Sontheimer H. Further characterization of voltage-activated outward currents in human glioma cells. Soc Neurosci Abstr. 1998;24:314. [Google Scholar]
- 39.Reuver SM, Garner CC. E-cadherin mediated cell adhesion recruits SAP97 into the cortical cytoskeleton. J Cell Sci. 1998;111:1071–1080. doi: 10.1242/jcs.111.8.1071. [DOI] [PubMed] [Google Scholar]
- 40.Roy G, Bernatchez G, Sauve R. Halide and alkyl phenols block volume sensitive chloride channels inhuman glial cells (U-138MG). J Membr Biol. 1998;162:191–200. doi: 10.1007/s002329900356. [DOI] [PubMed] [Google Scholar]
- 41.Rutka JT, Apodaca G, Stern R, Rosenblum M. The extracellular matrix of the central and peripheral nervous systems: structure and function. J Neurosurg. 1988;69:155–170. doi: 10.3171/jns.1988.69.2.0155. [DOI] [PubMed] [Google Scholar]
- 42.Sanchez DY, Blatz AL. Block of neuronal chloride channels by tetraethylammonium ion derivatives. J Gen Physiol. 1995;106:1031–1046. doi: 10.1085/jgp.106.5.1031. [DOI] [PMC free article] [PubMed] [Google Scholar]
- 43.Shen MR, Wu S, Chou CY. Volume sensitive chloride channels in the primary culture cells of human cervical carcinoma. Biochim Biophys Acta. 1996;1315:138–144. doi: 10.1016/0925-4439(95)00115-8. [DOI] [PubMed] [Google Scholar]
- 44.Shiraishi T. Cell kinetic analysis of brain tumors using the monoclonal antibody Ki-67: in vitro and in situ study. Rev Med Okayama. 1990;43:187–201. doi: 10.18926/AMO/30424. [DOI] [PubMed] [Google Scholar]
- 45.Sugiura Y, Shimada H, Seeger RC, Laug WE, DeClerck YA. Matrix metallo- proteinases -2 and -9 are expressed in human neuroblastoma: contribution of stromal cells to their production and correlation with metastasis. Cancer Res. 1998;58:2209–2216. [PubMed] [Google Scholar]
- 46.Ullrich N, Sontheimer H. Biophysical and pharmacological characterization of chloride currents in human astrocytoma cells. Am J Physiol. 1996;270:C1511–C1521. doi: 10.1152/ajpcell.1996.270.5.C1511. [DOI] [PubMed] [Google Scholar]
- 47.Ullrich N, Sontheimer H. Cell cycle dependent expression of a glioma-specific chloride current: proposed link to cytoskeletal changes. Am J Physiol. 1997;273:C1290–C1297. doi: 10.1152/ajpcell.1997.273.4.C1290. [DOI] [PubMed] [Google Scholar]
- 48.Ullrich N, Gillespie GY, Sontheimer H. Human astrocytoma cells express a unique chloride current. NeuroReport. 1996;7:1020–1024. doi: 10.1097/00001756-199604100-00013. [DOI] [PubMed] [Google Scholar]
- 49.Ullrich N, Bordey A, Gillespie GY, Sontheimer H. Expression of voltage-activated chloride currents in acute slices of human gliomas. Neuroscience. 1998;83:1161–1173. doi: 10.1016/s0306-4522(97)00456-9. [DOI] [PubMed] [Google Scholar]
- 50.Weber E, Tousson G, St.John P, Green MW, Gopalokrishnan U, Jilling T, Sorscher E, Elton TS, Abrahamson DR, Kirk KL. Expression and polarized targeting of a rab3 isoform in epithelial cells. J Cell Biol. 1994;125:583–594. doi: 10.1083/jcb.125.3.583. [DOI] [PMC free article] [PubMed] [Google Scholar]
- 51.Woll E, Gschwentner M, Furst J, Hofer S, Buemberger G, Jungwirth A, Frick J, Deetjen P, Paulmichl M. Fluorescence optical measurements of chloride movements in cells using the membrane permeable dye diH-MEQ. Pflügers Arch. 1996;432:486–493. doi: 10.1007/s004240050160. [DOI] [PubMed] [Google Scholar]
- 52.Yu X, Schwartz RD. Optical imaging of intracellular chloride in living brain slices. J Neurosci Methods. 1995;62:185–192. doi: 10.1016/0165-0270(95)00075-5. [DOI] [PubMed] [Google Scholar]
- 53.Zhang H, Kelly G, Zerillo C, Jaworski DM, Hockfield S. Expression of a cleaved brain-specific extracellular matrix protein mediates glioma cell invasion in vivo. J Neurosci. 1998;18:2370–2376. doi: 10.1523/JNEUROSCI.18-07-02370.1998. [DOI] [PMC free article] [PubMed] [Google Scholar]