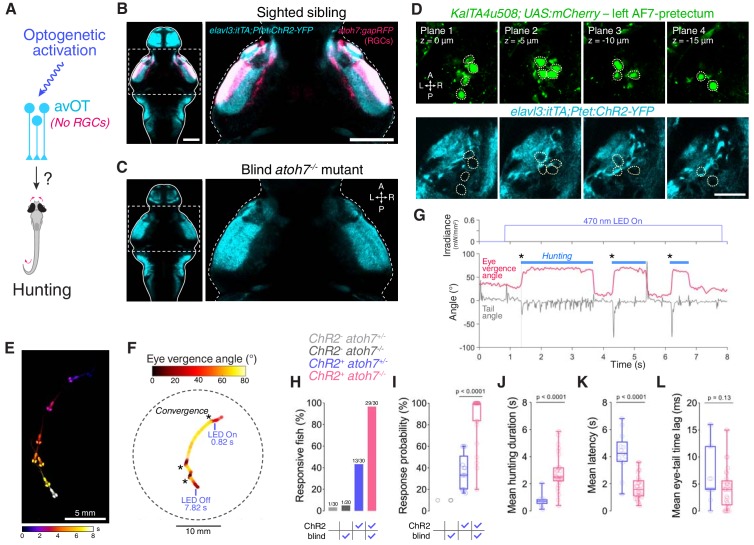
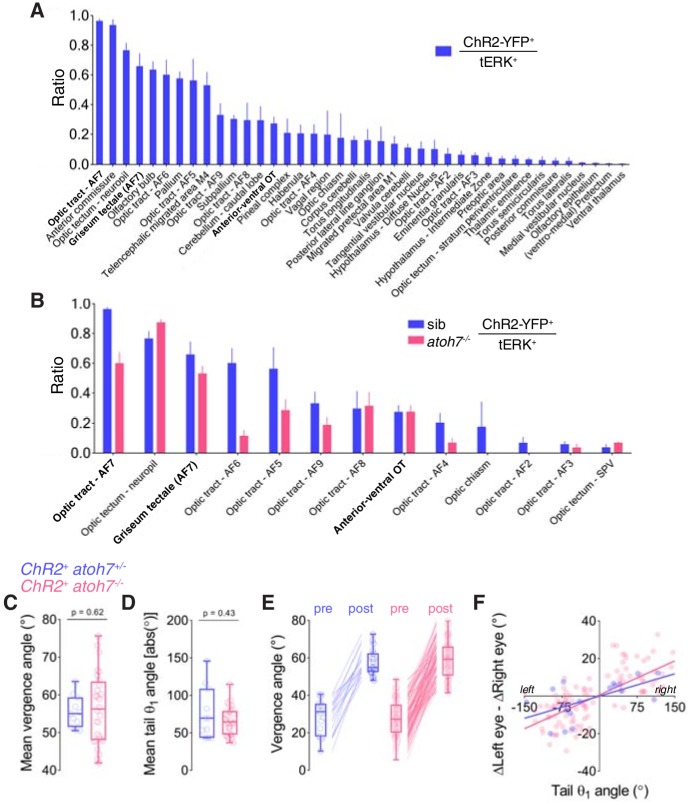
Figure 7. Optogenetic stimulation of avOT induces hunting in the absence of RGCs.
(A) Optogenetic stimulation of anterior-ventral optic tectum (avOT). (B–C) Dorsal view of ChR2-YFP expression in sighted (B) and blind atoh7-/- (C) 6 dpf elavl3:itTA;Ptet:ChR2-YFP;atoh7:gapRFP larvae registered to the ZBB brain atlas. Axonal projections of RGCs labelled by the atoh7:gapRFP transgene are displayed in magenta and are absent in atoh7-/- larvae. Images derive from median datasets across multiple immunostained brains (N = 6 sibling and N = 7 blind fish) and show maximum-intensity projections through focal planes encompassing AF7-pretectal regions. (D) ChR2 expression relative to KalTA4u508 neurons in a 6 dpf KalTA4u508;UAS:mCherry;elavl3:itTA;Ptet:ChR2-YFP larva. Images are single focal planes obtained from the left AF7-pretectum (plane one is dorsal relative to the other z-planes). KalTA4u508 neurons are not labelled with ChR2-YFP. (E) Time sequence composite image showing selected frames from an example optogenetically induced hunting sequence in a blind atoh7-/- 6 dpf elavl3:itTA;Ptet:ChR2-YFP;atoh7:gapRFP larva (see also Video 3). (F) Vergence angle overlaid onto larval location during the optogenetically induced hunting sequence from (E). Asterisks indicate time of convergent saccades. (G) Tail angle (grey) and ocular vergence angle (red) during the optogenetically induced hunting sequence shown in (E) and (F). Asterisks indicate time of convergent saccades. (H) Fraction of larvae that performed eye convergences during optogenetic stimulations. Larvae were either sighted (atoh7+/+ or atoh7+/-) or blind (atoh7-/-) and either opsin-positive (elavl3:itTA;Ptet:ChR2-YFP;atoh7:gapRFP) or opsin-negative (atoh7:gapRFP). Numbers of responsive larvae are reported above bars. (I) Response probability of larvae that performed eye convergence in at least one optogenetic stimulation trial. (J–L) Behavioural kinematics for optogenetically induced hunting events elicited in sighted (blue, N = 13 fish) and blind atoh7-/- (pink, N = 29) elavl3:itTA;Ptet:ChR2-YFP;atoh7:gapRFP larvae. Scale bars, 100 µm, except in (D), 30 µm. A, anterior; L, left; P, posterior; R, right. See also Figure 7—figure supplement 1 and Video 3.


