Abstract
Our aim was to determine differences in thermal comfort during simulated one-day parcel home delivery between summer and winter. Six young healthy males performed experiments in summer (up to 31°C) and winter (up to 8°C). After baseline measurement in a chamber, subjects drove a truck to a prespecified location for outside measurements. They performed 4 sets of 100-m walk with carrying 5-kg plate during the first 50-m walk at 100 m/min, separated by 7-min driving in each of the morning and the afternoon. Subjects could ingest water ad libitum in outside and set the cockpit temperature by themselves during driving. Thermal sensation and comfort were recorded using a subjective scale at the first and the last sets of each morning and afternoon session, while esophageal temperature (Tes) was monitored (thermocouples). Body weight was measured before and the end of experiment. We found that 1) whole-body comfort decreased in summer and the decrease was greater than winter with higher Tes and 2) changes in body weight were 0.7 and 0.3 kg through whole day in summer and winter, respectively. In summary, thermal comfort during working worsened in summer, possibly related with higher core temperature and greater decrease in body weight.
Keywords: Perception, Hydration, Hyperthermia, Heat, Cold
Introduction
The “home-delivery service” has shown dramatic development in recent years. The total caseload per year was about 4 billion in 2016; 3.4 times as 25 yr ago1). The number of workers for the drivers in the leading 3 companies in Japan was about 210,0002). The parcel home-delivery worker repeats a short walk between the cargo truck and each house or office during working hours each day throughout the year, carrying at least one package. Outside the delivery truck, a worker is exposed to various external environments; such as heat and cold, which could be an additional physical strain for the workers in summer and winter, respectively, although the cockpit of the cargo truck during delivery work is likely to be set as comfortable in the both seasons.
Thermal perception could be used as an index of mental and physical strain, while it often plays a role in initiating heat- or cold-escape behavior, so-called behavioral thermoregulation3). Thermal perception is divided into two categories; “thermal sensation” and “thermal comfort”3, 4). Thermal sensation is information from the skin surface where temperature changes are dependent on the external environment5). On the other hand, thermal comfort is a psychological state that represents satisfaction with a surrounding environment6) and is influenced primarily by skin wittedness resulted from sweat secretion7) as well as by changes in both skin and core temperatures3, 5). Thus, recognition of thermal comfort during working by the workers themselves can possibly provide useful information, which helps to prevent them from health injuries; such as heat stroke in summer8) and asthma, bronchitis, as well as hypothermia in winter9). However, there is no information about thermal comfort between summer and winter during parcel-home delivery, not even a simulation of a home-delivery routine for one day was performed.
Thermal comfort may be influenced by non-thermal factors, such as dehydration, which is known to accelerate fatigue sensation10), an increase in core temperature during exercise11). A decrease in body weight is used as an index of the net loss of body fluid under the same measurement conditions and depends on the balance between intake; water or food, and output; i.e., the amount of sweat and/or urine volume. Especially in summer, larger amount of sweat can induce dehydration; a greater net loss of body weight would be observed, if the fluid intake is not adequate even in a situation that one could do ad libitum.
The purpose of the present study was to examine whether changes in thermal comfort during simulated one-day parcel home delivery would be altered between summer and winter and to investigate factors that influence changes in thermal comfort. The tested hypotheses were that 1) whole-body thermal comfort would vary between summer and winter, while 2) an increase in body core temperature would be higher in summer and 3) a decrease in body weight would be greater in summer than those in winter.
Subjects and Methods
Subjects
Six healthy male subjects free of diabetes mellitus and neurological, cardiovascular, and respiratory disorders and not taking any medications, volunteered to participate in this study. They were 31 (7) yr old [mean (SD)], 173.7 (5.4) cm tall, with 66.3 (8.1) kg body weight [15 (6)% body fat] in the summer trial, August 2014 (S). All participants repeated the same trial also in January 2015 (W). The S and W trials were conducted at the same time of the day to avoid any effect of the circadian rhythm on the measurements. Informed consent was obtained from all participants. The purpose of the study was explained in detail to each subject, including possible risk factors. This protocol conformed to the guidelines of the Declaration of Helsinki and was approval by the Ethics Committee of Wakayama Medical University (No. 1292).
Experimental protocol
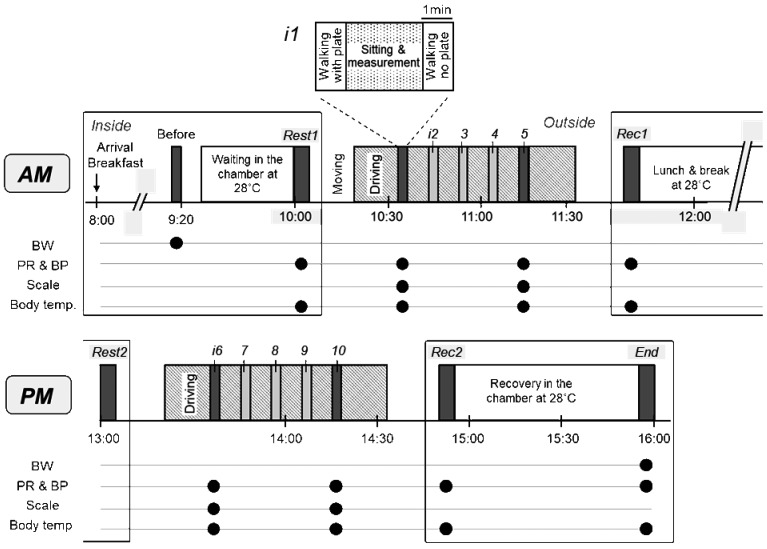
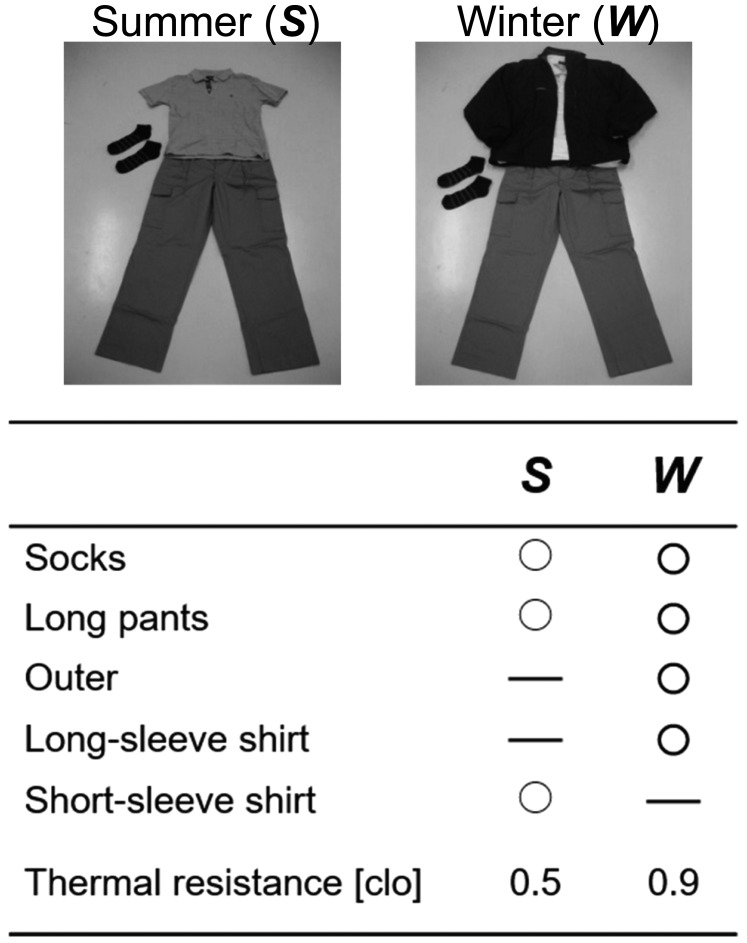
The protocol involved measurement procedure both in an artificial chamber placed in the laboratory as well as the outside. The study was set to simulate the home-parcel delivery, although it did not represent completely an actual daily work-shift, including four sets of deliveries separated by about 7-min driving in both the morning and afternoon, i.e., total 8 sets (Fig. 1). All subjects were asked to refrain from heavy exercise the day before the study and from alcohol and caffeine after 22:00 the day before the study but were invited to drink tap water ad libitum. Subjects reported to our laboratory at 08:00 and provided with breakfast (2 buns and milk with total 329 kcal; 40.5 g carbohydrate, 13.2 g protein, 12.6 g fat, and 0.35 g sodium), which we prepared. After voiding, the body weight was measured (BC-118E, TANITA, Tokyo, Japan) before entering the chamber at 28°C atmospheric temperature (Ta) and 40% relative humidity (RH). Subjects with dressed in a cotton short and pants sat on a chair for up to 60 min while all devices for measuring esophageal temperature (Tes), skin temperature, pulse rate (PR), and blood pressure were applied. After confirming that Tes subsided after initial increase due to postprandial thermogenesis, and under stable skin temperature, baseline measurements were recorded before driving and working (Rest1). The subjects changed their clothes, wearing pants and short sleeve collar shirts and socks, as shown in Fig. 2, and left the chamber at around 10:00.
Fig. 1.
Study protocol. Before: time for breakfast; Rest1: baseline measurements before walking into the chamber; i1-5: intervals between 100-m walks in the morning (AM); Rec1: time after the morning session in the chamber; Rest2: measurements before the afternoon session; i6-10: intervals between 100-m walks in the afternoon (PM); Rec2: time after the afternoon session in the chamber; End: recovery measurements. BW: body weight; PR: pulse rate; BP: blood pressure; Scale: time point for reporting thermal sensation and comfort.
Fig. 2.
Clothes worn in the present simulation study in summer (S) and winter (W).
The subjects drove the truck to the place where the outside measurement was conducted. They were allowed to turn up/down the truck interior temperature and set the flow rate of the air conditioning system to comfortable level. Subjects parked the truck near the pre-selected location (a tent) at around 10:15, where outside measurements were performed. In the W trials, a sharp increase in Tes was expected when subjects moved from the chamber or inside (up to 28°C) to outside (up to 7°C), e.g. before getting on a cargo truck at the building where the laboratory was located. The increase would be transient and explained by a change in re-distribution of body temperature from skin to core, which was mediated by cutaneous vasoconstriction as shown by Young et al12).
First, they made a 100-m round walk at a velocity of up to 100 m/min between the tent and a marker (a cone), which was placed 50 m away from the tent, while carrying 5-kg plate, then systolic (SBP) and diastolic blood pressures (DBP) and PR were measured while the subject was seated after 2-min rest and thermal sensation and comfort were rated on subjective scales. The reason why we chose 5 kg was that it was averaged value of which a delivery worker carried in the hand. Next, they walked back to the cone again without carrying the plate, at the same velocity, and then returned to the truck. The procedure was repeated 4 times, intermitted by about 7-min driving around the place. Then subjects drove back to the laboratory and re-entered the chamber after changing the cotton shorts, and the same measurements as Rest1 were repeated for recovery in the morning session (Rec1). Subjects were given two packs of jellies for lunch (360 kcal; 90 g carbohydrate, 0 g protein and fats, and 0.86 g sodium), and rested for 60 min in the chamber, while the same measurements as Rest1 were performed (Rest2). They drove again to the same location for outside measurements and repeated the same protocol as before lunch. After driving back to the chamber, the subjects underwent the same measurements as Rec1, served as recovery of the afternoon session (Rec2). Finally, the same variables as Rest1 were measured, while they rested in the chamber for 60 min (End). At the last, subjects weighted after voiding. Subjects could drink tap water ad libitum during the study except for the measurement periods at Rest1, Rec1, Rest2, Rec2, and End.
Measurements
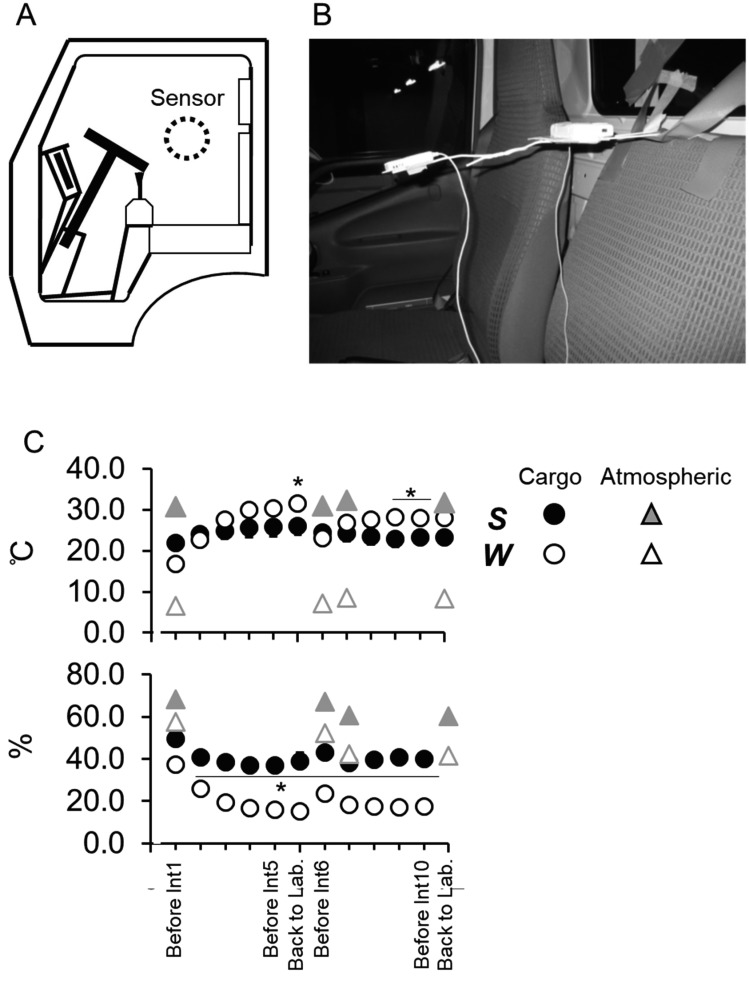
Environmental conditions: Ta, RH, duration of sunshine and wind speed during outside measurements were obtained from the meteorological record of Japan Meteorological Agency during the same period on the day of the study at Wakayama. A cockpit temperature (Tcargo) and relative humidity (RHcargo) were monitored at the center of the cockpit by a thermistor and a hygro sensor with polymer membrane, respectively (Ondotori TR-72wf, T&D, Matsumoto, Japan; Fig. 3-A, B). Tcargo and RHcargo are averaged during each driving period (Fig. 3-C).
Fig. 3.
Measurement for environmental conditions in the cockpit in summer (S) and winter (W). A place to measure it by a thermistor and a hygro sensor are represented as an illustration (A) and a picture (B). C: Temperature (upper) and relative humidity (lower panel) in the cockpit and atmospheric air, which were adapted as the data in Wakayama city announced from Japan Meteorological Agency, are shown as a figure. Values are means (SE) for 6 subjects. *Significant differences between S and W at the level of p<0.05.
Body temperature: Tes was monitored with a thermocouple in a polyethylene tube (PE-90). The tip of the tube was advanced through the external nares into the esophagus, to a distance equivalent to 25% of the subject’s standing height. Skin surface temperature was measured at the forehead, chest, forearm, dorsum of the hand, anterior thigh, calf, and dorsum of the foot and mean skin temperature (Tsk) was determined as:
Tsk = 0.072 Tfh + 0.355 Tch +0.154 Tfa + 0.049 Tdh + 0.187 Tth + 0.116 Tcf + 0.067 Tft, where Tfh, Tch, Tfa, Tdh, Tth, Tcf and Tft are skin surface temperatures at the forehead, chest, forearm, dorsum of the hand, anterior thigh, calf and dorsum of the foot, respectively13). Data of all 8 channels were recorded from Rest1 to End by using two portable loggers (LT6A, Gram, Saitama, Japan) every 30 s.
Thermal sensation and comfort: The subjects were asked to report thermal sensation and comfort verbally 4 times; the first and last set of outside measurements in the morning and afternoon. Thermal sensation and comfort were measured on a seven-point ASHRAE scale and ranged from −3 (“cold” or “extremely uncomfortable”) to +3 (“hot” or “very comfortable”); 0 indicated “neutral”4) for the face, trunk, upper extremities, dorsum of the hand, thigh, calf, and dorsum of the foot. We calculated the mean scale for whole-body surface as a representative value, taking into consideration the ratio of each part to the total body surface area, as described above13).
Cardiovascular variables: SBP, DBP, and PR were measured by the brachial oscillometric method using a sphygmomanometer (28CN05, TERUMO, Tokyo) on the right arm while the subject was seated after 2-min rest at each set of walking as described above. Pulse pressure (PP = SBP−DBP) and MAP (= PP/3 + DBP) were calculated.
Statistical analysis
The subjective scales on body areas were analyzed by Wilcoxon’s sign test (Table 1). Two-way [2 within (Season) × (Time)] ANOVA for repeated measurements was used for environmental conditions, body weight, cardiovascular responses, body temperature, and whole-body perception (Table 2, Figs. 3-C and 4-A, B). Subsequent post-hoc tests to determine significant differences in various pairwise comparisons were performed using the Tukey-Kramer test. Simple linear regression analysis was adopted to analyze the relationship between thermal sensation and comfort (Fig. 4-C), changes (Δ) in body temperatures (Tsk and Tes) from Rest1 at i1, i5, i6, and i10, and Δthermal perceptions (sensation and comfort; Fig. 6) from the value at the 1st reported. A pared t-test was used for testing a difference in Δbody weight between the seasons (Fig. 7). Assuming that main effects of d (=|μ1−μ2|/SD) for the variables within subjects were 1.5 and statistical power (1−β) were >0.80 on ΔTes, Δbody weight at α of 0.05 could determine that sample size was 6. The null hypothesis was rejected when p was <0.05. All values are expressed as means (SE) for 6 subjects in each season except where noted.
Table 1. Scale values of thermal sensation and comfort during simulation of home-delivery work.
| i1 | i5 | i6 | i10 | |||
|---|---|---|---|---|---|---|
| Sensation | Forehead | S | 0 (0–2) | 2 (0–2) | 1 (0–2) | 1.5 (0–3) |
| W | −0.5 (−3–0) | −0.5 (−1–0)* | 0 (−2–0) | 0 (−1–0)* | ||
| Cheek | S | 0.5 (0–2) | 2 (0–2) | 1 (0–2) | 2 (0–3) | |
| W | −1.5 (−3–0)* | −1 (−2–0)* | −0.5 (−2–0) | 0 (−1–0)* | ||
| Neck | S | 1 (0–2) | 2 (1–3) | 1 (0–2) | 2 (1–3) | |
| W | −1 (−1–0) | −0.5 (−2–0) | 0 (−1–1) | 0 (−2–0) | ||
| Chest | S | 0.5 (0–2) | 2 (1–3) | 1.5 (0–2) | 2.5 (0–3) | |
| W | −0.5 (−1–0) | −0.5 (−1–1)* | 0 (−1–0)* | 0 (0–1)* | ||
| Back | S | 0.5 (0–2) | 2 (1–3) | 1 (0–2) | 2.5 (0–3)# | |
| W | 0 (−1–0) | −0.5 (−1–1)* | 0 (−1–0)* | 0 (0–1)* | ||
| Abdomen | S | 0 (0–2) | 2 (1–3) | 0.5 (0–2) | 2 (0–3)# | |
| W | 0 (−1–0) | −0.5 (−1–0)* | 0 (−1–0) | 0 (0–1)* | ||
| Upper arm | S | 0 (0–1) | 1.5 (0–2) | 1 (0–2) | 2 (0–3)# | |
| W | 0 (−1–0) | 0 (−1–0)* | 0 (−1–0) | 0 (−1–1)* | ||
| Forearm | S | 0 (0–1) | 2 (0–2) | 1 (0–2) | 2 (0–3) | |
| W | −0.5 (−2–0) | −1 (−1–0)* | 0 (−2–0) | 0 (−1–0)* | ||
| Dorsal hand | S | 0 (0–1) | 1 (0–2) | 1 (0–2) | 1.5 (0–3) | |
| W | −2 (−3–0)* | −2 (−3–0)* | −0.5 (−2–0) | −1 (−1–0)* | ||
| Thigh | S | 1 (0–2) | 2 (2–3) | 1.5 (0–2) | 2.5 (2–3)# | |
| W | −1 (−2–0)* | −1 (−1–0)* | 0 (−1–0)* | −0.5 (−2–0)* | ||
| Calf | S | 0.5 (0–1) | 2 (2–3)# | 1 (0–2) | 2 (0–3) | |
| W | −1.5 (−2–0)* | −1 (−2–0)* | −0.5 (−1–1)* | −1 (−1–0)* | ||
| Dorsal foot | S | 1 (0–1) | 2 (2–3)# | 1 (0–2) | 2.5 (1–3)#$ | |
| W | −0.5 (−2–0)* | −1 (−1–0)* | −0.5 (−1–0)* | 0 (−1–0) * | ||
| Comfort | Forehead | S | 0 (−1–0) | −1 (−1–2) | −1 (−2–0) | −1 (−2–0) |
| W | 0 (0–0) | −0.5 (−1–0) | 0 (−1–0) | 0 (−1–0) | ||
| Cheek | S | 0 (−1–1) | −1 (−1–2) | −1 (−2–0) | −1 (−2–0) | |
| W | −1 (−1–0) | −0.5 (−2–0) | 0 (−1–0)* | 0 (−1–0) | ||
| Neck | S | 0 (0–2) | −1 (−2–2) | −1 (−2–0) | −2 (−2–0)# | |
| W | −1 (−1–0)* | −0.5 (−2–0) | 0 (−1–0) | 0 (−1–0)* | ||
| Chest | S | 0 (−1–2) | −1 (−2–3) | −0.5 (−2–0) | −2 (−2–0) | |
| W | 0 (−1–0) | 0 (−1–0) | 0 (−1–0) | 0 (−2–0) | ||
| Back | S | 0 (0–2) | −1 (−2–3) | −1 (−2–0) | −1.5 (−3–0)# | |
| W | 0 (−1–0) | −0.5 (−1–0) | 0 (−1–0)* | 0 (−2–0) | ||
| Abdomen | S | 0 (0–2) | −1 (−1–3) | −0.5 (−2–0) | −1.5 (−2–0)# | |
| W | 0 (0–0) | −0.5 (−1–0) | 0 (−1–0) | 0 (−2–0) | ||
| Upper arm | S | 0 (0–1) | −0.5 (−2–2) | −0.5 (−1–0) | −1.5 (−2–0)# | |
| W | 0 (−1–0) | −0.5 (−1–0) | 0 (−1–0) | 0 (−2–0) | ||
| Forearm | S | 0 (0–1) | −0.5 (−1–2) | −0.5 (−1–0) | −1 (−2–0) | |
| W | 0 (−1–0) | −0.5 (−2–0) | 0 (−1–0) | 0 (−2–0) | ||
| Dorsal hand | S | 0 (0–0) | 0 (−2–2) | −0.5 (−1–0) | −1 (−2–0) | |
| W | −1.5 (−2–0) | −1.5 (−2–0) | −1 (−2–0) | −0.5 (−2–0) | ||
| Thigh | S | 0 (−1–2) | −1 (−2–3) | −1 (−2–0) | −2 (−3–1)# | |
| W | −0.5 (−1–0) | −0.5 (−1–0) | −0.5 (−1–0) | 0 (−2–0)* | ||
| Calf | S | 0 (0–1) | −1 (−2–2) | −1 (−2–0) | −2 (−2–0)# | |
| W | −1.5 (−2–0)* | −1 (−2–0) | −0.5 (−2–0) | −1 (−2–0)* | ||
| Dorsal foot | S | 0 (0–0) | –1.5 (−3–2) | −1 (−2–0) | −2 (−3–1)# | |
| W | 0 (−2–0) | −1 (−1–0) | −0.5 (−1–0) | −0.5 (−1–0)* | ||
Thermal sensation and comfort on the 12 sites of the body are shown as medians and a range of minimum and maximum for 6 subjects at rest just after 1st (i1), 5th (i5), 6th (i6) and 10th (i10) walking with 5-kg plate, respectively. *A significant difference between summer (S) and winter (W); #from i1 at the level of p<0.05.
Table 2. Cardiovascular responses and body temperature during simulation of daily home-delivery work in summer and winter.
| AM | PM | |||||||||
|---|---|---|---|---|---|---|---|---|---|---|
| Rest1 | i1 | i5 | Rec1 | Rest2 | i6 | i10 | Rec2 | End | ||
| PR (pulses/min) | S | 74 (3) | 78 (3) | 75 (2) | 76 (3)¶ | 81 (3) | 88 (3) | 82 (3) | 80 (3) | 74 (3)¶ |
| W | 75 (4) | 73 (1) | 71 (2) | 73 (2) | 77 (3) | 77 (2) | 77 (3) | 74 (2) | 72 (3) | |
| SBP (mmHg) | S | 130 (6) | 126 (7) | 119 (4) | 123 (6) | 125 (7) | 126 (8) | 128 (5) | 126 (4) | 129 (6) |
| W | 121 (6) | 118 (4) | 123 (5) | 115 (4) | 115 (4) | 129 (5) | 122 (6) | 114 (3)* | 108 (5)* | |
| DBP (mmHg) | S | 70 (5) | 71 (5) | 65 (4) | 71 (3) | 70 (4) | 74 (4) | 69 (2) | 74 (3) | 68 (3) |
| W | 73 (5) | 76 (4) | 72 (4) | 68 (4) | 67 (3) | 72 (4) | 70 (6) | 69 (5) | 65 (3) | |
| PP (mmHg) | S | 60 (2) | 55 (3) | 55 (4) | 52 (5) | 55 (4) | 52 (7) | 59 (4) | 52 (3) | 61 (6) |
| W | 48 (2)* | 43 (2)* | 51 (3) | 47 (5) | 48 (3)* | 57 (3) | 52 (6)* | 44 (3)* | 43 (5)* | |
| MAP (mmHg) | S | 90 (5) | 89 (5) | 83 (4) | 88 (3) | 88 (5) | 92 (5) | 89 (2) | 91 (3) | 88 (3) |
| W | 89 (5) | 90 (4) | 89 (4) | 84 (3) | 83 (3) | 91 (4) | 87 (6) | 84 (4) | 79 (2) | |
| Tsk (°C) | S | 34.1 (0.3) | 34.2 (0.5) | 34.3 (0.6) | 33.6 (0.4) | 34.0 (0.4) | 34.6 (0.5) | 34.5 (0.7) | 33.7 (0.3) | 34.0 (0.3) |
| W | 34.0 (0.1) | 32.0 (0.2)*# | 33.7 (0.3) | 33.1 (0.2) | 34.2 (0.1) | 33.5 (0.3) | 34.4 (0.1) | 33.5 (0.2) | 33.5 (0.2) | |
| Tes (°C) | S | 37.0 (0.1) | 37.6 (0.1)# | 37.3 (0.1) | 37.5 (0.1)# | 37.2 (0.1) | 37.4 (0.1)# | 37.4 (0.1)# | 37.4 (0.1)# | 37.1 (0.2) |
| W | 36.7 (0.1)* | 37.9 (0.2)# | 37.0 (0.3) | 36.6 (0.3)* | 36.8 (0.1) | 37.5 (0.2)#$ | 37.1 (0.2) | 37.0 (0.2) | 36.9 (0.1) | |
Values are mean (SE) for 6 subjects during the simulation of home-delivery tasks in summer (S) and winter (W). PR: pulse rate; SBP & DBP: systolic and diastolic blood pressure; PP: pulse pressure; MAP: mean arterial pressure; Tes & Tsk: esophageal and mean skin temperatures; AM: morning; PM: afternoon; Before: 80 min after breakfast and before first entry to the chamber in the morning; Rest1 & 2: at rest in the chamber just before driving the truck in AM and PM, respectively; i1, 5, 6, & 10: at rest just after 1st, 5th, 6th and 10th walking with 5-kg plate, respectively; Rec1 & 2: recovery just after returning to the laboratory in AM and PM, respectively; End: at the end of experiment. *A significant difference between S and W; #relative to Rest1; $relative to Rest2; §relative to Before; ¶relative to i6 at the level of p<0.05.
Fig. 4.
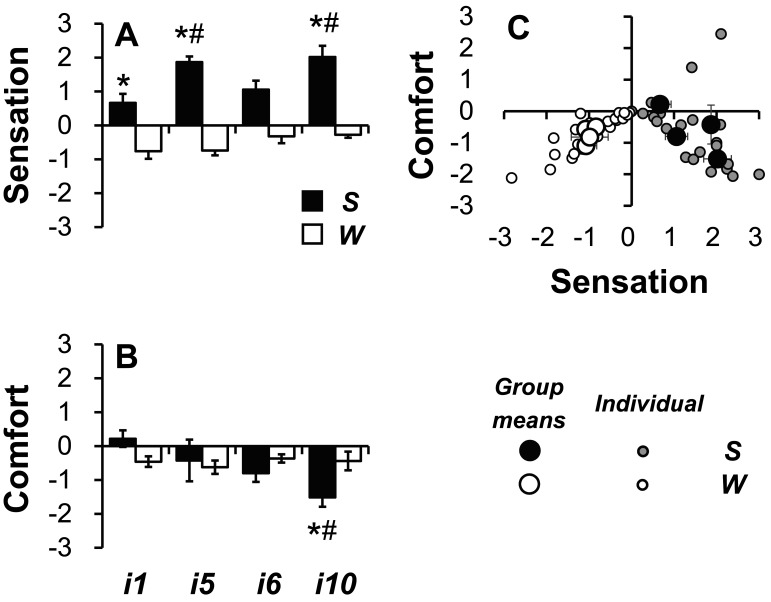
Thermal sensation (A) and comfort (B) during the simulation in summer (S) and winter (W) and relationship between sensation and comfort (C). i1 and 5, 1st and 5th intervals between the 100-m walks in the morning; i6 and 10, 1st and 5th intervals between the 100-m walks in the afternoon. Bars and large circles and error bars are shown as means (SE) (A, B, & C). Solid bars and circles indicate as S and open ones are represented as W. Small circles represent data of individual subjects (C). *Significant differences between S and W; #from i1 at the level of p<0.05.
Fig. 6.
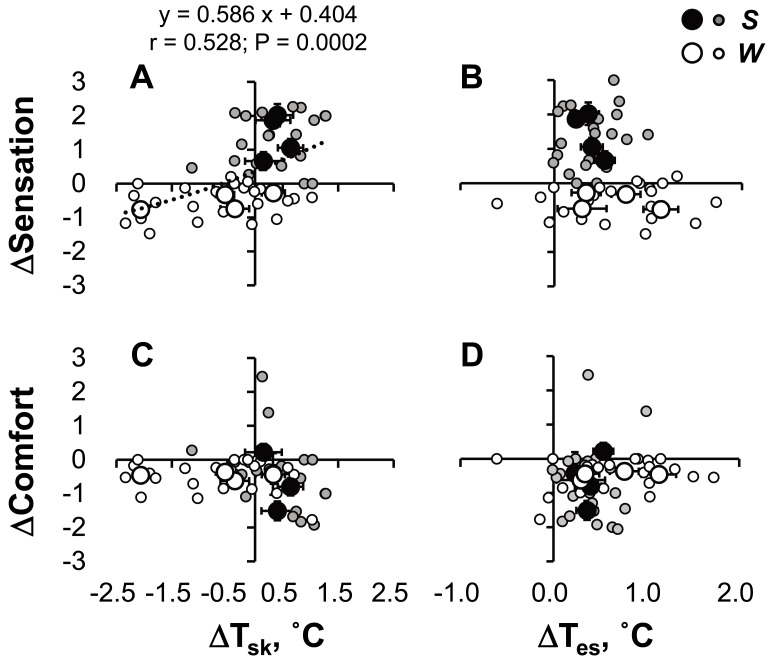
Relationship between changes in body temperature and thermal perception. Thermal sensation at a given change (Δ) in mean skin temperature (Tsk; A), Δesophageal temperature (Tes; B), and thermal comfort at a given ΔTsk (C) and ΔTes (D). A significant correlation was found only in A (r=0.528; p=0.0002).
Fig. 7.
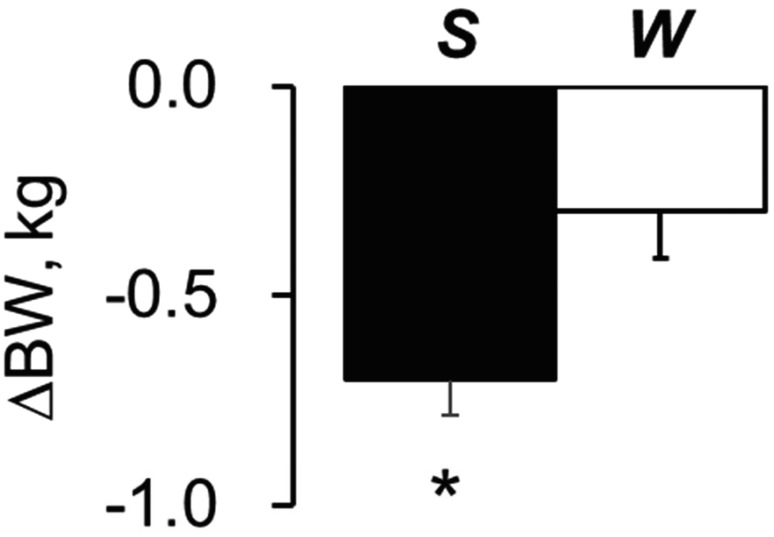
Changes (Δ) in body weight (BW) throughout the day. *Compared with the data in W at the level of p<0.05. S: summer; W: winter.
Ethical approval
All procedures performed in studies involving human participants were in accordance with the ethical standards of the institutional and/or national research committee and with the 1964 Helsinki declaration and its later amendments or comparable ethical standards.
Results
Ta and RH were up to 31°C and up to 65% in S and significantly higher than that of up to 7°C and up to 50% in W, respectively (p<0.0000001; Fig. 3-C). Tcargo and RHcargo before the onset of the 1st set were 21.8°C and 49% in S, similar to that in W, but was up to 7°C lower in the last phase of each morning and afternoon session and 15–25% higher in S than that in W, respectively (All p<0.041; Fig. 3-C). Averaged air velocity during outside measurements on each day of the study were up to 8.0 and up to 3.0 m/s and duration of sunshine were 227 and 237 min for 4 h; from 10:00 to 12:00 and from 13:00 to 15:00, in S and W, respectively.
Whole-body thermal sensation was higher in S than W at i1, i5, i6, and i10 (p=0.021, 0.00032, 0.0165, and 0.0022, respectively) and significantly increased at i5 and i10 from i1 in S (p=0.0023) but remained unchanged in W (Fig. 4-A). Whole-body thermal comfort at i1 was similar between the seasons (p=0.064), significantly decreased at i10 only in S (p=0.026), which was lower than that in W (p=0.013; Fig. 4-B), with interactive effects of Season × Time for thermal sensation and comfort (p=0.023 and 0.0089, respectively). Patterns of subjective comfort on the trunk and lower extremities were similar to that of whole-body comfort (Table 1). As shown in Fig. 4-C, even there was no significant correlation between thermal sensation and comfort (r=0.460; p=0.696), most data points in S and W were in the fourth and the third quadrants, respectively.
As shown in Table 2, PR response was similar between S and W, with no interactive effect of Season × Time (p=0.065)]. Tsk in S at Rest1 was 34.1°C, similar to W, there were no significant changes from Rest1 throughout experiment. Tsk in W significantly decreased by 2.0°C from Rest1 to i1, and lower than that in W with an interactive effect of Season × Time (p=0.003), although no differences between the seasons from i5. Tes was 37.0°C before the onset of simulation and 0.3°C higher than that in W (p=0.041). Tes increased by 0.4°C at the last set in S. The increase in Tes tended to be 0.1–0.5°C higher in S than W, except for i1, with an interactive effect of Season × Time (p<0.0001). Even a significant increase in Tes by 0.8°C from Rest1 to i1 in W, which was higher than S, the increase was transient. The increase involved a change in re-distribution of body temperature between core and skin after exposed in acute cold condition at i1 in W (see “Discussion”)14).
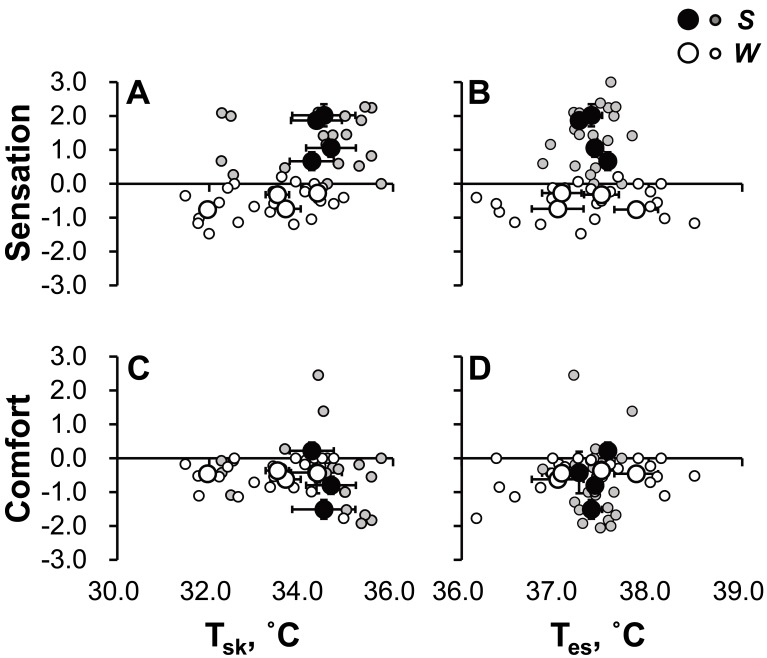
Significant correlations were not observed between Tsk or Tes and thermal perspirations (Fig. 5). There was a significant correlation between thermal sensation and ΔTsk; differences (r=0.528, p=0.0002; Fig. 6-A), but not between thermal sensation and ΔTes (r=0.169, p=0.251; B), comfort and ΔTsk (r=0.172, p=0.266; C) and ΔTes (r=0.111, p=0.454; D).
Fig. 5.
Relationship between body temperature and thermal perception. Thermal sensation at a given mean skin temperature (Tsk; A), esophageal temperature (Tes; B), and thermal comfort at a given Tsk (C) and Tes (D).
Body weight before the morning session in S was similar to that in W (p=0.967) and was similar between seasons (p<0.743) but decreased by 0.7 and 0.3 kg through experiment in S (p=0.0004) and W (p=0.045), respectively, with an interactive effect of Season × Time (p=0.018; Fig. 7). Δthermal comfort (i10−i1) tended to correlate to ΔBW (End−Rest1; r=0.516, p=0.086).
Discussion
In the present study, we compared the subjective scales of thermal sensation and comfort in summer and winter during simulated one-day parcel home delivery service, while measuring body temperature and a net change in body weight. Our results showed that 1) whole-body thermal comfort at the last set of simulation worsened more in summer than winter, 2) an increase in Tes at the last set from the baseline was by 0.4°C and tended to be higher in summer than winter with a significant interactive effect of Season × Time (p<0.0001), 3) a decrease in body weight at the end of study was greater in summer (−0.7 kg) than winter (−0.3 kg), and 4) a decrease in whole-body thermal comfort tended to be greater for subjects with greater decrease in body weight (r=0.516, p=0.086).
As reported previously3), increases in both Tes and Tsk likely reduced whole-body comfort. Indeed, we found that Tes simultaneously increased by 0.4°C at i10 from Rest1 in S, and tended to be higher in S than W. However, there was no significant correlation between ΔTes and comfort during the one-day simulation in both seasons (Fig. 6-B). The reason why changes in Tes did not correlate with thermal comfort was probably that Tes was influenced by behavior based on thermal comfort and/or sensation, i.e., through changes in the environment temperature in the cockpit. Thus, changes in Tes could be masked.
The decrease in body weight represented net losses of body fluid involving sweat, insensible perspiration, and urine, regardless of an amount of water intake in subjects. As body weight was measured after voiding completely and resting in a comfortable condition (Ta=up to 28°C) at least 60 min every time, a shift of body fluid was stabilized when subjects weighted. Therefore, the reduction in body weight suggested a loss of body fluid, even we did not weight an amount of water intake.
In general, the critical level of dehydration that can influence cardiovascular and thermoregulatory responses is >2% water deficit of body weight15). About −0.4% of the initial body weight in S was not sever as a level of hydration, it remained unknown how the mild dehydration influences thermal comfort. Only a few studies assessed the relationship between hydration state and thermal comfort during exercise or work and mild dehydration possibly influences thermal perception in humans. Tokizawa et al. showed that thermal perception could be influenced by up to 1% of dehydration, which was induced in their study by 50-min cycling at 35°C, without any differences between core and skin temperatures, although how hypovolemia and plasma hyperosmolality in dehydrated condition could have influenced the sensation remained unknown16). The same group showed in a subsequent study that +8 mOsmol/kgH2O increase in plasma osmolality was associated with a decrease in thermal sensation during passive heating in sedentary and trained young males17). Their results suggested that since plasma hyperosmolality influenced thermal sensation rather than comfort, dehydration itself would not induce behaviors for thermoregulation in the heat. The experimental period in their study was different from the present study; between 50-min of exercise and whole-day simulation in the present study and plasma hyperosmolality itself suppresses sweating responses in hyperthermia8, 18) resulting in reducing skin wetness which possibly induces thermal discomfort7). Therefore, it remains argued whether dehydration could influence thermal comfort.
Moyen et al. reported previously that dehydration over 1.022 of urinary specific gravity decreased vigor and increased fatigue more than euhydration (urinary specific gravity ≤1.018) in 119 participants during 161-km ultra-endurance cycling, and that urinary specific gravity correlated negatively with vigorous sensation and positively with fatigue sensation10). The comparison between the present study and the 161-km cycling study may not be appropriate, because energy expenditure and duration of exercise were totally different; the mean PR and Tes during the simulation in the present study were 70−90 beats/min and 37.0−37.6°C in summer, respectively (Table 1). However, since the change in urine specific gravity from 1.018 to 1.022 could correspond to 4% dehydration19), dehydration itself could worsen the increase in fatigue sensation.
A decrease in body weight enhances an increase in core temperature during walking in a hot environment11), because heat balance may shift towards heat production due to the suppression of cutaneous vasodilation and sweating responses by dehydration18). Hyperthermia and dehydration could influence each other, resulting in increasing physical strain and possibly contributing fatigue sensation. The increase in PR in S tended to be higher than in W during the afternoon (Table 2), suggesting that physical strain during one-day simulation was greater in S afternoon than W afternoon. Thus, a possibility that higher increases in Tes worsened thermal comfort is not completely negated, although the change in Tes did not correlate with thermal comfort. Furthermore, the greater change in thermal comfort in S was partially explained by the higher Tes due to the larger loss of body fluid.
We evaluated a net loss of body fluid as an index of hydration state. Since the cloth cotton material can absorb sweat, a procedure of measuring body weight needed to be performed carefully. Subjects weighted with wearing a cotton short and pants in the present study. The weight of a dry cotton shirt is up to 50 g and assuming that the absorption rate was 120%20) then the weight of the shirt after sweat absorption would be up to 110 g at maximum. The sensitivity of the weighing scale was 0.1 kg. Moreover, body weight was measured at least 1 h later at the end of the recovery period, suggesting that sweat absorbed in the short and the pants could be evaporated some. Thus, the error in the measured change in body weight due to sweating would be small.
Calculations of whole-body thermal sensation and comfort in the present study were not irrelevant. Cotter and Taylor suggested that thermosensitivities on the face showed stronger than forearm, thigh, leg and foot and 2–5 times more sensitive than any other body segments for both sudomotor and discomfort responses21), suggesting that whole-body thermal perceptions would be related with that on the face stronger than the other segments of the body. In the present study, whole-body thermal sensation and comfort highly correlated with forehead and cheek, while reflecting the perceptions from the other segments simultaneously, as shown in Results.
Limitations
The increase in Tes from Rest1 to i1 in W is transient and explained by a change in re-distribution of body temperature from skin to core; i.e. known physiological phenomenon, it may be mediated by cutaneous vasoconstriction. As shown by Young et al.12), when subjects performed a cold air stress test, which was consisted of resting 30 min in a comfortable environment [24°C, 30% RH] followed by 90 min in cold air (5°C; 30% RH), core temperature increased by 0.3°C for the first 30 min and then was similar and decreased by 0.3°C from the baseline before cold air stress in non-cold acclimated and cold acclimated subjects, respectively. The condition is quite similar to that in the present study; going outside at most 7°C of Ta after moving from the chamber controlled at 28°C. Furthermore, skin-surface cooling could cause abrupt decreases in SSNA, skin blood flow and SR in hyperthermic subjects up to 5 s before marked decreases in core or skin temperatures22). Skin cooling are easy to induce cutaneous vasoconstriction.
The work load adopted in the present study was probably less than that of real work situations. In addition, the workers usually take many packages into a cargo in a distribution station before driving. However, changes in thermal comfort observed in the present study were different between summer and winter. We believe that the observed changes are important and expect that the worsening comfort may be greater in real life than in the present study.
We did not assess a peak oxygen consumption rate in subjects, because walking velocity and weight of the plate were fixed as above mentioned. Because thermal sensation during walking in a hot was easily influenced by physical fitness23), physical fitness level would be significant factor to explain the present result.
In conclusion, our results demonstrated that worsening thermal comfort, represented by subjective scales, in summer was observed simultaneously with a loss of body fluid as well as increased core temperature during the simulation. Adequate hydration through ample fluid replacement may be encouraged to protect workers from health injuries and maintain work efficiency especially in summer.
Conflict of Interest
The authors declare no conflict of interest.
Acknowledgments
This study was sponsored by funds from Isuzu Motors Limited, Fujisawa, Japan.
References
- 1.The Ministry of Land, Infrastructure, Transport and Tourism in Japan. 2016. www.mlit.go.jp/report/press/jidosha04_hh_000136.html. Accessed July 28, 2017 (in Japanese).
- 2.The Ministry of Land, Infrastructure, Transport and Tourism in Japan. 2015. www.mlit.go.jp/common/001106424.pdf. Accessed June 5, 2015 (in Japanese).
- 3.Schlader ZJ, Stannard SR, Mündel T. (2010) Human thermoregulatory behavior during rest and exercise—a prospective review. Physiol Behav 99, 269–75. [DOI] [PubMed] [Google Scholar]
- 4.Mower GD. (1976) Perceived intensity of peripheral thermal stimuli is independent of internal body temperature. J Comp Physiol Psychol 90, 1152–5. [DOI] [PubMed] [Google Scholar]
- 5.Cabanac M. (1971) Physiological role of pleasure. Science 173, 1103–7. [DOI] [PubMed] [Google Scholar]
- 6.Jacquot CM, Schellen L, Kingma BR, van Baak MA, van Marken Lichtenbelt WD. (2014) Influence of thermophysiology on thermal behavior: the essentials of categorization. Physiol Behav 128, 180–7. [DOI] [PubMed] [Google Scholar]
- 7.Gagge AP, Stolwijk JA, Saltin B. (1969) Comfort and thermal sensations and associated physiological responses during exercise at various ambient temperatures. Environ Res 2, 209–29. [DOI] [PubMed] [Google Scholar]
- 8.Kamijo Y, Nose H. (2006) Heat illness during working and preventive considerations from body fluid homeostasis. Ind Health 44, 345–58. [DOI] [PubMed] [Google Scholar]
- 9.Sawada S. (2009) Risk management of cold working environment. Occup Health J 32, 31–8. [Google Scholar]
- 10.Moyen NE, Ganio MS, Wiersma LD, Kavouras SA, Gray M, McDermott BP, Adams JD, Binns AP, Judelson DA, McKenzie AL, Johnson EC, Muñoz CX, Kunces LJ, Armstrong LE. (2015) Hydration status affects mood state and pain sensation during ultra-endurance cycling. J Sports Sci 33, 1962–9. [DOI] [PubMed] [Google Scholar]
- 11.Rothstein A, Towbin EJ .(1947) Blood circulation and temperature of men dehydrating in the heat. In: Physiology of man in the desert, Adolf EF (Eds.), 172–196, Interscience Publishers, New York. [Google Scholar]
- 12.Young AJ, Muza SR, Sawka MN, Gonzalez RR, Pandolf KB. (1986) Human thermoregulatory responses to cold air are altered by repeated cold water immersion. J Appl Physiol 1985 60, 1542–8. [DOI] [PubMed] [Google Scholar]
- 13.Choi JK, Miki K, Sagawa S, Shiraki K. (1997) Evaluation of mean skin temperature formulas by infrared thermography. Int J Biometeorol 41, 68–75. [DOI] [PubMed] [Google Scholar]
- 14.Gagge AP, Gonzalez RR .(1996) Mechanisms of heat exchange: biophysics and physiology. In: Handbook of Physiology. Environmental Physiology Vol I, Fregly MJ and Blatteis CM (Eds.), 45–84, Oxford University Press, New York. [Google Scholar]
- 15.Sawka MN, Cheuvront SN, Kenefick RW. (2015) Hypohydration and human performance: impact of environment and physiological mechanisms. Sports Med 45 Suppl 1, S51–60. [DOI] [PMC free article] [PubMed] [Google Scholar]
- 16.Tokizawa K, Yasuhara S, Nakamura M, Uchida Y, Crawshaw LI, Nagashima K. (2010) Mild hypohydration induced by exercise in the heat attenuates autonomic thermoregulatory responses to the heat, but not thermal pleasantness in humans. Physiol Behav 100, 340–5. [DOI] [PubMed] [Google Scholar]
- 17.Tokizawa K, Matsuda-Nakamura M, Tanaka Y, Uchida Y, Lin CH, Nagashima K. (2016) Influence of osmotic stress on thermal perception and thermoregulation in heat is different between sedentary and trained men. Physiol Behav 161, 66–73. [DOI] [PubMed] [Google Scholar]
- 18.Kamijo Y, Okumoto T, Takeno Y, Okazaki K, Inaki M, Masuki S, Nose H. (2005) Transient cutaneous vasodilatation and hypotension after drinking in dehydrated and exercising men. J Physiol 568, 689–98. [DOI] [PMC free article] [PubMed] [Google Scholar]
- 19.Oppliger RA, Magnes SA, Popowski LA, Gisolfi CV. (2005) Accuracy of urine specific gravity and osmolality as indicators of hydration status. Int J Sport Nutr Exerc Metab 15, 236–51. [DOI] [PubMed] [Google Scholar]
- 20.Koide N, Ishigara M. (1961) The water absorbency and absorption mechanism in underwear fabrics. Kaseigaku Zasshi 12, 46–51. [Google Scholar]
- 21.Cotter JD, Taylor NA. (2005) The distribution of cutaneous sudomotor and alliesthesial thermosensitivity in mildly heat-stressed humans: an open-loop approach. J Physiol 565, 335–45. [DOI] [PMC free article] [PubMed] [Google Scholar]
- 22.Wilson TE, Cui J, Crandall CG. (2001) Absence of arterial baroreflex modulation of skin sympathetic activity and sweat rate during whole-body heating in humans. J Physiol 536, 615–23. [DOI] [PMC free article] [PubMed] [Google Scholar]
- 23.Tikuisis P, McLellan TM, Selkirk G. (2002) Perceptual versus physiological heat strain during exercise-heat stress. Med Sci Sports Exerc 34, 1454–61. [DOI] [PubMed] [Google Scholar]


