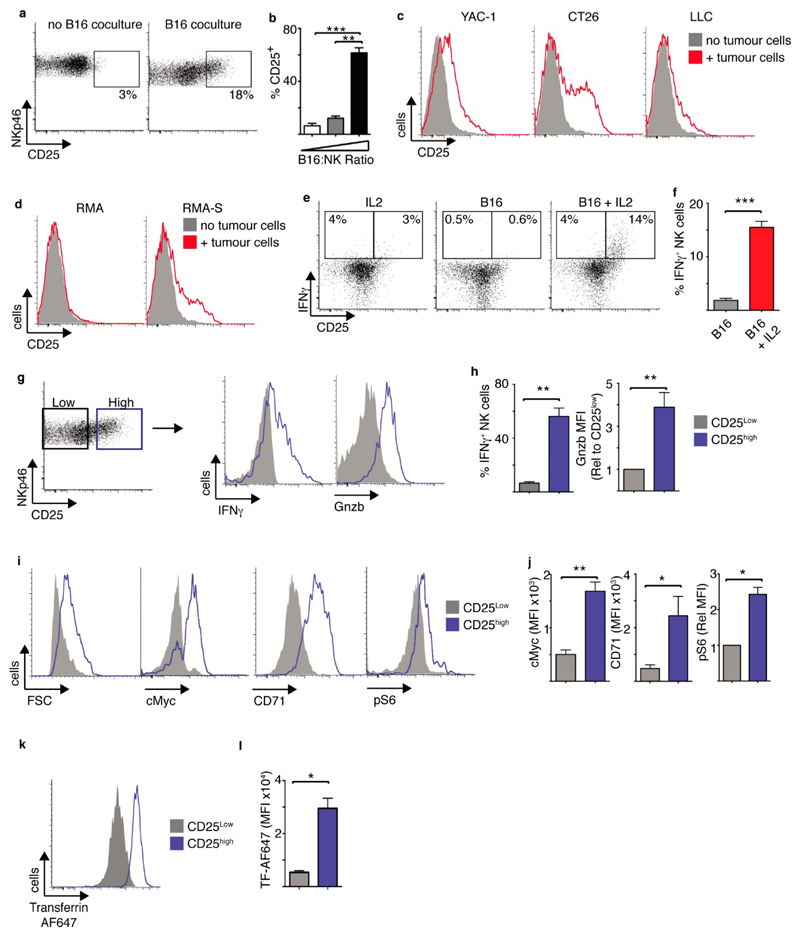
Figure 1. Tumour interactions induce CD25high NK cells with heightened metabolism and effector function.
(a–d) Cultured NK cells (6 days in IL15 10 ng/mL) were purified and then co-cultured with or without B16 melanoma cells at an E:T ratio of 2:1 (a), with B16 melanoma cells at an E:T ratio of 4:1, 2:1 or 1:2 (b), with or without YAC-1, CT26 and LLC tumour cells at an E:T ratio of 1:4 (c), or with or without RMA/RMA-S cells at an E:T ratio of 1:4 (d) for 18 h before analysis of CD25 expression by flow cytometry. (e–k) Cultured NK cells (6 days in IL15 10 ng/mL) were purified and then co-cultured with B16 melanoma cells for 18 h at an E:T ratio of 2:1, washed and put back into culture with IL15 (7.5 ng/mL) with or without ± IL2 (20 ng/mL) for 18 h before analysis by flow cytometry. (e) IFNγ production by CD25high and CD25neg NK cells cultured in IL2 alone, with B16 cells or with B16 cells plus IL2. (f) IFNγ production in CD25high NK cells cultured with B16 ± IL2. (g,h) Analysis of NK cells cultured with B16 cells + IL2 comparing CD25high and CD25neg NK cells (g, left panel) for effector functions, IFNγ production and granzyme (Gnzb) B expression. (i,j) Analysis of cell size (FSC), cMyc and CD71 expression, and levels of phosphorylated S6 ribosomal protein (pS6) in CD25high and CD25neg NK cells from B16 cells + IL2 co-cultures. (k,l) Rates of fluorescent transferrin uptake were measured in CD25high and CD25neg NK cells from B16 cells + IL2 co-cultures. Data is representative (a,c,d,e,g,i,k) or mean ± SEM (b,f,h,j,l) of 3–5 independent experiments. Data was analyzed using a paired students t-test. (* p < 0.05, ** p < 0.01, *** p < 0.001).

